Implementation and Transfer of Predictive Analytics for Smart Maintenance: A Case Study
 Sebastian von Enzberg
 Athanasios Naskos
 Ifigeneia Metaxa2
 - 1Research Department Product Engineering, Fraunhofer Institute for Mechatronic Systems Design, Paderborn, Germany
- 2ATLANTIS Engineering SA, Thessaloniki, Greece
- 3BENTELER Automobiltechnik GmbH, Paderborn, Germany
Smart maintenance offers a promising potential to increase efficiency of the maintenance process, leading to a reduction of machine downtime and thus an overall productivity increase in industrial manufacturing. By applying fault detection and prediction algorithms to machine and sensor data, maintenance measures (i.e., planning of human resources, materials and spare parts) can be better planned and thus machine stoppage can be prevented. While many examples of Predictive Maintenance (PdM) have been proven successful and commercial solutions are offered by machine and part manufacturers, wide-spread implementation of Smart Maintenance solutions and processes in industrial production is still not observed. In this work, we present a case study motivated by a typical maintenance activity in an industrial plant. The paper focuses on the crucial aspects of each phase of the PdM implementation and deployment process, toward the holistic integration of the solution within a company. A concept is derived for the model transfer to a different factory. This is illustrated by practical examples from a lighthouse factory within the BOOST 4.0 project. The quantitative impact of the deployed solutions is described. Based on empirical results, best practices are derived in the domain and data understanding, the implementation, integration and model transfer phases.
1. Introduction
1.1. Process Models for Implementation of Predictive Maintenance
A range of process models describe the software development and implementation process. A widely used process model for the domain of data analytics is the cross-industry standard process for data mining (CRISP-DM, Shearer, 2000). It describes an iterative process starting with domain and data understanding, data preparation, modeling, evaluation, and deployment. It has already been subjected to adaptions and advancement, especially in the context of Industrial Data Science, e.g., by (Reinhart, 2016).
When implementing Predictive Maintenance (PdM) solutions, an important consideration is the overall use case context in which data analytics is integrated. For example, the fault prediction of an electric engine is embedded into a manufacturing process where the electric engine serves a certain function (e.g., driving a belt for transport of material), the malfunction is accompanied by effects (e.g., stop of material transport), as well as consecutive maintenance processes (e.g., repair of the engine). While this may be covered by the domain understanding, an explicit use case analysis and definition phase is necessary for a benefit- and business-driven selection of a use case and its further development. In addition to the original deployment of a PdM solution, a transfer to similar scenarios and other plants is desired (e.g., fault prediction for the engines of other transport belts).
Figure 1 summarizes our proposed overall business-driven process for the implementation of predictive analytics. It can be divided into three main phases: Use Case Analysis, Proof of Concept, and Deployment. Next to the process-oriented view, the implementation can be divided into four interdisciplinary, functional layers of data analytics according to Kühn et al. (2018). It offers different views of the implementation process, covering the Use Case, Data Analytics, Data Pools, and Data Sources view. The process steps are integrated into the layer model in Figure 2.
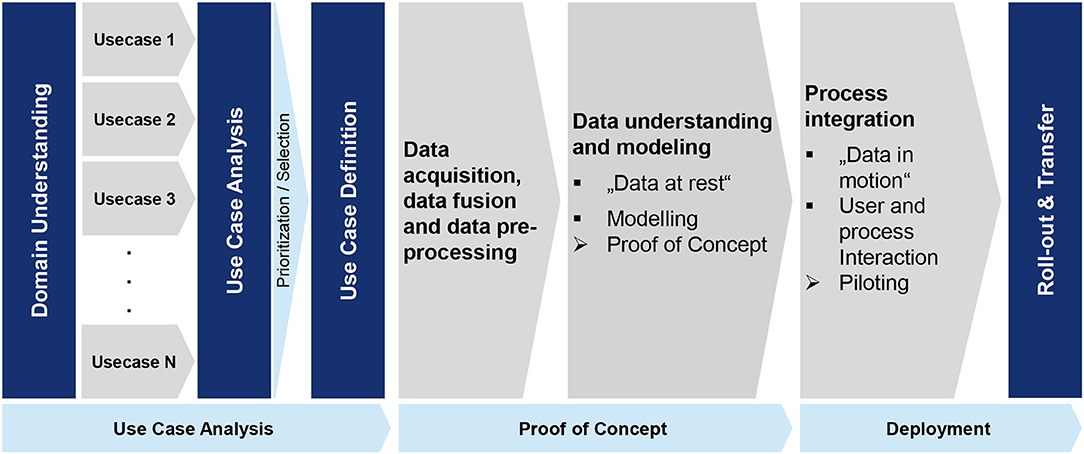
Figure 1. Overall process for the implementation of predictive analytics.
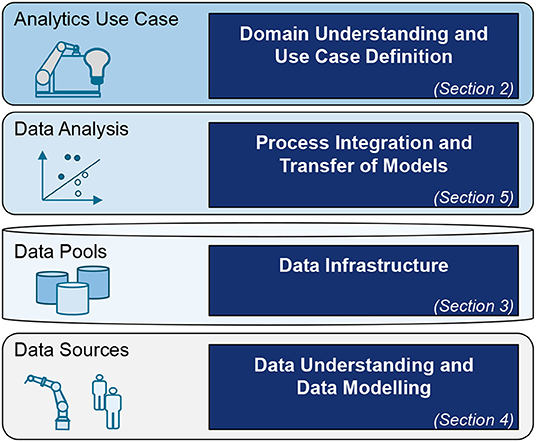
Figure 2. Integration of process steps into the layer model for development of data analytics applications and overview of the best practice contributions in this paper.
In this article, we analyze the PdM implementation process with a strong real-world application and business-oriented focus. This process originates from the implementation experiences of the lighthouse factory of BENTELER Automotive within the BOOST 4.0—Big Data for Factories project. The BOOST 4.0 project is an EU-funded Innovation Action aiming to improve the competitiveness of the European manufacturing industry, to introduce Industry 4.0 technologies and to provide the necessary tools for obtaining the maximum benefit of Big Data.
We have gathered and grouped the best practices derived from the followed process. It should be mentioned that our goal is to take advantage of these observations, in our effort to bridge the gap between research work and industrial application.
The article is divided into four main sections, covering the domain understanding and use case definition (section 2), data infrastructure (section 3), data understanding and modeling (section 4), as well as the process integration and transfer of models (section 5). We summarize the best practices and conclude our observations in sections 6 and 7, respectively.
1.2. State of the Art
In recent years, technologies for big data management and processing as well as algorithms for fault and anomaly detection have matured to allow industry-grade application of smart maintenance. While smart maintenance features are offered by individual component providers of production systems, widespread adoption of smart maintenance in manufacturing is still limited. Many companies cannot identify good business cases. High initial investments, as well as insufficient availability of mature or ready-to-use solutions, keep companies from the holistic integration of smart maintenance within the company. A stream-lined implementation and deployment process, along with easily transferable prediction models are key to the wide-spread application of smart maintenance within a company. It allows the transfer of a solution to different factories or different parts of a company, or even to other companies with similar settings.
The two-part study by Bokrantz et al. (2020b) and Bokrantz et al. (2020a) acknowledges the lack of empirically driven, conceptual work for smart maintenance. By means of an empirical study, it conceptualizes four main smart maintenance dimensions: data-driven decision making, human capital resources, internal integration and external integration. The conceptual framework offered by Zheng et al. (2018) ranges from sensors, data collection, and analytics to decision making. These framework dimensions are viewed in context of real-world scenarios, naming it as an important research aspect in Industry 4.0. It does not offer a specific guidance for smart maintenance.
Moens et al. (2020) offer an Industrial Internet of Things (IIoT) framework, in which smart maintenance solutions are embedded. They expose robustness and scalability of solutions as well as the availability of well-trained machine learning models for fault recognition as major challenges to be addressed. Bumblauskas et al. (2017) describe a decision support system as a smart maintenance framework. It is based on corporate big data analytics with integrated anomaly and fault detection methods. In Uhlmann et al. (2019), the process integration aspect of smart maintenance is focused. The authors propose an assistance systems, which helps to embed smart maintenance solutions integrally into service processes.
In summary, a range of recent work has focused on concepts for implementation of smart maintenance, rather than entirely technically-driven work. Dimensions that need to be addressed range from sensor data, data infrastructure to analytics and process integration of smart maintenance.
2. Domain Understanding and Use Case Definition
The practical examples presented in this work are obtained from real industrial use cases of the BENTELER automotive lighthouse factory of the BOOST4.0 project. BENTELER produces and distributes safety-relevant products, serving customers in automotive technology, the energy sector and mechanical engineering. The production of such plants employs complex machinery to a large extent with several mechanical and hydraulic systems, which entail frequent and/or periodic maintenance. A thorough understanding of the problem domain is precondition to defining valuable use cases, data understanding and successful modeling and process integration. These steps are detailed in the following paragraphs.
2.1. Domain Understanding
The understanding of the application domain is of equal importance as the development of the actual smart maintenance solution. The domain and business understanding is a multi-phase iterative process, comprised by interviews with the maintenance engineers, interviews with the industrial IT and automation experts and knowledge transfer.
Initially, organizing interviews with the domain experts, i.e., maintenance engineers, is a necessary prerequisite in order to understand the underlying systems and behavior of signals, which are later considered in data cleaning, data pre-processing and algorithm development. Semi-formalized methods such as CONSENS (Conceptual Design Specification Technique for the Engineering of Complex Systems, Gausemeier et al., 2009) have been used in our use cases, giving effective structure diagrams for the machinery under consideration. For the use case of the scrap belt, an example of the effective structure of the scrap belt is given in Figure 3.
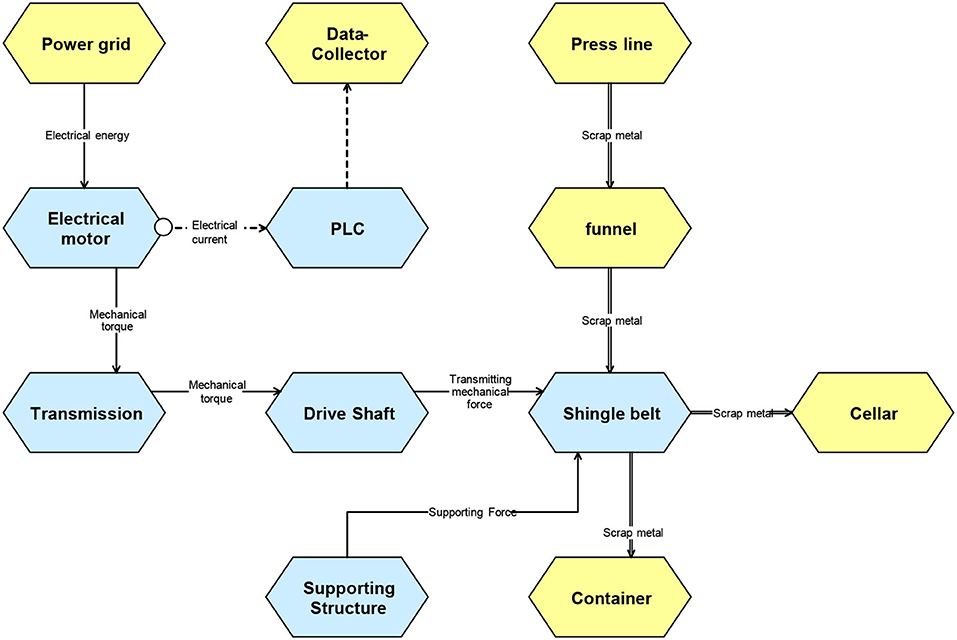
Figure 3. Structure of the scrap belt.
Understanding of Data and Infrastructure has been accomplished via interviews with industrial IT and industrial automation experts, as a necessary prerequisite in order to understand details of data collection, which directly affect data properties. This includes knowledge about data collection at OPC-UA level from industrial automation experts, which affects e.g., naming of measurements, timing of acquisition, etc. Also, knowledge from industrial IT experts allows a better understanding of data transfer to databases and resulting effects, e.g., generation and synchronization time stamps, data quantization. This information is important for correct selection and parameterization of algorithms for data pre-processing and filtering. Insights from data understanding and data preparation have been fed back to the domain and business understanding in weekly meetings with maintenance and IT experts.
In various workshops and online conferences, the domain, business and data understanding has been transferred between the end users and the technology providers. For the technology providers, a profound technical understanding of the production line at BENTELER is essential to allow goal-driven algorithm development. This is accelerated by proper documentation of domain understanding. The effective structure as shown in Figure 3, allows for successful transfer of domain and business know-how. For example, an observation of a maintenance incident is unambiguously assigned to a system component (red dot in Figure 3). Root Causes can be traced within the system and relevant data sources can be identified and located (white dot Figure 3). Preliminary algorithm results can be interpreted directly during their development, leading to quicker iterations. However, regular feedback from domain experts is still necessary. Weekly meetings of the core partners have allowed for continuous identification of bottlenecks in the knowledge transfer process.
2.2. Use Case Selection and Definition
In order for a Smart Maintenance solution to be evaluated and, if suitable, adopted in production line to the optimal degree, the costs and benefits need to be considered. The baseline cost is composed by the installation and operation of the IT infrastructure (hardware and software for Big Data storage and processing). This represents a significant investment, which also facilitates a wide range of possible subsequent benefits, it is thus a mostly strategic decision. Operative decision-making focuses cost-benefit considerations on a use case basis. The necessary steps are use case identification, use case selection and use case definition.
For use case identification, we propose a workshop-based approach with domain experts, that can be held in conjunction with the collection of domain understanding. A high-level overview of the systems is used as a guide for the identification process. This can be a schematic, floor-plan or domain-specific descriptions as wiring diagrams or hydraulic plans. The effective structure as shown in Figure 3 is useful, as it can be easily understood by various stake holders. In Figure 4, we show how two possible use cases for data analytics, the prediction of spikes in motor current and the correlation of machine outage and product number, are identified alongside the effective structure. Additionally, details about the use cases can be directly recorded on a plot (e.g., typical failures and failure propagation, are marked in red on Figure 4). Other systematic approaches can also be exploited for use case identification, e.g., Failure Mode and Effects Analysis (FMEA).
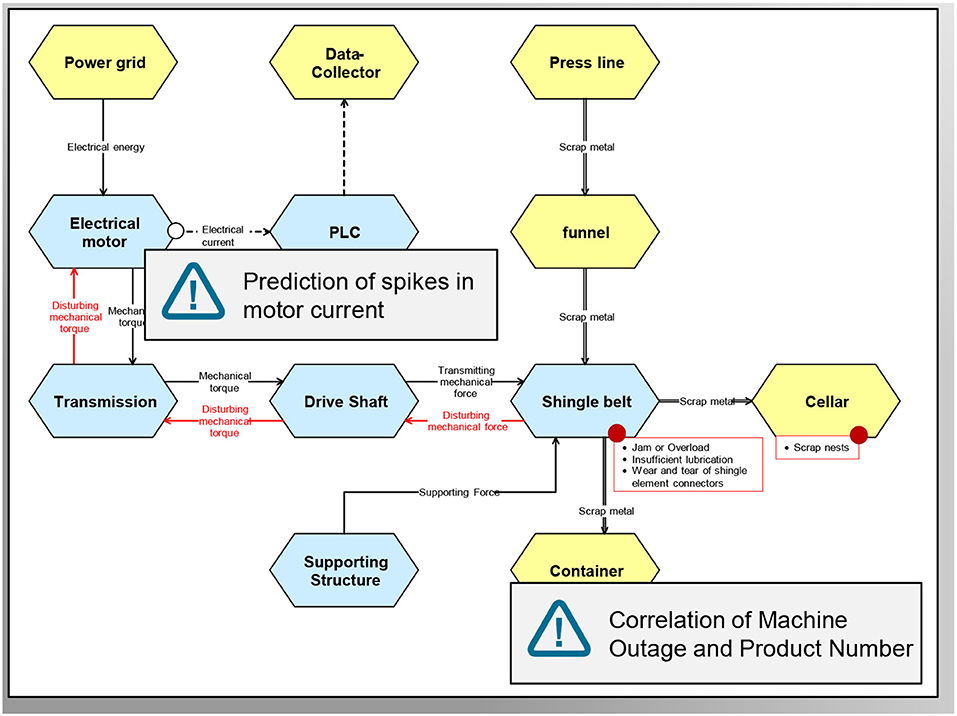
Figure 4. Identification of Use Cases along the machine structure.
The use case selection is based on a qualitative assessment of use cases. For each identified use case, two dimensions are considered: strategic value and possible benefit and simplicity of implementation and realization. As shown in Figure 5, this allows a simple overview and selection of most relevant use cases. The two use cases “oil leakage at hydraulic press” and “outage of scrap belt” have been identified for the BENTELER automotive lighthouse factory, as they rank high in both observed dimensions. Furthermore, a clustering allows the identification of neighboring use cases that be considered subsequently. In the example shown, a Machine-Health-Index is an overarching application scenario for several use cases.
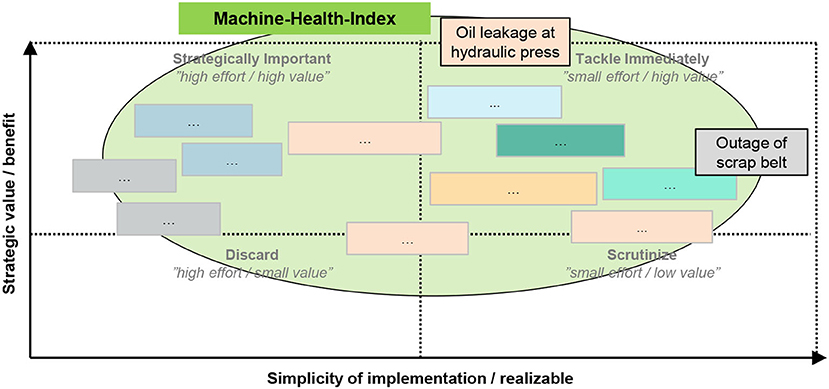
Figure 5. Selection of Use Cases with a portfolio. Colored boxes represent Use Cases (partly anonymized), where similar colors represent logic groups of Use Cases. Additionally, clusters can be found (e.g., all Use Cases contribute to “Machine-Health-index,” marked green). The two example Use Cases “oil leakage at hydraulic press” and “outage of scrap belt” are located in the upper right quadrant, thus being most simple to implement, yet yielding most benefit.
Lastly, in the use case definition a more detailed but concise description is created, which allows the definition of the subject for further planning or a quantitative cost-benefit calculation. This work focuses on two practical use cases dealing with the hydraulic system of press and a conveyor belt moving scrap produced by presses. This step by step process has been adopted, in order to provide of a Proof of Value (POV) approach, which is necessary before considering an overarching Smart Maintenance solution, spanning more machines and failures of production lines.
2.2.1. The Scrap Belt Use Case
The scrap belt is connected to several lines and runs underground the BENTELER factory hall. Any scrap metal accumulated during the production process is placed onto the scrap belt. Scrap metal parts are then transported from the production line to a scrap metal container, and then to recycling. The proper functionality of the scrap belt is crucial to production, since a halt of the scrap belt means a potential halt of several production lines.
The focus of our study is to early detect pile-up of scrap metal and, thus, allow for time to take counter-measures in order to prevent a halt of the scrap metal belt. Even in the case of a complete halt, maintenance can be triggered much faster due to the continuous condition monitoring. In addition, diagnostic algorithms can provide maintenance or repair advice, suggesting possible causes of the failure. This significantly limits the manual fault diagnosis in the underground tunnel and allows a faster restoring of the regular belt functionality.
2.2.2. The Hydraulic Press Use Case
The hydraulic press use case is a complex hot forming line consisting of five consecutive process steps as presented in Figure 6. Its main task is the stamping of a sheet metal into a three-dimensional shape. The metal is heated before stamping and rapidly cooled down during stamping. This causes the material to be hardened, which is important for structural components for the automobile industry.

Figure 6. Hot forming press process step.
Our study focuses on the early detection of oil leakage occurrences. Despite the fact that, typically, oil is mostly stored in large tanks equipped with oil level sensors, oil leakage detection is a challenging problem due to the continuous movement of oil across the machinery equipment parts. Such movement results in frequent increases and decreases of oil level. Therefore, and somehow counter-intuitively, simply monitoring the oil level is not adequate to provide concrete evidence about oil leakage.
This business process is heavily affected by the installment of predictive and smart maintenance processes. The main objective of smart maintenance algorithms is the detection (condition monitoring) and prediction of oil leakages. Based on our results, maintenance processes can be triggered much faster or even in advance. Maintenance and repair activities can be planned more efficiently, and manual diagnosis is prevented.
2.3. Best Practices
It has been verified by the current work that domain understanding is important in order to build goal driven solutions. Interviews with domain experts (i.e., maintenance engineers, industrial IT, automation experts) are the most direct means for knowledge transfer. Semi-formalized methods like CONSENS assist the knowledge transfer process providing visualizations (effective structure diagrams) of the machinery.
The utilization of reactive (i.e., fault detection) and proactive (i.e., failure prediction) monitoring approaches can potentially increase the speed of reaction to crucial maintenance issues, enabling the prescriptive maintenance in which the maintenance and repair activities can be planned a priory.
3. Data Infrastructure
Efficient data handling is a crucial factor on the application of the smart maintenance approaches and on the model and knowledge transfer processes. The amount of sensor and production data produced on the BENTELER plants on daily basis is of the size of Big Data. In order to allow the analysis of this massive amount of data BENTELER is deploying a common policy of data handling for all distinct plants.
Each plant has a local time series database infrastructure, where through OPC-UA and other proprietary tools and protocols, all the produced data are persisted. For the development and testing of new smart maintenance solutions, BENTELER has created a remotely hosted cluster infrastructure, orchestrated by a containerized applications management software, called Developers Space. On this containerized infrastructure, the data of each distinct BENTELER plant can be mirrored on a local time series database, Figure 7, using an advanced distributed data streaming platform.
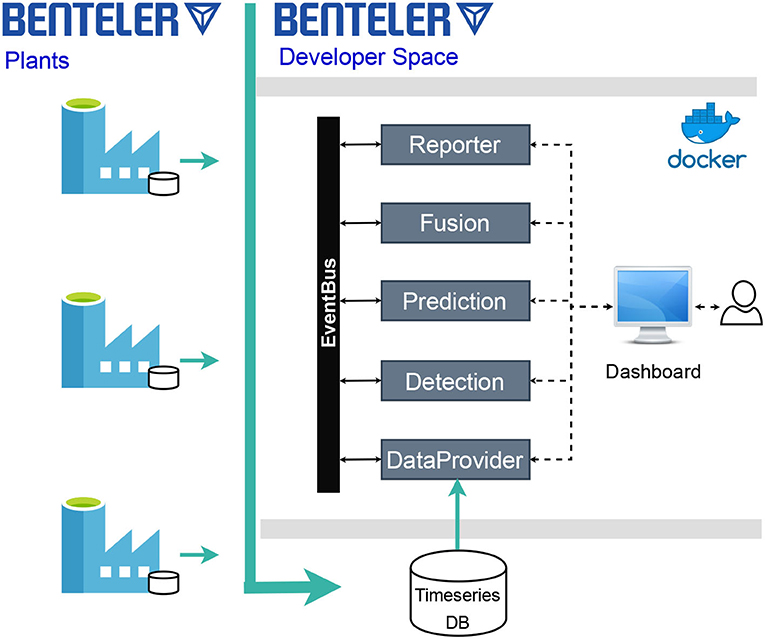
Figure 7. BENTELER data infrastructure for smart maintenance.
Deploying a smart maintenance solution in the Developers Space virtually deploys the same solution in all the connected with the Developers Space plants. If the deployed solution satisfies specific quality and performance aspects it can either remain deployed in the Developers Space, or if it is necessary it can be deployed on a local containerized infrastructure in one of the plants, in order to place the solutions closer to the use case that it monitors.
The components of our smart maintenance platform as deployed in the Developers Space are presented in Figure 7. The platform uses a micro-service architecture, where all the micro-services communicate with each other through a common event bus. A Dashboard allows the user to instantiate the services and to visualize the results. The main components of the platform are:
• DataProvider: Responsible to communicate with the time series database in order to fetch the latest sensorial data.
• Detection: A Fault Detection service to detect anomalies is the sensor measurements.
• Prediction: A Failure Prediction service to predict prominent failures based on the current sensor measurements.
• Fusion: Responsible to combine the output from multiple either Detection or Prediction services into a single result based on a pre-specified strategy.
• Reporter: Reports the results of the data analytics services, for further processing and visualization.
The utilized micro-service architecture enables the distributed deployment of the platform into decoupled entities, which are developed and evolve independently to each other providing a flexible smart maintenance solution.
3.1. Best Practices
A central data infrastructure, as the one presented in this section (i.e., Developers Space), enables the faster testing of prototypes in a wider range of use cases. After the successful evaluation phase in the sandboxed environment, the application may be moved closer to the application scenario using fog computing and edge devices in order to achieve faster data transfer for critical cases. If the requirement for instant data transfer is relaxed, then the application may continue being deployed in the central infrastructure facilitating its maintenance.
A containerized environment in the central infrastructure assists the deployment of multiple solutions utilizing the minimum hardware resources. Another advantage is that if a solution tested to work in the central data infrastructure like in our case, it is also going to work on premises in other BENTELER plants in containerized environments.
The micro-service architecture of the software solution is the most appropriate for containerized environments, as it allows the distribution of the work among different containers providing the same functionality. Critical parts of the software solution that demand instant data transfer rates can be deployed on premises in fog nodes (i.e., node of fog computing), while the software components that need more computation resources and allow more relaxed data transfer rates can be deployed in a remote location like the Developers Space.
4. Data Understanding and Modeling
4.1. Data Inventory and Semantics
In industrial applications, availability of data is a concern. Data may be produced within old machinery or legacy system. In industrial manufacturing, a numerous range of heterogeneous data sources and IT systems of different types can be found, spanning various areas and processes along the enterprise. Commonly, machine data is collected from programmable logic controllers (PLC). However additional measurements can be added by retrofitting sensors to existing systems. Various control systems can be in place that facilitate acquisition of machine data, known as SCADA systems (supervisory control and data acquisition). A various range of protocols, e.g., OPC/UA or MQTT, are common in industrial automation and can be operated in parallel for several subsystems of one plant. Higher order systems also collect or provide relevant machine and process data, e.g., MES (manufacturing execution systems), ERP (enterprise resource planning), or CAQ systems (computer aided quality).
When planning a smart maintenance solution, it is necessary to get an overview of various data sources and systems within production, their availability and context. References to data sources can be made on different levels:
• Reference to availability within data infrastructure
• Reference to the machine function and operation
• Reference to the manufacturing and maintenance process.
The main purpose of a data inventory is to identify relevant data sources within the production and maintenance context. It is a prerequisite to integrate data sources and to make them available for smart maintenance solutions. A data inventory is built by interviewing stakeholders relevant to producing data (e.g., automation experts, production planners, shift leaders, maintenance experts) and using existing documentation.
The structure models built within the domain understanding can be enhanced by adding references to data sources. In Figure 4, circles denote points of measurement at system elements. By back-tracing possible failures through the energy or information flow within the system (red arrows in Figure 4), signals can be found that are possible indicators for impeding failure (red circles in Figure 4). This gives data scientists important information about the data points and their relation to a machine function and operation and is also used for the design of models for smartmaintenance.
Within a data map as described by Joppen et al. (2019), the identified data sources are shown in context of the manufacturing and maintenance processes. The interconnection of data sources, as well as data flows between IT systems and production resources are given. The data map is based on the data inventory and gives context to the process information collected during domain understanding. It aids the project team and especially data scientists with the overall design of a smart maintenance solution and its embedding into the maintenance process from a use case point of view. We have enhanced the data map (Joppen et al., 2019) by improving the visibility of data flow in various data bases and IT systems. An example of our proposed enhanced data map is given in Figure 8, where the information is given in three lanes. The top lane shows a simplified view of production and maintenance process steps. In the middle lane, documents and databases are visualized that affect each process step. Documents and databases are structured by IT-Systems (colored rows). The bottom lane lists the data sources by their identifiers underneath the respective document or database. In the middle and lower lane, lines are used to visualize data flows.
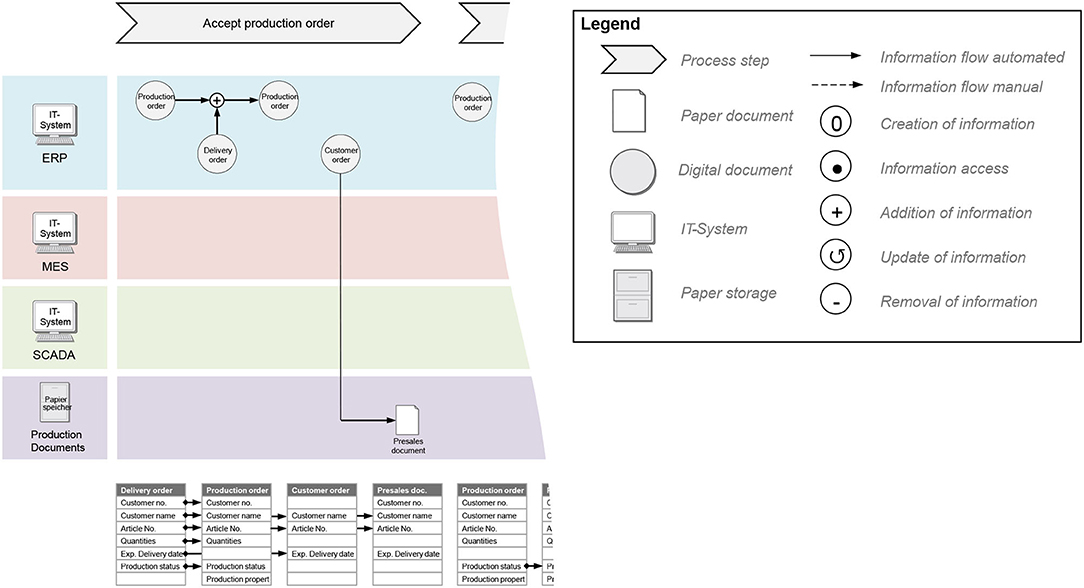
Figure 8. Data Map for the visualization of data sources and data flow along the manufacturing process.
The above-mentioned models for data inventory, structure models, and data map, are used for informal or semi-formal information gathering. They are informal means for semantic data modeling. The main intention is to enable the communication between different stakeholders in the manufacturing and maintenance domain, automation, IT systems, management and data analysts. The utilization of expert's knowledge is an important factor to implement efficient solutions, as it broadens the understanding of the analysts for the mechanical equipment of interest. These methods are assisting the knowledge transfer and, thus, the design of smart maintenance solutions from data and machine learning models to use case design.
Semantic data models also support the transfer to other plants. The equipment and the production process might differ between plants. However, the type of the machines used in the shop-floor in most of the cases is common, as the context of the production is the same (i.e., automotive parts). In addition to the informal and semi-formal models, formal semantic data models based on ontologies can be built. Especially in the case of common context, e.g., hot/cold-forming presses, scrap-belts, this semantic model can be a common dictionary of ontologies, offered to semantically describe each aspect of the production of each distinct plant, applying a uniform approach. Deploying smart maintenance solutions developed to process the data based on their semantics, increases the agility and the portability of the deployment, ameliorating multiple model transfer issues. Formal semantic models are also an important step toward automated setup and adaption of smart maintenance models, since they allow to overcome the problems of heterogeneous, unstructured data sources by giving context. However, the increased degree of formalization comes with an increased effort for building the respective semantic model. Hence, the semantic model and its degree of formalization (e.g., basic data inventory vs. a fully modeled ontology) should be decided based on cost and benefit considerations. Strategic arguments should be also considered, since a semantic model is also relevant in the context of building a digital twin of the production, which offers application scenarios and benefits.
4.2. Data Understanding
Data understanding is required in order to build detailed data models tailored to each specific use case. In BENTELER case, we have applied two monitoring approaches, a failure prediction and a fault detection one. For the current analysis, the difference between failures and faults is that, the former are serious equipment malfunctions that stop the production potentially for several hours, while the latter can cause minor deviations from the normal behavior for the equipment that usually affect the quality of the end product and might lead to a failure.
Both monitoring approaches are applied on preprocessed data in order to filter out noisy values usually encountered at the beginning or at the end of the production batches, or during idle periods of the equipment (e.g., applying maintenance actions, replacing specific equipment artifacts for the production of the next batch), or idle periods caused by bottlenecks in the production chain. A characteristic example is the scrap-belt use case, where the electrical current of the motors moving the belt is instantly increased in abnormal levels on every cold start and it drops to zero when the belt is not moving.
There are also monitoring policies that apply on the idle state of the equipment that consider the values obtained during the normal functionality as noise. An example is the monitoring of the hydraulic oil level of the hot-forming press use case. The oil tank of the hydraulic system is attached on the press, hence during the normal functionality of the press there are serious deviations in the oil level measurement due to the movement of the stamper of the press. In this specific use case we apply two policies, one that monitors the oil level at the highest pressure applied from the press (i.e., during the production of an item) and one that monitors the oil level when the press is idle.
4.3. Data Modeling
Each distinct monitoring policy uses a different data model to identify when the press is moving or not. The failure prediction monitoring approach uses a motif detection algorithm (Yeh et al., 2017), to map sets of sensor measurements to artificial events, in order to apply algorithms for event-based prediction inspired by the aviation industry, like the one proposed in Korvesis et al. (2018). The reasoning behind the measurement to event mapping is that, before a major failure in the equipment, there might be indications in the form of repeating events (e.g., minor faults, anomaly behavior), which, if be identified early, can potentially predict the upcoming failure. These repeating events along with historical information regarding major failures, are used to train Random Forests models for failure prediction.
The fault detection approach is used to complement the prediction approach as it can be used on cold start with some basic parameterization. The detection is based on an ensemble of unsupervised monitoring approaches. As the nature of the faults (i.e., the sensor measurements footprint) might differ between different fault types, a single monitoring approach would not be enough to cover all the cases. For example, a fault might have a footprint with spikes on the measurements, hence an approach that monitors the trend of the measurements, would not be able to detect it. Our proposed fault detection approach uses (i) a distance-based outlier detection algorithm on streaming data (Georgiadis et al., 2013), to detect abnormal values (including spikes) in the measurements, (ii) a linear regression algorithm combined with lower-upper thresholds for detection based on the trend of the measurements and (iii) a simple threshold-based approach as a fail-safe mechanism if all the other approaches fail to identify a fault.
4.4. Best Practices
The semantic representation of each aspect of the production enhances the uniformity toward the model transfer goal. When deciding for the needed degree of formalization for a semantic representation, cost-benefit and strategic considerations should be considered. In the example of BENTELER, graphic system structured models have been selected in lieu of full-fledged ontology models, since it followed a more hands-on approach and straight exploitation in the design of a smart maintenance solution.
The understanding of the data based on the obtained domain knowledge is important, in order to identify the relevant data sources and to select, filter, transform and combine the most appropriate features in each use case. The latter preprocessing steps need to take place in isolation from the actual data processing for fault detection and failure prediction, in order to provide context agnostic solutions toward the utilization of the full spectrum of the capabilities that the semantic representation can offer.
5. Process Integration and Transfer
5.1. Process Integration
The data infrastructure presented in section 3, offers a containerized applications management system for the automation of the deployment and the handling of the scaling in the BENTELER Developers Space. It offers a web interface, on which developers can upload configuration files for the deployment of the docker containers. The same configuration files are used to deploy multiple containers, supporting different instances of the same micro-services, upon request, for scenarios where the availability of the service is crucial or when the incoming throughput of sensorial measurements is above the capacity of a single container. Developers also provide configuration files for deployment using the docker-compose tool outside the provided container management environment of the Developers Space, in order to support the deployment on BENTELER plants that might not communicate with the Developers Space or they do not have a local Developers Space infrastructure.
The platform offers a batch run feature, where configuration files are uploaded, containing information regarding the tasks that need to be started and their configuration. A single file can be constructed by the data scientists, either per use case, or per BENTELER plant containing multiple use cases, which includes the required information to deploy the tasks in the platform with minimum effort. For the monitoring and handling of the running tasks, the platform offers a web interface, where the user can start, stop or get details (i.e., parameterization) regarding each running task.
Figure 9 presents a process integration scenario depicting the communication between the different components in order to obtain the data, analyze them, provide the results to the maintenance engineers and receive their feedback. The figure is divided into two areas, the Developers Space and the Shop floor. We consider that the developers and the data scientists act in the Developers Space, while the maintenance engineers in the Shop floor interacting with the respective components of the system.
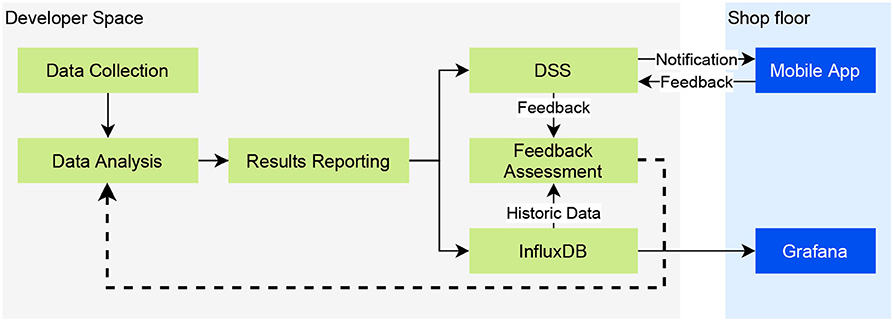
Figure 9. Process integration scenario.
The first step of the process is the Data Collection, where appropriate bridges are built to transfer the data from the Shop floor to the Data Analysis components. The data are analyzed, and the results are sent to the Results Reporting component, which is responsible for the circulation of the results. In the presented scenario the results are stored in a time series database and sent to a Decision Support System (DSS).
The smart maintenance platform encapsulates a Grafana platform1 for the visualization of the results. Grafana uses the time series database of the Developers Space as a data source, hence it can visualize both the analysis results and the persisted sensorial measurements. Multiple Grafana dashboards are provided visualizing valuable information for both the data scientists and the maintenance engineers. The data scientists can visually assess the sensitivity of the different parameterizations of the data analysis tasks, inspecting the number of reports per task, in combination with information from the maintenance logs. The maintenance engineers can set automated rules in Grafana, in order to get alerted inside the Grafana platform when a plotted measurement satisfies specific criteria, e.g., when two or more detection monitoring tasks with different parameterizations report that something is going wrong on the same sensorial input.
Apart from the Grafana dashboards, maintenance engineers are equipped with mobile devices with a notification's application installed, which directly communicates with the DSS. Whenever a data analysis result arrives in the DSS, a set of pre-defined rules is activated, in order to apply an initial assessment of the situation and, if deemed necessary, to notify the appropriate maintenance engineers. The engineers apply the final assessment and the required actions based on the provided information. A feedback mechanism is also deployed, which allows the engineers to evaluate the analysis results providing a rating and a free text comment. The rating information can be directly used for the retraining of the failure prediction models or the reconfiguration of the fault detection tasks. The provided comments can be manually processed by the data scientist in order to extract knowledge.
5.2. Transfer of Models
The aforementioned phases from domain understanding to data modeling and process integration have been described in context of a single production line in one plant. However, the solution can be transferred to similar production lines, as well as other plants, thus reducing the overall development cost for one deployed smart maintenance solution. A successful transfer requires the transfer of detection or prediction models and must consider the underlying data models, infrastructure, as well as the specifics of the use case, i.e., details about machines together with the specific production and maintenance processes at the plant under consideration.
A solution pattern combines all necessary technical components, as well as supporting documentation for deployment and application of the solution. As a reusable pattern, it facilitates the adaption and deployment on new infrastructure. It thus covers the following items of a smart maintenance solution:
• Program code or container of the implemented detection/prediction model,
• Program code or container for the visualization or dashboard,
• End-user manual for the deployed dashboard or visualization and its application within the production and maintenance process, e.g., how to handle alerts,
• Guide to parameterization of the model according to specific machines and sensors, e.g., how to set thresholds,
• Guide to technical configuration according to specific data infrastructure, e.g., local service architecture, data base schemes.
A solution pattern is preceded by a scenario description. It is a short briefing describing the scope and the requirements to the solution and allows a quick selection and decision for a fitting solution to a problem at hand. In Figure 10, the technical components, as well as documentation components constituting a solution pattern are summarized. It is important that guides and manuals are kept concise and consistent between various solutions. This reduces documentation effort during development and implementation effort during deployment at the same time.
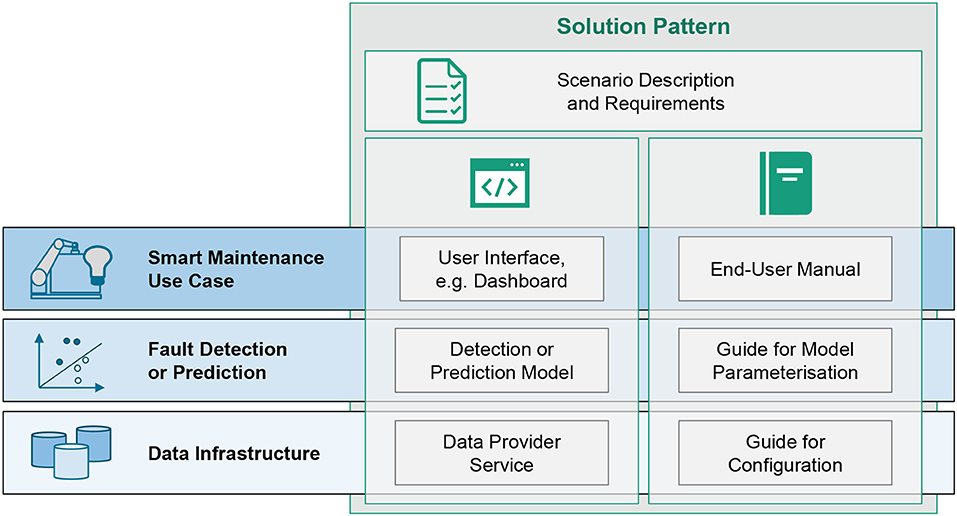
Figure 10. Components of a smart maintenance solution pattern.
The modular description of the solution pattern ensures a clear distinction between general-purpose parts of a solution and individual parts. Even if use case specific implementation may be necessary for an individual smart maintenance solution, the modular description still allows the efficient reuse of tested components of solution patterns. Overall, using pre-tested and evaluated components not only allows the transfer of functionality, but it also increases acceptance of smart maintenance among different plants and users.
In a next maturation level, an automated configuration and parameterization can be developed based on the documentation. A good data quality and the availability of formal and semantic data models based on a common vocabulary are required, in order to allow a profound automation. Automated solutions simplify the application in other plants and push toward a commoditization and servitization of smart maintenance, e.g., in the form of a smart maintenance app store.
However, most current real-world scenarios, even within a corporation like BENTELER, are characterized by individual specificities and preconditions. The development effort for unified and standardized infrastructure and/or common semantic models needs to be justified, to proceed to such an investment. The aforementioned solution patterns thus offer a good balance between individual adaption efforts and general-purpose development efforts. They are a prerequisite to fully automated deployment, and thus a practical and useful solution for most current use cases.
5.3. Best Practices
Containerization solutions facilitate the deployment of the solutions enhancing ITS transfer capability to other plants. Maintenance engineers should focus on the results of the data analysis and not on the parameterization and the configuration of the analysis. Hence, it is important to automate to the possible extend the configuration or provide a set of pre-configured tasks. Clean and user-friendly interfaces should be provided for the results presentation and visualizations provide a safe option as they clearly depict the issue and allow its tracing through the plotting of historical information. A mobile device-based notifications mechanism is also useful, to make sure that the engineers are informed on time for the detected or predicted faults.
The utilization of solution patterns, facilitates the adaption and deployment of the PdM solution on new infrastructure, by reducing the documentation and implementation effort during the development and deployment phases, respectively.
6. Empirical Results and Best Practices
This section, provides an outline of the best practices and the proposed tools and methods, presented in the previous sections. As Figure 11 depicts, the communication between the domain experts, the data scientists and the developers, is important in order to achieve the knowledge transfer for the domain understanding and the use case definition. The process can be supported by semi-formalized methods.
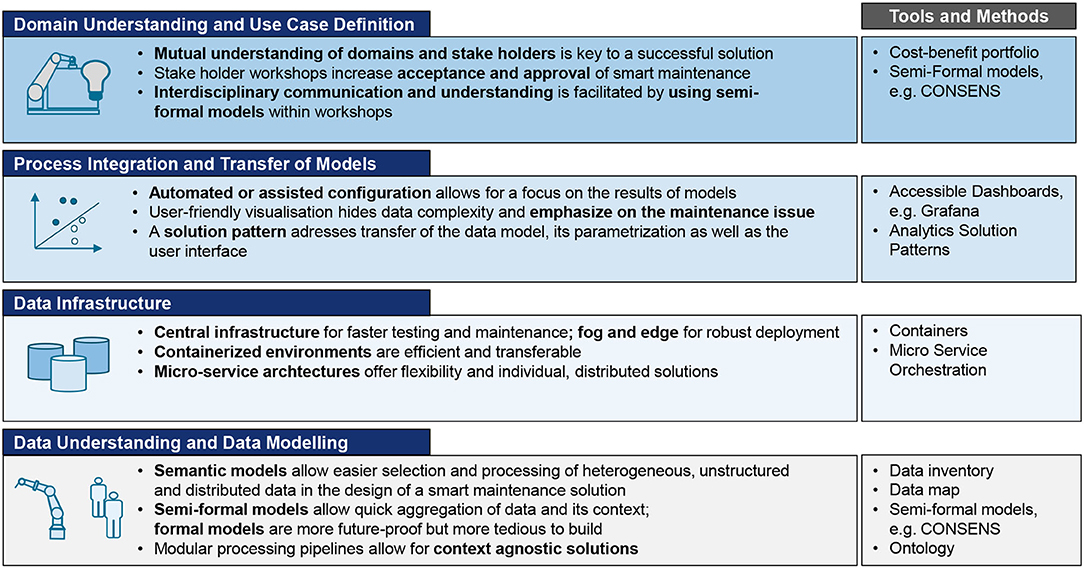
Figure 11. Summary of best practices for successful implementation and deployment of a smart maintenance solution in industrial manufacturing.
In the process integration phase, the focus should be on the maintenance issues and the results of the models. Automated or assisted configuration of the software solution and user-friendly interfaces are proposed, to avoid distracting the maintenance experts' attention from the actual maintenance issue and the guidelines for its mitigation. The adoption of a solution pattern aids the transfer of the software implementation to similar use cases providing a holistic PdM solution to the company.
The data infrastructure contributes significantly to the implementation and model transfer phases. A centralized infrastructure offering a containerized environment eases the development of a micro-service based PdM solution offering flexibility and easy distribution of the workload.
The context awareness is important for the domain and data understanding, which in turn are important for the data modeling. However, the end solution should be context agnostic in order to be easily transferable to a wider range of use cases. The utilization of semantic models and semi-formalized methods strengthen the agnostic nature of the PdM solution.
For the scrap belt use case, a fault detector could be developed rapidly using the presented methodology. Already within the observed period of roughly 1 year, four alarms have been given for respective incidents by the fault detector. The mean time to repair (MTTR) has thus been reduced from 6 to 4 h, and the mean time between failure (MTBF) has increased from 30 to 180 days. With further improvement of the fault detector, a higher sensitivity or even prediction is expected to increase the number of predicted incidents to 11 per year, thus resulting in an expected further reduction of MTTR to 2 h and increase of MTBF to 365 days.
Fault detection and maintenance dashboards have been transferred to multiple sites, thus leveraging the benefit for BENTELER even further.
7. Conclusion
This work highlights the crucial aspects of the PdM implementation process, toward the integration of a smart maintenance solution within a company. Through practical examples, which are derived from a lighthouse factory (i.e., BENTELER plant) within the BOOST 4.0 project, a business-driven process for the implementation of predictive analytics is proposed.
The process is divided into three main phases Use Case Analysis, Proof of Concept, and Deployment, while four main aspects need to be considered in each phase: Analytics Use Case, Data Sources, Data Infrastructure and Data Analysis. The first process phase, Use Case Analysis, includes the domain understanding and the use case analytics sub-phases, which enable the Use Case definition. The Proof of Concept phase is comprised by the data acquisition, data fusion and data pre-processing sub-phases, which facilitate the data understanding and modeling. The final phase, i.e., Deployment, includes the process integration, the roll-out and the scale-up sub-phases, providing a holistic solution to the company.
In order to effectively address the PdM implementation process, the work presents a set of best-practices, proposed tools and methods for each one of the Domain Understanding and Use Case Definition, Data infrastructure, Data Understanding and Modeling and Process Integration and Transfer of Models sub-processes.
The proposed methodology has been successfully applied to multiple BENTELER plants, leading to reduced mean time to repair and significantly increased mean time between failure.
Data Availability Statement
The data analyzed in this study is subject to the following licenses/restrictions: Production data from BENTELER Automotive subject to non-disclosure. Requests to access these datasets should be directed to Sebastian von Enzberg, sebastian.von.enzberg@iem.fraunhofer.de.
Author Contributions
DK and IM contributed to the domain understanding, use case definition, and analysis. AN contributed to the data infrastructure, data modeling, and process integration. SE and AK contributed to the overall framework of the development process, methods for use case definition, data inventory, and model transfer. All authors contributed to the best practice collection. All authors contributed to the manuscript revision, read, and approved the submitted version.
Funding
This research work is funded by the BOOST4.0 project funded by European Union's Horizon 2020 research and innovation program under grant agreement No. 780732.
Conflict of Interest
AN and IM were employed by company ATLANTIS Engineering SA. DK was employed by BENTELER Automobiltechnik GmbH.
The remaining authors declare that the research was conducted in the absence of any commercial or financial relationships that could be construed as a potential conflict of interest.
Footnotes
References
Bokrantz, J., Skoogh, A., Berlin, C., Wuest, T., and Stahre, J. (2020a). Smart maintenance: a research agenda for industrial maintenance management. Int. J. Product. Econ. 224:107547. doi: 10.1016/j.ijpe.2019.107547
Bokrantz, J., Skoogh, A., Berlin, C., Wuest, T., and Stahre, J. (2020b). Smart maintenance: an empirically grounded conceptualization. Int. J. Product. Econ. 223:107534. doi: 10.1016/j.ijpe.2019.107534
Bumblauskas, D., Gemmill, D., Igou, A., and Anzengruber, J. (2017). Smart maintenance decision support systems (SMDSS) based on corporate big data analytics. Expert Syst. Appl. 90, 303–317. doi: 10.1016/j.eswa.2017.08.025
Gausemeier, J., Frank, U., Donoth, J., and Kahl, S. (2009). Specification technique for the description of self-optimizing mechatronic systems. Res. Eng. Design 20:201. doi: 10.1007/s00163-008-0058-x
Georgiadis, D., Kontaki, M., Gounaris, A., Papadopoulos, A. N., Tsichlas, K., and Manolopoulos, Y. (2013). “Continuous outlier detection in data streams: an extensible framework and state-of-the-art algorithms,” in Proceedings of the 2013 ACM SIGMOD International Conference on Management of Data, (New York, NY), 1061–1064.
Joppen, R., Enzberg, S., Kühn, A., and Dumitrescu, R. (2019). “Data map–method for the specification of data flows within production,” in Procedia CIRP (Golf of Naples: Elsevier), 461–465.
Korvesis, P., Besseau, S., and Vazirgiannis, M. (2018). “Predictive maintenance in aviation: Failure prediction from post-flight reports,” in 2018 IEEE 34th International Conference on Data Engineering (ICDE) (Paris: IEEE), 1414–1422.
Kühn, A., Joppen, R., Reinhart, F., Röltgen, D., von Enzberg, S., and Dumitrescu, R. (2018). “Analytics canvas–a framework for the design and specification of data analytics projects,” in Procedia CIRP (Nantes: Elsevier), 162–167.
Moens, P., Bracke, V., Soete, C., Vanden Hautte, S., Nieves Avendano, D., Ooijevaar, T., et al. (2020). Scalable fleet monitoring and visualization for smart machine maintenance and industrial IoT applications. Sensors 20:4308. doi: 10.3390/s20154308
Reinhart, F. (2016). Industrial data science–data science in der industriellen anwendung. Industrie 4.0 Management 32, 27–30.
Shearer, C. (2000). The CRISP-DM model: the new blueprint for data mining. J. Data Warehous. 5, 13–22.
Uhlmann, E., Franke, D., and Hohwieler, E. (2019). Smart maintenance–dynamic model-based instructions for service operations. Proc. CIRP 81, 1417–1422. doi: 10.1016/j.procir.2019.04.327
Yeh, C.-C. M., Kavantzas, N., and Keogh, E. (2017). Matrix profile IV: using weakly labeled time series to predict outcomes. Proc. VLDB Endowm. 10, 1802–1812. doi: 10.14778/3137765.3137784
Keywords: smart maintenance, predictive analytics, model transfer, industrial data science, best practices
Citation: von Enzberg S, Naskos A, Metaxa I, Köchling D and Kühn A (2020) Implementation and Transfer of Predictive Analytics for Smart Maintenance: A Case Study. Front. Comput. Sci. 2:578469. doi: 10.3389/fcomp.2020.578469
Received: 30 June 2020; Accepted: 14 October 2020;
Published: 27 November 2020.
Edited by:
Oscar Lazaro, Innovalia Association, SpainCopyright © 2020 von Enzberg, Naskos, Metaxa, Köchling and Kühn. This is an open-access article distributed under the terms of the Creative Commons Attribution License (CC BY). The use, distribution or reproduction in other forums is permitted, provided the original author(s) and the copyright owner(s) are credited and that the original publication in this journal is cited, in accordance with accepted academic practice. No use, distribution or reproduction is permitted which does not comply with these terms.
*Correspondence: Sebastian von Enzberg, sebastian.von.enzberg@iem.fraunhofer.de