Curricula Design & Pedagogy for Sketching Within HCI & UX Education
 Makayla Lewis1*†
  Miriam Sturdee2*†
- 1Digital Media Kingston, Kingston University, London, United Kingdom
- 2School of Computing & Communications, Lancaster University, Lancaster, United Kingdom
Sketching is recognised as an important tool in the journey of research and practical processes of Human Computer Interaction (HCI) and User Experience Design (UX). However, it is not always included in higher education curriculum, in which HCI and UX is often a single module in one year group amongst more “traditional” approaches in computer science. The benefits of sketching and visualisation practice can be used by students across the board in computing degrees, but especially so within HCI and UX, where novel approaches and ideation are valued and practiced. By the time learners leave higher education, they may or may not have engaged with this valuable skill. HCI has a lot in common with UX, and the two are commonly conflated to be the same thing, though despite this, there is not a focus on practical sketching and visualisation skills. In comparison, within the UX workplace environment, sketching is part of design thinking and vital for the structuring of ideas, storyboards, user journey maps and more. We focus on the incorporation and exploration of sketching as an educational tool, technique and output within HCI, and how this learning is given and received over a number of contexts. This paper outlines case studies where sketching has been included in both formal and informal learning with both undergraduate, postgraduate, and post education populations, and how this knowledge exchange has been both enhanced and changed by the recent compulsory move to online teaching during the COVID-19 pandemic. We discuss practice and learning in the context of four case studies: Data-Sketching in a First Year Minor; Sketching in a 2nd Year HCI Cohort; Sketching as a Foundational Tool for MSc User Experience Design; and, Sketching in HCI for Peer-to-Peer Learning. Further, we make recommendations for incorporating sketching practice and theory into both undergraduate and postgraduate university programs, as well as for peer-to-peer learning in both public and private contexts.
1. Introduction
Art and science are complementary fields (Andreasen, 2012), and embedding creative approaches into science education can enhance the learning experience, well-being, and support active and problem based learning. Within this remit, sketching is a key skill that underpins creativity, and therefore is core to such approaches, yet it remains under-utilised in courses that align with traditional science curricula.
Computer science as a field hosts many sub-disciplines, each with unique work patterns, processes, and group dynamics, which are also translated into the teaching within each sub-field. Computer scientists are technically skilled practitioners, however, they often do not possess skills or confidence for the ideation and design process, during stakeholder engagement, or for the subsequent dissemination of their findings. There is also the potential to improve research processes and systems, to make them more accessible, collaborative, and to gain insights. Could such positive change be enabled by embedding fundamental creative practices such as sketching into core interdisciplinary areas of computer science such as Human Computer Interaction (HCI) and User Experience (UX)?
Both HCI, and UX are complex, dynamic topics, which support the wider discipline of computing, complementing core standards, such as programming, development, and networking. These subjects are also inherently exploratory, diverse and interdisciplinary in their approaches to problem solving and development, and this variety lends itself to openness in pedagogy. This open approach to learning makes space for alternative skills to be embedded into curricula, and sketching is accessible, low cost, useful, and is a fundamentally human activity that we engage with from an early age. When entering higher education, and careers beyond this, most learners have specialised to the detriment of their creative and sketching skills, but these skills are not forgotten, they are simply underutilised. Revisiting these skills, and their associated benefits can create a rewarding educational experience, and equip our learners for their current or future workplace or research space.
Based on our experiences working at the many intersections of the arts and computer science, we investigate the existing and potential benefits of integrating sketching as a learning approach across HCI, UX, and within computer science. We do this via the exploration of four case studies where sketching has been integrated within existing course structures, or offered as a stand-alone activity. We discuss how sketching might be integrated into our existing course structures, its reception, best practice, and discuss the pedagogy which allows for its inclusion in an interdisciplinary computer science education.
Sketching as a fundamental creative process is presented as a method to support the breaking down of disciplinary silos, and changing attitudes toward creativity in HCI, UX, the wider field of computer science, within our own institutions and beyond. We, therefore, ask, what is the state of curricula design and pedagogy for sketching within HCI and UX education as a result of online and hybrid teaching practices? And further, how can other academics and practitioners learn from the experiences described and apply sketching pedagogy to their own teaching?
2. Background
Creative practices such as sketching are often left behind at school when learners begin to narrow their focus to complement their future careers, and are becoming only a minor part of pre-university teaching, despite the advantages an arts education instils across curriculums (Hetland et al., 2015)—this is furthered by the STEAM initiative (UK), which tries to prepare school level students for “creative and analytical thinking” via incorporating the arts into STEM education. As an example of this in practice: literacy improved alongside artistic skills when students attended the Learning Through Art programme run by the Guggenheim, New York, in comparison to those who did not take up the opportunity (Kennedy, 2006). However, the UK education system (as an example) is set up to favor those subjects that are seen as “useful” or “employable,” and the arts have suffered both historic and recent cuts in funding. Such cuts do not take into account the billions of pounds that the creative arts bring to our economy, or the cognitive benefits of arts education: “The arts help our senses operate at their peak1.”
The rise of cross-disciplinary practices between the arts and sciences is a positive move into discovering truly blended practice, and incorporating the advantages of both fields into novel, impactful work (Wilson, 2002; Nakakoji et al., 2006; McCormack and d'Inverno, 2012). Brain studies have discovered links between art and other cognitive abilities (Cohn, 2012), and we find that highly talented artists and scientists do not differ, according to fMRI exploration of a neural basis for creativity (Andreasen, 2012)—therefore, the potential for overlap between the arts and sciences is well founded.
Artists of all genres embed themselves into works as diverse as neuroscience and astronomy, making scientific discoveries by utilising their outlook and skills (Diaz-Merced et al., 2011), and creativity has been identified as a positive influence throughout research and business spheres. Within the specific realm of computer science, creative practice has provided the impetus for digital artists to produce programmed exhibitive and investigative works (Wands, 2007; Kodama, 2008), supported the development of digital tools for creative practice (e.g., drawing tablets and applications) (Shneiderman, 2007; Frich et al., 2019), the development of Human Centred Design and User Centred Design (Norman, 1986), and influences a large body of research in Human Computer Interaction (HCI).
Creative arts activities such as sketching or visual note-taking can produce reflective imagery, and can help us solve problems (Roam, 2013), and the ability of hand-drawn sketching to capture thought, opinion, and show a record of events is well documented (Mendonça, 2016; Wallace et al., 2017). These types of visuals offer an organic, human response to stimuli, and have been shown to aid recall (Paepcke-Hjeltness et al., 2017), offer opportunities for reflection, analysis and feedback (Walny et al., 2011; Fernández-Fontecha et al., 2019), enhance learning and engagement (Paepcke-Hjeltness et al., 2017), and have additional cognitive benefits that can be lost as we move to using computers to make notes and plan our work as adults (Goldschmidt, 2017). There is also evidence that a considerable amount of creative scientific thought is worked out with “visuals” or externalizations of still vaguely formed ideas from the scientists' minds (Hadamard, 1954).
Embedding sketching into existing HCI and UX curricula is not straightforward—we cannot simply start teaching “creativity” and arts-based approaches without context. There may be resistance in learning supposedly “soft skills” alongside the practical applications of these facets of computer science, although there is ongoing evidence that such skills are valuable within the job market, as many computer scientists are expected to operate in multi-disciplinary teams, and be excellent communicators (Brown et al., 2009; Castro et al., 2018). Many graduates also may move out into non-degree based employment such as within graduate schemes, meaning a diversity of skills is even more valuable. (Bares et al., 2018) go as far to suggest that it is time for Computer Science to transcend itself as a field to become “…a more universal, inclusive, engaging discipline” and further one which is both relevant to, and “incorporates and synthesizes” other domains of knowledge. HCI and UX courses are a major part of this change, and offer an opportunity to explore, create, and think visually.
Post-education, such skills are still vital, but are “optional” in terms of their delivery and application, yet the uptake of professionals in both formal and informal sketching courses evidences that there are gaps in this knowledge that have persisted. Sketching is a persistent skill that crosses boundaries, knowledge and is global in its nature—manual sketching is still relevant in even the most technical of disciplines (Goldschmidt, 2017). Where sketching is such a natural fit to our discipline, it is important to do more to promote, discuss, and share best practices, with the aim of not only improving the pedagogy for HCI and UX, but potentially the wider field of computer science as well.
3. Rationale
This is a cross-sectional study where we present a snap-shot of learner groups at a given point in time, and during a time when a rapid evolution of teaching styles and technology was in play. Our intention in creating this work is to showcase a variety of approaches and techniques for teaching sketching as part of a wider HCI and UX education, based on our own experiences over the past 5–10 years of engagement in this area. We focus on case-studies to enable outside eyes on real-life scenarios, without the pretext of a user study or focused attention, and student work is shared with permission and attributed. The case studies are presented in order of educational experience, to show how delivery and impact varies across time, starting with first year undergraduates, then focusing on second year undergraduates, before moving to postgraduate and peer-to-peer learning in professional contexts. This allows us to compare groups and experiences in a reflective manner, and provide indicative guidelines for teachers to use within their own educational practice. Within each Case Study, we also provide direct comparisons between in-person and online/remote teaching for sketching, which was partially expedited by the pandemic, but has proven to be both a challenge and an opportunity for this kind of learning activity. Although we provide details of four case studies, we are also able to offer our feedback with background knowledge from both informal and professional settings, where sketching education has been either a volunteered or paid activity, at meet-ups, events and during invited talks and seminars. The following Case Study sections each provide details on course development, learning objectives, assessment, demographics, sketching pedagogy and feedback or resulting outcomes. We conclude this paper by reflecting upon lessons learned, and provide advice for those wishing to embed this valuable skill within their own teaching practice.
4. Case Study #1: Data-Sketching in a First Year Minor
4.1. Course Development
This Case Study outlines the use of sketching within a course offered as part of an initiative aiming to make the benefits of computer science education available to learners studying any subject. Recent funding enabled the design of this as a brand new “minor” subject in Computer Science in 2019 (a course which runs alongside an individual's primary undergraduate degree program), with the aim that it is to be integrated into the main computer science degree during the next review of the accredited program. The overall minor is heavily HCI focused to show the range of possibilities when studying computer science. We examine the learning experiences where sketching was embedded in class and coursework activities for 1st year undergraduate students over a three week module covering information visualisation, documenting the process, results and challenges in teaching sketching within this context.
4.2. Learning Objectives and Assessment
The full minor course offers students a choice of “tracks” through a range of HCI focused modules, such as VR/AR, programming fundamentals, and physical computing, one of which is Information Visualisation. This particular module is aimed at examining and creating visual representations of digital material, such as social network diagrams, and the representation of personal data for communication. Specifically, the module explores the question of why we need to visualise data. Learners are asked to reflect on how we developed visualisations to communicate data with people, and what decisions are made by the programs we use today. Learners are also expected to be able to identify “successful” and “unsuccessful” attempts at communicating data visually, and discuss biases and limitations in visualisation.
Work was created during synchronous studio sessions (and during independent learning hours) and contributed toward a final assessed portfolio (80%) with the final output being a creative infographic outlining personal data collection and insights, and describing each learner's journey through information and visualisation. The remaining 20% of the course marks were given for engagement (10%) and a short online quiz (10%).
4.3. Course Demographic
Learners self-selected the minor as an accompaniment to their main degree course (non-computing focused), examples being Economics, English, History, and Maths. Only one learner in 2019 was studying an arts-focused subject (Design). From a full cohort of 71 (2019) and 76 (2020), 41 individuals chose the Information Visualisation track in 2019, and 46 in 2020. The course was unusual in gender split being fairly even between those identifying as male, and female or non-binary, when compared to the full computer science cohort which ranges between 11–30% female or non-binary learners. Apart from the student on an arts course, students had little to no experience with sketching since before their exam subject choices which occurs in the UK around age 14.
4.4. Sketching Pedagogy
4.4.1. Structure and Schedule
The module was originally designed to be a blended learning environment (Osguthorpe and Graham, 2003) with a weekly studio session (2 h) where learners worked on their “table” with the idea that they would support each other during studios. The studio sessions primarily involved sketching with some hands-on “making” to describe both personal and broader data, as well as providing an opportunity to translate information into the digital domain. Video lectures were also provided to be watched asynchronously (up to 1 h a week in bite size chunks). There was also the expectation that learners would engage in independent study of around 10 h over the three week period. The weekly studios were split between the cohort to foster interpersonal relationship-building, with an average class size of 15. Learners were able to self select a “table” for in person sessions, but these were pre-allocated for online-only delivery. The studio sessions started with a task introduction and learners were given a selection of data sets to sketch, starting with a basic “social network” delivered in a table of names and numbers, and following on with housing types, and cars (2019 only). Following the studio session on data-sketching, students moved on to working with data physicalization, before returning to sketching to plan and outline their final portfolio piece which was an infographic of personal data, collected over the duration of the course.
4.4.2. Delivery of Sketching Pre-COVID Pandemic
Sketching in practice was core for the first week and the following independent learning hours. The blended learning environment meant that students had access to pre-recorded lectures which were designed to be accessed before the first studio. The first two lectures covered drawing hints and tips, including a “sketch your music task” where students reacted visually to a piece of music, and also comprised a short course covering sketchnoting, and commonly used icons, objects and figures (Figure 1). In the first studio, students were given a short demonstration of how to begin data sketching, using a large presentation screen connected to a Microsoft Surface. Pens, pencils and paper were supplied to ensure that materials availability was not a barrier to engagement. Teachers and teaching assistants then circulated and answered questions and gave hints as needed. The largest barrier to engagement was that students did not see why the data needed to be sketched, asking why they could not just feed the data into a machine to generate the desired result, however by the end of the session the students took away the knowledge of process—how we begin to design visualizations that become automated. Sketching underpins the design of visualizations and how the software maps the data to the visuals. Most students completed a full representation of the “social network” task during the in person session, with some also making a start on the houses or cars data set, which allowed for more creativity in the sketched representations (see Figure 1 for an example of student work from this part of the course). Two students from the first cohort developed an alternative method of sketching the social network, encoding relationships into elements of a person's face or clothing. Several students found the full data set overwhelming to produce in one piece, and instead used small multiples (Tufte and Graves-Morris, 1983), describing each person's relationships in turn.
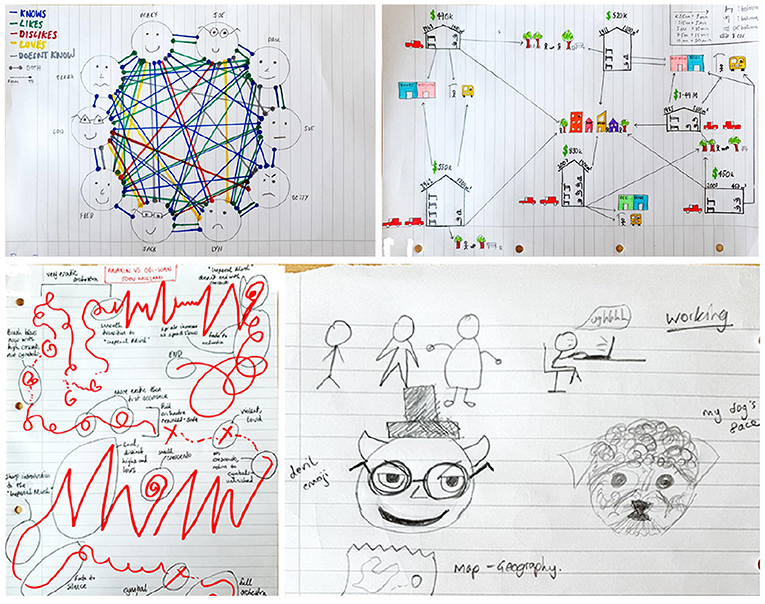
Figure 1. From top-left to bottom-right, social network data-sketch, houses data-sketch, music visualization, emoji and figure practice. Reproduced with permission Oliver King, 2021.
4.4.3. Development of a New Online Structure and Schedule
As the course had already been developed to be blended in its approach, the main difference in the delivery was that the studio format had to be rethought. Students no longer had the social experience of their “table,” and the camaraderie of working together in person and comparing notes and sketches. Based on student feedback from the previous year, the sketching data sets were reduced from 3 to 2, to reflect the large number of learning hours needed to complete the tasks. The video lecture tasks which had previously been advised, but optional, were made compulsory to ensure that all students started the sketching studio with the same level of knowledge. Students were divided into “tables” using Microsoft Teams private (hidden) channels, with a general channel available for full class presentations at the beginning of each session, and more general sharing of work. Each channel was encouraged to chat and share their work in the channel directly to gather feedback from peers and teachers, and also in the general channel if the student felt confident. The demonstration was almost exactly the same as the in-person delivery, but delivered directly to student's computers rather than on a central screen. Unlike the in-person sessions, many students were reluctant to be the first to post an image, as they were concerned about their skill levels, however, once one person had posted then other students felt able to join in. This sharing also helped make connections between students, who largely worked on an individual basis for other tracks. Those students who felt unable to communicate to their group also made use of the private chat function in Teams to communicate directly with teaching staff if they had questions.
4.5. Results and Feedback
When making comparisons between the in-person and online only environment—for example, in demonstrating techniques and ideas, offering feedback, or sharing between groups—the largest difference was in sharing sketches within and between groups—although all students were encouraged to share within both their own channel and the “general” group. Feedback was made discrete by the availability of the private chat function, and students who posted their work publicly did so on the basis of sharing, rather than asking for feedback. Despite the less social set-up of the online-only module, the students appeared to enjoy the tasks more, perhaps because they did not have to worry about judgement as their images were private unless shared by choice. For the in-person studios, any student could walk around and see what their peers were creating. Despite the minor differences between delivery, the second cohort were more engaged with the sketching content, spent more time drawing and the course feedback was more positive: First cohort: “Very interactive and fun.” “Learnt a lot of new skills” (Standard university course ranking 3.71/5); Second cohort: “Lots of fun doing sketching, provides a break from hard work while still learning. [The teacher] knows a lot about what she's teaching and can give examples for any situation.” (Standard university course ranking 4.18/5).
Sketching as a core activity was well received and most students engaged directly, however, for both cohorts, two students used digital tools rather than complete the tasks by hand (e.g., online diagramming rather than digital sketching with a stylus). The compulsory inclusion of data-sketches in the final portfolio meant that all students completed the task if they were able, in order to get the maximum marks for their work. Due to the course originally being implemented as blended learning, very few differences in transition and outcomes were noted apart from the final module feedback. One difference for the improved feedback between the first cohort and the second was that the explanation given for why sketching was important was made clearer, and the slightly reduced workload (one less data-set). As the students were from non-computer science subjects, the department was not able to get an update as to the learning journey and if the skills they learned were applied, but each student was given the opportunity to develop and apply their sketching skills in further study should they wish, and many of the final portfolio projects reflected the use of sketching and visualisation skills in application to their own interests and courses.
5. Case Study #2: Sketching in a 2nd Year HCI Cohort
5.1. Course Development
The Human Computer Interaction course is a full degree core cohort module that runs for the whole of the first term. In its current iteration it has been delivered in the same format for five years. The course is the first introduction that students have to human-centred computing and User Experience design processes and tools. Students are taught both theoretical and practical topics over a ten week period, comprising two hour-long lectures a week, and an hour]s practical workshop for six of those weeks. Students are expected to work in groups and commit additional learning hours alongside synchronous learning. The practical sessions offer hands-on design experience, implementation advice, and skills to evaluate interactive systems. The synchronous lectures explored human perception, UCD, and participatory design, to show how system design impacts external user behaviors, and explores the importance of accessibility in design.
5.2. Learning Objectives and Assessment
Students are expected to be able to integrate diverse information to form a comprehensive understanding of Human-Computer Interaction; critically reflect on advancements in HCI and computer science as a wider field, and be able to leave the course having gained the abilities needed to work in modern design and development teams.
5.3. Course Demographic
In 2020, the second year undergraduate cohort comprised 276 students, enrolled either on a focused BSc Honours course in computer science, or a combined degree where computer science formed half of their modules. One student was completing a term in the UK as part of an exchange scheme. In 2021, the full cohort was 212 students, with two on exchange.
5.4. Sketching Pedagogy
5.4.1. Structure and Schedule
The change to online learning in the six months prior to the new university year meant that materials and structure had to be changed. All lectures that were previously delivered synchronously were now expected to be pre-recorded, for students to watch in their own time, or during the allocated session if preferred. The time slot given to the lectures was suggested to be used to replay the lectures, and then provide a short Q&A session. Lectures themselves were divided up into shorter chunks, similar to those provided in blended learning courses (see Case Study #1). The workshops had previously been 2 h in length, but the increased student numbers (up by nearly 100 on the previous year) and the online format meant that these were halved to ensure that students were not overwhelmed by screen time. The additional work needed for workshop tasks was allocated to independent learning hours (in group). Students were divided into groups of 5–6 for their coursework, to ensure that if there were non-engaged members, that sufficient students remained to not become overwhelmed by the workload, and any disruption taken into account when marking. A major change to the workshops and assessments was that a video prototype was no longer required—COVID-19 restrictions meant that students were unable to meet in person and film each other. To fill the gap in assessment, greater importance was given to sketching and storyboarding, with the students now required to produce sketches and finalised storyboards as one of the key marked coursework components (see Figure 3). To support the increased importance of sketching, students were offered a 1 h synchronous, hands-on lecture on beginner's sketching, in one of the regular lecture slots, alongside a pre-recorded lecture on sketching and storyboarding theory and examples (to be watched prior or after the hands-on session. A second, participatory sketching activity was also designed to demonstrate practical uses of sketching during ideation and prototyping.
5.4.2. Delivery of Sketching During COVID Pandemic
The synchronous sketching session was a 1 h live, hands-on sketch-a-long. All students were notified in advance of the session to prepare sketching materials (either pen/paper or tablet/stylus). Slides were used to structure the session, but these were not shown to students due to the limitations of the Microsoft Teams environment. The main window was set up to screen share a Microsoft Surface Go, and the meeting joined via an additional device (laptop and second screen—see Figure 2) in order to see what the students were seeing, view the slides, and also maintain the chat function to answer questions. The session covered basic sketching visual-vocabulary (e.g., people, actions, places, animals, and objects) and moved on to creating narratives and storyboards, which directly related to the coursework component. Students all used their own materials, but were given advance notice on what to have (paper, black pen, coloured pen, as a minimum). Prior to the session, students with accessibility needs were spoken to privately and alternatives and accommodations arranged (e.g., using a particular stylus and tablet, digital variations on sketching, embedding clip art and line drawing to create narratives). Of the full cohort of 276, 180 students joined and engaged with the synchronous session. Images were non-deliverable, but some students included items within their coursework appendix and evidenced style-guidelines and learning in their final storyboards—for example, in Figure 3 the style of figure is taken from the live sketching session, and the use of highlighting and different viewpoints from the asynchronous lecture content.

Figure 2. Sketching delivery set up: Microsoft Surface Go and stylus, Macbook Pro 13,” Dell 20” monitor, mobile phone, table clamp for live hand-drawn view, pens, paper, desk lamp. Miriam Sturdee, 2021.
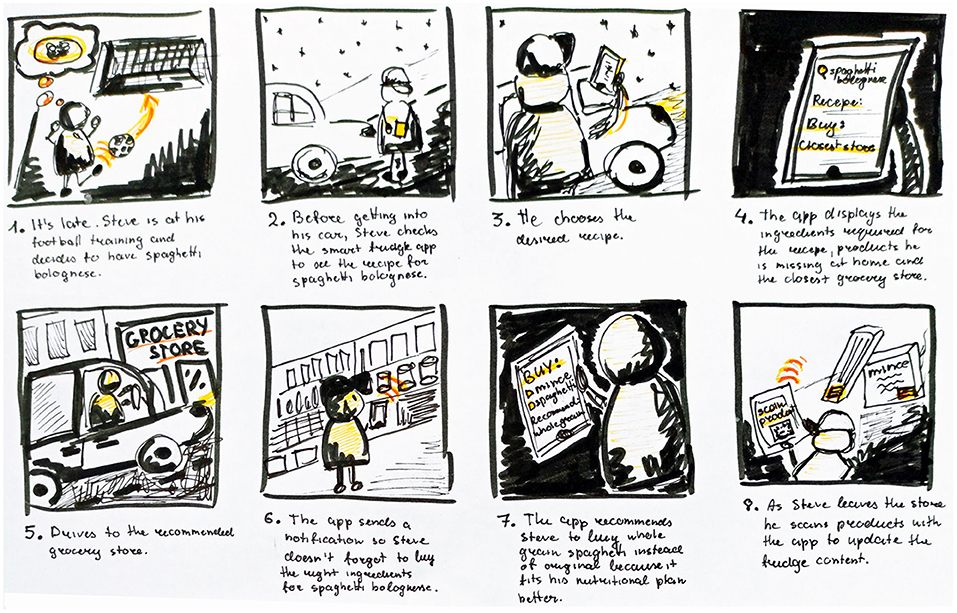
Figure 3. Student storyboard for coursework component of 2nd year HCI, based on lecture and hands-on sketching session. Reproduced with permission Indre Aruodziute, 2020.
As the course progressed, students were expected to focus on theory and examinable information. To support knowledge formation, a co-sketching participatory activity was designed to enable students to apply their knowledge of good principles of design and accessibility (Nielsen, 1994). This activity was based upon one that we use in our peer-to-peer learning and called “HCI Improv” which combines user experience with ideation and design fiction (Sturdee and Lindley, 2019). During our usual peer-to-peer sessions (see Case Study #4 for an example) learners form teams and work on spontaneous prompts suggested by the full cohort, before ideating, diagramming and creating storyboards for a novel technology, use case, and user group. They then present these to the room. For the online set-up, the students provided the prompts, but the sketching was done live by the teacher, and students could advise on aspects of the technology and use case in real time using Microsoft Teams chat. This part of the lecture schedule was not designed to teach sketching, but to both show its value and instill practical knowledge of HCI and UX that had previously been delivered passively.
5.4.3. Development of a New In-person Structure and Schedule
With the return to synchronous, in-person teaching and workshops, the course had another overhaul, and was brought back in line with pre-COVID materials. The return to synchronous lectures meant that the videos were scrapped and the traditional format of slides and presentation to a theatre was brought back. Without the benefit of asynchronous learning, there was no longer the capacity for a full session on sketching. Basic skills were taught in a 10 min block at the end of the theory lecture, and then capitalised upon for another 10 min at the beginning of each of the seven workshops. In contrast to the online delivery, very few students brought materials with them, so were provided with basic pens and plain paper. To support the students in their sketching skills, a large part of the subsequent workshop was given over to detailed feedback to enable students to develop their style and content before the final storyboard components were created.
5.5. Results and Feedback
Following the online synchronous sketching lecture, several students reached out to state how much they enjoyed the content, and that they had not expected to have so much fun in a computer science lecture. The overall course feedback was positive, with HCI achieving an average score of 4.45/5 for the module, based on the standard university metric—this was the highest score the course had ever had, with a lot of feedback about the alternative activities and sketching skills. Although one student mentioned they thought that the “importance of sketching was overstated” compared to the bulk of the lecture and coursework material, it was also incorporated heavily into the open-book exams that were taken by students six months later, at which point it became clear why so much focus was on practical skills. Several students actively sought out opportunities to work as teaching assistants for the following year, based on their enjoyment of the course, and in particular, the sketching skills and applications.
In-person workshop take-up was extremely high due to HCI being the only fully in-person course offered to second year undergraduates in 2021. As a result, theatre occupancy was high and a large proportion of students engaged with the sketching and storyboarding theory. Despite the face-to-face context and presentation however, uptake for each in-person workshop was around 65% (around 18 students in each group) which was similar to the online delivery, but those who were not participating had a negative effect on the session, refusing to take part even with encouragement, and this meant the atmosphere was also less convivial. However, those that did complete the short sketching skills presentation also took all their sketches with them rather than leave them for recycling, which suggests they found value in the work. Several students who were particularly active also stayed to discuss their images and style after the session. Course feedback for the most recent cohort is not yet available but will be added before publication.
6. Case Study #3: Sketching as a Foundational Tool for MSc User Experience Design
6.1. Course Development
User Experience (UX) design postgraduate, accredited Master of Science, course started in the mid-2000s in the United Kingdom, with an overarching goal of equipping learners with the theory and practical skills to enter the UX profession in the UK and beyond, successful postgraduates have gained employment as UX designers, user researchers, and brand and product designers. The course has experienced exponential growth in the last 5 years due to the increased reliance and adoption of technology in everyday work and life. The module is one of five modules in the course lasting one academic year for full-time students and two years for part-time students. The module occurs in the second half of the academic year (winter term) for both pathways, lasting fifteen concurrent weeks. Traditionally, an in-person course, with weekly theoretical lectures and practical workshops, took an unprecedented shift to online learning and teaching in the winter of 2020, as a result of the COVID-19 pandemic and lockdown measures faced by UX education providers in the UK and around the world.
6.2. Learning Objectives and Assessment
The primary module learning objective is to introduce learners to design thinking, precisely the Stanford design thinking methodology2 in the context of contemporary UX design. Students are asked to engage with the non-linear process with an aim to systematically extract, learn, and apply design thinking techniques to solve an in-class group work problem, a rendezvous smartphone application, and individual coursework, student chosen problem. The successful completion of the module means students are able to demonstrate research about their intended audience; analyse, both qualitative and quantitative, data to develop a number of grounded UX artefacts that define requirements, e.g., affinity diagrams, user personas, empathy maps, customer journey maps; creatively ideate and design modalities and interactive content that appeals, e.g., crazy 8 s, brainwriting, low-fidelity paper prototyping; to innovative and technically prototype a smartphone application with strong consideration and use of modern day practitioner principles, methods, and technologies to test the suitability of their intended user journey, and then to critically reflect on the design method, practice, and user experience whilst considering the strengths, limitations, and future work.
6.3. Course Demographic
In January 2021, seventy-eight postgraduate students from around the world were brought together to study a traditionally in-person course in an online capacity as a result of the UK Government enforced third national lockdown. The learners represented a variety of ages, skills, work and educational experiences, and knowledge. The majority joined having taken a direct path from related undergraduate studies with non-related work experience whilst others had multiple years of related-industry experience across multiple roles and levels who wanted to formalise their industry knowledge. Although, there were a few learners enrolled due to a desire to change industry and thus had limited experience in the space, e.g., illustrators, animators, architects, and social workers.
6.4. Sketching Pedagogy
6.4.1. Role and Delivery of Sketching Pre-COVID Pandemic
Sketching plays an important role in the module, especially in the areas that encourage the exploration and generation of knowledge, ideation and early prototyping; the early to mid phases of the methodology. The learners are asked to sketch alongside users to understand their past, current, and future experiences, e.g., current experience comic strips (Lewis et al., 2014); to define the users journey, challenges, requirements, and opportunities through the use of storyboards; by loosely sketching the problem and their potentialities from the perspective of others using a variety of ideation approaches, e.g., “rapid idea generation” and “day in the life of the problem3” pseudo-interactive low-fidelity paper prototypes (Figure 4) for evaluation with users supported by Marvel POP4.

Figure 4. Pre-COVID-19 exemplar of sketching in UX design: demonstrating contextual prototype vignette. Makayla Lewis, 2018.
In traditional teaching and learning environments, pre COVID-19 pandemic, sketching took the form of in-person demonstrations followed by learner application through the use of electronic projectors using traditional, everyday, sketching tools: pencils, fineliner pens and markers on printer paper and or post-it notes (e.g., Figure 5) or using a whiteboard (e.g., Figures 6, 10 middle) in either a lecture theatre or computer laboratory setting. The students would be asked to “sketch-a-long” with the teacher, an established learn-by-doing approach that puts forward the idea that humans learn more when “doing” an activity (Schank, 1995). Throughout which the teacher used a think-aloud protocol to give students an opportunity to gather insight of the creator's thoughts, feelings, and decisions as they sketch, through which they can open dialogue with the teacher through questioning and discussion. Thus, it was determined that omitting sketching from the curricula would have a detrimental impact on the students successful engagement with the module.
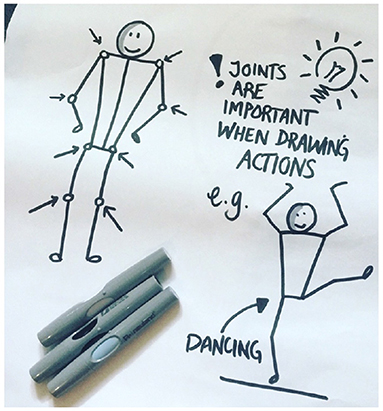
Figure 5. Pre-COVID-19 teaching sketching in UX design: demonstrating figure design using sharpie markers on paper. Makayla Lewis, 2018.
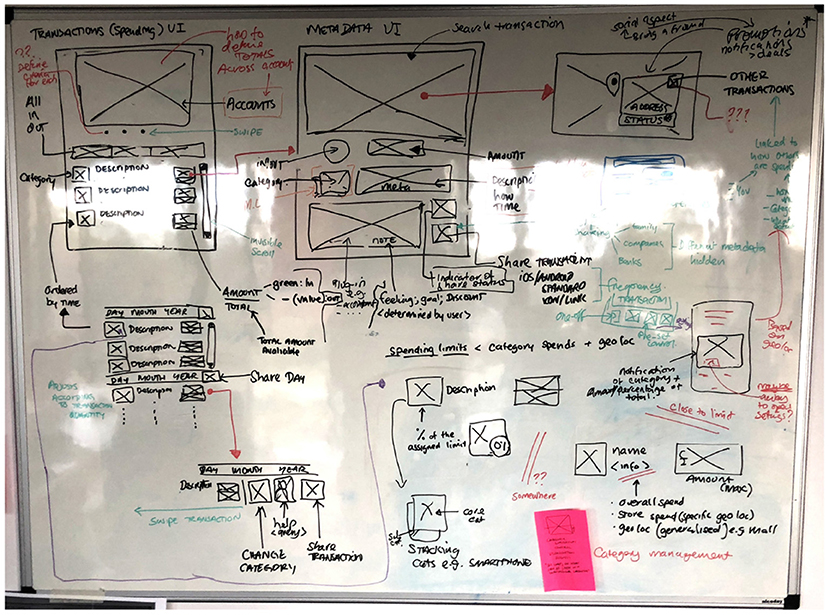
Figure 6. Pre-COVID-19 exemplar sketching in UX design: demonstrating an ideation technique using a whiteboard. Makayla Lewis, 2019.
6.4.2. Development of a New Online Structure and Schedule
As a result of the UK government online learning measures, the traditional in-person module structure and schedule was overhauled. The teacher's decision making process was supported by personal observations and experiences alongside learnings shared by the authors and the wider UX education community during previous lock-downs, these non-academically published mediums included blogs, social media (e.g., Twitter hashtag #onlineteaching), articles (e.g., Gewin, 2020), virtual department exchanges and coffee breaks and institution teacher training. The concluded that online module students would experience challenges that would impact their ability to learn sketching, would include, but were not limited to, passiveness; time management and discipline; learning environment control; isolation, anxiety, and depression; lack of motivation; and reduction in help seeking. In an attempt to overcome these the module structure and schedule was planned and delivered in a way that promoted technical and social presence, the module teaching team (the teacher supported by a teaching assistant, a previously successful module learner) actively and regularly engaged and encouraged presence. Although not a new concept, initially put forward by Mishra et al. (2020), Almendingen et al. (2021) and Parks-Stamm et al. (2017), it was fundamentally and logistically different from the teaching team prior module delivery.
Each week students were given a 2-h lecture, 1-h fireside chat with industry and academic researchers and practitioners, 1-h reading group with assigned industry and academic materials followed by a 3-hour workshop to apply their weekly learning to the in-class problem. Help seeking was presented to students in four formats: (1) 1-h group consultations at the beginning and ending of each week; (2) “frequently asked question” forum where students could put forward questions at one day or time for the team to answer during working hours; (3) and a mid-module review in the form of a student “show and tell;” and (4) student initiated 20-min 1:1 support sessions although this was rarely requested. Furthermore, optional extracurricular activities, curated by the teacher, were shared and regularly updated that included free, to support student accessibility, information to online UX community meetups, conferences, hacks, and coffee chats. The teacher made a point to attend extracurricular activities, greeting learners in virtual spaces, and engaging in UX community networking and discussions. Furthermore, similar to Case Study #2, the teacher consulted with students who identified as having accessibility needs prior to the commencement of the module and the module materials were adjusted accordingly.
To better support “presence,” the students were divided into twenty teams where they were encouraged to collaborate inside and outside class hours. A systematic narrative approach was taken to teach and engage students in the content, every fortnight, for the duration of the module, was dedicated to a stage of the method whereby related concepts, theory, case studies, artefacts, demonstrations, and activities were put forward and practiced. Learners were asked to “show and tell” their in-class group work in the fourth week during timetabled workshops, present their empathise, define, and ideate phase of individual projects in week eight, present a poster of their completed in-class group work in week ten. Following the ten week teaching block, learners were given an additional five weeks to complete then submit their individual coursework.
6.4.3. Embedding Technology During COVID-19 Pandemic
The students were divided into twenty groups, between four to six members, using the People feature within Canvas, a course management system that supports online learning and teaching5. Each group was given a link to a private sub-channel within the module Microsoft Teams, a space for private conversations with a specific audience6 where they were encouraged to collaborate, through chat and video, inside and outside class hours. It was believed providing the learners with a symbolically “hidden” online space allowed the teacher to separate the large cohort into smaller groups with an aim to promote a learning environment that is conducive to confidence and relationship building in a supportive peer environment7, a space that would encourage exploration and experimentation with sketching. The author created a teaching space in a quiet, well lit, location of their home to minimise distractions during online teaching sessions (see Figure 7).
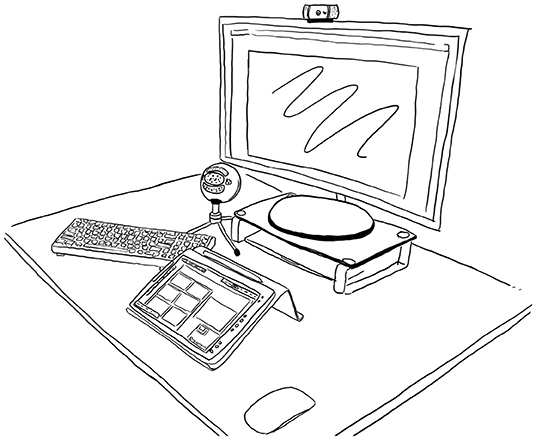
Figure 7. Online learning sketching set up in a quiet, well lit, location: 27” monitor, external microphone, external webcam, external keyboard, external mouse, and Wacom Cintiq One with Pen on a laptop stand. Makayla Lewis, 2021.
Sketching lectures were conducted synchronously through the use of multiple devices and applications. A laptop was connected to an external monitor to provide a large teaching space (Figure 7). The external monitor was restricted to Microsoft Teams, an online workshop offering chat, video conferencing, and software sharing; this allowed the teacher to monitor student engagement and interact through the use of an external microphone and webcam. A Wacom One drawing tablet8 acted as the second monitor, this was screen shared with the learners through Microsoft Teams. The purpose of the tablet was to synchronously demonstrate sketching skills and visually answer questions and comments. The digital sketching approach used differed from Case Study #2 as a result of the author's previous lockdown teaching experiences and through non-academically published mediums, discussed previously, that students often experienced difficulty with viewing traditional sketching demonstrations due to the presence and positioning of the teachers' hand. Miro, an online collaborative whiteboard, was used to deliver the sketching demonstration lectures. Miro boards permissions were set to comment meaning the visitors (learners) could view and add comments to any area of the board, Miro timers were also used to ensure the lecture remained on track, and Miro timer music provided ambience during individual learner activities.
Prior to each lecture a board template was created containing five core areas: (a) introduction to the lecture and the teacher, (b) reminder of core slides from that week's lecture, (c) a blank area for demonstration (Figure 8), (d) an exemplar area (e.g., Figures 8, 9), and (e) upload area. Each sketching lecture began with a reminder of the lecture then sketch-a-long to build sketching skills, e.g., actions, faces, figures, emotion, scenes, etc., followed by a series of individual activities for application purposes. During the lecture students were encouraged to use Miro comments to ask questions by placing comments next to the relevant sketch or material (Figure 9, yellow speech bubbles). This helped the teacher to keep track of questions and their relevancy during synchronous demonstrations.
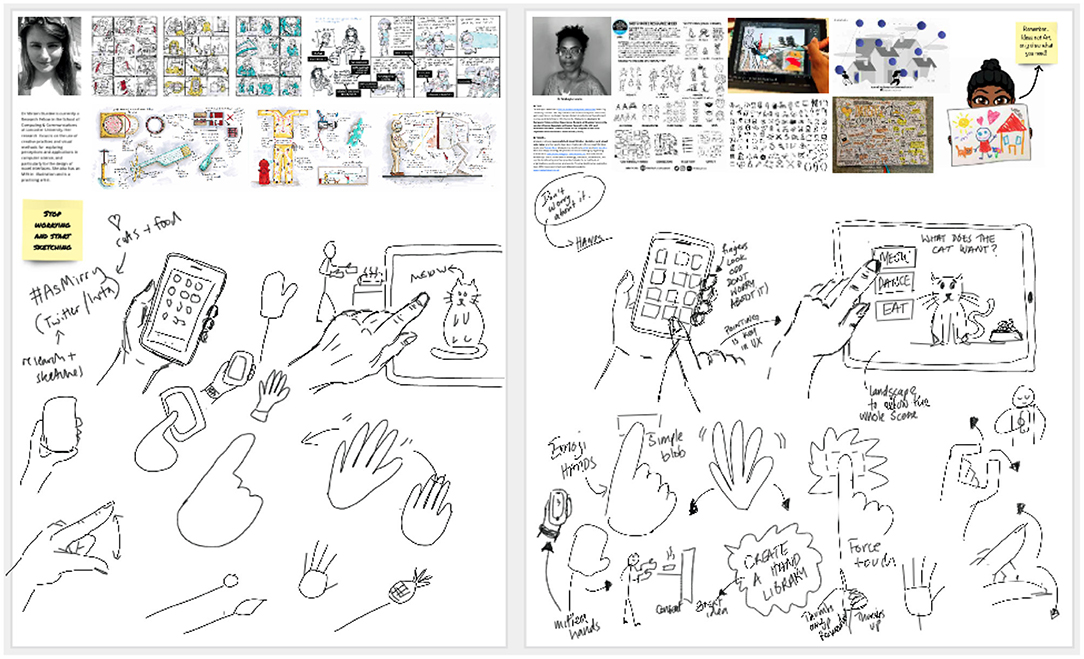
Figure 8. Example interactive Miro board for demonstration of sketching devices, interactions, and gestures for storytelling and storyboarding lecture with a guest speaker. Makayla Lewis and Miriam Sturdee, 2021.
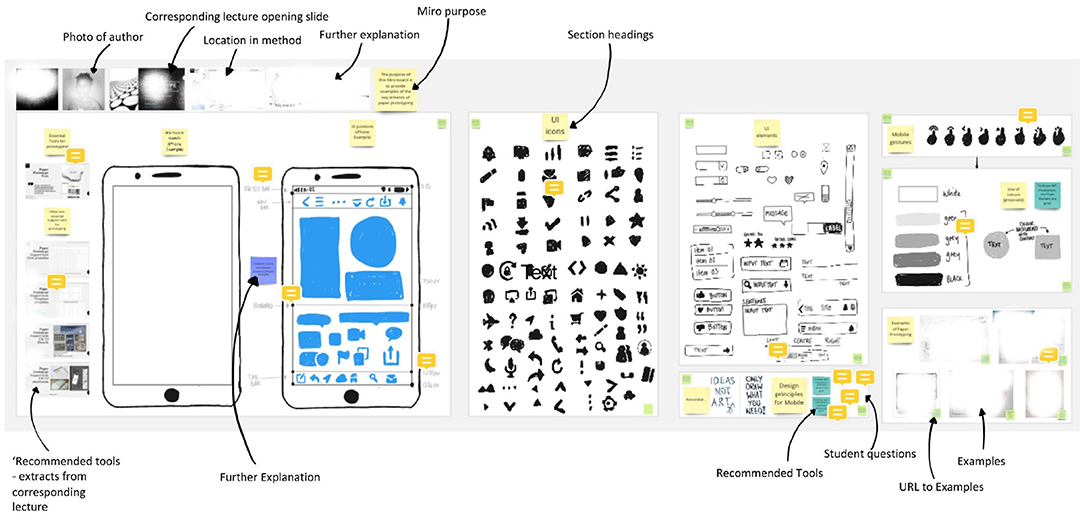
Figure 9. Example interactive Miro board for demonstration of sketching components and icons for low-fidelity paper prototyping lecture. Makayla Lewis, 2021.
Toward the end of the lecture, the last 15 min, the Miro board elements were locked, permissions were set so that only the teacher could unlock the board. The learners were then reminded that the sketching lecture is a safe and supportive environment to share their creations. The Miro board permissions were then changed to edit allowing learners to upload their sketches to a predefined area of the board using their smartphone cameras and the Miro app. This allowed the teacher to view and provide feedback to students synchronously, it also offered the students to give constructive feedback to each other. Students who chose not to share their creations were asked to upload to their group Microsoft Teams private channel to obtain feedback from the teaching team and their group.
6.5. Results and Feedback
Upon comparison, the greatest differences between online and in-person teaching and learning that were observed by the author, were preparation, focus and attainment, and engagement. To ensure the teacher maintained control of the sketching lectures, precisely meeting learning objectives were met in a fun and interesting way, a considerable amount of time and planning was required, especially how technology would be used to support the sketching lectures. For example, the creation of the Miro boards were paramount, they needed to be easy to use, have logical structure, engaging, and support learner feedback and interaction. One Miro feature the author overlooked but learned quickly, 10 min into the first sketching lecture, was to use board permissions and element locking appropriately, “If you give learners an sketching board for where you want them to engage in a specific way but give them access to all features and full permissions, what results is utter chaos, they will move areas and materials, sketching anywhere, upload photos of their sketching materials, their family pet in some instances, that are so large they take up most of everyone screen, and you will be flooded with Teams messages depicting confusion, frustration, and laughter followed by a flustered and panicked teacher.” Planning is important, ensuring the teacher is adequately trained and practiced in the online synchronous hardware and applications they intend to use to deliver sketching lectures is crucial, this is because learners, when given the opportunity to be creative, will engage and push the boundaries in unexpected ways.
In relation to focus and attainment, the author witnessed an increase in “doing” amongst the students, precisely engaging with the content rather than only listening to it. Miro cursors, allow the teacher to show/hide collaborators' cursors on the board, allowed the author to see learners on the board, what they were most interested in, the links they were clicking thus allowing the author to adjust what was sketched and discussed, explore areas that were not being engaged with, and through the use of Miro Bring everyone to me, attention management feature that guides students to the teachers' location on the board, redirect student engagement and focus. Furthermore, through the use of Miro comments and emojis, the latter feature was an unexpected success amongst the students, the teacher was able to answer questions though comments left by students, reiterate content or re-draw a sketch when confusion was present as students would add sad emojis to specific areas of the board, they would use thumbs up emojis to vote on aspects of the board that were of most interest, and would use comments to support the teacher in answering questions.
Student engagement was the most surprising outcome. At the beginning, the first week, they had a passive presence, both technological and social, during online lectures and workshops, however, by the end of the second week as a result of “presence” actioning of the teaching team they began to demonstrate greater presence in terms of attendance and engagement. This was especially evident in sketching related lectures, the author while preparing for the lectures, would see busy Miro boards (cursors whizzing around), Microsoft Teams video conferencing “start” notifications at least 5 min before the lecture with notable “pings” from the chat that regularly contained gifts depicting anticipation, sketching questions, and photographs of their sketching set up and previous practice. Students' technological and social presence remained high throughout the module, as a result the module received an overall ranking of 4.25/5, the standard university module ranking: 4.00/5, also a student noted in their module review, “I am absolutely mesmerised by [ML] organisation and teaching technique. The module has been incredibly easy to follow and, if needed, going back to review the slides to answer any doubts is also easy to navigate. The [ML] has given us extensive reading material to reinforce what we're learning each week, alongside the Friday workshops which put our knowledge to practice. There have been times where it does feel somewhat overwhelming because of the amount of things we're learning, but the workshop helps calm that feeling by forcing us to process what we learned and put it to work.” Furthermore, the module saw an increase in the use of sketching in student coursework, previously when sketching was few and far between they were presented throughout in vast forms and to varying degrees, they were annotated and justified when they were not previously, the students demonstrated a greater understanding and application of sketching in UX which is hoped will remain as they commence employment.
7. Case Study #4: Sketching in HCI for Peer-to-Peer Learning
7.1. Course Development and Learning Objectives
As discussed in case studies one to three, sketching is often overlooked in many applications and disciplines, it is often referred to as a “soft” skill and as such direction is often not provided in teaching and learning settings (universities and adult learning institutions). Although, it is proven that sketching can support students, researchers and practitioners in HCI to ideate, collaborate, document, and explore complex topics, themes, feelings, attitudes, opinions, and experiences of ourselves and others, e.g., code (Bergström and Blackwell, 2016), rapid prototyping (Cottam and Wray, 2009), algorithmic recognition (Johnson et al., 2012), and a digital representation (Igarashi et al., 2006).
In 2014, the authors observed that those wishing to learn and practice sketching in HCI had limited opportunity to do so in a fun, engaging, confident building and friendly sketching environment. The ongoing journey to provide this opportunity began at ACM NordiCHI 20149 continuing to 2021 at ACM CHI with a multitude of conferences, summer schools, events, meet-ups in-between, e.g.,10, 11 (Lewis et al., 2018, 2019; Lewis and Sturdee, 2020, 2021), and (Sturdee and Lewis, 2020).
The overarching aim of the course is to be “hands-on,” to foster a learning by doing approach as discussed in Case Studies #1, #2, and #3. The authors take the students from basic, hands-on sketching to practical research contexts, with opportunities for practice, feedback, and creative thinking. The key areas presented and demonstrated include: Warm-up “The Humble Line;” Icebreaker “Participant Portraits;” Exemplar Sketch Gallery; Visual Language; Applying Sketching in HCI Research & Practice; Without Words; Visual Narratives; Accessibility of Sketches; Digital sketching techniques; Design Fiction & Speculative Scenarios; Sketching with Participants; and Remote sketching techniques. Those who participate are asked to be open-minded and open to sketching exploration as a result, it is hoped, they will leave with the confidence to begin to employ sketching in their own HCI education, research, and practice.
7.2. Course Demographics
The course is directed toward academics (teachers and researchers), industry leaders, and practitioners, students, and early career researchers that have an interest in learning and or improving their sketching skills. Although, it is explicit that there are no prerequisites for attendance, i.e., novices, experts, and those with an interest are welcome to attend. Courses average 120 min in length with between 15 to 50 students, depending on the venue and the size of the event.
7.3. Sketching Pedagogy
7.3.1. Delivery of Sketching Pre-COVID Pandemic
The sketching in HCI courses took a traditional in-person workshop approach to learning and teaching, students were guided through theory and exemplars using PowerPoint presentations, this was intermingled with sketch-a-long demonstrations by the authors using digital projectors, flip-chart, and whiteboards (e.g., Figure 10). Followed by individual and group activities whereby the students would gather around a large table to sketch and discuss the activities or a discussion point provided by the teachers. Students were periodically asked to “show and tell,” hold up their work, provide explanations and decisions with the aim of receiving constructive feedback from fellow students and the teachers (e.g., Figures 11, 12).
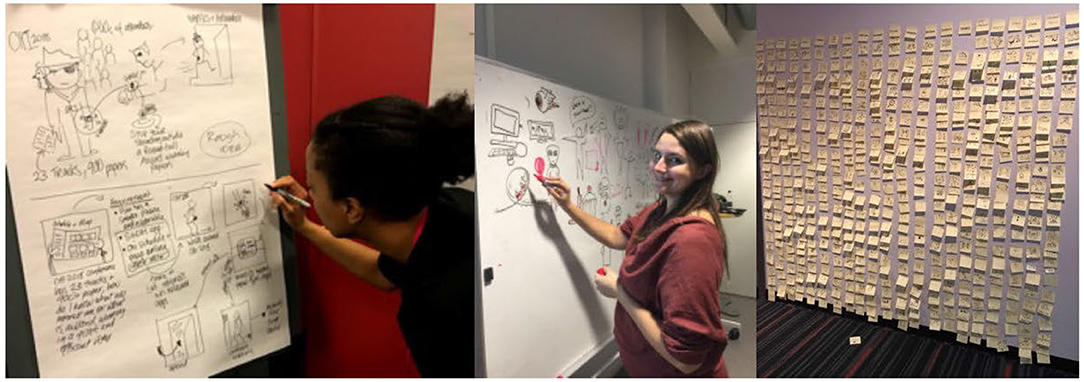
Figure 10. (Left) Makayla Lewis introducing participants to sketching storyboards on paper at CHI 2018 (Middle) Miriam Sturdee digitally sketching figure actions on a whiteboard at NordiCHI 2016 (Right) Exemplar of learners visual icon library wall using post-it notes at CHI 2018.
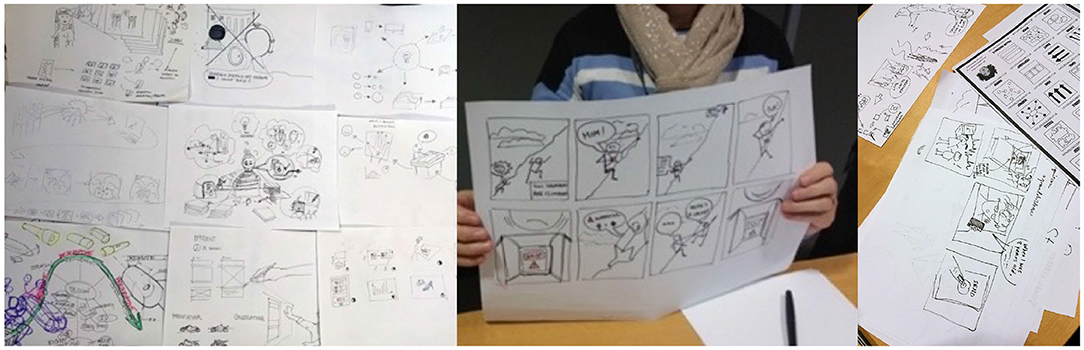
Figure 11. Exemplar outputs from the Sketching in HCI workshop 2018, and courses at NordiCHI 2014, and CHI 2018.
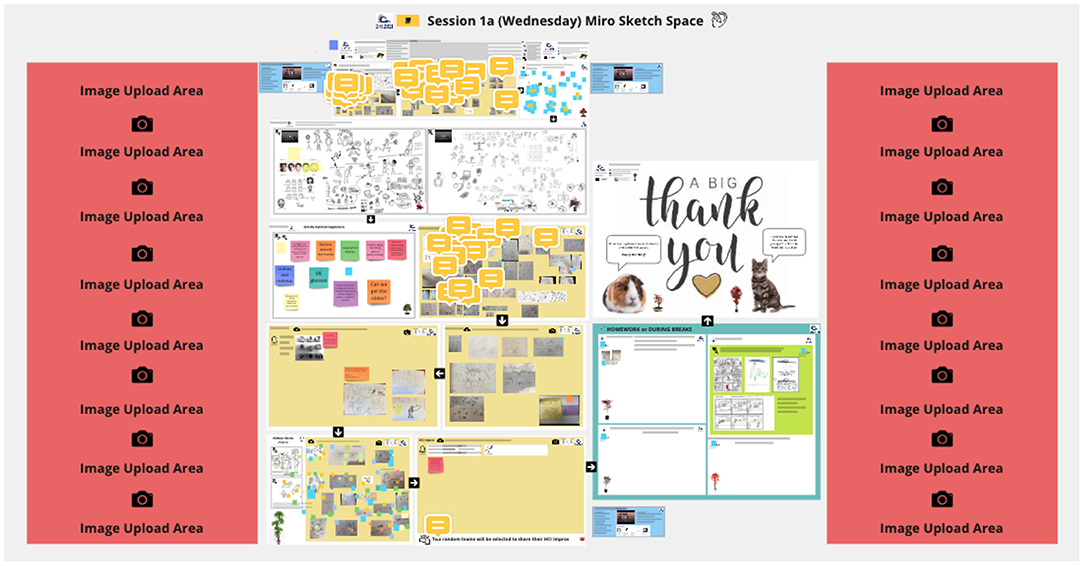
Figure 12. Example interactive Miro board from ACM CHI 2021. Makayla Lewis and Miriam Sturdee, 2021.
Over the years, the courses were well received, the exit survey from CHI 2018: 23 of the 27 participants filled out the survey, and response was very positive: Course was worth the money: 6/7. Course should be offered again: 6.39/7. Course was well taught: 6.57/7. Helpful course material: 6.26/7. Overall, 17 agreed length was just right, 3 too short, and 3 too long.
7.3.2. Embedding Technology During COVID Pandemic
The COVID-19 pandemic meant that many HCI conferences in 2020 and 2021 were either postponed or moved to online only. As a result of the authors successfully transitioning from in-person to online only sketching lectures and workshops (see Case Studies #1, #2, and #3), they were enthused to continue teaching sketching in HCI to the wider community. Thus they successfully submitted to CHI 2021 and HCII 2021 where they conducted three courses with HCI students, practitioners, and researchers from around the world. The courses occurred at varied times (time zones), early hours of the morning, late afternoon, and late evening, with an aim of providing maximum community reach.
Similar to Case Studies #2, and #3, the authors conducted the sketching in HCI courses online, in English, synchronously, using a practiced sketching set up discussed in case study two and three (Figures 2, 7). A digital sketching setup was taken to better support viewability, see Case Study #3, and to allow international audiences to follow and sketch-a-long directly via the Miro board if the video conferencing platform (Zoom, WebEx, and Microsoft Teams) were unclear, either due to student technical issues or low internet connectivity (bandwidth). As per Case Study #3, Miro was used to deliver the courses: locks, timers, comments, emojis, and timer music was used to support students' presence and engagement (e.g., see Figure 12).
The online synchronous courses, although different in delivery from the pre-COVID courses, had the same learning outcomes, demonstrations, sketch-a-long's and student activities, with one fundamental difference—two teachers—resulting in greater preparation for a successful delivery. This meant the development of an extensive Powerpoint, 126 slides, presentation of which 20% of the slides were visible to students, and the remaining being teachers timings and prompts. One author was responsible for the screen sharing of the Powerpoint, teachers took equal turns to present theory and exemplars, and video conferencing chat moderation whilst the other teachers was responsible for screen sharing sketching demonstrations, by both teachers, on the Miro board and moderation of Miro comments and emojis (see Figure 12). To further support the duel-delivery, the course's Miro board underwent alterations precisely in the area of supporting students flow:
• Action colour key white teachers sketch demonstration area; yellow teacher and student interaction area; green homework or break time activities area; blue Miro training and support; orange learner questions and comments and teacher feedback), and black arrows (to depict where to go next on the board);
• Iconology camera photograph your work, upload add your work to a specific area of the board, and pencil sketch a long.
• Sketch upload a red area was added to allow students to upload and resize their sketches without impacting others on the board.
These alterations were as a result of observed issues from joint lecture, sketching interactions and gestures, run by both authors as part of Case Study #3 (see Figure 8) and help to support a smooth, timely, and logical delivery of the courses (see Figures 13, 14 for exemplar outputs).
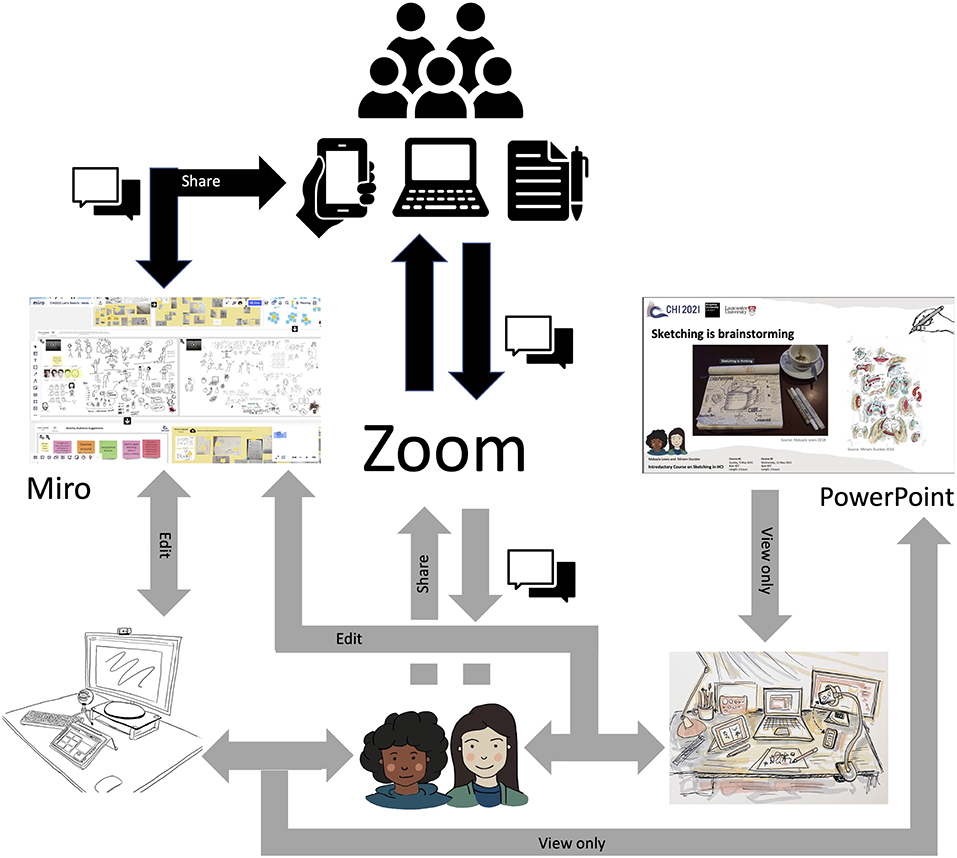
Figure 13. ACM CHI 2021 delivery setup. Makayla Lewis and Miriam Sturdee, 2021.
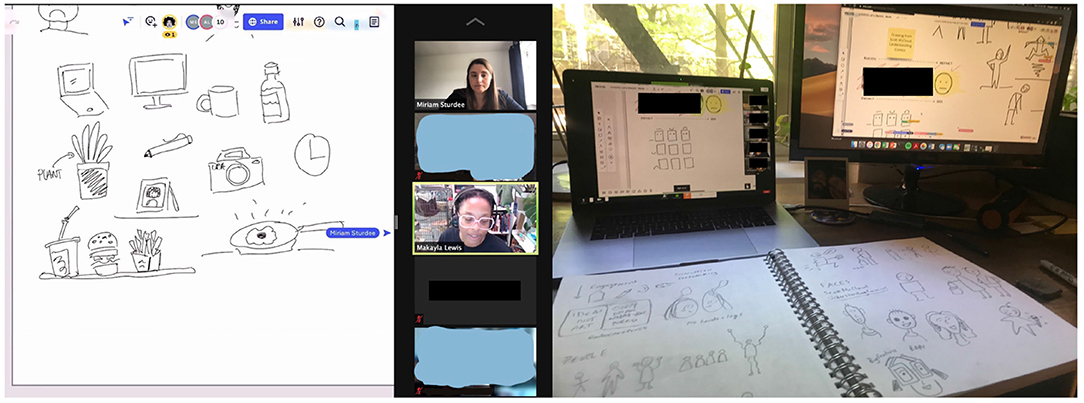
Figure 14. (Left) ACM CHI 2021 delivery setup from student perspective. Andrés Lucero, 2021. (Right) ACM CHI 2021 delivery setup from student perspective. Maggie Jack, 2021.
7.4. Results and Learner Feedback
Upon comparison, the greatest differences between online and in-person teaching and learning that were observed by the authors included, students fear of sharing images digitally especially in relation to peer judgement, in a space were community building is limited, meant they were less trusting and thus share their sketches; and students engaged less consistently perhaps due to demands of working from home or in distracting spaces, e.g., children and pets were often seen and heard and in some instances everyday household noises and external factors, such as deliveries, traffic, and planes, were present. Despite these observations, feedback from the students, via social media during and post courses, was positive, e.g., “Despite it being 4:30 in the morning here, having lots of fun at the #chi2021 course ‘Let's Sketch! A Hands-on Introductory Course on Sketching in HCI’ with the wonderful [author] and [author],” and “Such fun sketching at virtual chi! I want more hands-on virtual workshops :) thanks for the cool course [author] and [author] #chi2021.”
Although, the online delivery was well received, the authors determined that in-person courses can be beneficial, it is easier to circulate the space and offer feedback and encouragement “in the minute;” humour during the course was important—the teachers tried to be fun and engaging but found “the room” is easier to read when in-person, students often had their webcams and microphones off thus receiving visual and auditory feedback was difficult. The authors found it much harder to cover the learning objectives, discovering that a three-quarter day sketching course would be far more draining, both physically and emotionally, online than in-person. However, online delivery setup allowed the authors to demonstrate and collaborate sketching simultaneously in the same Miro area, an aspect not possible when sketching using analogue tools. Furthermore, there is now permanent online record and textual feedback online meaning learners can revisit their work and the course in a way not possible in-person although some students were uncomfortable with this aspect thus deleted their shared sketches post course. Finally, the authors identified that online courses are cheaper to run and easier to meet and teach with students all over the world who might have not attended CHI previously due to its in-person format, thus community reach was the highest ever observed in the last six years.
8. Reflections
8.1. Motivations and Approaches
These case studies have provided four widely varying approaches to embedding and delivering sketching pedagogy within formal and informal HCI and UX education. Although Case Studies one and two embed sketching within a particular module to differing degrees (Case Study #1 is about 40% sketching based; Case Study #2 is about 10–15% sketching based) it is still an important part of learning outcomes. As learners specialise, as seen in the postgraduate (Case Study #3) and peer-to-peer courses (Case Study #4), there is more scope to embed further educational experiences.
We believe, through observation and literature, that undergraduate and postgraduate students, and to some extent, peer-to-peer learners in the space of HCI and UX have often not picked up a pen or pencil since school, yet find themselves in an degree course or industry that values the “soft skill” of sketching and visual communication. Those that have maintained an active interest in the arts are at an advantage in roles where creativity is valued, thus we find ourselves either teaching students who need to be educated as to WHY sketching is valuable, or learners who KNOW it is a valuable skill and are motivated to learn and refine it. Therefore our approaches to each of these groups differ.
Undergraduates in computer science have more recently “put down their pencils” and been funnelled down a particular learning route where they are told that they don't need to write, draw, or engage creatively. Part of the pedagogy for sketching in this demographic is explanation and demonstration of use—HOW is sketching used in industry, WHERE are the links to other modules in the course, WHY is it important in HCI and UX. Once you can instill the need for the skill, then the students are more willing to engage, this was seen for both the first and second year undergraduates. Removing barriers to sketching for this demographic is also vital—they will not have their own tools and these should be provided, they also are more afraid to share their work as they have been told they are not “artistic” at school, or have perceptions that only photo-realism and accuracy matter. The most important lesson here is to tell students to embrace their inner child and let go of preconceptions—leading by example is key here—if the teacher shows themselves to make mistakes, draw a skewed hand, laugh at themselves, they break down that most important barrier. A sketch, and the act of sketching, is not art, it is a fast, loose and creative method.
For postgraduate students in UX design (Case Study #3) the issues faced are similar to undergraduate students although more ingrained, these students often have a strong preconceived idea that analogue sketching is of limited value and as such should be kept to a minimum or skipped in favor of high-fidelity digital prototyping tools. For example, the author found it challenging to get students to engage in low-fidelity paper prototyping as there were preconceived notions that it was a waste of time and working directly in digital mid- and high-fidelity prototyping tools, such as Figma12 and Adobe XD13, as an initial step would be more appropriate. Students had to be convinced, through practice and application, that sketching as a visual medium that will allow them to develop their ideas through exploration and consideration of multiple designs and the examination of their pros and cons, it would support them to be quick and plentiful with their ideas without requiring much effort, time, or resources (Sturdee et al., 2018) and14. Through the integration of a halfway tool, Marvel POP, the author was able to support the students to begin the exploration of sketching, once their paper prototype became digitally clickable they were “sold” on the idea as they could see the many possibilities they had explored on scrap pieces of paper and post-it notes that littered their at home workspaces, and group Miro boards, thus were willing to explore, practice, and apply sketching to other areas of the design thinking process.
The peer-to-peer groups (Case Study #4) the authors approach differ largely from the undergraduate and postgraduate student groups in that they are highly motivated to engage with sketching, and have sought out the opportunity, often paying for the privilege. They are usually post-formal education or studying for their PhD (and sometimes postgraduate). Having been through years of formal education they are aware of their strengths and weaknesses, and are more willing to put their work in the public space (although this is more likely in the in-person setting). Those in industry (and usually research) have seen the benefits of sketching skills first hand and aim to add them to their skill-set to use proactively in their own work. That is not to say that they do not need to be told how to begin, and about relevant tasks and methodologies, and there is usually some resistance to starting small, but the use of ice breaker activities such as scribbling or “draw your neighbor” forces learners to make a start—overcoming the fear of the blank page. The authors sketch-a-long also provides a focus, and prevents learners from fixating on their own shortcomings (or lack of).
8.2. Accessibility in Sketching Pedagogy
We live in a world where there are one billion people with disabilities15. In the space of education, inclusive learning and teaching we seek to remove the barriers and challenges that create undue effort and separation of students and learners with disabilities, to enable all students and learners to participate in learning equally and independently. Furthermore, the UK Equality Act (2010)16 requires teachers to ensure materials and resources produced for students are accessible. As teachers, we wanted students and learners to engage in the sketching knowledge we share easily and confidently. To do this we often deploy practices that support better engagement with our materials. Our sketching lectures, workshops, and courses are designed and delivered to be attended by, and accessible to, as many people as possible. We use plain text and clear speech which is simple to understand and in English. When teaching online, we also share imagery with appropriate Alt Text and color contrast. We clearly verbalise all sketching demonstrations, outline easy to follow tasks and timelines, and at an appropriate speed. When working online, we ask that conferences allow remote attendees to have access to conference platform closed captioning, and set up the virtual collaboration whiteboard (Miro) to allow for zoom in up to 300% without problems, and ensure that keyboard navigation is supported. Throughout the sessions we also provide opportunities for support, questions, and comments—regardless of in-person or online delivery.
As the sketching lectures, workshops, and courses have developed over multiple iterations, we have expanded our format to include a comprehensive section on sketching and accessibility. Writing Alt-text17 for example, for students and learners, can present a barrier, a closed door some may put it, imagery that omits Alt Text mean learners who are unable to perceive imagery due to a disability, e.g., blind, visually impaired or a specific cognitive impairment, cannot obtain the benefits of such visual practices as their peers. Alt Text, alternative text, is an important practice all teachers should be aware of and well-rehearsed. We appreciate that Alt Text can be difficult to do well, and we take students and learners through the process of writing this for their own sketches. We also advise on the clarity of images, for example, when drawing arrows a “filled” arrowhead is easier for people to parse.
8.3. Future Approaches
Sketching needs time, space and reflection. One particular reflection (Case Study #1) noted how the quality and engagement for sketching went up when the time to complete tasks was extended, or the number of tasks was reduced, whereas the poor engagement in Case Study #2 was partially due to the short time slot allowed for sketching, and the difficulties of sharing and being seen for the in-person sessions. The online module and courses (Case Study #3 and #4) for peer-to-peer learning also became time and content constricted when they were moved to online, and content had to be adjusted significantly—however, it was not possible to reduce the time taken for the module or course without altering fundamental aspects of the learning—for example the visual vocabulary, or the accessibility. Despite this, the move to online-only teaching has been an opportunity as well as a challenge, and opened up sketching to a wider audience, and actually increased undergraduate and postgraduate student engagement.
For our own courses, allowing for increased time and space for sketching will be of the utmost importance so that our students and peer-to-peer learners get the most out of them. In particular, the online/remote approach should be streamlined for hands-on, creative teaching, and regular investigation and discovery of new online tools and potentials undertaken. The use of teaching assistants is valuable for in person settings, to encourage and support and maintain momentum, but online, the approach is often singular, and this means it is difficult to maintain live sketching, dialogue, administration, Miro management and slides at the same time without an elaborate set-up, or missing some aspects of the presentation. Existing video conferencing tools, e.g., Microsoft Teams, Zoom, and WebEx, have some remit to show a camera and slides and are beginning to implement a plug-in for popular collaboration tools, specifically Miro18, but it is difficult to present fluidly. For user interface designers, there is an opportunity here, to further explore online conferencing software and hardware, such as OBS19 and Elgato 10GAI9901 Stream Deck Mini20, for sketching pedagogy which explicitly supports multiple outputs, inputs, interactions, and allows for resizing and placement of windows at desired points, this would support various video feeds, devices and maintain that face-to-face interaction that is so vital for our remote teaching.
As we move more to blended teaching and learning, often referred to as hybrid learning, embedding online technology into pedagogy for sketching re sketching theory and application in an in-person environment using a mixture of analogue and digital sketching tools. We encourage teachers in the area of sketching in HCI and UX to embrace visual whiteboards to structure and present their sessions and allow students to share and provide peer to peer feedback in a virtual space with the aim of improving their social presence in the classroom.
Finally, an additional potential method for addressing both confidence in sketching for all groups, and also motivating participation might be to embrace gamified approaches to teaching, such as Williford et al.'s Persketchtivity (Williford et al., 2016) or ZenSketch (Williford et al., 2019) where learners can “play” at line accuracy. Although this particular study used the game tool as an extracurricular activity, it could also be brought into the classroom. Game based approaches might have a particular appeal to the undergraduate demographic who are more likely to have the time and motivation for gaming.
8.4. Final Thoughts
Sketching is a valuable skill in HCI and UX especially when creating a foundational understanding and application, it requires different approaches to planning and delivery depending on the audience. Sketching in HCI and UX works well both in person and online, both approaches have advantages and disadvantages. Despite the advent of digital approaches as a result of COVID-19 pandemic and the ongoing move to blended/hybrid sketching pedagogy the fundamental skill and practice has always persisted and will continue to be as valuable today, as it will be tomorrow.
Data Availability Statement
The original contributions presented in the study are included in the article/supplementary material, further inquiries can be directed to the corresponding author/s.
Ethics Statement
Written informed consent was obtained from the individual(s) for the publication of any potentially identifiable images or data included in this article.
Author Contributions
All authors listed have made a substantial, direct, and intellectual contribution to the work and approved it for publication.
Funding
The publication of this work was funded by the School of Computer Science and Mathematics at Kingston University London.
Conflict of Interest
The authors declare that the research was conducted in the absence of any commercial or financial relationships that could be construed as a potential conflict of interest.
Publisher's Note
All claims expressed in this article are solely those of the authors and do not necessarily represent those of their affiliated organizations, or those of the publisher, the editors and the reviewers. Any product that may be evaluated in this article, or claim that may be made by its manufacturer, is not guaranteed or endorsed by the publisher.
Acknowledgments
We would like to thank our students and learners from our university modules and conference courses without which our exploration and learning would not have been possible. We would like to thank Oliver King, Indre Aruodziute, Andrés Lucero, and Maggie Jack for allowing us to include their original sketches and photographs in this paper. We would also like to thank course leaders and fellow HCI and UX colleagues for their support and advise in the delivery of these case studies.
Footnotes
1. ^www.ted.com/talks/sir_ken_robinson_changing_education_paradigms
2. ^www.web.stanford.edu/~mshanks/MichaelShanks/files/509554.pdf
3. ^www.nextgenpsf.co.uk/ngs-toolkit
5. ^www.instructure.com/en-gb/canvas
6. ^www.microsoft.com/en-gb/microsoft-teams/group-chat-software
7. ^www.support.microsoft.com/en-us/office/overview-of-teams-and-channels
8. ^www.wacom.com/en-gb/products/pen-displays/wacom-one
9. ^www.sketchinghci.wordpress.com/
10. ^www.2021.hci.international/T04.html
11. ^www.eventbrite.co.uk/e/uxpa-uk-sketching-ux-tickets-173628175547
12. ^www.figma.com/
13. ^www.adobe.com/uk/products/xd.html
14. ^www.interaction-design.org/literature/article/etch-a-sketch-how-to-use- sketching-in-user-experience-design
15. ^www.un.org/development/desa/disabilities/resources/factsheet-on-persons- with-disabilities.html
16. ^www.legislation.gov.uk/ukpga/2010/15/contents
17. ^www.webaim.org/techniques/alttext/
References
Almendingen, K., Morseth, M. S., Gjølstad, E., Brevik, A., and Tørris, C. (2021). Student's experiences with online teaching following covid-19 lockdown: a mixed methods explorative study. PLoS ONE 16, e0250378. doi: 10.1371/journal.pone.0250378
Andreasen, N. C. (2012). Creativity in art and science: are there two cultures? Dialogues Clin. Neurosci. 14, 49. doi: 10.31887/dcns.2012.14.1/nandreasen
Bares, W., Manaris, B., and McCauley, R. (2018). Gender equity in computer science through computing in the arts–a six-year longitudinal study. Comput. Sci. Educ. 28, 191–210. doi: 10.1080/08993408.2018.1519322
Bergström, I., and Blackwell, A. F. (2016). “The practices of programming,” in 2016 IEEE Symposium on Visual Languages and Human-Centric Computing (VL/HCC) (Cambridge: IEEE), 190–198.
Brown, Q., Lee, F., and Alejandre, S. (2009). “Emphasizing soft skills and team development in an educational digital game design course,” in Proceedings of the 4th International Conference on Foundations of Digital Games (New York, NY), 240–247.
Castro, S. J., Jácome, L., Concha, A. G., Vásquez, J., Londa, G., Córdova, L., et al. (2018). “An undergraduate project combining computer science and the arts: an experience report of a multidisciplinary capstone design,” in Proceedings of the 7th Computer Science Education Research Conference (New York, NY), 1–8.
Cohn, N. (2012). Explaining ‘i can't draw’: parallels between the structure and development of language and drawing. Hum. Develop. 55, 167–192. doi: 10.1159/000341842
Cottam, M., and Wray, K. (2009). Sketching tangible interfaces: creating an electronic palette for the design community. IEEE Comput. Graph. Appl. 29, 90–95. doi: 10.1109/mcg.2009.51
Diaz-Merced, W. L., Candey, R. M., Brickhouse, N., Schneps, M., Mannone, J. C., Brewster, S., et al. (2011). Sonification of astronomical data. Proc. Int. Astron. Union 7, 133–136. doi: 10.1017/S1743921312000440
Fernández-Fontecha, A., O'Halloran, K. L., Tan, S., and Wignell, P. (2019). A multimodal approach to visual thinking: the scientific sketchnote. Vis. Commun. 18, 5–29. doi: 10.1177/1470357218759808
Frich, J., MacDonald Vermeulen, L., Remy, C., Biskjaer, M. M., and Dalsgaard, P. (2019). “Mapping the landscape of creativity support tools in hci,” in Proceedings of the 2019 CHI Conference on Human Factors in Computing Systems (Glasgow), 1–18.
Goldschmidt, G. (2017). “Manual sketching: Why is it still relevant?” in The Active Image (Cham: Springer), 77–97.
Hetland, L., Winner, E., Veenema, S., and Sheridan, K. M. (2015). Studio Thinking: The Real Benefits of Visual Arts Education. New York, NY: Teachers College Press.
Igarashi, T., Matsuoka, S., and Tanaka, H. (2006). “Teddy: a sketching interface for 3d freeform design,” in ACM SIGGRAPH 2006 Courses (New York, NY), 11–es.
Johnson, G., Gross, M., Do, E. Y.-L., and Hong, J. (2012). “Sketch it, make it: sketching precise drawings for laser cutting,” in CHI'12 Extended Abstracts on Human Factors in Computing Systems (New York, NY), 1079–1082.
Kennedy, R. (2006). Guggenheim study suggests arts education benefits literacy skills. New York Times 27, E1.
Kodama, S. (2008). Dynamic ferrofluid sculpture: organic shape-changing art forms. Commun. ACM 51, 79–81. doi: 10.1145/1349026.1349042
Lewis, M.Coles-Kemp, L., et al. (2014). “A tactile visual library to support user experience storytelling,” in DS 81: Proceedings of NordDesign 2014, 27-29th August 2014 (Espoo), 386–395.
Lewis, M., and Sturdee, M. (2020). “So you think you can't draw? a hands-on introductory course on sketching in hci techniques,” in Extended Abstracts of the 2020 CHI Conference on Human Factors in Computing Systems (New York, NY), 1–4.
Lewis, M., and Sturdee, M. (2021). “Let's sketch! a hands-on introductory course on sketching in hci,” in Extended Abstracts of the 2021 CHI Conference on Human Factors in Computing Systems (New York, NY), 1–4.
Lewis, M., Sturdee, M., and Marquardt, N. (2018). “Applied sketching in hci: hands-on course of sketching techniques,” in Extended Abstracts of the 2018 CHI Conference on Human Factors in Computing Systems (New York, NY), 1–4.
Lewis, M., Sturdee, M., Walny, J., Marquardt, N., Hoang, T., Foster, J., et al. (2019). “Sketchi 2.0: Hands-on special interest group on sketching in hci,” in Extended Abstracts of the 2019 CHI Conference on Human Factors in Computing Systems (New York, NY), 1–5.
McCormack, J., and d'Inverno, M. (2012). “Computers and creativity: the road ahead,” in Computers and Creativity (Springer), 421–424.
Mendonça, P. (2016). Graphic facilitation, sketchnoting, journalism and ‘the doodle revolution’: new dimensions in comics scholarship. Stud. Comics 7, 127–152. doi: 10.1386/stic.7.1.127_1
Mishra, L., Gupta, T., and Shree, A. (2020). Online teaching-learning in higher education during lockdown period of covid-19 pandemic. Int. J. Educ. Res. Open 1, 100012. doi: 10.1016/j.ijedro.2020.100012
Nakakoji, K., Tanaka, A., and Fallman, D. (2006). “‘sketching’ nurturing creativity: commonalities in art, design, engineering and research,” in CHI'06 Extended Abstracts on Human Factors in Computing Systems (New York, NY), 1715–1718.
Nielsen, J. (1994). “Enhancing the explanatory power of usability heuristics,” in Proceedings of the SIGCHI Conference on Human Factors in Computing Systems (New York, NY), 152–158.
Norman, D. A. (1986). User Centered System Design: New Perspectives on Human-Computer Interaction. Hoboken, NJ: CRC Press.
Osguthorpe, R. T., and Graham, C. R. (2003). Blended learning environments: definitions and directions. Quart. Rev. Dist. Educ. 4, 227–33. doi: 10.4018/978-1-59140-555-9.CH024
Paepcke-Hjeltness, V., Mina, M., and Cyamani, A. (2017). “Sketchnoting: a new approach to developing visual communication ability, improving critical thinking and creative confidence for engineering and design students,” in 2017 IEEE Frontiers in Education Conference (FIE) (Indianapolis, IN: IEEE), 1–5.
Parks-Stamm, E. J., Zafonte, M., and Palenque, S. M. (2017). The effects of instructor participation and class size on student participation in an online class discussion forum. Brit. J. Educ. Technol. 48, 1250–1259. doi: 10.1111/bjet.12512
Roam, D. (2013). The Back of the Napkin: Solving Problems and Selling Ideas With Pictures. Portfolio.
Shank, R. C. (1995). What we Learn When we Learn by Doing. Northwestern University, Evanston, IL, United States. Available online at: http://cogprints.org/637/
Shneiderman, B. (2007). Creativity support tools: accelerating discovery and innovation. Commun. ACM 50, 20–32. doi: 10.1145/1323688.1323689
Sturdee, M., and Lewis, M. (2020). “Sketching in hci: Research practice & publication (advanced),” in Extended Abstracts of the 2020 CHI Conference on Human Factors in Computing Systems (New York, NY), 1–4.
Sturdee, M., Lewis, M., and Marquardt, N. (2018). Feeling sketchi? the lasting appeal of the drawn image in hci. Interactions 25, 64–69. doi: 10.1145/3274562
Sturdee, M., and Lindley, J. (2019). “Sketching & drawing as future inquiry in hci,” in Proceedings of the Halfway to the Future Symposium 2019 (New York, NY), 1–10.
Tufte, E. R., and Graves-Morris, P. R. (1983). The Visual Display of Quantitative Information, vol. 2. Cheshire, CT: Graphics Press.
Wallace, J., Rogers, J., Foster, J., Kingsley, S., Koulidou, N., Shorter, E., et al. (2017). Scribing as seen from the inside: the ethos of the studio. Design Issues 33, 93–103. doi: 10.1162/DESI_a_00454
Walny, J., Haber, J., Dörk, M., Sillito, J., and Carpendale, S. (2011). “Follow that sketch: Lifecycles of diagrams and sketches in software development,” in 2011 6th International Workshop on Visualizing Software for Understanding and Analysis (VISSOFT) (Williamsburg, VA: IEEE), 1–8.
Wands, B. (2007). “Art of the digital age,” in Art of The Digital Age (New York, NY: Thames and Hudson). p. 52.
Williford, B., Runyon, M., Cherian, J., Li, W., Linsey, J., and Hammond, T. (2019). “A framework for motivating sketching practice with sketch-based gameplay,” in Proceedings of the Annual Symposium on Computer-Human Interaction in Play (Barcelona), 533–544.
Williford, B., Taele, P., Nelligan, T., Li, W., Linsey, J., and Hammond, T. (2016). “Persketchtivity: an intelligent pen-based educational application for design sketching instruction,” in Revolutionizing Education With Digital Ink (Cham: Springer), 115–127.
Keywords: sketching, user experience, design thinking, visual thinking, education
Citation: Lewis M and Sturdee M (2022) Curricula Design & Pedagogy for Sketching Within HCI & UX Education. Front. Comput. Sci. 4:826445. doi: 10.3389/fcomp.2022.826445
Received: 30 November 2021; Accepted: 23 February 2022;
Published: 01 April 2022.
Edited by:
Anirudha Joshi, Indian Institute of Technology Bombay, IndiaReviewed by:
Cesar Collazos, University of Cauca, ColombiaJayesh S. Pillai, Indian Institute of Technology Bombay, India
Copyright © 2022 Lewis and Sturdee. This is an open-access article distributed under the terms of the Creative Commons Attribution License (CC BY). The use, distribution or reproduction in other forums is permitted, provided the original author(s) and the copyright owner(s) are credited and that the original publication in this journal is cited, in accordance with accepted academic practice. No use, distribution or reproduction is permitted which does not comply with these terms.
*Correspondence: Makayla Lewis, m.m.lewis@kingston.ac.uk; Miriam Sturdee, m.sturdee@lancaster.ac.uk
†These authors have contributed equally to this work