What Makes Interactive Art Engaging?
 Michael Krzyzaniak
 Çağri Erdem
 Kyrre Glette
- RITMO Centre for Interdisciplinary Studies in Rhythm, Time and Motion, University of Oslo, Oslo, Norway
Interactive art requires people to engage with it, and some works of interactive art are more intrinsically engaging than others. This article asks what properties of a work of interactive art promote engagement. More specifically, it examines four properties: (1) the number of controllable parameters in the interaction, (2) the use of fantasy in the work, (3) the timescale on which the work responds, and (4) the amount agency ascribed to the work. Each of these is hypothesized to promote engagement, and each hypothesis is tested with a controlled user study in an ecologically valid setting on the Internet. In these studies, we found that more controllable parameters increases engagement; the use of fantasy increases engagement for some users and not others; the timescale surprisingly has no significant on engagement but may relate to the style of interaction; and more ascribed agency is correlated with greater engagement although the direction of causation is not known. This is not intended to be an exhaustive list of all properties that may promote engagement, but rather a starting point for more studies of this kind.
1. Introduction
Interactive art is art that you can play with. It responds to the actions of its interactants.1 Such works are typically either visual or sonic in nature, involve digital technology, and respond to the movements, sounds, or input (via a computer interface) of the interactant. This creates a bidirectional flow of information between the interactant and the work. The interactant's actions are, therefore, an integral part of interactive art; the proverbial tree falling in the forest definitely does not make any sound in the absence of observers, if it depends on someone being there to fell it in the first place.
Consequently, the idea of engagement underlies all interactive art. In order for a work to be complete, an observer has to be sufficiently engaged so as to voluntarily perform the actions to which the work responds. This gives rise to the overall question of this article:
What properties should a work of interactive art have in order to promote engagement?
Stated another way, how can these works be designed to be fun, so that people want to interact with them? Engagement may be operationalized as the amount of time that people spend voluntarily interacting with such works. So how can a work be designed to maximize the amount of time people spend interacting with it?
The amount of time people spend looking at art in general has been studied. A seminal study in Smith and Smith (2001) found that museum visitors spent 27.2 s on average (with a median of 17.0 s) looking at individual paintings, including the time spent reading the accompanying label. A larger 2017 followup study replicated these findings (Smith et al., 2017), with no significant differences as compared to the first study. The followup, which was conducted after the invention of smartphones, additionally found that some visitors took selfies with paintings without actually viewing the paintings, which at least suggests that the presence of digital technology can change how people engage with art. In both studies, the authors observe that some paintings were viewed for significantly longer than others. However, they do not examine whether there are intrinsic properties of the paintings that may account for this, although they do note that it may relate to the presence or absence of seating near the painting.
Engaging properties of other types of systems have been studied. Seminal studies by Malone (1981) investigated this question with regard to educational computer games for children. The studies found that to promote engagement, games should have a goal with uncertain outcomes, should make use of fantasy, and should promote curiosity via an optimal level of information complexity. Games, however, differ from interactive art in the following way: Games by definition have fixed goals where players try to achieve something specific that is known beforehand. Interactive art, by contrast, either has no goals, or emerging ones, and interactants are supposed to interact for the sheer moment-to-moment pleasure of doing so. Consequently, it is not clear how well these principles translate to interactive art, although further analysis is presented in section 3 below.
Since then, a healthy literature has emerged on fun and enjoyment in computer systems. A considerable amount of this work is compiled in the 2002 book Funology (Monk et al., 2002), and its 2018 followup Funology 2 (Blythe and Monk, 2018). These contain studies on computer games (Pagulayan et al., 2003), dating apps (Zytko et al., 2018), information displays (Ljungblad et al., 2003), and other types of computer systems. Dating apps and information displays are tools in the sense that people use them in order to accomplish something, whereas interactive artworks are toys in the sense that there is no external reason to use them. Tools undoubtedly promote engagement differently than toys. Regarding toys, in Sykes and Wiseman (2003), the authors argue that fear is fun, and they demonstrate this by presenting a “haunted” VR experience at a science festival. Similarly, in Fernaeus et al. (2018), the authors posit that bodily movement promotes enjoyment, and they support this by presenting several systems that they designed to illustrate the point. These include interactive artworks, for example a lamp that follows your breathing. However, neither paper presents a controlled experiment that shows that people actually enjoy fear or movement more than some baseline systems. In fact, out of the 38 articles on how to design fun and engaging computer systems in Blythe and Monk (2018), many of them, for example (Overbeeke et al., 2003), contain very specific opinions about what properties of a system promote engagement; yet only three or four of them (Karat et al., 2002; Desmet, 2003; Pagulayan et al., 2003; Rosson and Carroll, 2018) substantiate those opinions with a controlled quantitative experiment similar to the Malone studies, and those are not about interactive art.
The artist Brigid Costello compiled a comprehensive theoretically grounded list of properties that make interactive art pleasurable (Costello and Edmonds, 2007). The list contains, e.g., creation, exploration, discovery, difficulty, et cetera. She designed a new work called Just a bit of Spin to make use of these properties, and showed it in a museum. However, she noted that although visitors explored the work, they did not play with it. In a followup study (Costello and Edmonds, 2009), she hypothesized that this was due to the work's low complexity, although complexity was not on the original list of properties. After redesigning the work to be more complex, she found that museum visitors did spend more time interacting with it as compared to the original version. In Bongers and Mery (2011), displayed an interactive artwork in a museum and collected participant data. They found that visitors spent about a minute on average interacting with the artwork. The visitors spent a portion of this time engaging in behaviors that were not designed parts of the interaction. The authors in particular note social behaviors, like the visitors explaining the work to one another, and arguing with one another over the use of the interfaces that control the work.
For the sake of completeness, it is worth pointing out that the perverse way to maximize the amount of time people spend interacting with digital systems is to get them addicted by exploiting human psychology. This technique has been highly optimized by both the video game and social media industries, which have an incentive of hundreds of billions of dollars annually2,3 to encourage addiction. For example, the use of rewards to maximize dopamine production is a well researched topic (Sapolsky, 2017) that is often exploited in games, e.g., through the use of gradually diminishing rewards.4 Likewise, social media sites actively remove cues that users would use to monitor their own usage, for example through the use of infinite scroll (Chou et al., 2005). Although similar techniques could undoubtedly be applied to interactive art, seeking to addict a user is different than seeking to engage them, even if these are both operationalized by duration of interaction. The difference is that in an engaging system, the user spends time for their own benefit, for their own leisure or edification, while in an addicting system, they spend their time for someone else's benefit and even to their own detriment, e.g. because their time is being monetized by a corporation. So while it is well studied how to addict people, it is less well known how to engage them in a healthy and edifying context such as is provided by art.
In light of the foregoing observations, the present paper provides a starting point for understanding how certain properties of an interactive artwork relate to the way an interactant voluntarily engages with it. Four separate studies are presented herein, each examining a different property. The first study pertains to the number of controllable parameters of a work of interactive art; the second to the use of fantasy in the work; the third to the timescales on which the work responds to input; and the fourth to the amount of agency an interactant ascribes to the work. This is not intended to be an exhaustive list of properties that might promote engagement, and are just a few of the properties that the authors have observed to be present in varying degrees in real work of the genre. The studies were conducted by posting bespoke interactive artworks on the internet where visitors were able to interact with them in an ecologically valid setting. This technique, which will be described in greater detail anon, has been fruitful and could be used to explore other properties in the future.
2. Study 1—Number of Controllable Parameters
Different works of interactive art have different numbers of controllable parameters, where a degree of freedom is a parameter that the visitor can adjust. The work of Brigid Costello discussed in the introduction illustrates this clearly. The piece consists of a disk that interactants can spin to play recorded sounds. The original version has two controllable parameters; the direction of spin selects which recordings will be played back, and the speed of spin controls the speed of audio playback. The second version of the work introduced a “scratching” gesture that allowed interactants to cycle through different sets of recordings, providing an additional degree of freedom. As another example, consider tabletop user interfaces. Sandscape by the Tangible Media group at MIT (Ishii et al., 2004), in its most well-known form, is a sandbox with a heightmap of the sand projected onto it from above.This effectively has one macroscopic degree of freedom; the height of the sand controls the color of the projection. By contrast, Reactable by the Music Technology Group at UPF (Jordà et al., 2005) has many controllable parameters. Users create sound by placing fiducial markers on a table. A marker's type, location, orientation, and distance to other markers can control the waveform, frequency, amplitude, and other properties of the sound. Some markers can modify the sounds of other markers, e.g., via frequency modulation or filtering, with the relevant parameters also controllable. This results in a large number of controllable parameters. This raises the research question for Study 1:
Do users engage longer with interactive artworks that have more controllable parameters?
2.1. Design
To test this question, I designed the widget shown in Figure 1. The widget was created using common web technologies and runs in any modern web browser at the time of writing. It consists of a canvas that displays a procedurally-drawn animation, two buttons, and a bank of sliders. At each frame of animation, a new ellipse is drawn on the canvas. The hue, rotation angle, and location of the ellipses vary over time, with the ellipse locations broadly wandering around the canvas following a Lissajous curve. The sliders allow visitors to adjust the animation parameters, the size of the ellipse, the speed at which it progresses around the canvas, and so forth. Additionally, if a visitor clicks (or touches) the canvas, the ellipse locations will orbit the cursor (or finger) instead of following the Lissajous curve, and will be drawn in grayscale instead of color. Of the two buttons, one allows visitors to clear the canvas, making it entirely white, and another that allows visitors to save the canvas as it currently appears to their computers as a regular image file.
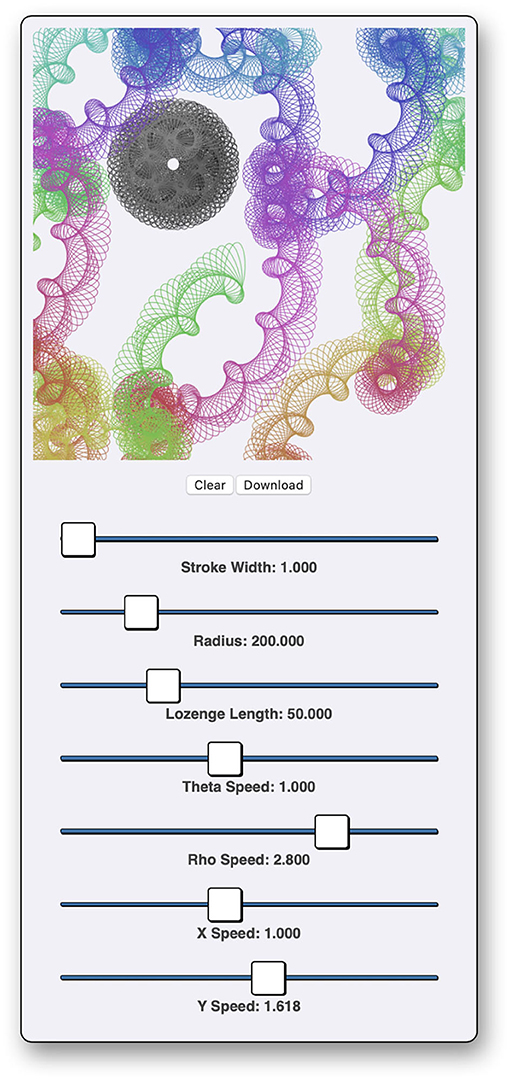
Figure 1. The widget used in Study 1.
Participants in the study were assigned randomly to one of two conditions, called sliders and no-sliders. Visitors in the sliders condition were presented the interface exactly as it is shown in Figure 1. Visitors in the no-sliders condition were presented an identical interface, except the sliders were hidden and the associated parameters could not be adjusted, representing a reduced number of controllable parameters. I kept track of each web browser that visited the page, so if the same browser visited more than once, it would be presented the same condition each time. The widget is available for reference on the internet, and the individual conditions can be accessed via the following URLs.
1. https://michaelkrzyzaniak.com/Fun/?w=Cool_Artwork_UiO&c=0
2. https://michaelkrzyzaniak.com/Fun/?w=Cool_Artwork_UiO&c=1
2.2. Data Collection
I posted this widget to my biography page on the University of Oslo website. I removed all other content from the page, except for the standard navigational elements belonging to the enclosing page template. I recorded the amount of time each visitor spent on the page, along with other standard analytics data, which I describe in more detail in section 2.3, below. I did not collect any personally identifying information nor IP addresses. All visitors to this page had already consented to the university's cookie policy, which covers the collection of non-identifying analytics and usage-pattern data. This provided the most natural and ecologically valid setting for the study. I recruited participants first by sending a hyperlink to a small mailing list of a limited number of my colleagues, alerting them that I had made a fun diversion for them to play with during the 2020 university closure, which was in effect at the time the study was conducted. Subsequently I included a prominent hyperlink to my bio page at the bottom of all emails that I sent to anyone. Over time this was a reliable way of recruiting participants.
2.3. Data Preprocessing
Because the study was conducted “in the wild,” the data are somewhat messier than they would be in a laboratory study, and consequently I was obligated to make decisions about how they should be filtered. In this study, I applied the following preprocessing steps to the data in exactly this order:
1. I monitored the user-agent string for search indexing bots. No data was collected from a bot that declared itself as such, although it is likely that some bots can and do execute javascript and simulate input events. I was not able to collect IP addresses because they are personally-identifying, and consequently I was not able to check against lists of known bots. Nonetheless, I do not believe that any data was collected from bots.
2. Some of the researchers associated with the study may have had unrelated reasons to visit my biography page during data collection. In order to exclude their data from the study while maintaining anonymity for all visitors, these researchers were given a special URL. When they visited the URL, the server created a record in the database that marked their browser as belonging to a “developer.” This record allowed all previous and future visits from that browser to be excluded from all studies in this article.
3. I measured the number of seconds each visitor spent on the page, from the time it loaded until they navigated away. From that I subtracted out any period of time when the window was not in focus, e.g., because the visitor had another tab or a different application in the foreground.
4. Because some visitors might have opened the page and left it in focus while wandering off to prepare a sandwich, I also monitored input events on the page, such as moving the mouse over the page, clicking, scrolling, and touching the page. I subtracted out any period of inactivity greater than 10 s in which no input events occurred. I will refer to the amount of time left after making these subtractions as the “active” time the visitor spent on the page.
5. If a browser visited the page within 10 s of having navigated away from it, e.g., because the visitor refreshed the page, I appended the new visit to the previous visit, treating both as a single visit, with the period between visits treated as though the page were not in focus.
6. Some visitors spent an implausibly short period of time on the page, with two visitors spending only 2 s each. These visits were consistent with browsers pre-loading the page in the background without the visitor ever actually navigating to the page. Moreover, because the animation started automatically on page load, real visitors could enjoy it without clicking on anything or performing other trackable activities. This was a flaw in the study design that meant that for very short visits in particular, it was in some cases impossible to determine whether the page was actually displayed to the visitor. Consequently, I removed all visits that were less than 20 active seconds in duration, which removed the ambiguous cases. The remaining studies in this paper corrected this design flaw, by making visitors perform some action that proves that they interacted with the widget.
7. Some browsers visited the page more than once, e.g., on different days. In the canonical version of this study I only included the first visit from each visitor, so that individual visitors would not have disproportionate influence on the results, and because experienced visitors might interact differently than first-time visitors. As a special case I will also present some analysis on the number of visits per browser, but unless explicitly stated, I only include the first visit per browser.
In total, 28 browsers not belonging to known bots or developers visited the page a total of 44 times during the data collection period, resulting in 31 min and 13 s of active page time. After preprocessing, there were 22 remaining participants, with one visit by each included, totaling 21 min and 42 s of active page time. Ten of these were randomly assigned to no sliders, and 12 to sliders. Only two of these were on touch input devices, one tablet and one mobile phone, both assigned to the sliders condition, while the remainder were all traditional cursor input devices.
2.4. Results
2.4.1. Did the Participants That Were Presented Extra Controllable Parameters Explore Them?
Two out of 12 visitors in the sliders group did not move any of the sliders, although both of them did click the canvas. One of those visitors returned the following day, did move the sliders, and spent longer on the page, however, this second visit was excluded in preprocessing step 7, and one must be careful not to cherry-pick the data that confirms one's hypothesis. From this it stands to reason that people do generally explore the larger state-space provided by the extra controllable parameters when they are available, although not universally.
2.4.2. Did Extra Controllable Parameters Increase the Visitors' Curiosity?
About the same proportion of each group, 6 of 10 participants in the no-sliders group and 6 of 12 in the sliders group, did not click the canvas. There was nothing in the design of the interface that suggested that clicking the canvas would have any effect, nor was doing so necessary to enjoy the piece. Nonetheless, visitors who did so were rewarded with different behavior of the drawing algorithm. I hypothesized that the presence of sliders would make visitors curious to explore whether the canvas was interactive, although this was not the case.
2.4.3. Did Visitors Use the Widget as a Toy, or as a Tool for Making Pictures?
Only 4 participants, two from each group, clicked the “Download” button. This suggests that visitors were generally more interested in the process of interacting with the widget than in the final product of that interaction, i.e., they were using it as a toy and not a tool, as is consistent with the definition of interactive art.
2.4.4. Were the Sliders Engaging?
Participants in the sliders group spent more active time on the page (N = 12, M = 75.25, SD = 45.45) than the those in the no-sliders group (N = 10, M = 39.90, SD = 14.98). The two-tailed Welch's independent-samples t-test for unequal sample sizes shows that this difference is significant, with |t(13.77)| = 2.53, p < 0.04. Moreover, this significance is robust in the sense that any sensible variation on the pre-processing steps yields significant results. For example, subtracting out periods of inactivity greater than 5 instead of 10 s, or excluding preprocessing Step 5, both yield p < 0.04. This demonstrates that the sliders caused people to engage for longer.
2.4.5. Were Engaged Visitors More Likely to Return?
Preprocessing step 7 might not strictly be the correct approach, as one might hypothesize that an engaging interface would encourage people return more frequently. In fact, when we exclude step 7 from preprocessing, we see that the sliders condition had 1.50 visits per participant, while the no-sliders condition had only 1.20 visits per participant. Moreover, the difference in the amount of active page time between the sliders (N = 18, M = 76.17, SD = 41.62) and no-sliders (N = 12, M = 39.08, SD = 13.75) conditions is even more significant, |t(22.11)| = 3.50, p < 0.005, when including multiple visits per participant. This suggests that not only were sliders more likely to return, but when they did return they spent longer than the average on their return visits, while “non-sliders” were less likely to return and spent less time than the average on their return visits. However, the sample size of repeat visitors is small, and thus the observations in the previous sentence are not significant on their own. It could just as well be that a few people who are intrinsically predisposed to visit frequently and spend longer time were assigned to the sliders condition by chance.
2.5. Discussion
These results show that providing extra controllable parameters does make interactive art more engaging. However, it is not clear what the limit is; certainly visitors could not be engaged for any arbitrarily long period of time simply by supplying an appropriately large number of controllable parameters. Moreover, one may note that the no sliders condition effectively had 0 controllable parameters for visitors who did not click the canvas. Further research is needed to determine the curve that relates engagement to controllable parameters.
3. Study 2—Fantasy
Some but not all interactive artworks incorporate fantasy. Malone (1982) defined fantasy in this context as the showing or evoking of “images of physical objects or social situations not actually present”. I will adopt the somewhat broader definition that fantasy is the evoking of anything that is not actually present. Malone showed that fantasy is a powerful tool for engagement in educational computer games, with the caveat that the fantasy must appeal to the particular visitor. In the domain of interactive art, many responsive environments make clear use of fantasy. In Connected Worlds at The New York Hall of Science (Mallavarapu et al., 2019), virtual “water” is projected onto the floor, and visitors can change how it flows by placing real physical obstacles in its path. The fantasy is that there is real water flowing. In Born From the Darkness a Loving, and Beautiful World (Sisyu + teamLab, 2018), the fantasies are more abstract. Visitors can interact with projected animations of text, flowers, butterflies, and lightning as if they were tangible. The fantasy is that these objects are tangible. Other responsive environments do not make use of fantasy. In Fibres Out of Line (Krzyzaniak et al., 2021), visitors can make a room full of robots play music by moving around in front of a camera. Although some of the robots are fanciful in appearance, the visitors are not meant to imagine anything beyond what is physically present. This raises the research question for Study 2:
Does the presence of fantasy make interactive art more engaging?
3.1. Design
In a previous paper, I describe a words-to-music synthesizer that I designed (Krzyzaniak, 2020), and it occurred to me that it could be repurposed to test fantasy in the context of interactive art. The interface to the synthesizer is depicted in Figure 2. There is a text-input field that initially reads “Enter Some Descriptive Text,” and there is a graph that shows some default words plotted according to their valance & arousal (sentiment). Visitors can enter words into the text input field, and the software computes and plots the emotional valence and arousal of each word individually, replacing the default words, as well as an average valence and arousal score for all of the words taken together (the pink dot). At any point, the visitor can press the Play button, and the software will synthesize music in real time that ostensibly matches the average valence and arousal score of the text. Additionally, visitors can directly adjust the musical features using a bank of sliders, or they can manually set the valence and arousal of the music by dragging the pink dot around within the valence & arousal plot, which in turn moves the sliders to some empirically determined values. In order to test the effect of fantasy on engagement, I used this interface as the basis of a new study with two conditions, which I will call words and no-words. In the words condition, visitors were presented exactly the interface shown in Figure 2. The no-words condition was identical, except that the text input field at the top was not present, and no words were ever plotted in the valence/arousal widget. The theory is that the presence of the text input box encourages visitors to supply their own fantasy, to imagine scenarios, settings or events, and enter them in order to hear what the synthesizer will produce for them. Visitors in the no-words condition can still produce the same sounds by manipulating the sliders, but the numerical settings of the sliders will not originate in their fantasies. The widget is available on the internet, and the individual conditions can be accessed via the following URLs.
1. http://michaelkrzyzaniak.com/Fun/?w=NIME_Poster&c=0
2. http://michaelkrzyzaniak.com/Fun/?w=NIME_Poster&c=1
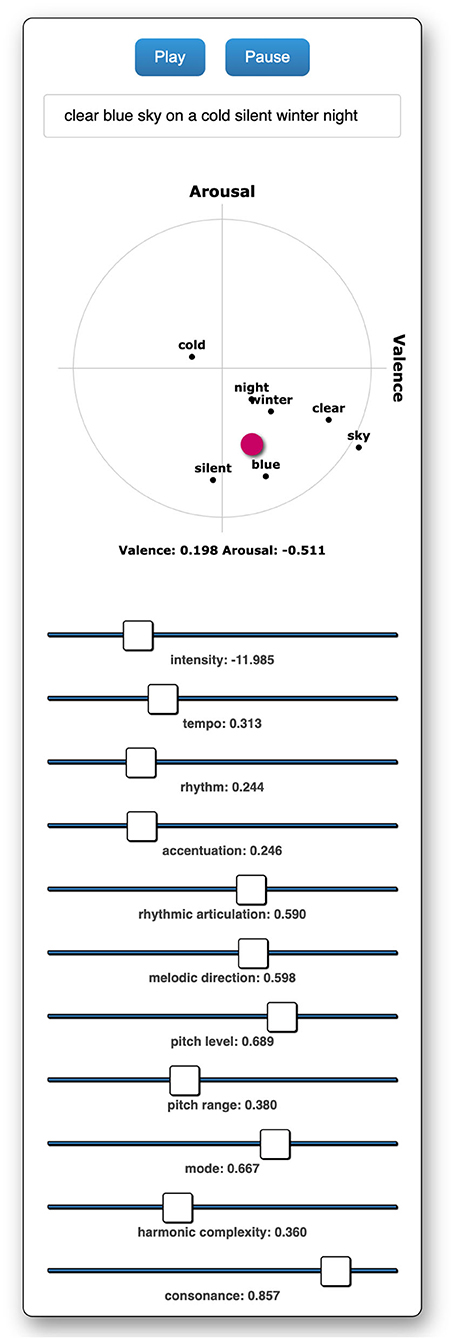
Figure 2. The widget used in Study 2.
3.2. Data Collection
I presented the widget as a demo poster, during an online poster session at a virtual conference on digital musical instruments (NIME 2020). Again it was posted to a university webpage. Visitors were assigned randomly to the two conditions and data was collected as before. It is worth pointing out that the words-to-music synthesizer was originally intended as a tool for sound designers who might, for example, enter part of a movie script and generate background music. Consequently it was not designed to be an interactive artwork by itself. However, whether a given system will be received as tool or a toy sometimes depends on who the visitor is, and under what circumstances they are using it. In this study, because of the setting, the attendees were not using the synthesizer as a tool for making background music, they would have been primed to think of it as a musical instrument, and used it as a toy while browsing poster presentations.
3.3. Data Preprocessing
During the trial period, 69 browsers visited the page a total of 84 times, excluding anyone that had at any point been flagged as a developer in the database. To the data I applied the same preprocessing steps as described in section 2.3 above, with a few small modifications.
1. First, In Steps 3 and 4, as long as the synthesizer was playing, the page was considered active even when the page was not in focus, and even in the absence of input events. Playing means that the visitor had pressed the Play button more recently than the Pause button.
2. Moreover, I excluded all visits in which the visitor never pressed the Play button at all. There was one visitor in the words condition who entered the sentence “angry spiky cactus with poisonous spines,” but did not press Play, who was excluded in this step. Although it is tempting to include this visit, doing so would apply this step asymmetrically to the conditions, as there is no equivalent check for interactivity in the “no words” condition. In any event, the choice to include or exclude this one participant has no effect on the significance levels of any of the results.
3. Finally, Step 6, which excludes visits less than 20 s in duration, was not performed, as excluding visitors that did not press Play obviated the need for this.
After preprocessing, there remained a total of 47 visits, 20 of which were assigned randomly to the words condition, and 27 to no-words.
3.4. Results
3.4.1. Did Visitors Employ Fantasy When They Could?
A sizable minority of visitors in the words condition, 8 out of 20, did not enter any words into the text input field. Six of those moreover did not move the pink dot within the valence/arousal plot which had default words printed on it. This shows that although these six participants did engage with the music by pressing Play, they did not engage with the fantasy at all. This is perhaps due to the conference setting, where most people visited this widget during the designated poster session; some visitors probably went quickly from poster to poster, giving only a cursory glance to some posters. This group is interesting, and I will present further analysis on this them in the following subsection.
This notwithstanding, the majority of people that were presented the option to make use of words did so. Most people entered adjectives one at a time, for example mysterious, charismatic, romantic, sexy, crazy, talkative, lively, fucked, diatonic, abstract, uninspired, and tragic. Very few people entered complete sentences, such as “What do you like to eat today?” and “I am so tired.” Because of the conference setting, I suspect that most visitors in this condition were in a sense testing or probing the software, to see if they agree with what the synthesizer produces for a given word. This involves imagining the sensation invoked by the word so that it can be compared to the sensation evoked by the synthesizer, and consequently, this qualifies as fantasy under the given definition.
3.4.2. Is Fantasy Engaging?
Participants in the words group spent more active time on the page (N = 20, M = 160.5, SD = 148.8) than the those in the no-words group (N = 27, M = 77.85, SD = 77.48); about twice as long on average. The two-tailed Welch's independent-samples t-test for unequal sample sizes shows that this difference is significant, with |t(26.61)| = 2.27, p < 0.04. From this it follows that people are engaged by interactive art that encourages them to fantasize. This result comes with one caveat; In the previous subsection I mentioned that eight people who had the option to enter words did not do so. Looking only within the words condition, the people who chose to enter words spent much more time on the page (N = 12, M = 222.5, SD = 160.26), three times longer on average, than those who chose not to enter any words (N = 8, M = 67.38, SD = 57.01). The same Welch test shows that this difference is significant, with |t(14.74)| = 3.07, p < 0.01. In fact, people in the words condition who chose not to enter any words spent about the same amount of active time on the page as those in the no-words condition. This highlights the point that encouraging people to fantasize is not sufficient, and a person must also choose to participate in the fantasy.
3.4.3. Is Fantasy Distracting?
No. Visitors in both the words and no-words groups spent, on average, 68% of their active time listening, without even 1 percentage point difference between the groups. Listening is defined as the total amount of time during which the Play button had been pressed more recently than the Pause button. This demonstrates first that the extra time spent by visitors in the words condition was not attributable to them exploring the words in the absence of music. Nor were they so distracted by the words that they in general felt compelled to pause or defer listening to the music so they could focus on the fantasy. From this it stands to reason that the fantasy contributed to their listening and did not distract from it.
3.5. Discussion
These results show that for some visitors, fantasy has no effect, and for others it is a powerful tool for promoting engagement. In the latter case, the fantasy does not distract visitors away from the rest of the work, but rather they incorporate the fantasy into the overall experience. This demonstrates that the additional time spent on the page is not attributable to the mere presence of an additional page element (text input field) but is in fact a result of the fantasy.
4. Study 3—Timescales
Some interactive artworks respond on different timescales than others. Some respond only instantaneously to the immediate actions of the interactant. Others by contrast may continue to respond for some time after the interactant performs an input action. Likewise, in some works a interactant may need to perform some action continuously over a period of time before the artwork begins to respond. This is illustrated in several works of the artist Rafael Lozano–Hemmer5, which are representative of an entire genre surrounding the idea of digital mirrors.6 Works like 1984x1984 and Eye Contact essentially display a digitally-mediated live video stream of the interactant on a screen. At each frame of video, what is displayed on the screen is determined by the interactant's location and pose at that exact moment in time. Airborne and From Selfie to Self Expression, are similar, but also have fluid dynamics simulation overlain; interactants can perturb the “fluid” with their motions. In this way, the actions of the interactant's continue to have an effect for some time after they are performed. In People on People, an interactant's current silhouette may be superimposed with videos of themselves recorded moments previously, allowing them to interact with past versions of themselves through the work. Thus, the interaction unfolds over a period of time. Other works may respond to the average behavior of the interactant. Particle Falls by Andrea Polli7 visualizes air pollution, so that in principle many people would need to change their behavior over a long period of time to have a large effect. The research question for Study 3 is, therefore:
Is there an optimal timescale that engages people the most?
4.1. Design
To test this question in a controlled environment, I developed the widget depicted in Figure 3. It consists of a blank canvas and some sliders. When a visitor touches or clicks down on the canvas, the tip of a metaphorical pen begins drawing a colorful spirograph curve, with the pen trace orbiting around the finger or cursor location. If the finger or cursor is dragged within the canvas, the orbital center of the curve follows. A second, mirror-image, grayscale spirograph curve is drawn at an opposing location on the canvas. The curves fade out over time as they are drawn, so that at any moment in time only recently drawn portions of the curves are visible, with progressively older portions of the curves appearing progressively fainter until sufficiently old portions of the curves do not appear at all. When the visitor releases the click or stops touching the canvas, the pen tips continue drawing the curves for some time, but their speed decreases and eventually stops, at which point no new length is added to the curves. If the finger or cursor was being dragged at the time of the release, the orbital centers of the curves continue moving inertially within the canvas for some distance. Additionally, visitors can adjust the sliders, which control some parameters pertaining to how the curves are drawn. Adjusting any slider also has the effect of causing a portion of the spirograph curve to be drawn so that the effects of the parameter can be seen.
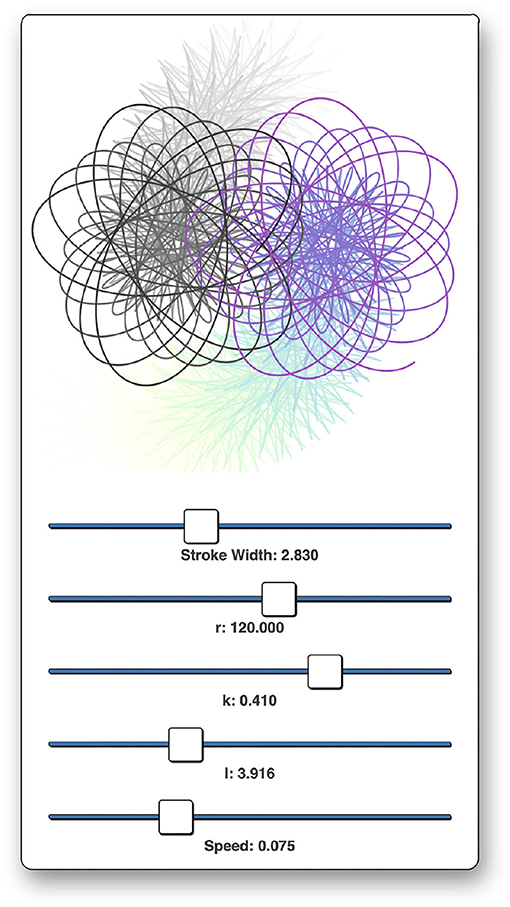
Figure 3. The widget used in Study 3.
There are four conditions. In condition 0, the time it takes for a portion of curve to fade completely out, the time it takes for the pen velocity to go to zero when the click or touch is released, and the time it takes for the orbital centers to come to rest, are all less than 1 s in duration. In condition 1, they are approximately 3 to 5 s in duration. In condition 2 they are approximately 10 to 15 s. In condition 3 they are infinitely long, such that once the visitor touches the canvas or moves a slider, the pens will continue to wander around the canvas forever, eventually filling every pixel, similar to the animation in Study 1. These increasingly long durations represent increasing timescales as described in the introduction to this section. Figure 3 depicts condition 2.
The widget is available on the internet, and the individual conditions can be accessed via the following URLs.
1. http://michaelkrzyzaniak.com/Fun/?w=Spirograph_UiO&c=0
2. http://michaelkrzyzaniak.com/Fun/?w=Spirograph_UiO&c=1
3. http://michaelkrzyzaniak.com/Fun/?w=Spirograph_UiO&c=2
4. http://michaelkrzyzaniak.com/Fun/?w=Spirograph_UiO&c=3
4.2. Data Collection
I posted the widget to my university biography page as in Study 1, and made no specific recruitment efforts aside from including the link in the bottom of all of my emails. I left it there with no other page content other than the required page template as discussed above for a period of 10 months beginning in April 2020.
4.3. Data Preprocessing
Over the trial period, 227 browsers not belonging to registered developers visited the page a total of 354 times. To these, I applied the preprocessing steps as described in section 2.3 above, with a few modifications, as follows.
1. First, I only included “interactive” visits. To be considered interactive, the visitor had to either click on the canvas or adjust one of the sliders at least once. Determining if a visit was interactive was performed after joining visits separated by less than 10 s.
2. Additionally, Step 6, which excludes visits less than 20 s in duration, was not performed, as excluding non-interactive visits obviated the need for this.
The majority of visits, 80% of them, were not interactive, with only 75 interactive visits from 66 distinct browsers. Again I only consider the first visit by each browser unless otherwise stated. Thus in total, after preprocessing, there remained 66 visits by those 66 browsers, with 12, 18, 12, and 24 visitors assigned randomly to conditions 0, 1, 2, and 3, respectively. This accounted for a cumulative total of 67 min and 5 s of active time on the page.
4.4. Results
4.4.1. Did People Engage for Longer in the Conditions With the Longer Timescales?
No. On average across all conditions, each visitor spent 61 active seconds on the page with a relatively large standard deviation of 51 s. I hypothesized that longer timescales might stretch out the visitors' attention, causing them to spend longer on the page. However, comparing the conditions pairwise using a two-tailed Welch's independent-samples t-test for unequal sample sizes showed that there was no significant difference between conditions. Nowhere was p even as small as 0.5, nor the confidence as great as 50%, so the results of these comparisons were exceptionally insignificant. From this it follows that the longer timescales had no effect on how much time people spent on the page, and it is not likely that any minor variation on this study would yield significant results.
4.4.2. Did People Click the Canvas More?
People clicked the canvas more in conditions 0 (N = 12, M = 5.4, SD = 5.2) and 3 (N = 24, M = 6.5, SD = 13.5) than in conditions 1 (N = 18, M = 1.8, SD = 3.5) and 2 (N = 12, M = 2.8, SD = 4.9). This appears to result in a U-shaped curve representing number of clicks as a function of the timescale. This could indicate that the timescale affects the style of interaction. For intermediate timescales, visitors perform periodic actions and then pause to observe the effects, whereas for extreme timescales, visitors continually perform actions to try to keep exerting influence over the system. By contrast, visitors on average made a total of 5 or 6 slider adjustments regardless of condition (adjusting each of the 5 sliders approximately once). A slider adjustment means that they moved and released the slider. This shows that the timescales did not influence the visitors's overall curiosity to explore the piece despite the ostensibly different styles of interaction represented by different clicking patterns. However, the two-tailed Welch's independent-samples t-test for unequal sample sizes shows that the differences in the number of clicks per condition are only marginally significant, with conditions 0 and 3 taken together and compared against conditions 1 and 2 yielding |t(45.28)| = 1.91, p < 0.1. Further research with a larger sample size is needed to clarify whether this effect is real.
4.5. Discussion
The examples in the introduction to this chapter should make it clear that “timescales” refers to a variety of different but related concepts. This study primarily tested the concept of perturbing a system such that actions continue to have effect into the future. Overall this has no effect on engagement for the timescales studied, but might affect how people interact with the work. The other similar concepts could be tested separately in the future.
5. Study 4—Agency
Many interactive artworks have some sort of agency. Throughout this section, I will refer to an artwork that ostensibly has agency as an “agent.” Agency is defined here to be the ability for an agent to act upon the world (Russell and Norvig, 2002).8 Moreover, these actions must be done deliberately, in order to accomplish something; and spontaneously, without external stimulus (Wooldridge and Jennings, 1994). Insofar as agency is a property of the agent, it may manifest itself in a few different ways. In interactive art, agency often means that the agent has some behaviors that are only partially influenced, but not fully controlled, by the interactant's actions (Dahlstedt, 2021); for example an interactive musical robot that sometimes mimics musical themes that it heard, but other times introduces novel and appropriate material not related to what it heard. The new material was produced spontaneously, and, if it is not completely random, deliberately. Agency may also manifest itself as the use of action to express a (perceived) mental state, such as emotion or desire (Misselhorn, 2015), for example a robot that smiles at people wearing hats and frowns at everyone else. The actions of smiling and frowning are deliberate in the sense that it accomplishes something (expressing like of hatted people). Even though these actions are in response to a person's presence, they are nonetheless spontaneous in the sense that they are driven by the robot's own inner state. Furthermore, agency is also a property of the interactant, because whatever the agent's properties, the interactant must have a certain theory of mind with regard to the agent, otherwise its actions will appear random and meaningless, instead of deliberate, directed, and purposeful. Ultimately an agent only has agency if the interactant ascribes agency to it (Takayama, 2012).
These principles are illustrated by two works of Golan Levin.9 Opto-Isolator is a robotic eye that follows you as you move around, and blinks whenever you blink. It has little or no agency as it does not appear to initiate action or have any behaviors that are not fully controlled by the interactant's actions.10 Snout is another robotic eye, but it is different in that it appears to look around, only sometimes focusing on the interactant and sometimes not. This is because it is outdoors and is sometimes distracted by trees or other movement in the environment. This gives it the impression of having some internal process that is only partly influenced by the interactant's. Additionally, it sometimes recoils in a surprised gesture, which is an action that expresses an internal state. Due to these features, I personally ascribe greater agency to Snout than Opto-Isolator. This gives rise to the research question for Study 4:
Does ascribed agency promote engagement in interactive art?
5.1. Design
To test the hypothesis that greater ascribed agency leads to greater engagement, I designed the widget shown in Figure 4. The widget shows a representation of two low-resolution LED robot eyes, similar to the eyes of robots such as Eve in Pixar's WALL-E, the toy robot Cozmo by Anki, and, most saliently, my Dr. Squiggles robot (Krzyżaniak, 2021). Above the eyes is the statement “This is Dot.” Beneath the eyes is a survey form consisting of two questions and corresponding sliders, implicitly ranging from 0 on the left to 1 on the right, and a submit button. The first question, which I will henceforth call the agency question, asks whether Dot prefers apples or oranges for snack time. The second question, which I will call the likability question, asks how much you like Dot. When visitors press the submit button, a message is displayed that either thanks them, or prompts them to move both sliders before submitting, if they have not yet done so. This study has four conditions. In the control condition, the eyes are presented as a static image that do not move, exactly as depicted in Figure 4. In the second condition, the two eye condition, the eyes are animated. They track the position of the cursor as the visitor moves it around the page, and in particular they appear to watch the visitor as they adjust the sliders. I accomplish this by offsetting both the location of the pupil within the eye, and the location of the eye within the widget, in the direction of the cursor by an amount proportional to the distance from the cursor to the center of the widget. Moreover, in this condition, immediately after the visitor moves and releases the agency slider, the eyes attempt to indicate a preference for the position of the slider. If the slider is placed in the left half of the range, the eyes move rapidly back and forth to indicate “no.” If the slider is placed in the right half of the range, the eyes move from rapidly from left to right several times indicating that the slider should be moved even further right, unless the slider is placed in the rightmost 10% of the range, in which case the eyes move up and down to indicate “yes.” There is a third one eye condition in which there is only one eye, and the size and shape are nearly identical to the design used in Dr. Squiggles. This eye has the same behavior as in the two eye condition. The fourth and final angular offset condition is identical to the two eye condition, except that instead of the position of the pupil and eyes being offset directly in the direction of the cursor, they are offset in the direction of the cursor plus some angle. The measure of the angle drifts over time using Brownian motion, unless the cursor is in the vicinity of the sliders, in which case the angle is zero so the eyes appear to be watching the visitor adjust them. I will refer to the three non-control conditions collectively as the animated conditions. For reference, the widget is available on the internet, and the various conditions can be visited using the following URLs:
1. http://michaelkrzyzaniak.com/Fun/?w=Eyes_UiO&c=0
2. http://michaelkrzyzaniak.com/Fun/?w=Eyes_UiO&c=1
3. http://michaelkrzyzaniak.com/Fun/?w=Eyes_UiO&c=2
4. http://michaelkrzyzaniak.com/Fun/?w=Eyes_UiO&c=3
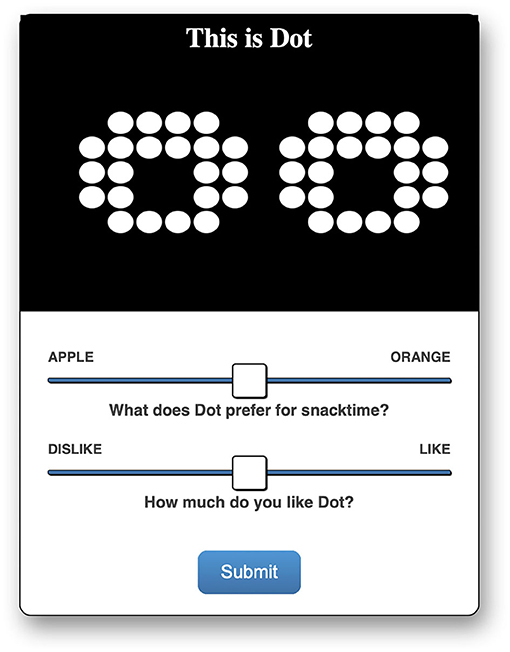
Figure 4. The widget used in Study 4.
5.2. Data Collection
This study is somewhat different from the others in that it is clear by looking at it that it is a study, which made it easier to recruit participants. I uploaded the widget to my personal website. Because my personal website does not force visitors to “consent” to site-wide data-collection, I included a small link at the bottom of the page explaining the study. I emailed a link to the widget to a large professional mailing list, asking participants to participate in a 2-question study. I let the study collect data for about a week.
5.3. Data Preprocessing
During the trial period, 122 browsers visited the page a total of 143 times, excluding anyone that had at any point been flagged as a developer in the database. I measured the active time the visitors spent on the page using the same preprocessing steps as described in section 2.3 above, with a few small modifications, as follows.
1. First, because the eyes follow the cursor, I removed all visits by touchscreen devices for which this would not work as intended. A device was considered to be a touchscreen device if the touchstart, touchend, or touchmove Javascript user interface events fired anywhere on the page prior to any mousedown, mouseup, or mousemove events. This resulted in the removal of 16 devices.
2. Visits were only included if they were submitted. Submitted means that the submit button had been pressed after adjusting each of the sliders.
3. Additionally, Step 6, excluding visits of less than 20 active seconds, was not performed, as it is plausible that some valid visitors would have spent less than 20 s completing the survey. Excluding non-submitted responses obviated the need for this step.
In addition to collecting the active page time, I recorded each adjustment of each slider and each press of the submit button, irrespective of the order of those events. To be clear, pressing the submit button did not actually submit the responses, it only recorded the fact that the visitor had pressed it, and all data were committed once the visitor closed or navigated away from the page, so the active page time could be captured. After preprocessing, there were 85 responses from 85 visitors, with 18, 24, 22, and 21 participants assigned to the control, two eyes, one eye, and angular offset conditions, respectively.
5.4. Results
5.4.1. Did Visitors Notice That Dot Responded to the Agency Slider?
Only some did. In the three animated conditions taken together, visitors on average moved the agency slider a greater number of times (N = 67, M = 3.99, SD = 5.02) than in the control condition (N = 18, M = 1.67, SD = 0.91). The two-tailed Welch's independent-samples t-test for unequal sample sizes shows that this difference is significant with |t(78.52)| = 3.57, p < 0.001. The same is also true for the likability slider, with (N = 67, M = 2.43, SD = 3.91) and (N = 18, M = 1.22, SD = 0.43), respectively, and |t(71.46)| = 2.48, p < 0.02. These facts suggest that the animation made people curious to explore both sliders. Moreover, within the three animated conditions taken together, the same Welch's test shows that the average number of times that visitors moved the agency slider was significantly higher than the number of times they moved the likability slider, with |t(124.5)| = 2.00, p < 0.05. So although they engaged more with both sliders in the animated conditions, they did so disproportionately more with the agency slider. This suggests that the visitors did on average notice that Dot responded to the movement of that slider and not the likability slider. They played with it to further explore the interaction.
Having said that, about 50% of visitors in all conditions together, and in each one separately, moved the agency slider only once, which was required in order to successfully press the submit button. They did not subsequently make many adjustments to it in response to Dot's actions. An initial pilot of this study amongst colleagues suggested that many visitors with this profile in the animated conditions did not notice that Dot responded to the agency slider. So although the average visitor did notice, only half of individual visitors did. In this study, noticing this action was a prerequisite for the ascription of agency, since Dot used this action to indicate that it wants something (an orange and not an apple). Visitors who did not notice the interaction could not have possibly ascribed agency to Dot. This is somewhat different than noticing the action but not believing it to be purposeful.
5.4.2. Did Visitors Ascribe Agency to the Movement Associated With the Agency Slider?
Here I will operationalize the amount of ascribed agency as the final position of the agency slider at the time visitors navigated away from the page. The slider will on average be biased to the right iff (a) Dot acts in such a way as to express a rightward preference for the slider position, and (b) visitors ascribe desire to these actions, as opposed to interpreting them as arbitrary.
Looking only at visitors who moved the agency slider more than once, in the angular offset condition the average position of the agency slider at the time visitors navigated away from the page was further to the right (N = 10, M = 0.86, SD = 0.31) than in the control condition (N = 8, M = 0.44, SD = 0.41). The two-tailed Welch's independent-samples t-test for unequal sample sizes shows that this difference is significant with |t(12.82)| = 2.44, p < 0.04. The same was not true for the likability slider which had a final position of about 0.69 in both conditions. This suggests that these visitors understood that Dot wanted them to move the agency slider but not the likability slider to the right. Understanding that an agent wants something is equivalent to ascribing agency to it under the given definition.
Again looking only at visitors who moved the agency slider more than once, in the two eye and one eye conditions, the final value of the agency slider was similarly higher than in the control condition with (N = 14, M = 0.77, SD = 0.27) for the two eye and (N = 12, M = 0.66, SD = 0.37) for the one eye condition. However, these differences were not significant. Using a weaker test, 12 out of 14 participants in the two eye condition left the agency slider in the right half of its range; the probability of at least this many people doing so by chance alone is less than 1%, as compared to exactly half of visitors in the control condition doing this. This suggests that visitors in the two eye condition in general did ascribe agency, although more weakly, as they only partially understood or complied with Dot's desire that they move the slider all the way to the right. In other words, these visitors likely interpreted some of Dot's actions as random and not deliberate. In the one eye condition, 8 out of 12 visitors left the agency slider in the right half of its range, which would occur with 19% probability by chance alone. This suggests that although these visitors did on average notice that Dot responded to them moving the agency slider, many did not understand that Dot was asking them to do something, meaning that they ascribed little or no agency to Dot. For completeness, 9 out of 10 participants in the angular offset condition did this, with about 1% chance of happening by accident, confirming again that the visitors ascribed agency in this condition.
It is difficult to compare between the animated conditions, because the differences are slight. However, these findings may suggest that visitors ascribed the most agency in the angular offset condition, followed by the two eye condition, then the one eye condition. The angular offset condition might be explained by the fact that it was the only condition in which Dot had some continual process that was only partially affected by the visitors's actions. The continual interplay between the visitor and Dot may have primed visitors to think of Dot as an agent. By contrast, visitors in the two eye condition clearly understood that Dot was asking them to move the slider to the right, but were not as attentive to all of the signals it was giving about how far to the right they should move it. Nonetheless, the two eye condition is slightly more anthropomorphic than the one eye condition, which might explain why so little agency, if any, was ascribed in that condition.
5.4.3. Did Any Visitors Deliberately Oppose the Dot's Desire?
No. Of the 36 visitors in the three animated conditions who moved the agency slider more than once, only one visitor did leave it to the extreme left of its range below 0.05 at the time of navigating away from the page, and they moved it there after the last time they pressed submit. By contrast, 16 of these visitors did leave it to the extreme right above 0.95. This suggests that in general people did not antagonize Dot. By contrast, out of the 31 visitors in those three conditions who only moved the agency slider once, 8 did leave it to the extreme left and 6 to the extreme right. This is expected since the first placement of that slider is random.
5.4.4. Did Visitors Prefer Two Eyes Over One?
In addition to the one-eyed artworks discussed in the introduction, the authors of this paper have independently developed one-eyed musical agents (Erdem, 2021; Krzyżaniak, 2021). Although it is somewhat tangential, we wanted to know if people expresses a greater preference for two-eyed agents. This appears not to be the case, with the average position of the likability slider at the time visitors navigated away from the page being 0.66 in all conditions combined, with no significant differences between conditions.
5.4.5. Did Visitors Engage for Longer When They Ascribed Greater Agency to the Eyes?
Yes. In the three animated conditions taken together, visitors spent more active time on the page (N = 67, M = 48.50, SD = 22.46) than in the control condition (N = 18, M = 30.11, SD = 14.68). The two-tailed Welch's independent-samples t-test for unequal sample sizes shows that this difference is significant with |t(40.93)| = 4.16, p < 0.001. The same is true for each animated condition taken separately and compared to the non-animated condition, with p < 0.01 in each case, and no significant difference between the animated conditions. But did people spend longer in these conditions only because they were interactive, or specifically because that interaction involved agency?
Considering all 67 visitors in the three animated conditions, there was a weak but significant positive correlation between the final position of the agency slider and the amount of active time spent on the page, with r(65) = 0.32, p < 0.01. By contrast, there was no correlation between the like likability slider and the active page time, with r(65) = 0.19, p > 0.1, and if anything the trend was slightly negative. Similarly in the control condition, the final position of neither the likability nor agency slider had a significant correlation with page time, with both having a slightly negative trend. From this it follows that greater ascribed agency was associated with more engagement. The equation for the relationship is y=18.46x + 37.13, where y is page time in seconds and x is the final agency slider position, from 0 on the left to 1 on the right. This means that visitors in the animated conditions who ascribed no agency because they did not even notice Dot's actions spent on average 37 s on the page, as compared to the 30 s average in the control condition. The extra 7 s are attributable to the interactivity alone, with an additional 18 s spent by visitors who ascribed the most agency to that interactivity. From this it stands to reason that for the average visitor, agency is about as powerful at promoting engagement as simple interactivity, and the two are additive. Note however that it is not known whether people spent longer because of the agency, or instead if people who stayed longer for other reasons ended up ascribing more agency.
5.5. Discussion
In this section, we have observed that about half of people failed to notice, in a fundamental way, what was going on in the study. This mirrors the finding in Study 2 regarding fantasy, that presenting visitors with the opportunity to fantasize or ascribe agency isn't sufficient; visitors must also be receptive and willing to engage in that way. Of those who did notice, some ascribed more agency than others, and this may be due to anthropomorphism, and to the presence of some behaviors that are only partially controlled by the interactant, although these are both subtle and probably very complex, and likely a great amount of additional research will be needed to tease this apart convincingly. Whatever the reason, visitors who ascribed the most agency also engaged for the longest. Finally, agency may be useful for directing people's behavior, since people who noticed what was going on in the study generally complied with Dot's desire, and did not antagonize Dot. This shows that agency can be a powerful tool for completing the feedback loop between the interactant and the work.
6. Conclusion
To briefly recapitulate, the studies herein have shown that (a) more controllable parameters increase engagement; (b) fantasy strongly increases engagement for some people but not at all for others; (c) timescales do not influence engagement but might affect the style of interaction, and (d) ascribed agency is related to increased engagement. Note, however, that this should not be taken as a comprehensive framework for how to promote engagement in interactive art. These are only a small sampling of what is undoubtedly a myriad of properties that might promote engagement. Even the few properties presented here are very complex and the studies in some sense raise more questions than they answer. Therefore this paper should be taken as a starting point, not an end point.
This paper has left open many avenues for future work, beyond extending similar methods to other properties of art. The limited data collected in the studies is both a strength and a weakness of the presented method. On the one hand it has allowed us to carefully control the experiments in an ecologically valid setting. On the other hand, we are viewing the visitors through a pinhole, and there is a lot that we just don't know. All art is inherently cultural, and experiencing it depends on enculturation, but we do not know the demographics of the participants in the studies because we did not collect that information. We don't know why some people stop to interact with a widget when presented with it, and others just leave the page without engaging at all. We don't know whether people engaged socially, for instance if two people interacted with a widget together on the same web browser. We don't know what metacognitive processes people may have engaged in during interaction. We don't know what role memory and learning may have had in the interactions, as would be especially applicable to repeat visitors. We do not know the longer-term effects of the interactions, for example if an interaction caused a shift in perspective that altered a participant's behavior in their daily life at a later date. All of these are avenues for future work, both because they are interesting questions in their own right, and because some extra information would improve the repeatability and accuracy of studies of this nature.
As a final note, it is interesting to think about how these results would apply to other types of systems, especially more complex ones. The authors have a special interest in interactive musical systems like musical robots, responsive dance works, and musical software agents. Even knowing that fantasy is important, it is not clear, for example, how the design of a guitar robot's body might encourage or discourage fantasy in its musical partners. When a robot improvises music with a human partner, what is the optimal level of ascribed agency so that its playing is neither to predictable nor too random, and how can that be achieved? How can these and other properties be combined in a system that is enjoyable to play music with, that helps people learn an instrument, or that otherwise helps people reap the benefits of lifelong music making?
Taking a step back, interactive art in general clearly has great potential for engagement. The average 27 s people spent looking at paintings (and reading the label) in Smith and Smith (2001) included some of the greatest masterpieces in history, and people reported having transformative experiences while looking at them. By contrast, none of the groups reported in this paper spent a mean of less than 30 s interacting with the artwork, even in the control conditions. In fact, double that time was common, with about a minute seeming like the default. One group even spent 222 s on average—more than 8 times as long as people spend looking at paintings; and these are not masterpieces by any stretch. This demonstrates that interactivity itself is a powerful tool for engagement. However, the great variability across the groups in this article highlights that engagement does not come for free in interactive art. The art must also be thoughtfully designed to have the right properties, including but certainly not limited to the ones presented in this paper, in order to promote engagement.
Data Availability Statement
The original contributions presented in the study are included in the article/supplementary materials, further inquiries can be directed to the corresponding author/s.
Ethics Statement
Ethical review and approval was not required for the study on human participants in accordance with the local legislation and institutional requirements. Written informed consent for participation was not required for this study in accordance with the national legislation and the institutional requirements.
Author Contributions
MK was solely responsible for the first three studies. ÇE and MK contributed equally to the fourth studies, with key insights coming from ÇE. KG provided supervision and feedback. All authors contributed to the article and approved the submitted version.
Funding
This work was partially supported by the Research Council of Norway through its Centres of Excellence scheme, project number 262762.
Conflict of Interest
The authors declare that the research was conducted in the absence of any commercial or financial relationships that could be construed as a potential conflict of interest.
Publisher's Note
All claims expressed in this article are solely those of the authors and do not necessarily represent those of their affiliated organizations, or those of the publisher, the editors and the reviewers. Any product that may be evaluated in this article, or claim that may be made by its manufacturer, is not guaranteed or endorsed by the publisher.
Footnotes
1. ^I will use the term “interactant” throughout this article to refer to a human who engages with a work of interactive art.
2. ^https://www.grandviewresearch.com/industry-analysis/video-game-market
3. ^https://www.ibisworld.com/industry-statistics/market-size/social-networking-sites-united-states/
4. ^https://levelskip.com/how-to/Skinners-Box-and-Video-Games
5. ^All of the works discussed here are documented on his website, https://lozano-hemmer.com/videos.php.
6. ^Other notable artists in this genre are Daniel Rozen, Golan Levin, and Zach Lieberman.
7. ^http://eco-publicart.org/particle-falls/
8. ^Not that “agency” more typically refers to the interactant's ability to act within the system; this is a separate question not considered here.
9. ^The works here can be seen in his Ted Talk, https://www.ted.com/talks/golan_levin_art_that_looks_back_at_you.
10. ^The artist says that it may look away if you look at it for too long, which may imbue it with a small amount of agency.
References
Blythe, M., and Monk, A. (2018). Funology 2 From Usability to Enjoyment, 2nd Edn. Cham: Springer. Available online at: https://link.springer.com/book/10.1007/978-3-319-68213-6
Bongers, B., and Mery, A. (2011). “Interactive kaleidoscope: audience participation study,” in Proceedings of the 23rd Australian Computer-Human Interaction Conference (Canberra, ACT), 58–61.
Chou, C., Condron, L., and Belland, J. C. (2005). A review of the research on internet addiction. Educ. Psychol. Rev. 17, 363–388. doi: 10.1007/S10648-005-8138-1
Costello, B., and Edmonds, E. (2007). “A study in play, pleasure and interaction design,” in Proceedings of the 2007 Conference on Designing Pleasurable Products and Interfaces (Helsinki), 76–91.
Costello, B. M., and Edmonds, E. A. (2009). “Directed and emergent play,” in Proceedings of the Seventh ACM Conference on Creativity and Cognition (New York, NY), 107–116.
Dahlstedt, P. (2021). “Musicking with algorithms: thoughts on artificial intelligence, creativity, and agency,” in Handbook of Artificial Intelligence for Music (Cham: Springer), 873–914.
Desmet, P. (2003). “Measuring emotion: development and application of an instrument to measure emotional responses to products,” in Funology (Dordrecht: Springer), 111–123.
Erdem, Ç. (2021). First a Guitarist, Then a Drummer Plays with CAVI. Available online at: https://www.youtube.com/watch?v=WuZBXUpn60Q (accessed October 03, 2021).
Fernaeus, Y., Höök, K., and Ståhl, A. (2018). “Designing for joyful movement,” in Funology 2 (Cham: Springer), 193–207.
Ishii, H., Ratti, C., Piper, B., Wang, Y., Biderman, A., and Ben-Joseph, E. (2004). Bringing clay and sand into digital design - continuous tangible user interfaces. BT Technol. J. 22, 287–299. doi: 10.1023/B:BTTJ.0000047607.16164.16
Jordà, S., Kaltenbrunner, M., Geiger, G., and Bencina, R. (2005). “The reactable,” in ICMC (Barcelona: Citeseer).
Karat, C.-M., Karat, J., Vergo, J., Pinhanez, C., Riecken, D., and Cofino, T. (2002). That's entertainment! designing streaming, multimedia web experiences. Int. J. Hum. Comput. Interact. 14, 369–384. doi: 10.1080/10447318.2002.9669125
Krzyżaniak, M. (2021). Musical robot swarms, timing, and equilibria. J. New Music Res. 50, 279–297. doi: 10.1080/09298215.2021.1910313
Krzyzaniak, M., Gerry, J., Kwak, D., Erdem, C., Lan, Q., Glette, K., et al. (2021). Fibres Out of Line. Available online at: https://michaelkrzyzaniak.com/Fibers_Out_Of_Line/ (accessed July 21, 2021).
Krzyzaniak, M. J. (2020). “Words to music synthesis,” in Proceedings of the International Conference on New Interfaces for Musical Expression (Birmingham: Birmingham City University), 29–34.
Ljungblad, S., Skog, T., and Holmquist, L. E. (2003). “From usable to enjoyable information displays,” in Funology (Cham: Springer), 213–221.
Mallavarapu, A., Lyons, L., Uzzo, S., Thompson, W., Levy-Cohen, R., and Slattery, B. (2019). “Connect-to-connected worlds: piloting a mobile, data-driven reflection tool for an open-ended simulation at a museum,” in Proceedings of the 2019 CHI Conference on Human Factors in Computing Systems (Glasgow), 1–14.
Malone, T. W. (1981). Toward a theory of intrinsically motivating instruction. Cogn. Sci. 5, 333–369.
Malone, T. W. (1982). “Heuristics for designing enjoyable user interfaces: Lessons from computer games,” in Proceedings of the 1982 Conference on Human Factors in Computing Systems (New York, NY), 63–68.
Misselhorn, C. (2015). “Collective agency and cooperation in natural and artificial systems,” in Collective Agency and Cooperation in Natural and Artificial Systems (Cham; Heidelberg; New York, NY; Dordrecht; London: Springer), 3–24. Available online at: https://link.springer.com/content/pdf/bfm%3A978-3-319-15515-9%2F1.pdf
Monk, A., Hassenzahl, M., Blythe, M., and Reed, D. (2002). “Funology: designing enjoyment,” in CHI'02 Extended Abstracts on Human Factors in Computing Systems (New York, NY), 924–925.
Overbeeke, K., Djajadiningrat, T., Hummels, C., Wensveen, S., and Prens, J. (2003). “Let's make things engaging,” in Funology (Cham: Springer), 7–17.
Pagulayan, R. J., Steury, K. R., Fulton, B., and Romero, R. L. (2003). “Designing for fun: user-testing case studies,” in Funology (Cham: Springer), 137–150.
Rosson, M. B., and Carroll, J. M. (2018). “Fun for all: promoting engagement and participation in community programming projects,” in Funology 2 (Cham: Springer), 507–518.
Russell, S., and Norvig, P. (2002). Artificial intelligence: a Modern Approach. Upper Saddle River, NJ: Prentice Hall.
Sisyu + teamLab (2018). Born From the Darkness a Loving, and Beautiful World. https://www.teamlab.art/jp/w/whatloving-dark/ (accessed June 21, 2021).
Smith, J. K., and Smith, L. F. (2001). Spending time on art. Empir. Stud. Arts 19, 229–236. doi: 10.2190/5MQM-59JH-X21R-JN5J
Smith, L. F., Smith, J. K., and Tinio, P. P. (2017). Time spent viewing art and reading labels. Psychol. Aesthet. Creativity Arts 11, 77. doi: 10.1037/aca0000049
Takayama, L. (2012). “Perspectives on agency interacting with and through personal robots,” in Human-Computer Interaction: the Agency Perspective (Berlin: Springer), 195–214. Available online at: https://link.springer.com/content/pdf/10.1007/978-3-642-25691-2.pdf
Wooldridge, M., and Jennings, N. R. (1994). “Agent theories, architectures, and languages: a survey,” in International Workshop on Agent Theories, Architectures, and Languages (Berlin: Springer), 1–39.
Keywords: interactive art, fun, engagement, web-based interaction, user studies
Citation: Krzyzaniak M, Erdem Ç and Glette K (2022) What Makes Interactive Art Engaging? Front. Comput. Sci. 4:859496. doi: 10.3389/fcomp.2022.859496
Received: 21 January 2022; Accepted: 22 March 2022;
Published: 26 April 2022.
Edited by:
Gerrit C. Van Der Veer, University of Twente, NetherlandsReviewed by:
Danzhu Li, University of Twente, NetherlandsBert Bongers, University of Technology Sydney, Australia
Copyright © 2022 Krzyzaniak, Erdem and Glette. This is an open-access article distributed under the terms of the Creative Commons Attribution License (CC BY). The use, distribution or reproduction in other forums is permitted, provided the original author(s) and the copyright owner(s) are credited and that the original publication in this journal is cited, in accordance with accepted academic practice. No use, distribution or reproduction is permitted which does not comply with these terms.
*Correspondence: Michael Krzyzaniak, mkrzyzaniak@protonmail.com