Theory and applications of InfraRed and thermal image analysis in ergonomics research
 Ameersing Luximon
 Huang Chao
 Ravindra S. Goonetilleke
 Yan Luximon4
- 1Industrial Design Department, Georgia Tech Shenzhen Institute (GTSI), Shenzhen, China
- 2Art Division, Shenzhen University, Shenzhen, China
- 3Department of Industrial and Systems Engineering, Khalifa University, Abu Dhabi, United Arab Emirates
- 4Asian Ergonomics Design, School of Design, The Hong Kong Polytechnic University, Kowloon, Hong Kong SAR, China
Designing products and services to fit human needs, wants and lifestyle require meaningful data. With Industry 4.0 and the internet of things, we have many ways to capture data using sensors and other means. InfraRed (IR) cameras are quite ubiquitous, especially for screening illness and wellness. They can provide a wealth of data on different objects and even people. However, their use has been limited due to processing complexities. With reducing cost and increasing accuracy of IR cameras, access to thermal data is becoming quite widespread, especially in medicine and people-related applications. These cameras have software to help process the data, with a focus on qualitative analyses and rather primitive quantitative analyses. In ergonomics, data from multiple users are essential to make reasonable predictions for a given population. In this study, using 4 simple experiments, several quantitative analysis techniques such as simple statistics, multivariate statistics, geometric modeling, and Fourier series modeling are applied to IR images and videos to extract essential user and population data. Results show that IR data can be useful to provide user and population data that are important for design. More research in modeling IR data and application software is needed for the increased application of IR information in ergonomics applications.
Introduction
Although clinical thermometry, defined as the use of temperature measurements for both diagnostic and health monitoring is longstanding, practical radiometric determination of human body temperature started with the development of the Evaporograph in 1925 by Prof Marianus Czerny (Ring, 2012). Later, with the development of Pyroscan (Cade and Barlow, 1967), the first British medical thermograph was obtained during World War II. Even though revolutionary, it was slow and not so detailed in comparison to today's equipment. For example, a one-hand thermogram using the Pyroscan took around 5 min, and the temperature was represented in black and white in the thermogram. Even though thermography was rudimentary, its use in medical settings started to emerge with thousands of thermography scans per year on females to rule out breast-related diseases (Gershon-Cohen, 1967). After the 1960s, rapid developments took place and now modern IR thermal imaging is fast and accurate with applications in many fields (Kirimtat et al., 2020). IR thermography systems have progressed fast due to improvements in sensors, diagnostic procedures, computing power and improved processing algorithms (Faust et al., 2014).
IR thermography is a very promising method for evaluating variations in skin temperature, and signs of potential disease or disorders in the human body (Skomudek et al., 2017; Kirimtat et al., 2020). Thus, it is no surprise that IR thermal imaging is now widely used in medical settings (Faust et al., 2014). Some of them include identifying scoliosis (Kwok et al., 2017), facial paralysis (Liu et al., 2021), diabetic foot (Macdonald et al., 2016; Cruz-Vega et al., 2020; van Doremalen et al., 2020), breast cancer and tumors (Kakileti et al., 2020; Resmini et al., 2021), and sprain injuries (Oliveira et al., 2016). Cardone and Merla (2017) have shown that thermal imaging can also be used for the assessment of human autonomic nervous activity and psychophysiological states by measuring pulse rate, breathing rate, cutaneous blood perfusion, sudomotor response, stress response, and social interactions. Other applications include those in sports science related to injury prevention, detection of sports injuries, injury follow-up, physical and emotional load evaluations, and design of sports equipment and clothing (Hildebrandt et al., 2010; Quesada, 2017; Drzazga et al., 2018). Although the applications of IR thermography are growing rapidly, many challenges remain, especially in the analysis and interpretation of the data collected.
When an IR image is captured, it does not differentiate between the region of interest (ROI) and the background. Various techniques have been used to capture the ROI, either manually or automatically, depending on the distance between the IR equipment and the participant (Barcelos et al., 2014; Quesada, 2017; Perpetuini et al., 2021). After obtaining the necessary images, qualitative and quantitative approaches are used for their interpretation. Current analysis methods are rather conservative (Quesada et al., 2017). Qualitative analysis of IR thermography data involves color-coded image representation with different temperature ranges superimposed on normal RGB images as a heat map (Quesada et al., 2017); and mapping IR images onto a 3D human body model (Chao et al., 2015). When considering quantitative analysis, average temperature, maximum temperature, temperature variation, standard deviation, thermal symmetries, and thermal gradients are used based on the ROI (Quesada et al., 2017).
Processing images of one participant can be straightforward, but with multiple participants of differing weight, height and BMI, obtaining meaningful results can be challenging. Multivariate statistical analysis techniques such as PCA, factor analysis and cluster analysis are some possible techniques that can be used to group and classify data (Timm, 2002). IR cameras provide not just thermograms (images), but also videos. Analysis of videos is also challenging when considering variations between different people with the added time-related variations. Very few studies have considered the different parts of the body and analysis of the video IR data of the human body. Statistical analysis of human data and representation of these data in an efficient manner can provide enormous value as a new source of knowledge and information for product designers.
In order to address this challenge, we describe four experiments that cover the head and face, hands, feet and the whole body. The objectives are:
1. Extract suitable metrics to analyze IR data so that useful standards may be generated.
2. Process the images and video of more than one participant so that more general recommendations can be made. Multidimensional scaling (Luximon and Luximon, 2009; Chao et al., 2015), multivariate statistical analysis (Timm, 2002), and Fourier series modeling (Stade, 2011) will be used to extract useful information from IR images and videos.
The main contribution of the paper is to show the use statistical analysis, mathematical analysis, time series analysis, image, and video data analysis based on IR data. Similar techniques can be applied to new IR data set for create database for different age group, Body Mass Index (BMI), gender, and cultures. In addition, heat signatures (or heat map) for different diseases can be identified for medical intervention. Additional research in this area is needed to develop standards for thermograms for different body parts at different settings. Based on differences in heat map different products and situations can be evaluated (Luximon et al., 2016). Results from this type of study will be useful to create design tools for product designers.
Materials and methods
Experiments 1, 2 and 3 used a FLIR E33 IR Camera (FLIR USA) while a FLIR A6700sc Camera (FLIR USA) was used in experiment 4. In experiment 1 and 3, the temperature of the room was around 23°C (SD = 1°C) and relative humidity was around 30% (SD = 9%). In experiment 2 and 4, the indoor room temperature was around 24 ± 1°C and relative humidity was around 60 ± 5%. Digital temperature-humidity recorder, testo 175 H1—Temperature and humidity data logger was used to monitor in real time the relative humidity and indoor air temperature.
All participants were assessed by a registered physiotherapist for any abnormalities and infections. None of the participants had any. The experiment was approved by the University Ethics committee (HSEARS20141209003). An informed consent form was obtained from each subject. In experiment 1, six female Hong Kong of south Asian origin of mean age of 43 years (SD = 10 years) participated (Luximon et al., 2017). The IR camera was placed at a fixed position and subjects positioned their feet on a paper template pasted on the floor. The IR images of four views (anterior, posterior, medial and lateral position) were captured at the start of the experiment (i.e., before). The participants then wore socks and shoes for 3 h. The socks were provided to the participant and they were the same type for all participants. Then the IR images of the 4 views were captured after removing the shoes and socks (i.e., after).
In experiment 2, the IR video of one Chinese participant aged 30 years (height 182 cm, and weight 82 kg) was collected when wearing two types of face masks. The face masks were a 3M N95 respirator from 3M Korea Ltd. and a surgical mask from US Secure Co. Ltd. A video was recorded at 30 frames per second. For experiment 3, the IR video from one Hong Kong participant of south Asian origin aged 52 years (height 165 cm, and weight 75 kg) was collected after the hand was submerged in ice-cold water (0°C). The left hand was submerged in ice-cold water for 1 min, the hand was dried, and was placed at a fixed location. A thermal video, of the dorsal side of the hand, was recorded at 30 frames per second. After 30 min, the procedure was repeated to capture data from the plantar side of the same hand. In experiment 4, the front and back of the whole body were scanned of 15 healthy Chinese male participants whose mean age was 21.4 years (SD = 2.1 years), mean height was 172 cm (SD = 8 cm), mean weight was 63 kg (SD = 11 kg), mean BMI was 21.2 (SD = 3.2).
A summary of the setting is shown in Table 1.
Table 1. Setting of different experiments.
Analysis and results
Data from the IR Camera were images and video. The IR images were converted into actual temperature values and exported into a .csv format using FLIR software tools. In this study, the background data was manually removed from the IR images. The unwanted background was set to be transparent, and the IR images were saved as png files. An image mask was used to extract the accurate temperature data from the .csv file (Figures 1A,B). Unlike the images, the extracted images from the videos cannot be converted directly into temperature values. Using the color-coded temperature scale and the color information from the video frames, the temperature data of each frame was extracted using programs written in Matlab. The RGB images extracted from the video data were converted into an indexed image (I1 ⇒ High temperature and In ⇒ Low temperature, where n = 181) using the colormap shown in Figure 1C. The indexed values (Ik) in the images were then converted into temperature values (Tk) based on the minimum (TMin) and maximum (TMax) of the temperature scale using Equation (1). Since the conversion of the video color-coded data to temperature values is dependent on the temperature scale setting, it is important to set the correct temperature range to capture the temperature changes. This requires trial and error and a series of pilot experiments. All the model development and analysis were performed using programs written in Matlab.
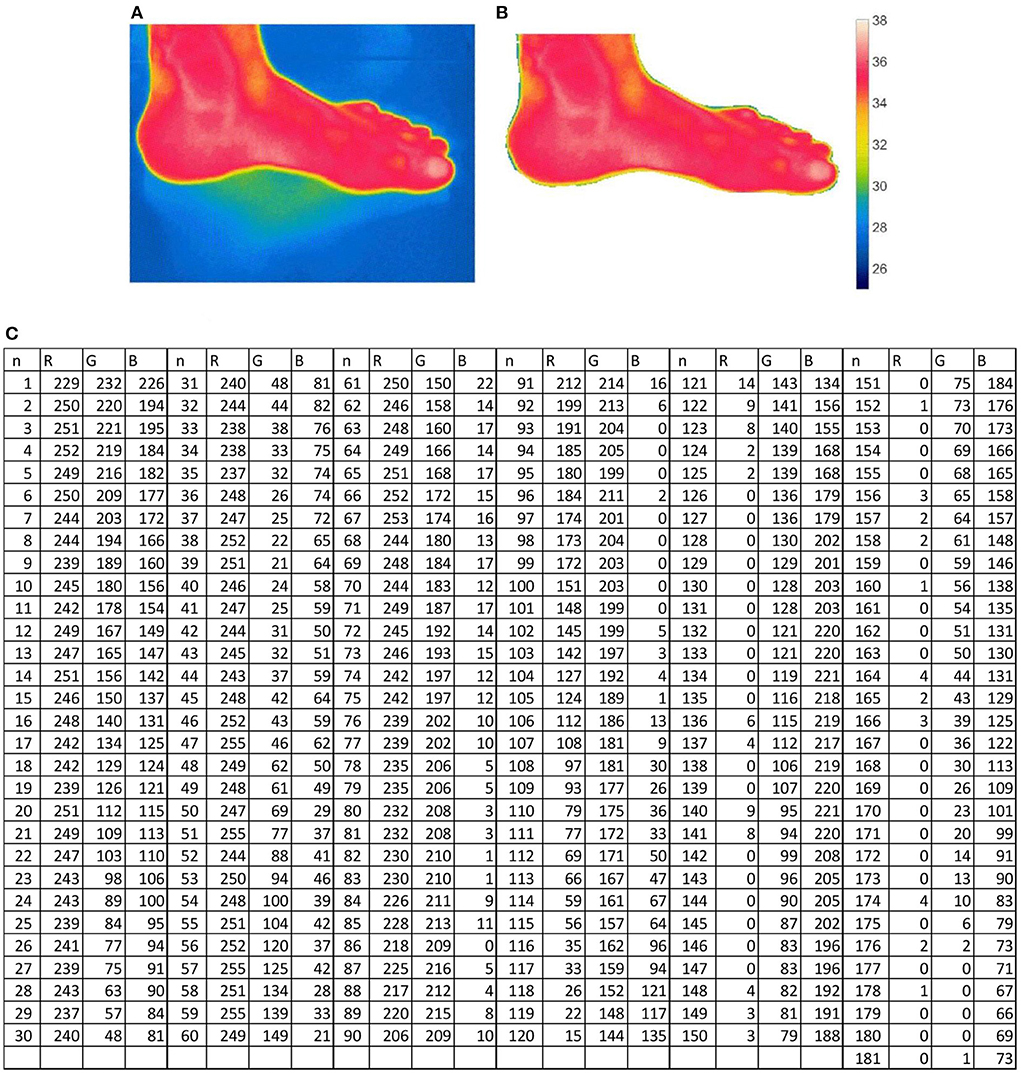
Figure 1. Extracting data from an IR image and video. (A) IR image from camera. (B) IR image after removing background. (C) Colormap values to convert video frame images to index image (n = 181).
Experiment 1: Foot IR data
In experiment 1, IR mages were acquired, and the temperature data was obtained by converting the IR images to a .csv temperature data file. Figure 2 shows the temperature distribution of the left foot when viewed from the anterior, lateral, posterior, and medial sides before and after wearing socks and shoes. After removing the background information, the foot was the ROI. The minimum, maximum and average and standard deviation of the temperature of each participant for the left and right foot and the 4 sides were calculated. The analysis of variance (ANOVA) (Table 2) showed significant differences in average temperature before and after wearing socks and shoes [F(1,83) = 152, p < 0.05] and also the different views of the foot [F(3,83) = 4.71, p < 0.05]. The mean average temperature before wearing socks was 32°C and after wearing socks and shoes it was 34°C. The mean average temperature of the front view was higher than the temperature of the posterior view by 0.8°C. There were no statistical differences among the other views. Figure 2B shows a plot of the minimum, maximum and average temperature values before and after wearing socks and shoes. The average temperature of the foot is higher after wearing socks and shoes for 3 h.
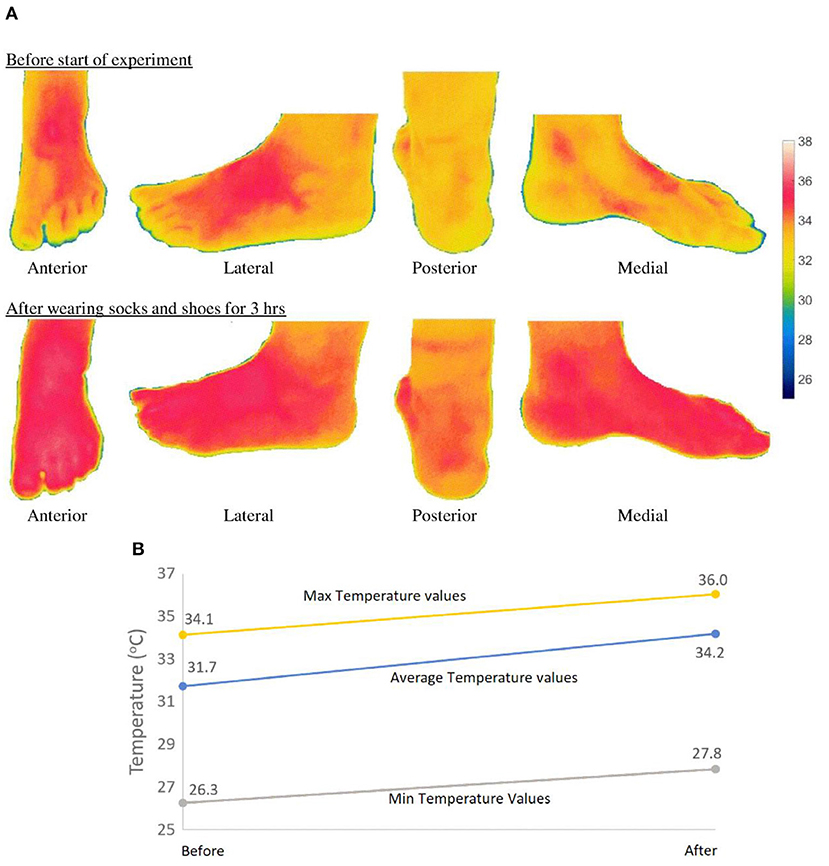
Figure 2. Temperature (°C) distribution on the foot. (A) Plots of temperature (°C) distribution on foot surface. (B) Plots of mean values of all participants the min, average and maximum temperature values (before and after).

Table 2. Analysis of variance.
Experiment 2: Hand IR data
The aim of experiment 2 was to demonstrate the use of qualitative and time-domain analysis. In experiment 2, video data was acquired from the IR camera. Figure 3A shows the thermograms of the dorsal side of the hand after submerging the hand in ice-cold water for 1 min. Figure 3B shows the thermograms of the plantar side of the hand after submerging the hand in ice-cold water for 1 min. The thermograms show the temperature changes at 10 s intervals over a total time of 15 min. For qualitative as well as quantitative analysis of IR video data, the setting of the minimum temperature and maximum temperature values of the color-coded temperature scale is important. Several trials were carried out to decide on the minimum temperature (= 15°C) and maximum temperature (37°C) values of the color-coded temperature scale. If the minimum temperature is set to lower values, then the hand will appear “white” after a few minutes. If the minimum temperature is set to a higher value, then the venous structures of the hand will not be very visible. Thus, the maximum temperature was set to 37°C, as the normal body temperature is around 37°C. An image mask at a selected time frame (T = 20 s) was used to remove the background data. During data recording, the hand was still, and hence using one image mask was sufficient to remove the background from all images in the video.
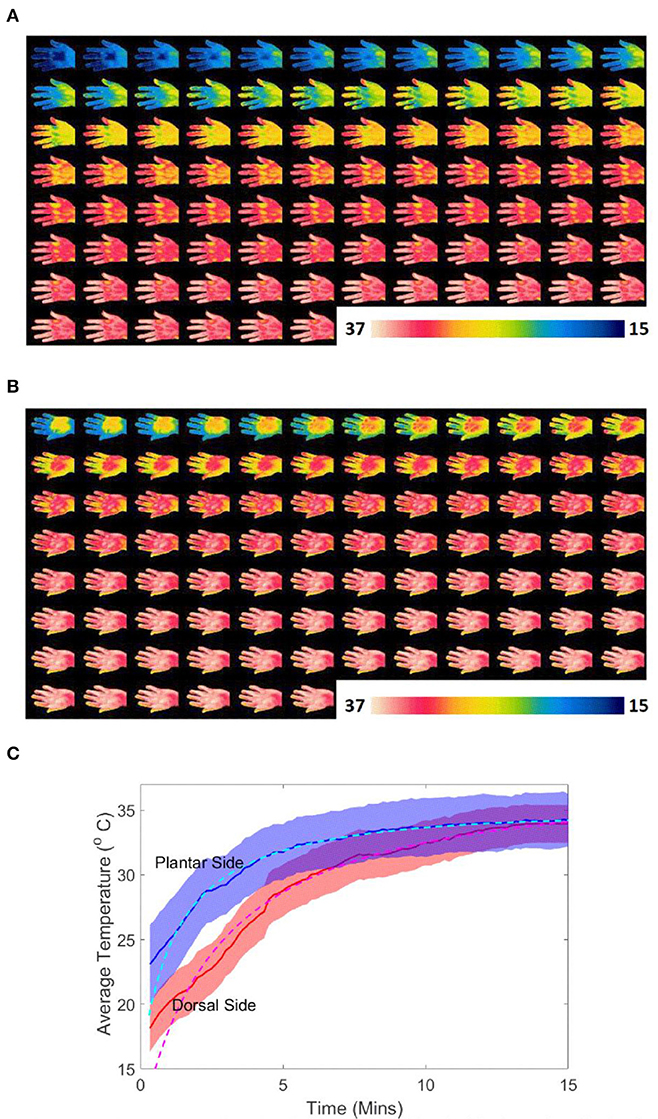
Figure 3. Temperature on the dorsal and plantar sides of the hand after dipping hand in ice cold water for 1 min. (A) Thermal images of the dorsal side of the hand after dipping hand in ice cold water for 1 min (total time = 15 min, time interval 10 s). (B) Thermal images of the plantar side of the hand after dipping hand in ice cold water for 1 min (total time = 15 min, time interval 10 s). (C) Average temperature on dorsal and planter side of hand with time after dipping hand in ice cold water for 1 min (shaded shows the ±SD range).
In Figure 3A, when the hand warms up, the dorsal venous network is visible. In health screenings, the rate of change of temperature and the heat contours can provide important information about blood flow. From Figures 3A,B, it can be seen that the dorsal side is colder than the plantar side when putting the hand in cold water for the same amount of time. On the plantar side, the venous network is not clear. This is due to the difference in dorsal and plantar hand anatomy. The variation of the average temperature on the dorsal (red line) and plantar side (blue line) of the hand, over time, after submerging the hand in ice-cold water for 1 min (shaded shows the ±SD range) is shown in Figure 3C. The figure also shows the trend as a dotted line. The equations corresponding to the temperature trend line of the dorsal and plantar sides (TDorsal and TPlantar) are given in Equations (2) and (3), respectively.
Experiment 3: Head IR data
In experiment 3, video data was acquired from an IR camera. The temperature values were extracted based on a color-coded temperature scale (minimum temperature value 24°C and maximum temperature value 36°C). A circular region of radius 25 pixels was selected. The circle and the center of the circle is shown in Figure 4. The IR data was collected for about 20 min, but for this paper, we present only a selected portion (1 min) to analyze the breathing cycle. Figure 4 also shows instances of the IR temperature when breathing in and breathing out using two face masks. The time series plot for the mean temperature values in the selected circular region is shown in Figure 4. Since the time series data shows periodicity, the data was modeled using Fourier series. The general formula of the Fourier series is given in Equation (4). T is the average time of the selected circular region and t is the time in seconds. a0, ai, bi and w are model constants. The Fourier series model was developed using non-linear least squares estimation and was computed in Matlab. The fourier series model was developed using Non-linear Least Squares estimation model and was computed in Matlab. The Curve Fitting Toolbox of Matlab is needed and the function “fit” with Fourier Series Model Names (fourier1, fourier2, fourier3, …) was used. The values for the coefficient of the models are shown in Table 3, when n = 1, 2, and 3. If we consider n = 1, for N95 face mask Fourier series model, the values and the 95% confidence bound for the constants are: a0 = 26.97 (26.92, 27.01), a1 = −1.25 (−1.32, −1.18), b1 = −0.31 (−0.43, −0.18) and w = 1.02 (1.02, 1.02). For the surgical mask fourier series model, the mean values and the 95% confidence bounds for the constants are: a0 = 29.21 (29.20, 29.21), a1 = −0.14 (−0.16, −0.12), b1 = 0.09 (0.07, 0.11) and w = 1.08 (1.08, 1.09). It can be seen from Figure 4, that the average temperature of the surgical mask (≈29°C) is higher than the N95 mask (≈27°C). The breathing cycle period is given by 2*pi/w. For the N95 face mask, the mean value and the 95% confidence bounds for the period are 6.17 s [6.15 6.19]. For the surgical mask, the mean value and the 95% confidence bounds for the period are 5.79 s [5.77 5.82]. The study shows that different types of masks can affect the breathing rate.
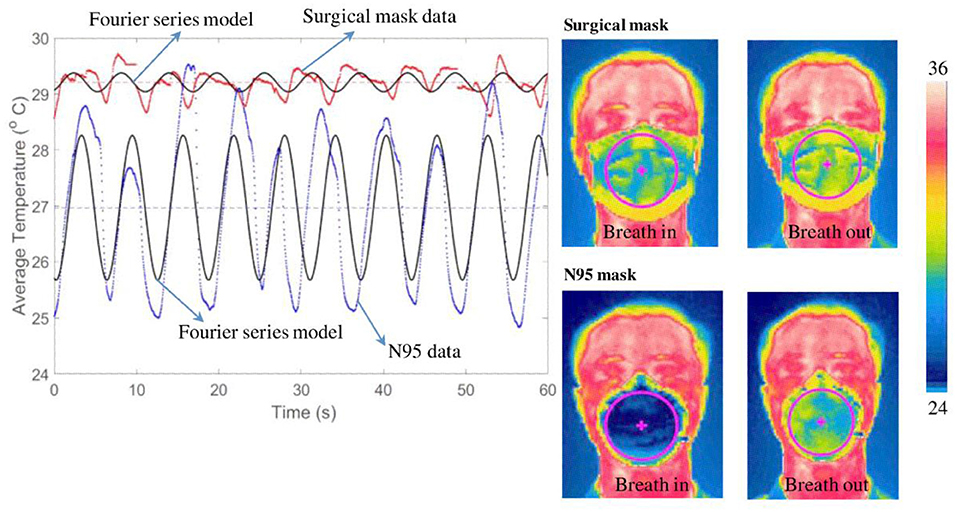
Figure 4. Mean temperature variation over time when wearing different face masks.
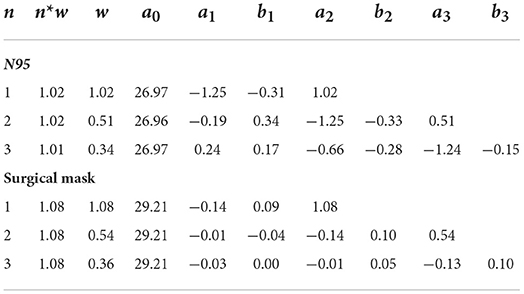
Table 3. Coefficients of the Fourier series model.
For the surgical mask, the breathing rate = 60/5.7928 ≈ 10 breaths per minute, and for the N95 mask, the breathing rate = 60/6.17 = 9.7 breaths per minute. This experiment illustrates the application of a Fourier series model for IR data analysis.
Experiment 4: Whole body IR data
The different steps for analyzing the whole body are shown in the flow chart Figure 5.
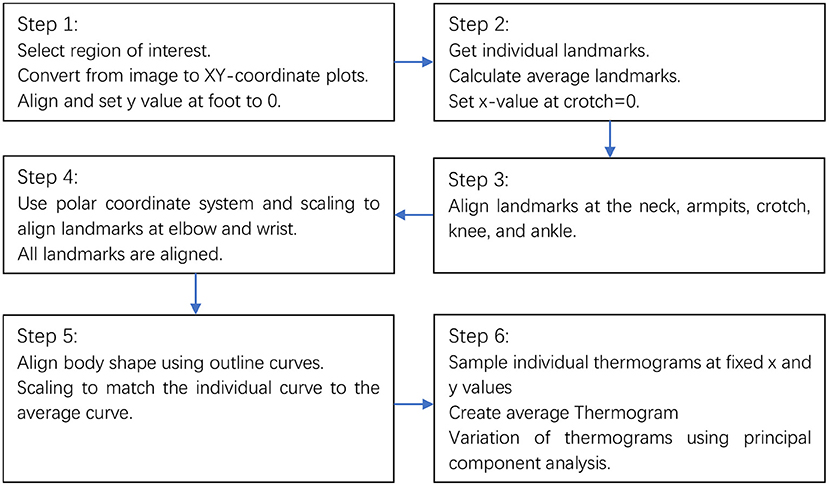
Figure 5. Flow chart for the analysis.
Step 1
The IR images for one participant and the XY surface plots (x and y units are in pixels) are shown in Figure 6. The IR data points i for participant j and side k (front or back) is given by point Pijk with coordinates (xijk, yijk)| where i = 1,…, Njk; j = 1,…, 15; and k = 1,…, 2. Njk is the number of data points for participants j and side k. The plots of all the data are shown in Figure 7. Rotations and translations were used to transform participants' data into an upright position as shown in Figure 7.
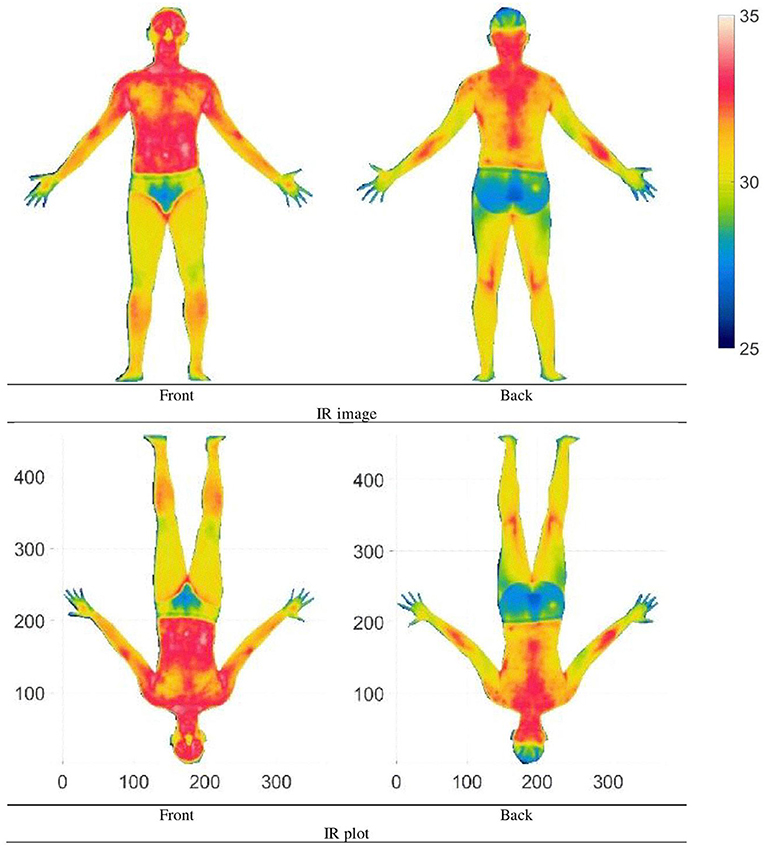
Figure 6. Whole-body IR image of an individual (Units: Pixel).
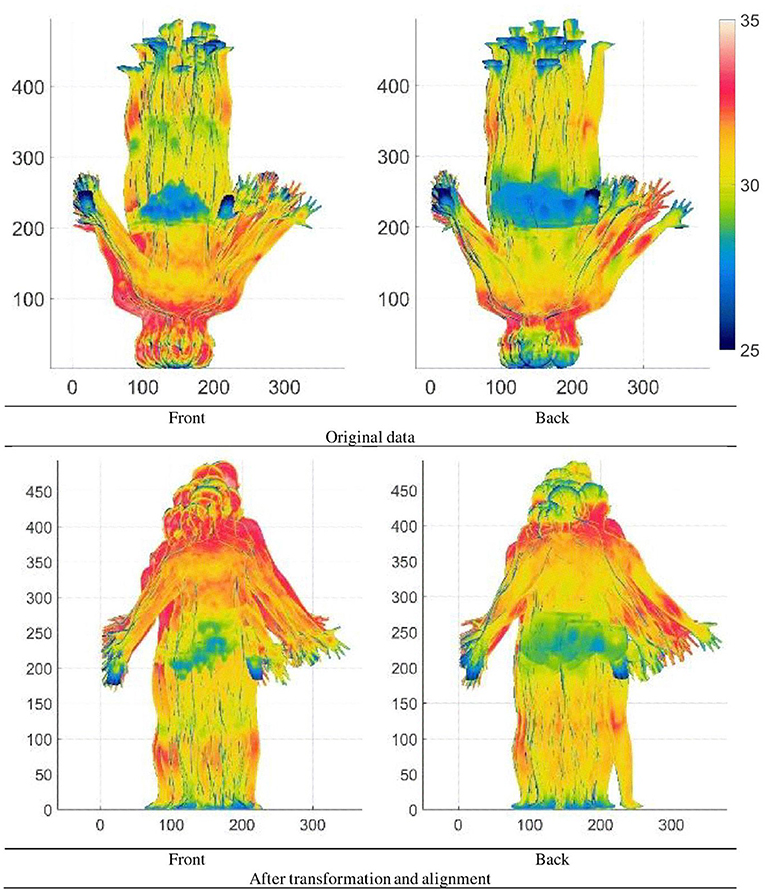
Figure 7. Whole-body IR plots of all participants (Units: Pixel).
Step 2
Landmarks are the way to register multiple images. These reference landmarks can be added either automatically or manually. In this paper, 12 landmarks were manually selected (crotch (LCrotch), ankle [positive side (PLAnkle) and Negative side (NLAnkle)], positive and negative side of knee (PLKnee and NLKnee), positive and negative side of Armpit (PLArm and NLArm), positive and negative side of elbow (PLElbow and NLElbow), positive and negative side of wrist (PLWrist and NLWrist) and neck (LNeck). The landmarks are shown in Figure 8. The landmark i for participant j and side k (front or back) is given by point Lijk with coordinates (Lxijk, Lyijk) where i = 1,…, 12; j = 1,…, 15; and k = 1,…, 2. The mean points of the landmarks are then calculated. The average landmark i for side k is given by point ALik with coordinates (ALxik, ALyik) where i = 1,…, 12; and k = 1,…, 2. For one participant, the individual and average landmarks are shown in Figure 8. The average landmarks are represented by black circles, while the individual landmarks are represented by black dots.
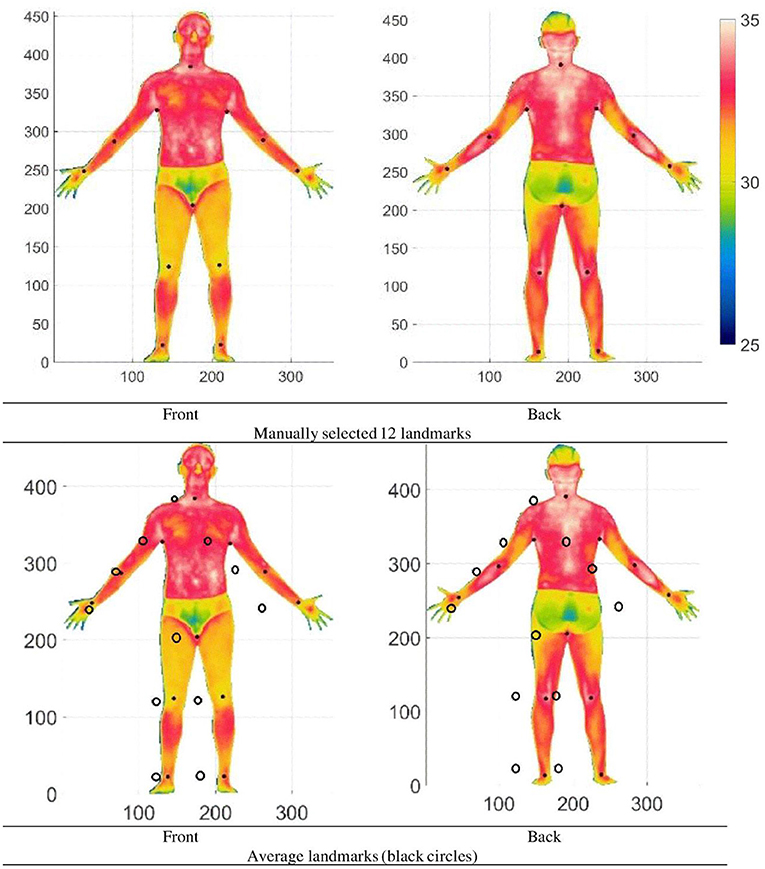
Figure 8. The 12 landmarks and the average of the landmarks (Units: Pixel).
Step 3
The individual IR data is first matched at the neck landmark. Then IR data is multidimensionally scaled (Luximon and Luximon, 2009; Chao et al., 2015) to match the individual x and y values of the landmarks at the armpits, crotch, knees and ankles to the x and y of the average respective landmarks as shown in Figure 9. If the y-value of an average landmark is yLA and the y-value of individual landmark is yLI all the points between y = 0 to yLI can be scaled by a scale factor yLA/yLI. By scaling different sections between the landmarks and scaling in x and y direction, the landmarks are matched. This is basically the multidimensional scaling technique.
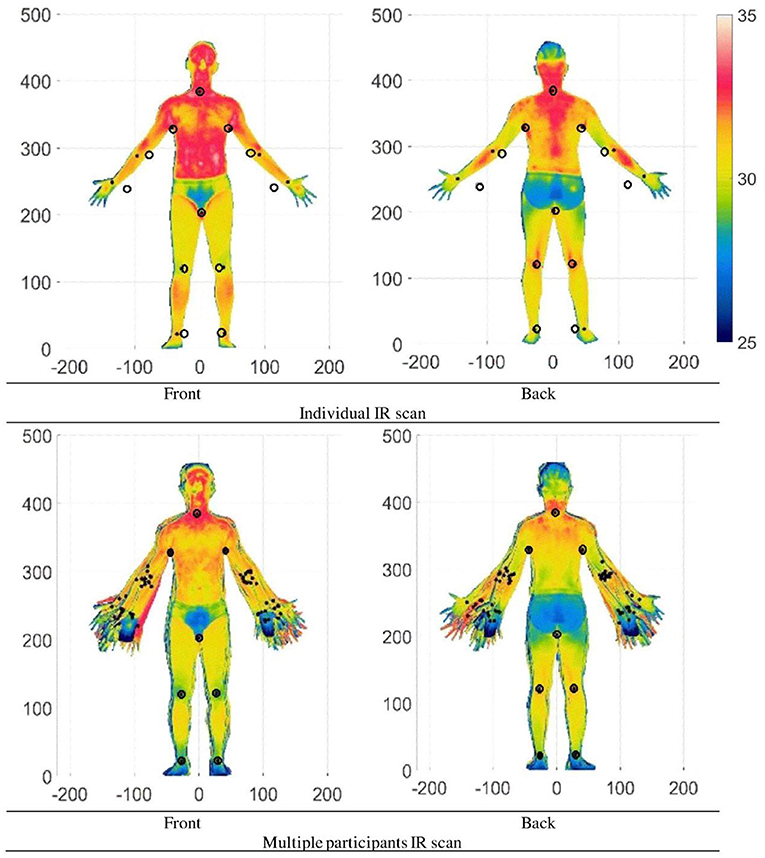
Figure 9. IR plots after matching the x and y values at the neck, armpits, crotch, knee, and ankle (Units: Pixel).
Step 4
IR data is transformed to match the individual x and y values of the landmarks (elbows and wrists) to the average x and y values of the landmarks (elbows and wrists). To do this, we used polar coordinate transformation (use matlab code cart2pol) with the arm pit landmark as reference point and then multidimensional shear and scaling to match the landmarks at the elbow (Figure 10). If the xy-value of an average landmark is (xLA, yLA) and the xy-value of individual landmark is (xLI, yLI) and yLA= yLI. The difference in x-value at yLA is dx = xLA – xLI. For any individual points (xi, yi) using shear transformation, xi = xi + dx/ yLA. When considering selected region and the center point, shear can be applied to deform the shape. The location of the center point Figure 10 (right image) is at the center of the arm pit to the shoulder position. The value can be adjusted to provide accurate and realistic deformation. The elbow was used as a reference to match the wrist using multidimensional shear and scaling. Figure 11 shows the plots of an individual and plots of all the participants, respectively.
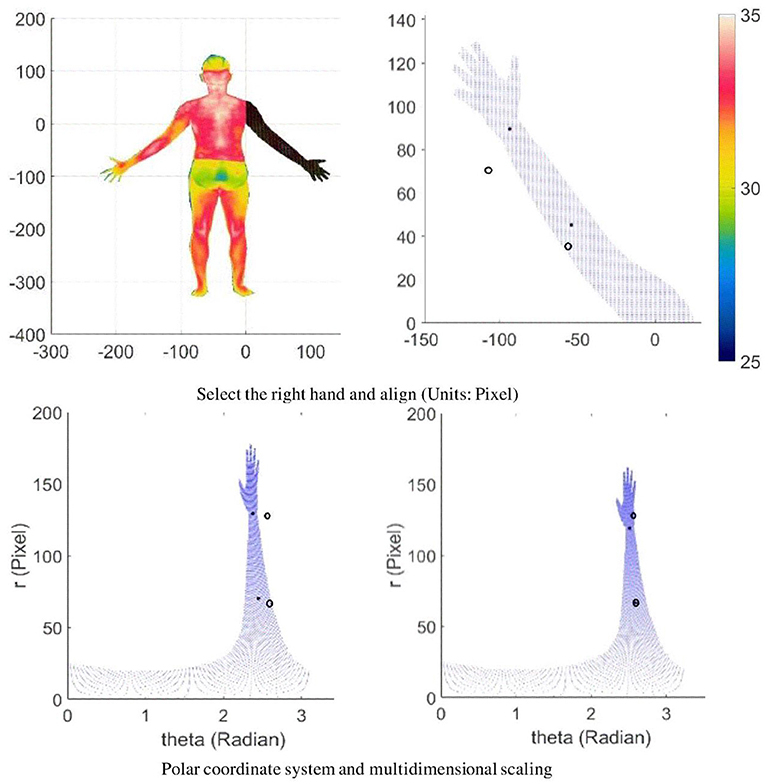
Figure 10. Hand in the polar coordinate system followed by multidimensional scaling to match landmark at the elbow.
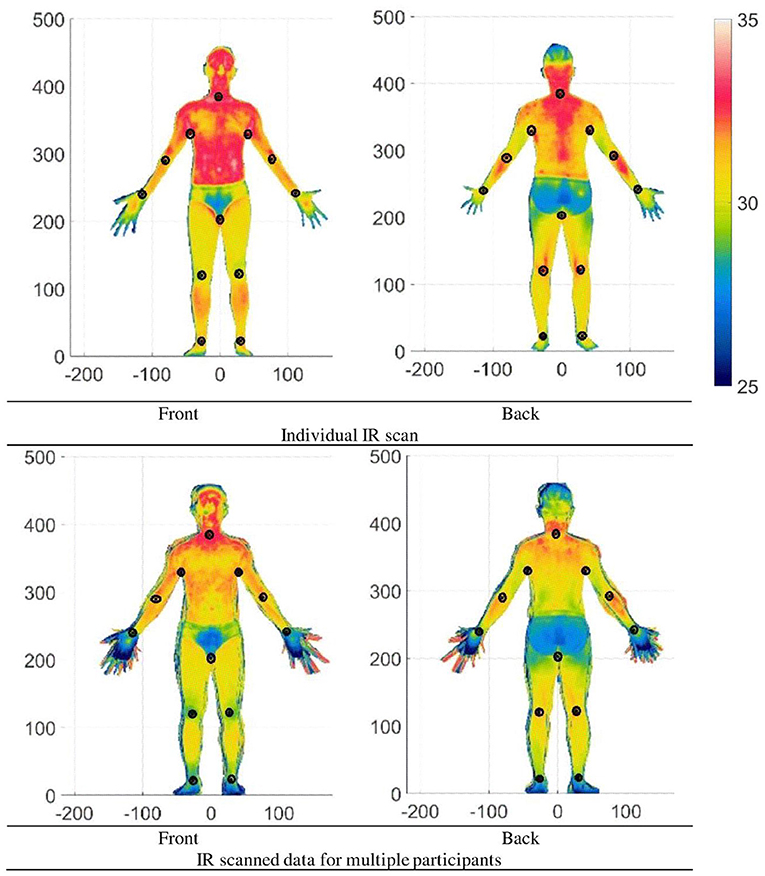
Figure 11. IR scanned data after matching all landmarks (Units: Pixel).
Step 5
The whole-body IR data has potential applications in the design of functional clothing, hence the extremities such as the hand, feet and head data were not used. Generally, if the hand, head and feet are the ROI, then accurate data of these extremities are separately obtained. Figure 12 shows the plots of all the participants' data without the head and extremities. Although the data looks aligned and overlapped, due to different body types, the outline of the shapes does not match exactly. To match the shape of all participants exactly, 8 outline curves (Ci where i = 1,…, 8) are extracted. As an example, the curves C1 of all participants are shown and the average of the curves is calculated and plotted (in red) as shown in Figure 13. Using the outlines as a guide, the IR data are scaled using multidimensional scaling to match the average outline curves (Figure 13).
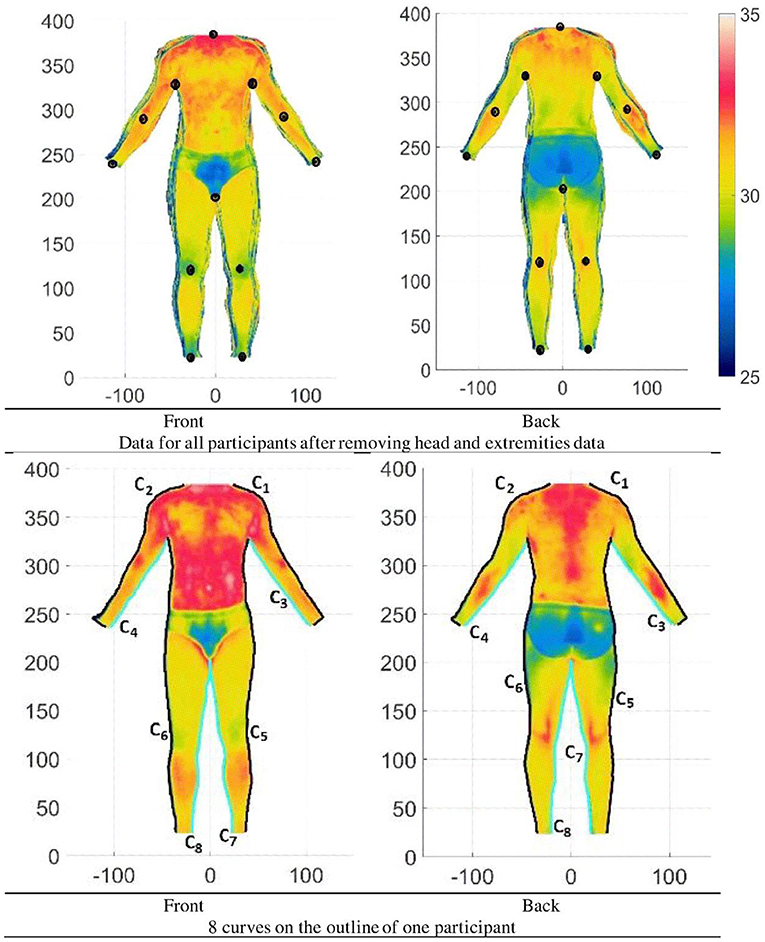
Figure 12. Whole-body IR scanned data after matching all landmarks and removing head and extremities data and extracting outline curves (Units: Pixel).
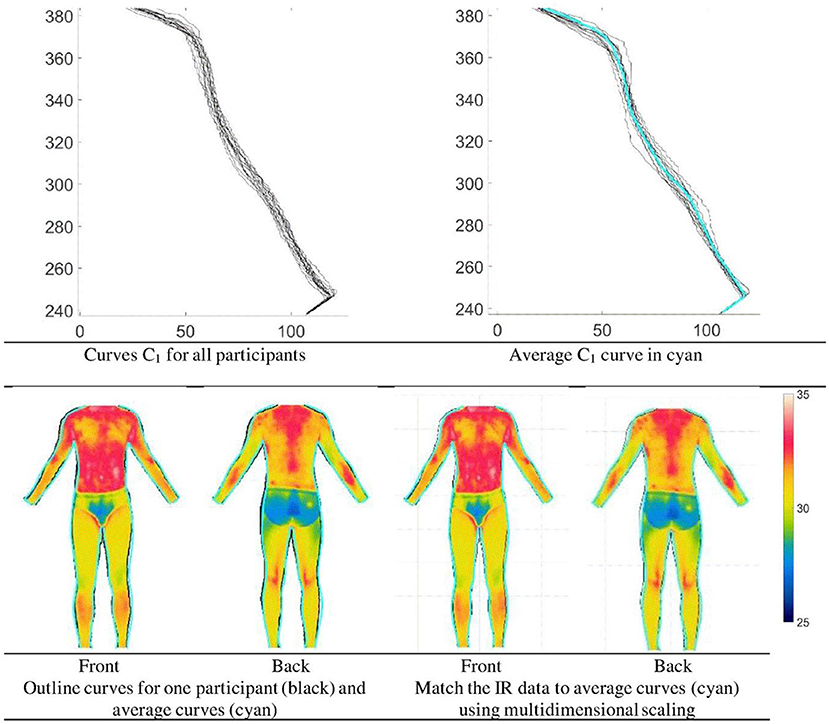
Figure 13. Outline curves and multidimensional scaling to match average outline curves (Units: Pixel).
Step 6
Although the IR data are bounded by the average outline curves, the number of data points is not the same for different participants. For statistical analysis such as principal component analysis (PCA) (matlab function pca), the IR data were uniformly sampled to have the same number of data points for all participants. After sampling the mean and mean ± SD of the IR data based on all participants are shown in Figure 14. Using the sampled data principal component analysis is carried out. The results of the first 4 principal components (PCi where i = 1,…, 4) are shown in Figures 15, 16 for the back and front sides of the human body. From Figures 15, 16, it can be seen that PC1 is related to the IR distribution of the whole body. When PC1 is low, the temperature of the whole body is low and vice versa. From Figure 15, it can be seen that the PC2 of the back side of the whole body is somewhat related to the IR distribution of the extremities and torso. In general, with increasing PC2 values, the temperature of the extremities increases and the temperature of the torso decreases. PC3 is somewhat related to the IR distribution of the leg. With increasing PC3 values the temperature of the leg decreases. PC4 is somewhat related to the IR distribution of the upper arm and leg. In general, with increasing PC4 values the temperature of the upper arm and leg decreases. From Figure 16, it can be seen that the PC2 of the back side of the whole body is somewhat related to the IR distribution of the leg. In general, with increasing PC2 values, the temperature of the leg increases. PC3 is somewhat related to the IR distribution of the arm and lower leg. In general, with increasing PC3 values, the temperature of the arms increases, and those of the lower leg decrease. PC4 is somewhat related to the IR distribution of the upper leg. In general, with increasing PC4 values, the temperature of the upper leg decreases.
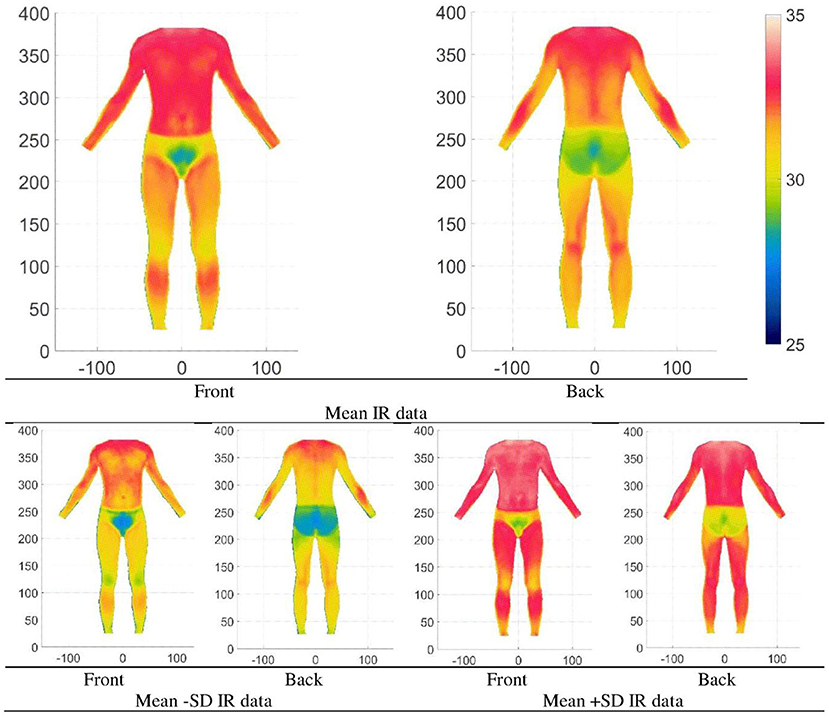
Figure 14. Mean and Mean ± SD IR data of whole body-based on all participants (front and back) (Units: Pixel).

Figure 15. Mean and Mean ± SD IR data of whole-body based on all participants (Back) (4 factors explained = 79% variance).
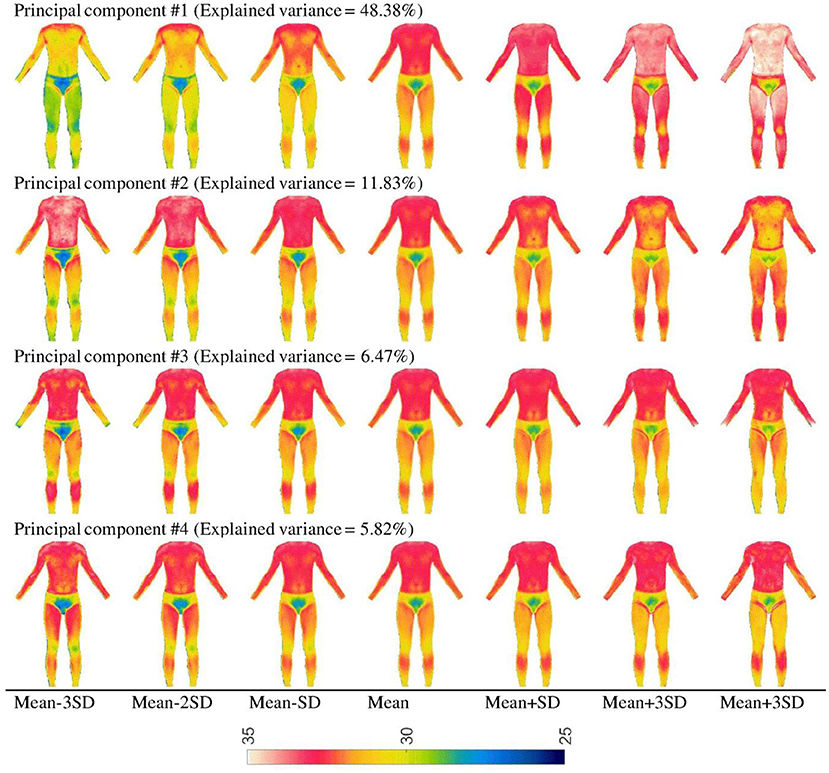
Figure 16. Mean and Mean ± SD IR data of whole-body based on all participants (Front) (4 factors explained = 72.5% variance).
Discussion and conclusion
Thermographic study of the human being has been popular for decades. With the advent of high precision InfraRed cameras, the potential for thermographic studies is widespread. Thermography provides a non-intrusive way to provide the state of the internal structure and processes. Changes in the skin surface temperature is an indicator of a person's condition. Recently, Kumar et al. (2022) has provided a review of IR applications in orthopedics and found that IR can provide a form of “heat signature” for medical intervention. With the widespread availability of InfraRed cameras, thermographic studies are finding applications in product design and evaluation (Vitorino et al., 2022). Becerra et al. (2021) have used monitored the hand thermogram when performing repetitive tasks. There are many applications of IR, however the analysis of many studies has been limited to fixed point temperature or subjective evaluations by medical professionals. In this study 4 experiments were carried out to evaluate and quantify the thermogram of human body parts. One of the major contributions in this paper is the use of mathematical model, multidimensional scaling and deformations, image and video analysis using IR data.
When considering the foot, results showed that the average temperature of the foot is higher after wearing socks and shoes for 3 h. Similar situations arise when wearing clothes, protective equipment and even wearables. The average temperature changes and this affects normal body functioning unless the clothing or other wearables match the person's heat dissipation. Such temperature elevations are important because higher temperatures and humid environments are responsible for foot illnesses such as tinea pedis (Luximon et al., 2017).
With the application of qualitative analysis, IR video data analysis and mathematical trend modeling, we showed the differences in temperature changes at different region of the hand. This method can be used to develop standards for healthy blood flow and medical diagnostics of hand related diseases. Similar techniques can be used to evaluate the blood flow in feet and used for diabetic foot diagnostics.
The study on the whole body showed the use of multidimensional scaling, shear scaling, multidimensional deformation, and averaging techniques to evaluate different body shapes. In addition, the use of principle component analysis showed the main variations in thermograms among population. Four factors represent the variations. From the side of the body, PC1 represent the variation of hot and cold, PC2 is somewhat related to the differences between the back of the body and the extremities. PC3 is somewhat related to the IR distribution of the leg. PC4 is somewhat related to the IR distribution of the upper arm and leg. When considering from back of the body, PC1 represent the variation of hot and cold of the whole body. PC2 is somewhat related to the extremities, especially the leg. PC3 is somewhat related to the arm and lower leg. PC4 is somewhat related to the upper leg.
The study of the face and different type of masks showed that the face masks can affect breathing rate. For surgical masks, breathing rate was 10.0 breaths per minute and for N95 masks, breathing rate was 9.7 breaths per minute. For an adult, while resting the normal respiration rate at rest is 12 to 20 breaths per minute and respiration rates of <12 or >25 breaths per minute is considered abnormal (www.healthline.com).
This study illustrates the application of multivariate statistics such as PCA based on IR data. Additionally, application of qualitative analysis, IR video data analysis and mathematical trend modeling based on IR data was also illustrated in this study. The study also illustrated the use of Fourier series modeling in IR data analysis when there is cyclic data. The result of this study has application in the analysis of thermographic data. Thermographic data has applications in comparison between groups; classification and grouping; sizing and grading; customization of products; product design, assessment, and evaluations.
Thermography has evolved rapidly these few years and the accuracy of IR cameras has improved while the cost has reduced quite significantly. Although thermography has had its main applications in the medical field, nowadays thermography is being used in a wide range of applications including product design and evaluation and ergonomics. New applications require complex data analysis and data representations and research in this area is needed. Furthermore, with the current pace of development, it seems possible to have an IR camera in our mobile devices. With the widespread use of IR cameras, IR will start to have applications in normal daily life and this will require research in IR data analysis, modeling and visualizations.
There are some limitations in the paper. The sample sizes were not large as the study focus was to explore different analysis methods and its application in the analysis of thermal data, especially time domain data. More studies are needed to create a general model of thermal distribution for the human body and the different body parts. More research is needed for different age group with different Body Mass Index (BMI), gender, and culture in lab as well as field studies.
Data availability statement
The raw data supporting the conclusions of this article will be made available by the authors, without undue reservation.
Ethics statement
The studies involving human participants were reviewed and approved by the Hong Kong Polytechnic University, Shenzhen University. The patients/participants provided their written informed consent to participate in this study. Written informed consent was obtained from the individual(s) for the publication of any potentially identifiable images or data included in this article.
Author contributions
AL was responsible for the analysis of data, collecting data for Experiment #1, and writing of the paper. HC was responsible for collecting data for Experiment #4 and reviewing the paper. YL was responsible for collecting data for Experiment #2 and #3 and reviewing the paper. RG was responsible for writing the paper, proofreading, and checking the overall analysis. All authors contributed to the article and approved the submitted version.
Funding
This work was financially supported by Guangdong Natural Science Funds for Ph.D. startup Project (2017A030310141).
Acknowledgments
We thank Dr. Balasankar Ganesan and Abida Younus for collecting the data for Experiment #1. Dr. Balasankar Ganesan is a registered physiotherapist and was involved in evaluating the participants.
Conflict of interest
The authors declare that the research was conducted in the absence of any commercial or financial relationships that could be construed as a potential conflict of interest.
Publisher's note
All claims expressed in this article are solely those of the authors and do not necessarily represent those of their affiliated organizations, or those of the publisher, the editors and the reviewers. Any product that may be evaluated in this article, or claim that may be made by its manufacturer, is not guaranteed or endorsed by the publisher.
References
Barcelos, E. Z., Caminhas, W. M., Ribeiro, E., Pimenta, E. M., and Palhares, R. M. (2014). A combined method for segmentation and registration for an advanced and progressive evaluation of thermal images. Sensors 14, 21950–21967. doi: 10.3390/s141121950
Becerra, A. G., Olguín-Tiznado, J. E., García Alcaraz, J. L., Camargo Wilson, C., García-Rivera, B. R., Vardasca, R., et al. (2021). Infrared thermal imaging monitoring on hands when performing repetitive tasks: an experimental study. PLoS ONE 16, e0250733. doi: 10.1371/journal.pone.0250733
Cade, C. M., and Barlow, B. V. (1967). Fundamental design principles for thermographic scanners. Sci. Progress 55:167–185.
Cardone, D., and Merla, A. (2017). New frontiers for applications of thermal infrared imaging devices: computational psychopshysiology in the neurosciences. Sensors 17, 1042. doi: 10.3390/s17051042
Chao, H., Luximon, A., and Yeung, K. W. (2015). Functional 3D human model design: a pilot study based on surface anthropometry and infrared thermography. Comput. Aided Design Applic. 12, 475–484. doi: 10.1080/16864360.2014.997644
Cruz-Vega, I., Hernandez-Contreras, D., Peregrina-Barreto, H., Rangel-Magdaleno, J. D. J., and Ramirez-Cortes, J. M. (2020). Deep learning classification for diabetic foot thermograms. Sensors 20, 1762. doi: 10.3390/s20061762
Drzazga, Z., Binek, M., Pokora, I., and Sadowska-Krepa, E. (2018). A preliminary study on infrared thermal imaging of cross-country skiers and swimmers subjected to endurance exercise. J. Thermal Anal. Calorimetry 134, 701–710. doi: 10.1007/s10973-018-7311-y
Faust, O., Acharya, U. R., Ng, E. Y. K., Hong, T. J., and Yu, W. (2014). Application of infrared thermography in computer aided diagnosis. Infrared Phys. Technol. 66, 160–175. doi: 10.1016/j.infrared.2014.06.001
Hildebrandt, C., Raschner, C., and Ammer, K. (2010). An overview of recent application of medical infrared thermography in sports medicine in Austria. Sensors 10, 4700–4715. doi: 10.3390/s100504700
Kakileti, S. T., Dalmia, A., and Manjunath, G. (2020). Exploring deep learning networks for tumour segmentation in infrared images. Quant. Infrared Thermogr. J. 17, 153–168. doi: 10.1080/17686733.2019.1619355
Kirimtat, A., Krejcar, O., Selamat, A., and Herrera-Viedma, E. (2020). FLIR vs SEEK thermal cameras in biomedicine: comparative diagnosis through infrared thermography. BMC Bioinformatics 21, 1–10. doi: 10.1186/s12859-020-3355-7
Kumar, P., Gaurav, A., Rajnish, R. K., Sharma, S., Kumar, V., Aggarwal, S., et al. (2022). Applications of thermal imaging with infrared thermography in Orthopaedics. J. Clin. Orthopaed. Trauma 24, 101722. doi: 10.1016/j.jcot.2021.101722
Kwok, G., Yip, J., Yick, K. L., Cheung, M. C., Tse, C. Y., Ng, S. P., et al. (2017). Postural screening for adolescent idiopathic scoliosis with infrared thermography. Sci. Rep. 7, 1–8. doi: 10.1038/s41598-017-14556-w
Liu, X., Wang, Y., and Luan, J. (2021). Facial paralysis detection in infrared thermal images using asymmetry analysis of temperature and texture features. Diagnostics 11, 2309. doi: 10.3390/diagnostics11122309
Luximon, A., Ganesan, B., and Younus, A. (2017). “Effects of socks and shoes on normal foot skin temperature,” in International Conference on Applied Human Factors and Ergonomics (Cham: Springer), 485–492. doi: 10.1007/978-3-319-60591-3_44
Luximon, A., and Luximon, Y. (2009). Shoe-last design innovation for better shoe fitting. Comput. Industry 60, 621–628. doi: 10.1016/j.compind.2009.05.015
Luximon, Y., Anne Sheen, K., and Luximon, A. (2016). Time dependent infrared thermographic evaluation of facemasks. Work 54, 825–835. doi: 10.3233/WOR-162353
Macdonald, A., Petrova, N., Ainarkar, S., Allen, J., Plassmann, P., Whittam, A., et al. (2016). Thermal symmetry of healthy feet: a precursor to a thermal study of diabetic feet prior to skin breakdown. Physiol. Measur. 38, 33. doi: 10.1088/1361-6579/38/1/33
Oliveira, J., Vardasca, R., Pimenta, M., Gabriel, J., and Torres, J. (2016). Use of infrared thermography for the diagnosis and grading of sprained ankle injuries. Infra. Phys. Tech. 76, 530–541. doi: 10.1016/j.infrared.2016.04.014
Perpetuini, D., Formenti, D., Cardone, D., Filippini, C., and Merla, A. (2021). Regions of interest selection and thermal imaging data analysis in sports and exercise science: a narrative review. Physiol. Meas. 42, 8. doi: 10.1088/1361-6579/ac0fbd
Quesada, J. I. P., (ed.). (2017). Application of Infrared Thermography in Sports Science. Cham: Springer, 327–327.
Quesada, J. I. P., Kunzler, M. R., and Carpes, F. P. (2017). “Methodological aspects of infrared thermography in human assessment,” in Application of Infrared Thermography in Sports Science (Cham: Springer), 49–79. doi: 10.1007/978-3-319-47410-6_3
Resmini, R., Silva, L., Araujo, A. S., Medeiros, P., Muchaluat-Saade, D., and Conci, A. (2021). Combining genetic algorithms and SVM for breast cancer diagnosis using infrared thermography. Sensors 21, 4802. doi: 10.3390/s21144802
Ring, E. F. J. (2012). History of thermology and thermography: pioneers and progress. Thermol. Int. 22.
Skomudek, A., Gilowska, I., Jasiński, R., and Rozek-Piechura, K. (2017). Analysis of the dynamics of venous blood flow in the context of lower limb temperature distribution and tissue composition in the elderly. Clin. Interv. Aging. 12, 1371. doi: 10.2147/CIA.S137707
van Doremalen, R. F., van Netten, J. J., van Baal, J. G., Vollenbroek-Hutten, M. M., and van der Heijden, F. (2020). Infrared 3D thermography for inflammation detection in diabetic foot disease: a proof of concept. J. Diabetes Sci. Technol. 14, 46–54. doi: 10.1177/1932296819854062
Keywords: ergonomics, thermal models, InfraRed images, InfraRed video, multivariate analysis, Industry 4.0, heat mapping, thermal camera
Citation: Luximon A, Chao H, Goonetilleke RS and Luximon Y (2022) Theory and applications of InfraRed and thermal image analysis in ergonomics research. Front. Comput. Sci. 4:990290. doi: 10.3389/fcomp.2022.990290
Received: 09 July 2022; Accepted: 26 September 2022;
Published: 12 October 2022.
Edited by:
Upal Mahbub, Qualcomm, United StatesReviewed by:
Bo Lei, Xi'an University of Post and Telecommunications, ChinaJörg Miehling, Friedrich-Alexander-Universität Erlangen-Nürnberg, Germany
Copyright © 2022 Luximon, Chao, Goonetilleke and Luximon. This is an open-access article distributed under the terms of the Creative Commons Attribution License (CC BY). The use, distribution or reproduction in other forums is permitted, provided the original author(s) and the copyright owner(s) are credited and that the original publication in this journal is cited, in accordance with accepted academic practice. No use, distribution or reproduction is permitted which does not comply with these terms.
*Correspondence: Huang Chao, chao@szu.edu.cn