Top-down and bottom-up approaches to video quality of experience studies; overview and proposal of a new model
 Kamil Koniuch1*
  Sabina Baraković2
  Jasmina Baraković Husić3 Sruti Subramanian4 Katrien De Moor4* Lucjan Janowski1
  Michał Wierzchoń5,6,7
- 1Institute of Communication Technologies, Faculty of Computer Science, Electronics and Telecommunications, AGH University of Krakow, Cracow, Poland
- 2Faculty of Traffic and Communications, University of Sarajevo, Sarajevo, Bosnia and Herzegovina
- 3Faculty of Electrical Engineering, University of Sarajevo, Sarajevo, Bosnia and Herzegovina
- 4Department of Information Security and Communication Technology, Norwegian University of Science and Technology, Trondheim, Norway
- 5Consciousness Lab, Institute of Psychology, Jagiellonian University, Cracow, Poland
- 6Centre for Brain Research, Jagiellonian University, Cracow, Poland
- 7Jagiellonian Human-Centered Artificial Intelligence Laboratory, Jagiellonian University, Cracow, Poland
Modern video streaming services require quality assurance of the presented audiovisual material. Quality assurance mechanisms allow streaming platforms to provide quality levels that are considered sufficient to yield user satisfaction, with the least possible amount of data transferred. A variety of measures and approaches have been developed to control video quality, e.g., by adapting it to network conditions. These include objective matrices of the quality and thresholds identified by means of subjective perceptual judgments. The former group of matrices has recently gained the attention of (multi) media researchers. They call this area of study “Quality of Experience” (QoE). In this paper, we present a theoretical model based on review of previous QoE’s models. We argue that most of them represent the bottom-up approach to modeling. Such models focus on describing as many variables as possible, but with a limited ability to investigate the causal relationship between them; therefore, the applicability of the findings in practice is limited. To advance the field, we therefore propose a structural, top-down model of video QoE that describes causal relationships among variables. This novel top-down model serves as a practical guide for structuring QoE experiments, ensuring the incorporation of influential factors in a confirmatory manner.
1 Introduction
The quality of multimedia is a subject of interest for many practitioners and researchers in various domains, including telecommunications engineering, speech, audio and video processing, psychophysics, human-computer interaction, psychology, ergonomics, human factors research, and innovation and economics (Raake and Egger, 2014). Quality of Experience (QoE) as a part of the broader field of multimedia research focuses on the subjective quality perception of a wide range of multimedia services. More concretely, QoE research aims to identify factors and features that are key to enabling or inhibiting good user experiences and to optimize them so that the produced quality levels are perceived as high, able to satisfy users’ expectations and contribute to users’ willingness to reuse the service in the future (Möller and Raake, 2014).
For many years, the literature was fragmented with respect to conceptual interpretations and definitions of QoE [see, (e.g., De Moor, 2012) for an overview]. However, a more recent community-level effort as part of the Qualinet project resulted in a new, holistic definition (Brunnström et al., 2013). According to this definition, QoE is “the degree of delight or annoyance of the user of an application or service. It results from the fulfillment of his or her expectations with respect to the utility and/or enjoyment of the application or service in the light of the user’s personality and current state.” This definition is very broad and covers multimedia in general. In practice, experts in different types of multimedia [e.g., web browsing (Baraković and Skorin-Kapov, 2015; Baraković and Skorin-Kapov, 2017a)], unified communications (Baraković Husić et al., 2020; Barakovic Husic et al., 2021), sound (Ragano et al., 2019), and gaming (Laghari et al., 2019) study specific multimedia services separately. This is due to the fact that different use cases and types of services require an understanding of the key factors that play a role and that can be taken into account to improve QoE. These key factors tend to be application and use case-specific, and hence lead to a diverse set of variables to be operationalized, captured, and understood.
For this reason, describing models specific to one multimedia type might be beneficial, as they can provide actionable insights for a certain type of service. In this paper, motivated by both the relevance of insights to industry players in the video streaming ecosystem and the ever-increasing share of Internet traffic that is due to video-based services, we will focus only on QoE in the context of video streaming. Our aim is, however, to refine and adjust the model presented in this paper so that it also becomes applicable to other types of multimedia services in the future.
In the context of video quality, modern services use insights from research for the improvement and optimization of user experience. For example, user assessments helped develop video multimethod assessment fusion (VMAF), an objective full-reference metric that predicts subjective ratings automatically (Li et al., 2016). These types of metrics are used in the development of new video compression algorithms that aim for the reduction of energy consumption. As a result, quality-aware optimization may help to increase the sustainability of video-on-demand services (Lee et al., 2019). Thus, QoE studies can be part of the growing research on the influence of video services on the natural environment (Chandaria et al., 2011; Ejembi and Bhatti, 2015; Batmunkh, 2022).
In this context, estimating aspects relating to the sustainability of services (e.g., energy efficiency) is possible because the QoE concept not only describes the user interaction with the service but also provides a framework for optimization. Specifically, the latter is possible due to standardized measurement and test protocols, which allow researchers to measure subjective judgments of quality. In traditional standardized experiments on video QoE, short, soundless video clips are used as stimuli (ITU-R, 2020). After the presentation of each stimulus, a single subjective quality judgment is collected. This procedure is repeated for dozens of videos, and the same content is presented multiple times. A key criticism of this approach is that this research paradigm is simplistic and limits the scope of the investigated variables. In effect, it offers reliable results but provides little insight into how people perceive video quality in their natural environment, where users are influenced by many factors besides the quality of video compression. Thus, metrics stemming from data sets gathered with this paradigm might misjudge everyday user experience, including associated cognitive processing and implications for user behavior.
To meet this challenge, researchers have investigated influential factors (IFs) of QoE. IFs are defined as “any characteristic of a user, system, service, application, or context whose actual state or setting may have an influence on the Quality of Experience for the user” (Brunnström et al., 2013). In the context of video services, there is a plethora of variables that could potentially influence the user. Furthermore, researchers have investigated perceptual dimensions (PDs) or “perceptual features” of QoE (Baraković Husić and Baraković, 2022). These variables are defined as “perceivable, recognizable, and nameable characteristics of the individual’s experience of a service which contributes to its quality” (Jekosch, 2005). The concept of PDs highlights the differences between objective changes in stimuli or context and the subjective perception of those changes.
Consequently, QoE can be considered a multidimensional concept with many variables that need to be considered when designing an experiment. As human perception is a key component of QoE, many of those variables are latent. A strong theoretical background is therefore necessary to provide comparable operationalization and experimental procedures. Accordingly, a series of extensive theoretical models have been proposed to describe the complex character of QoE (Geerts et al., 2010; Brunnström et al., 2013; Egger et al., 2014; Möller et al., 2014; Raake and Egger, 2014; Reiter et al., 2014; Reichl et al., 2015; Robitza et al., 2016; Schmitt et al., 2018; Baraković Husić and Baraković, 2022). They comprise many variables and provide a taxonomy of IFs and PDs.
To investigate which of these IFs are most important for QoE, researchers use exploratory study designs that are often based on self-report approaches, such as questionnaires (Zhu et al., 2015; Baraković Husić and Baraković, 2022). The study by Baraković Husić and Baraković (2022) emphasizes system-related parameters such as video resolution, coding tree unit (CTU) size, and constant rate factor (CRF), along with human factors like viewer’s gender, education, and experience with media services, as significant influencers of perceived quality and ease of use in video streaming. Contextual factors such as viewing location and lighting conditions were also highlighted. On the other hand, Zhu et al. (2015) found that social context, specifically co-viewing with friends, and content genre significantly affect user satisfaction and endurability, which are key aspects of QoE. Moreover, their study indicated that while bitrate levels influenced perceived visual quality, they did not affect overall satisfaction, enjoyment, or endurability, suggesting that non-technical factors can be equally if not more important in shaping the QoE.
As demonstrated by the comprehensive range of factors assessed in both the Baraković Husić & Baraković and Zhu et al. studies, with this method, researchers are able to measure a vast number of variables in a natural context (Staelens et al., 2010). This approach to the study of IFs and PDs can be described as bottom-up (see Figure 1). Modeling approaches. Figure sizes represent the number of variables in the model and arrows.
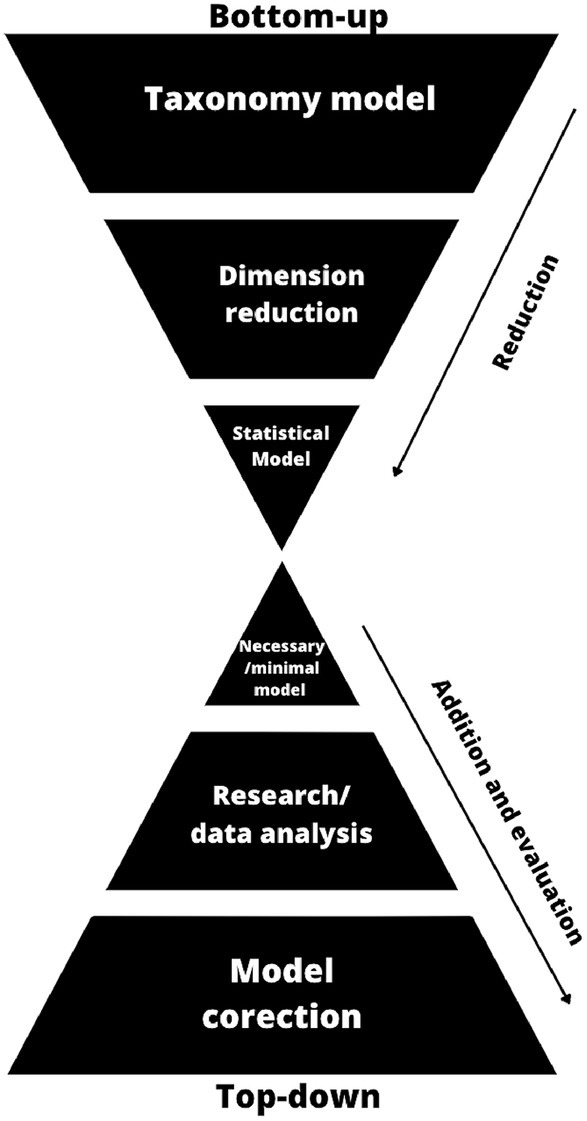
Figure 1. Modeling approaches. Figure sizes represent the number of variables in the model and arrows.
In this method, the goal is to investigate as many variables as possible.
Nevertheless, research designed with the bottom-up approach often does not allow for the investigation of the causal relationship between variables in the model. Without this information, models can miscalculate the importance of certain IFs or PDs due to the misinterpretation of confounding variables (McElreath, 2020). A top-down approach is more suitable to investigate how information about causal relationships between variables can change the estimation of their influence (Figure 1). Modeling approaches. Figure sizes represent the number of variables in the model and arrows.
This method allows for the investigation of not only the influence of the predictors but also their interrelations in the form of a graph. Moreover, the use of diagrams describing the relationships between variables clarifies the experimental design process. With a visual representation of assumptions and variables, it is easier to find adequate statistical methods and to communicate the conclusions with other researchers. In effect, it is easier to design experiments that are comparable with previous studies. Although they thus have clear advantages, to the best of our knowledge, there is a limited number of QoE studies that use top-down approaches, i.e., models that start with a predefined list of variables and test their influence.
Given the above, this paper aims to present a novel video QoE model that can be verified with experimental data. By leveraging a top-down methodology, our model uniquely facilitates the systematic examination and empirical validation of these variables, setting a new precedent for methodical QoE research. Moreover, our model provides a structure for the investigation of causal relations between IFs and PDs. Finally, we hope that our model will facilitate the discussion by providing a clear taxonomy in QoE studies. In this paper, we will focus on the video QoE, but our model can be adjusted to other use cases. The rest of this paper is organized as follows: in the next section, these two modeling approaches and their advantages and disadvantages are compared and discussed in detail. Furthermore, we present the components of our model with their operationalization. Finally, we present a generalized video QoE model describing the causal relation between variables and discuss the implications for video QoE research.
2 Top-down and bottom-up approaches
To visualize the differences between previously published QoE models and our model, we describe them in terms of bottom-up and top-down approaches (Figure 1). Modeling approaches. Figure sizes represent the number of variables in the model and arrows.
These terms are used to characterize models in various domains, from cognitive processes [e.g., attention; (see Connor et al., 2004)] to the causal direction of subjective wellbeing (Headey et al., 2005). In this paper, we use these terms to underscore differences between approaches in the number of variables taken into account and the type of their analysis. The trade-off between the complexity of models and the amount of information they provide is one of the key problems researchers must address. A good model predicts as much as possible with as few assumptions and variables as possible (Simon, 2001; Gabaix and Laibson, 2008). This property of the model is called parsimony. Only the most important variables must be determined to achieve parsimony. To identify the key components of the model, one can start with as many variables as possible and search for the most important ones. We call this a bottom-up approach (see Figure 1). Modeling approaches. Figure sizes represent the number of variables in the model and arrows.
On the other hand, one can start building the model by defining the minimum number of variables that are necessary and sufficient to describe the phenomenon. We call this a top-down approach. We discuss these approaches below in greater detail.
2.1 Bottom-up approach
The bottom-up approach is typically used for the exploration of data sets. The main goal is to find the most important variables or patterns and, if possible, to identify the latent structure of the phenomenon. Models comprising the most important variables are outcomes of this method. This type of research is often used as a source of hypotheses for following experimental designs. Below, we present a short overview of the bottom-up methods used in QoE research.
Over the years, a vast number of statistical methods have been developed to provide insight into data sets. In the context of QoE research, the statistical analysis method group works on the implementation of new methods in the field (VQEG, 2022). Methods such as principal component analysis (PCA) (Ketykó et al., 2010; Msakni and Youssef, 2016; Baraković Husić and Baraković, 2022) and factor analysis (FA) [(e.g., Özer et al., 2013; Ende, 2015)] are typically used to investigate latent structures in data. Analysis of variance, covariance, and correlations can also be used to investigate data patterns. Recently, machine learning and network analysis approaches have become popular solutions for analyzing complex, nonlinear relations (Youssef et al., 2016). All the abovementioned methods can be used on data sets comprising many variables and factors. Nevertheless, it is impossible to include all the potential IFs and PDs in one experimental setup. Thus, to provide that variety, questionnaires are often used (Ketykó et al., 2010; De Pessemier et al., 2013; Msakni and Youssef, 2016; Baraković Husić and Baraković, 2022). See overview in Table 1.
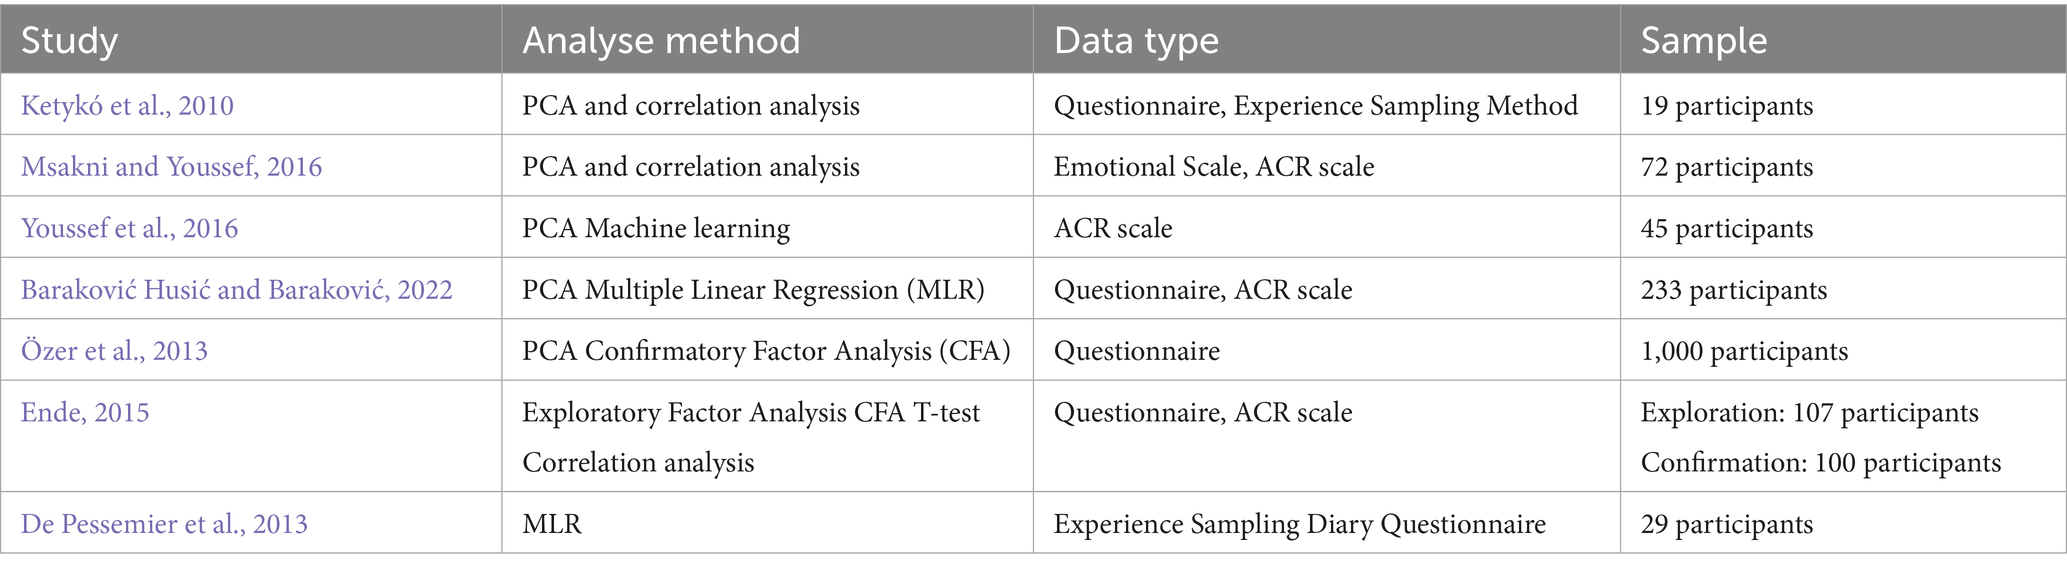
Table 1. Overview of bottom-up studies in video QoE.
Besides statistical solutions, typical for an exploratory study, this approach can also be used with qualitative research. Analysis of interviews and open questions in questionnaires are a rich source of information that must be condensed and structured by researchers (Staelens et al., 2010; Ickin et al., 2012). Similarly, bibliometric studies provide valuable insights into a vast amount of previous results and conclusions (Alreshoodi and Woods, 2013; Maia et al., 2015; Juluri et al., 2016; Zhao et al., 2016; Skorin-Kapov et al., 2018; Vega et al., 2018). Moreover, mixed methods, such as open profiling of quality (OPQ) (Strohmeier et al., 2011), can provide quantitative results based on qualitative data. In other cases, mixed-method approaches have been used to deepen the understanding of quantitative data by means of a qualitative follow-up [see, (e.g., De Moor et al., 2019; Øie et al., 2021)]. All the abovementioned methods share a similar goal. Their aim is to better understand the collected data. This type of insight is especially useful in the study of complex phenomena such as QoE.
Nevertheless, this approach has some limitations. Bottom-up methods rarely provide information about the causal relationship between variables such as IFs or PDs of QoE. In effect, it is easy to misjudge the importance of some variables. Moreover, it is possible that there are confounding variables that can influence both the predictor and the predicted value. Another source of interpretation error could be the character of the analyzed data. All measurements are contaminated with some unknown measure error. In the case of self-descriptive data, scientists need to be especially cautious. There are numerous effects that can influence participants’ responses. Alternatively, the reduction of variables in the model can be achieved with a simplified experimental design. Controlled laboratory experiments aim for this type of reduction (ITU-R, 2020). In this approach, researchers focus mostly on the manipulation of technical factors to better predict their influence on perceived video quality. This methodology was proven to be useful for building quality metrics such as VMAF (Li et al., 2016) and for the assessment of new compression algorithms. Nevertheless, the ecological validity of the prediction of VMAF remains undetermined. The discussed experiments are far from the everyday experience of users, and metrics built with this approach can miscalculate user satisfaction.
To sum up, bottom-up modeling is dominant in QoE research. There are numerous theoretical models that try to gather all potential influencing factors and perceptual dimensions of (Geerts et al., 2010; Brunnström et al., 2013; Egger et al., 2014; Möller et al., 2014; Raake and Egger, 2014; Reiter et al., 2014; Reichl et al., 2015; Robitza et al., 2016; Schmitt et al., 2018; Baraković Husić and Baraković, 2022). They highlight the complexity of human perception and provide a taxonomy for IFs and PDs. These models have inspired a number of studies investigating the most important predictors of QoE; in particular, system level and technical IFs have received a lot of attention. Nevertheless, causal relations between IFs, PDs, and QoE are still not well investigated, despite pleas in the literature to address them [see, (e.g., Reiter et al., 2014)]. For that purpose, top-down approaches can be more useful.
2.2 Top-down approach
A top-down approach is a theory-driven approach that is used for model comparison. Thanks to this approach, it is possible to decide between alternative theoretical and statistical models. With this line of action, abstract concepts such as theories can be verified with observational or experimental data. In effect, models can be developed by adding new insights from experiments. Most importantly, this approach allows for the verification of conclusions provided by data-driven models. Additionally, with this approach, it is possible to investigate causal relationships between variables and determine confounding variables.
Currently, statistical methods that can be used for the verification of theoretical models are being intensively developed. The approaches differ in technical details but share similar assumptions. All of the methods are based on graphs that represent the relationship between investigated variables, so-called path analysis. Consequently, with path analysis, it is not only possible to add new predictors but also to determine their causal relationships. They can verify models by measuring how well they fit the data gathered in the experiments. The most popular path analysis model is confirmatory factor analysis (CFA), which is a part of structural equation modeling and causal structural models.
The main shortcoming of this approach is the limited number of variables that can be investigated. The more units a graph includes, the more potential connections between them must be represented and thus analyzed. Moreover, it is harder to draw conclusions from statistics provided by model comparison. For example, a more informative model can have a worse statistical fit. Lastly, experiments that can provide adequate data are complex and must be run on large samples.
Nevertheless, to answer modern QoE problems, top-down modeling is necessary. The lack of ecological validity of standardized experiments requires the measurement of a large number of factors and more complicated manipulations. Understanding not only testers’ ratings but consumers’ behavior in general requires a better understanding of the relationship between variables in data sets. Moreover, without investigating causal relations between variables influencing consumer behavior, researchers are vulnerable to confounding factors.
However, to use the theory-driven approach in data modeling, a simplification of current QoE models is required. We therefore propose an additive approach to QoE modeling. In the next section, we present a graph model of video QoE comprising a minimal number of the necessary, most important variables. This model can be developed with further IFs and PDs, maintaining the core of the model intact. In other words, we present a general model that can be adjusted by researchers to investigate specific contexts. While we propose the model for video QoE, it is possible to adjust it for other use cases.
3 Video QoE model based on the path diagram
We based our model on the interpretation of the first part of the general definition of QoE: “Quality of Experience is the degree of delight or annoyance of the user of an application or service.” For this reason, we did not represent QoE as a separate unit in the Figure 2. Path model of video QoE.
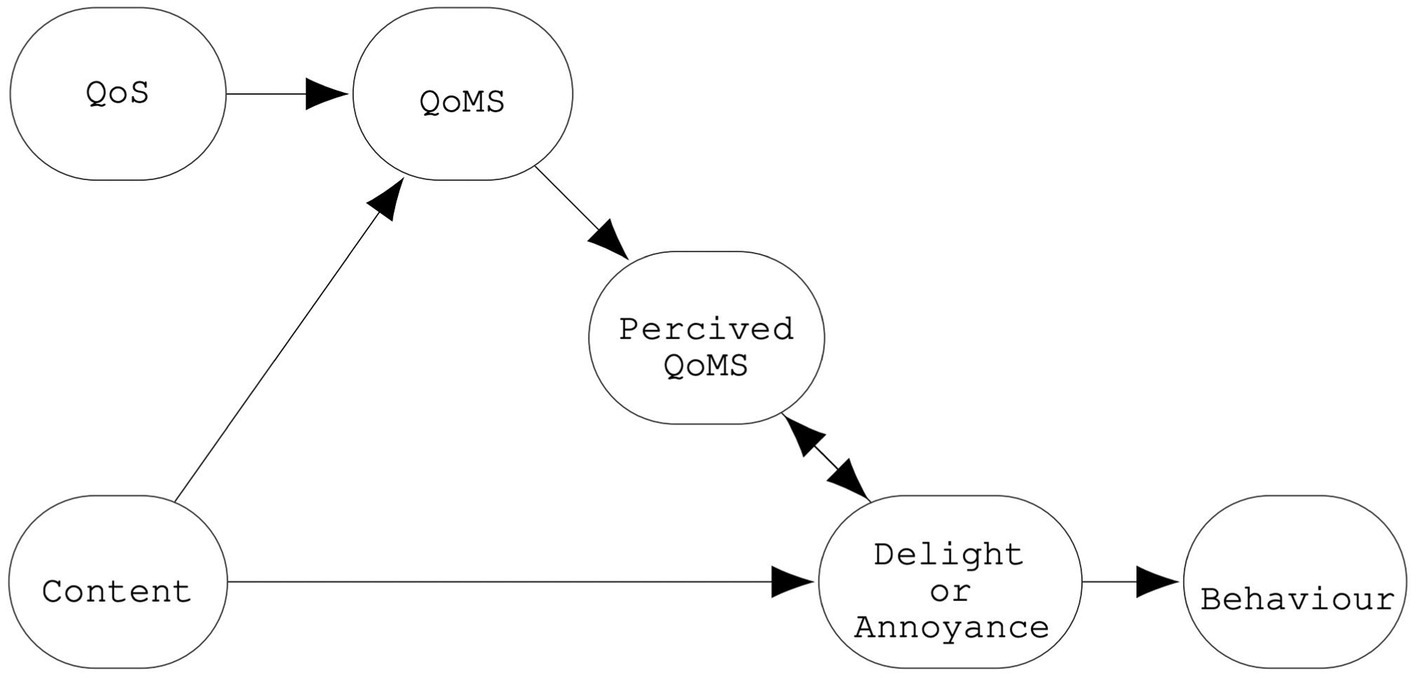
Figure 2. Path model of video QoE.
Instead, we included a “delight or annoyance” unit as an outcome of the interaction of variables typical for video service experience. In real life, it is hard to imagine a scenario in which the delight or annoyance of the user is not generated by the video content. Depending on internet efficacy, this content-dependent experience might be moderated by drops in video quality. With this reasoning, we built a path model of QoE.
Following previous QoE models, we distinguished IFs and PDs as predictors of general user satisfaction. IFs are defined as “any characteristic of a user, system, service, application, or context whose actual state or setting may have an influence on the Quality of Experience for the user” (Reiter et al., 2014). PDs refer to “perceivable, recognizable, and nameable characteristics of the individual’s experience of a service which contributes to its quality.” Moreover, we described these variables as latent variables and provided examples of their measurements. Below, we briefly present the operationalization of each variable in our model.
3.1 Components operationalization
3.1.1 QoS
Quality of Service (QoS) is a measure of the overall performance of a network. It is often used to describe the ability of a network to provide a consistent level of service to its users. ITU-T defines QoS as “The totality of characteristics of a telecommunications service that bear on its ability to satisfy stated and implied needs of the user of the service” (Recommendation, 2008). QoS can be expressed in terms of performance indicators such as throughput, latency, jitter, and packet loss. Special metrics for QoS assessment are constantly being developed. There are also models describing the influence of QoS on QoE (Fiedler et al., 2010; Chen et al., 2014; Kim and Choi, 2014). QoS is a well-known QoE IF.
Particularly, real-world scenarios emphasize the primacy of instantaneous throughput and latency for multimedia services, where fluctuating network conditions are common (Seufert et al., 2019). These factors should be prioritized in QoE theoretical models for their pronounced impact on the streaming experience.
3.1.2 Content
Content characteristics are multidimensional. Depending on the research question, different variables might be taken into account to analyze its influence. Due to its complex character, content can be identified as a system or a context IF. For example, characteristics such as motion, number of details, brightness, and computation complexity are well recognized in QoE studies (Khan et al., 2011; Song and Tjondronegoro, 2014; Duanmu et al., 2018). They are categorized as system factors influencing QoE. On the other hand, the content type chosen by the user can be classified as a context IF and can be used for predicting user satisfaction (Agboma and Liotta, 2012). Moreover, influential service providers such as YouTube have their own metrics for classifying and quantifying content. One of the crucial statistics for distinguishing videos in the service is “engagement,” operationalized as the mean percentage of watching time. It can be used for the operationalization of PDs of the content such as perceived engagement or interest in the video. Furthermore, self-description methods can be used for assessment of participant level of interest (Song et al., 2016) or motivation (Kobayashi et al., 2012). Moreover, there are standardized data sets of visual stimuli that can be used to evaluate the influence of emotions evoked by content (Marchewka et al., 2014; Baveye et al., 2015; Di Crosta et al., 2020).
3.1.3 Quality of multimedia signal
In our model, quality of multimedia signal represents the objective properties of visual stimuli. In the context of video streaming, it is video displayed on the user’s device. There are many methods for assessing the quality of video, some of which are objective and some subjective. Thus, we propose a division into the objective quality of media signal (QoMS) and its PD – the perceived QoMS described below. In this approach, QoMS is the IF that represents the quality of reproduction of the source signal (content). It has properties of the source content that are moderated by the efficacy of the network and user hardware. It can be assessed with objective metrics such as signal-to-noise ratio or VMAF (Li et al., 2016; Garcia et al., 2019, 2020). In current models, (Brunnström et al., 2013; Raake and Egger, 2014; Robitza et al., 2016), QoMS is described as the physical representation of the signal.
3.1.4 Perceived quality of multimedia signal
We use the term “perceived QoMS” (PQoMS) to emphasize the role of perception in video QoE studies where subjective assessments of quality made by users are in the spotlight. Typically, researchers estimate QoMS with a 5-point Absolute Category Rating (ACR) scale (ITUT, 2016). Additionally, there is a new effort to build matrices that take into account both QoMS and PQoMS to predict user satisfaction (Li et al., 2016). In proposed models (Brunnström et al., 2013; Raake and Egger, 2014), these descriptions are the outcome of the quality formation process.
3.1.5 Degree of delight or annoyance
We assume that the user’s state of delight or annoyance (DoA) is the outcome of both quality and content properties. According to the general definition, this is, in fact, the measure of QoE. It can be assessed, for example, with an adapted Differential Emotions Scale (De Moor et al., 2013). In the natural context, both technical (Nam et al., 2016) and content (Laiche et al., 2021a) related factors may lead to a change in the QoE. This might cause a shift in user behavior (Robitza et al., 2016).
3.1.6 Behavior
Depending on the scope of the study, behavior might be a short-term reaction to quality-related events (Robitza and Raake, 2016; Fogelberg, 2020; Laiche et al., 2021b), habit evaluation (Robitza et al., 2020), or even consumer attitude (Perkis et al., 2014; Reichl et al., 2015) predictors. Generally in the retail context, pleasure and arousal are good predictors of approach-avoidance behavior (Kenhove and Desrumaux, 1997). As long-term behavior toward network providers might be influenced by a set of additional important variables (e.g., pricing), we focus on short-term behavior. In our model, behavior is an outcome of DoA and can be observed as a change in interaction with service (e.g., change of the video).
3.2 Relations between variables and model assumptions
We described our generalized QoE model in the form of a diagram (see Figure 2). Path model of video QoE with causal paths between variables. Following the causal path analysis approach, arrows represent the assumption that variable A may be a direct cause of B. For example, in Figure 2. Path model of video QoE, DoA might be caused by perceived QoMS and content. Additionally, arrow representation does not imply that the process is simple. Relationships between A and B can be complex, multi-staged, and nonlinear, what we assume is the direction of the relationship. Moreover, by drawing an arrow from A to B, we do not assume that A is the only thing that causes B. In fact, this approach assumes that every variable can be influenced by unspecified factors not represented in a graph. This enables including measurement error and the influence of unknown factors in the model, as well as adding new variables in future updates of the model. However, if we know that units in the model have a common cause, this must be expressed in the graph.
On the other hand, the absence of an arrow represents a stronger assumption, namely, the lack of relationship between variables represented by nodes (Paulewicz et al., 2020). For example in Figure 2. Path model of video QoE, the amount of delight or irritation does not change the QoMS; as such, the direction of influence seems impossible.
In our model, we described the physical representation of the video signal (QoMS) as an outcome of the interaction between network efficacy (QoS) and Content. We assumed that from the user’s perspective, there is no relationship between QoS and Content other than QoMS. In other words, if network efficacy has some influence on video content, it can only be observed via the QoMS. In consequence, QoS cannot directly influence DoA or behavior. Users must see the change in QoMS to conclude there are network efficiency problems. Furthermore, the arrow from QoMS to Perceived QoMS represents human perception. In fact, this process could be described using quality formation models such as (Brunnström et al., 2013; Raake and Egger, 2014). Moreover, it could be influenced by cognitive factors such as visual sensitivity (Banitalebi-Dehkordi et al., 2019). In addition, we cannot assume that the perception of quality is not moderated by DoA. That is why the arrow between PQoMS and DoA is bidirectional.
Most importantly, we assume that in real-life scenarios, DoA is a function of both content and PQoMS. Users might react differently to the same QoMS depending on the type of content.
Finally, users’ behavior is the consequence of that DoA (Seufert et al., 2019; Hu et al., 2020). One can be dissatisfied both due to the content and the PQoMS. This can result in behavior directed to enhance network efficacy, change of content, compensation, or abandonment of activity.
The model presented in this paper is general. This means that we treat it as a framework that can be specified for particular use cases and experimental setups. As already mentioned, in such cases, the model can be extended with additional variables. This procedure requires the operationalization and inclusion of new units in the graph. For example, if we want to add participant interest, we can place it on the arrow from content to DoA. In that case, we assume that interest is caused by content but not by other variables. Moreover, content can only influence general satisfaction by the level of interest. If one’s hypothesis is that interest does not always influence the causal path between content and DoA, interest should be included with an additional path. Another hypothesis might be that the perceived QoMS is influenced by visual sensitivity. In such a scenario, we must add visual sensitivity as a new unit outside the graph and draw the line to perceived QoP. Other influential factors from the model (Reiter et al., 2014) could be added in a similar manner.
Based on this causal structure, we can propose an operational definition of QoE limited to video services. QoE is the amount of behaviorally relevant user DoA toward a video service evoked by content and moderated by the perceived quality of the video.
3.3 Application of the model
To effectively utilize the conceptual model in QoE experimental designs, researchers should integrate it by identifying and selecting relevant influential factors (IFs) and perceptual dimensions (PDs) specific to their domain of study. This model facilitates a structured approach to experiment planning, ensuring that chosen IFs are directly aligned with the research objectives and the nature of the user experience being examined. By applying this model, researchers can create more comparable and insightful studies, leading to a deeper understanding of QoE factors and their interactions. Potential advances and application of the model was presented in Koniuch et al. (2023).
This paper presents how to use the theoretical model as way to enhance the communication between researchers by clearly defining the assumptions and variables within QoE studies. The application of the theoretical model of video QoE described in the paper in the three different studies exemplifies how a consistent methodology can elevate the comparability of research outcomes, despite varying methodologies. This aligns with the goal of designing a series of comparable experiments, potentially key to increasing ecological validity while maintaining control over study variables.
Furthermore, this methodology advocates for the inclusion of a wider array of IFs and the use of Directed Acyclic Graphs (DAGs) in data analysis, fostering an additive measurement approach across a sequence of experiments. This can stimulate higher comparability between studies within QoE subdomains and encourage a community effort to adapt the theoretical model to emerging multimedia technologies and new research contexts.
4 Implications and future directions
As presented in the section above, our model can be used to operationalize new variables, build hypotheses, and investigate assumptions of experimental setups. As a novel tool, our model provides researchers with a structured approach for designing studies, allowing for a more rigorous and targeted exploration and confirmation of QoE factors. Moreover, due to its causal structure and clear operationalization of variables, our model can be verified with experimental data. Furthermore, our assumptions, represented by arrows, can be verified. Path analysis such as structural equation modeling or causal structural models can be used for validation of our assumptions. However, the number of units included in the model is limited. Future development of the model should comprise validation and inclusion of other factors known from bottom-up QoE research. In this way, more complex models could be built in an additive manner. A comparison of those models will require a new experimental design that will include a broader spectrum of variables. In effect, we hope that our model will help not only to distinguish which compression method is better but also provide answers to more complex questions such as, “How important is quality?” and “Why do people stop watching videos?” Is it, e.g., due to the lack of content attractiveness or because the video quality is insufficient? We are convinced that answers to those questions will help to provide more sustainable solutions for video streaming in the future. Although our model describes video QoE, it can also be adjusted to different multimedia in the future. Finally, we hope that our model will be a source of inspiration for new hypotheses and experimental studies in the QoE domain. Application of our model may provide structure for the discussion of QoE and lead to the creation of comparable, replicable paradigms. This new structure could possibly facilitate dialogue among specialists from different domains relative to QoE.
Author contributions
KK: Conceptualization, Writing – original draft, Writing – review & editing. SB: Conceptualization, Writing – review & editing. JH: Conceptualization, Writing – review & editing. SS: Conceptualization, Writing – review & editing. KM: Conceptualization, Writing – review & editing. LJ: Conceptualization, Writing – review & editing. MW: Conceptualization, Writing – review & editing.
Funding
The author(s) declare that financial support was received for the research, authorship, and/or publication of this article. The research leading to these results has received funding from the Norwegian Financial Mechanism 2014–2021 under project 2019/34/H/ST6/00599.
Conflict of interest
The authors declare that the research was conducted in the absence of any commercial or financial relationships that could be construed as a potential conflict of interest.
Publisher’s note
All claims expressed in this article are solely those of the authors and do not necessarily represent those of their affiliated organizations, or those of the publisher, the editors and the reviewers. Any product that may be evaluated in this article, or claim that may be made by its manufacturer, is not guaranteed or endorsed by the publisher.
References
Agboma, F., and Liotta, A. (2012). Quality of experience management in mobile content delivery systems. Telecommun. Syst. 49, 85–98. doi: 10.1007/s11235-010-9355-6
Alreshoodi, M., and Woods, J. (2013). Survey on QoE\QoS correlation models for multimedia services. arXiv preprint arXiv:1306.0221
Banitalebi-Dehkordi, M., Ebrahimi-Moghadam, A., Khademi, M., and Hadizadeh, H. (2019). No-reference video quality assessment based on visual memory modeling. IEEE Trans. Broadcast. 66, 676–689. doi: 10.1109/TBC.2019.2957670
Baraković Husić, J., and Baraković, S. (2022). Multidimensional modelling of quality of experience for video streaming. Comput. Hum. Behav. 129:107155. doi: 10.1016/j.chb.2021.107155
Baraković Husić, J., Baraković, S., Cero, E., Slamnik, N., Oćuz, M., Dedović, A., et al. (2020). Quality of experience for unified communications: an overview. Int. J. Netw. Manag. 30:2083. doi: 10.1002/nem.2083
Barakovic Husic, J., Barakovic, S., Krejcar, O., and Maresova, P. (2021). Modeling of quality of experience for web-based unified communications with perceptual dimensions. SIViP 15, 977–985. doi: 10.1007/s11760-020-01822-0
Baraković, S., and Skorin-Kapov, L. (2015). Multidimensional modelling of quality of experience for Mobile web browsing. Comput. Hum. Behav. 50, 314–332. doi: 10.1016/j.chb.2015.03.071
Baraković, S., and Skorin-Kapov, L. (2017a). Modelling the relationship between design/performance factors and perceptual features contributing to quality of experience for mobile web browsing. Comput. Hum. Behav. 74, 311–329. doi: 10.1016/j.chb.2017.04.046
Baraković, S., and Skorin-Kapov, L. (2017b). Survey of research on quality of experience modelling for web browsing. Quality and User Experience 2, 1–31. doi: 10.1007/s41233-017-0009-2
Batmunkh, A. (2022). Carbon footprint of the Most popular social media platforms. Sustain. For. 14:2195. doi: 10.3390/su14042195
Baveye, Y., Dellandrea, E., Chamaret, C., and Chen, L. (2015). LIRIS-ACCEDE: a video database for affective content analysis. IEEE Trans. Affect. Comput. 6, 43–55. doi: 10.1109/TAFFC.2015.2396531
Brunnström, K., Beker, S. A., De Moor, K., Dooms, A., Egger, S., Garcia, M.-N., et al., (2013). Qualinet white paper on definitions of quality of experience
Chandaria, J., Hunter, J., and Williams, A. (2011). The carbon footprint of watching television, comparing digital terrestrial television with video-on-demand. Proceedings of the 2011 IEEE international symposium on sustainable systems and technology, 1–6
Chen, Y., Wu, K., and Zhang, Q. (2014). From QoS to QoE: a tutorial on video quality assessment. IEEE Commun Surv Tutor 17, 1126–1165. doi: 10.1109/COMST.2014.2363139
Connor, C. E., Egeth, H. E., and Yantis, S. (2004). Visual attention: bottom-up versus top-down. Curr. Biol. 14, R850–R852. doi: 10.1016/j.cub.2004.09.041
De Moor, K. (2012). Are engineers from mars and users from venus?: Bridging gaps in quality of experience research: Reflections on and experiences from an interdisciplinary journey. Ph.D. dissertation, Ghent, Belgium: Ghent University.
De Moor, K., Borge, H. K., and Heegaard, P. (2019). Young children and the use of video chat: implications for QoE research. 2019 Eleventh international conference on quality of multimedia experience (QoMEX), 1–3
De Moor, K., Quintero, M. R., Strohmeier, D., and Raake, A. (2013). Evaluating QoE by means of traditional and alternative subjective measures: An exploratory’ living room lab’ study on IPTV. Vienna, Austria: 4th International Workshop on Perceptual Quality of Systems (PQS 2013).
De Pessemier, T., Martens, L., and Joseph, W. (2013). Modeling subjective quality evaluations for mobile video watching in a living lab context. 2013 IEEE international symposium on broadband multimedia systems and broadcasting (BMSB), 1–5
Di Crosta, A., La Malva, P., Manna, C., Marin, A., Palumbo, R., Verrocchio, M. C., et al. (2020). The Chieti affective action videos database, a resource for the study of emotions in psychology. Scientific Data 7, 1–6. doi: 10.1038/s41597-020-0366-1
Duanmu, Z., Ma, K., and Wang, Z. (2018). Quality-of-experience for adaptive streaming videos: an expectation confirmation theory motivated approach. IEEE Trans. Image Process. 27, 6135–6146. doi: 10.1109/TIP.2018.2855403
Egger, S., Reichl, P., and Schoenenberg, K. (2014). Quality of experience and interactivity. Quality of experience, 149–161. Springer
Ejembi, O., and Bhatti, S. N. (2015). The energy cost of your Netflix habit. Proceedings of the 2015 ACM sixth international conference on future energy systems, 225–226
Ende, N. V. (2015). Experiencing audio/video quality: An investigation into the relationship between perceived video quality and involvement, Phd Thesis (Research TU/e/Graduation TU/e), Industrial Engineering and Innovation Sciences. Technische Universiteit Eindhoven. Eindhoven, Netherlands: Uitgeverij BOXPress.
Fiedler, M., Hossfeld, T., and Tran-Gia, P. (2010). A generic quantitative relationship between quality of experience and quality of service. IEEE Netw. 24, 36–41. doi: 10.1109/MNET.2010.5430142
Fogelberg, E. (2020). We move in order to perceive: A mouse-tracking study of user behaviour during stalling branched videos with a playback Bar. We move in order to perceive: A mouse-tracking study of user behaviour during stalling branched videos with a playback Bar.
Gabaix, X., and Laibson, D. (2008). The seven properties of good models: The foundations of positive and normative economics: A handbook, 292–319.
Garcia, B., Gortázar, F., Gallego, M., and Hines, A. (2020). Assessment of qoe for video and audio in webrtc applications using full-reference models. Electronics 9:462. doi: 10.3390/electronics9030462
Garcia, B., López-Fernández, L., Gortázar, F., and Gallego, M. (2019). Practical evaluation of VMAF perceptual video quality for WebRTC applications. Electronics 8:854. doi: 10.3390/electronics8080854
Geerts, David, De Moor, Katrien, Ketyko, Istvan, Jacobs, An, Van den Bergh, Jan, Joseph, Wout, et al., (2010). Linking an integrated framework with appropriate methods for measuring QoE. 2010 second international workshop on quality of multimedia experience (QoMEX), 158–163
Headey, B., Veenhoven, R., and Weari, A. (2005). Top-down versus bottom-up theories of subjective well-being. Citation classics from social indicators research (pp. 401–420). Springer
Hu, M., Chen, J., Wu, D., Zhou, Y., Wang, Y., and Dai, H.-N. (2020). TVG-streaming: learning user behaviors for QoE-optimized 360-degree video streaming. IEEE Trans. Circuits Syst. Video Technol. 31, 4107–4120. doi: 10.1109/TCSVT.2020.3046242
Ickin, S., Wac, K., Fiedler, M., Janowski, L., Hong, J.-H., and Dey, A. K. (2012). Factors influencing quality of experience of commonly used mobile applications. IEEE Commun. Mag. 50, 48–56. doi: 10.1109/MCOM.2012.6178833
ITU-R. (2020). 500–14 (10/2019): Methodologies for the subjective assessment of the quality of television images. ITU: Geneva, Switzerland
Jekosch, U. (2005). Assigning meaning to sounds—semiotics in the context of product-sound design. Communication acoustics, 193–221. Springer
Juluri, P., Tamarapalli, V., and Medhi, D. (2016). Measurement of quality of experience of video-on-demand services: a survey. IEEE Commun Surv Tutor 18, 401–418. doi: 10.1109/COMST.2015.2401424
Kenhove, P. V., and Desrumaux, P. (1997). The relationship between emotional states and approach or avoidance responses in a retail environment. Int. Rev. Retail Distrib. Consum. Res. 7, 351–368. doi: 10.1080/095939697342932
Ketykó, I., De Moor, K., Joseph, W., Martens, L., and De Marez, L. (2010). Performing QoE-measurements in an actual 3G network. 2010 IEEE international symposium on broadband multimedia systems and broadcasting (BMSB), 1–6
Khan, A., Sun, L., and Ifeachor, E. (2011). QoE prediction model and its application in video quality adaptation over UMTS networks. IEEE Trans. Multimed. 14, 431–442. doi: 10.1109/TMM.2011.2176324
Kim, H. J., and Choi, S. G. (2014). QoE assessment model for multimedia streaming services using QoS parameters. Multimed. Tools Appl. 72, 2163–2175. doi: 10.1007/s11042-013-1507-8
Kobayashi, F., Masuda, M., and Hayashi, T. (2012). Qoe assessment method for mobile video services based on user motivation. Image Qual Syst Performance 8293, 301–309.
Koniuch, K., Janowski, L., De Moor, K., Wierzchoń, M., and Subramanian, S. (2023). “The Role of Theoretical Models in Ecologically Valid Studies: the example of a video Quality of Experience model,” 2023 15th International Conference on Quality of Multimedia Experience (QoMEX), Ghent, Belgium, 67–72.
Laghari, A. A., He, H., Memon, K. A., Laghari, R. A., Halepoto, I. A., and Khan, A. (2019). Quality of experience (QoE) in cloud gaming models: a review. Multiagent Grid Systems 15, 289–304. doi: 10.3233/MGS-190313
Laiche, F., Ben Letaifa, A., and Aguili, T. (2021a). QoE-aware traffic monitoring based on user behavior in video streaming services. Concurrency and Computation Practice and Experience, Hoboken, New Jersey, USA: Wiley. e6678.
Laiche, F., Ben Letaifa, A., Elloumi, I., and Aguili, T. (2021b). When machine learning algorithms meet user engagement parameters to predict video QoE. Wirel. Pers. Commun. 116, 2723–2741. doi: 10.1007/s11277-020-07818-w
Lee, D., Lee, J., and Song, M. (2019). Video quality adaptation for limiting transcoding energy consumption in video servers. IEEE Access 7, 126253–126264. doi: 10.1109/ACCESS.2019.2939007
Li, Z., Aaron, A., Katsavounidis, I., Moorthy, A., and Manohara, M. (2016). Toward a practical perceptual video quality metric. The Netflix Tech Blog 6. Retrieved from: https://netflixtechblog.com/toward-a-practical-perceptual-video-quality-metric-653f208b9652
Maia, O. B., Yehia, H. C., and de Errico, L. (2015). A concise review of the quality of experience assessment for video streaming. Comput. Commun. 57, 1–12. doi: 10.1016/j.comcom.2014.11.005
Marchewka, A., Żurawski, Ł., Jednoróg, K., and Grabowska, A. (2014). The Nencki affective picture system (NAPS): introduction to a novel, standardized, wide-range, high-quality, realistic picture database. Behav. Res. Methods 46, 596–610. doi: 10.3758/s13428-013-0379-1
McElreath, R. (2020). The many Variables & the Spurious Waffles. Statistical rethinking (pp. 123–160). Chapman and Hall/CRC
Möller, S., and Raake, A. (2014). “Features of quality of experience” in Quality of experience: Advanced concepts, applications and methods. eds. I. A. Raake and S. Egger (Springer), 73–84.
Möller, S., Wältermann, M., and Garcia, M.-N. (2014). Features of quality of experience. S. Möller and A. Raake (Eds.), Quality of experience: Advanced concepts, applications and methods (pp. 73–84). Cham: Springer International Publishing
Msakni, H. G., and Youssef, H. (2016). Impact of user emotion and video content on video quality of experience. Proc. 5th ISCA/DEGA workshop on perceptual quality of systems (PQS 2016), (pp. 97–101)
Nam, H., Kim, K.-H., and Schulzrinne, H. (2016). QoE matters more than QoS: why people stop watching cat videos. IEEE INFOCOM 2016-the 35th annual IEEE international conference on computer communications, (pp. 1–9)
Øie, E. B., Koniuch, K., Cieplińska, N., and De Moor, K. (2021). Factors influencing QoE of video consultations. 2021 13th international conference on quality of multimedia experience (QoMEX), (pp. 137–140)
Özer, A., Argan, M. T., and Argan, M. (2013). The effect of mobile service quality dimensions on customer satisfaction. Procedia Soc. Behav. Sci. 99, 428–438. doi: 10.1016/j.sbspro.2013.10.511
Paulewicz, B., Siedlecka, M., and Koculak, M. (2020). Confounding in studies on metacognition: a preliminary causal analysis framework. Front. Psychol. 11:1933. doi: 10.3389/fpsyg.2020.01933
Perkis, A., Reichl, P., and Beker, S. (2014). Business perspectives on quality of experience. Quality of experience (pp. 97–108). Springer
Raake, A., and Egger, S. (2014). “Quality and quality of experience” in Quality of experience: Advanced concepts, applications and methods. eds. S. Möller and A. Raake (Cham: Springer International Publishing), 11–33.
Ragano, A., Benetos, E., and Hines, A. (2019). Adapting the quality of experience framework for audio archive evaluation. 2019 eleventh international conference on quality of multimedia experience (QoMEX), (pp. 1–3)
Recommendation, I. T. (2008). E. 800, definitions of terms related to quality of service. International telecommunication Union’s telecommunication standardization sector (ITU-T) Std
Reichl, P., Egger, S., Möller, S., Kilkki, K., Fiedler, M., Hoßfeld, T., et al., (2015). Towards a comprehensive framework for QoE and user behavior modelling. 2015 seventh international workshop on quality of multimedia experience (QoMEX), (pp. 1–6)
Reiter, U., Brunnström, K., De Moor, K., Larabi, M.-C., Pereira, M., Pinheiro, A., et al., (2014). Factors influencing quality of experience. Quality of experience (pp. 55–72). Springer
Robitza, W., Dethof, A. M., Göring, S., Raake, A., Beyer, A., and Polzehl, T. (2020). Are you still watching? Streaming video quality and engagement assessment in the crowd. 2020 twelfth international conference on quality of multimedia experience (QoMEX), (pp. 1–6)
Robitza, W., and Raake, A. (2016). (re-) actions speak louder than words? A novel test method for tracking user behavior in web video services. 2016 eighth international conference on quality of multimedia experience (QoMEX), (pp. 1–6)
Robitza, W., Schönfellner, S., and Raake, A. (2016). A theoretical approach to the formation of quality of experience and user behavior in multimedia services. 5th ISCA/DEGA workshop on perceptual quality of systems, 39–43
Schmitt, M., Bulterman, D. C., and Cesar, P. S. (2018). The contrast effect: QoE of mixed video-qualities at the same time. Quality and User Experience 3, 1–17. doi: 10.1007/s41233-018-0020-2
Seufert, M., Wassermann, S., and Casas, P. (2019). Considering user behavior in the quality of experience cycle: towards proactive QoE-aware traffic management. IEEE Commun. Lett. 23, 1145–1148. doi: 10.1109/LCOMM.2019.2914038
Simon, H. A. (2001). “Science seeks parsimony, not simplicity: Searching for pattern in phenomena,” in Simplicity, inference and modelling: Keeping it sophisticatedly simple (Chapter 3). Eds. A. Zellner, H. A. Keuzenkamp, and M. McAleer. Cambridge, UK: Cambridge University Press, 32–72.
Skorin-Kapov, L., Varela, M., Hoßfeld, T., and Chen, K.-T. (2018). A survey of emerging concepts and challenges for QoE management of multimedia services. ACM Trans. Multimed. Comput. Commun. Appl. (TOMM) 14, 1–29. doi: 10.1145/3176648
Song, W., and Tjondronegoro, D. W. (2014). Acceptability-based QoE models for mobile video. IEEE Trans. Multimed. 16, 738–750. doi: 10.1109/TMM.2014.2298217
Song, J., Yang, F., Zhou, Y., Wan, S., and Wu, H. R. (2016). QoE evaluation of multimedia services based on audiovisual quality and user interest. IEEE Trans. Multimed. 18, 444–457. doi: 10.1109/TMM.2016.2520090
Staelens, N., Moens, S., Van den Broeck, W., Marien, I., Vermeulen, B., Lambert, P., et al. (2010), Assessing quality of experience of IPTV and video on demand services in real-life environments. IEEE transactions on broadcasting, 56, 458–466. doi: 10.1109/TBC.2010.2067710
Strohmeier, D., Jumisko-Pyykkö, S., Kunze, K., and Bici, M. O. (2011). The extended-OPQ method for user-centered quality of experience evaluation: a study for mobile 3D video broadcasting over DVB-H. Eurasip J. Image Video Process. 2011, 1–24. doi: 10.1155/2011/538294
Vega, M. T., Perra, C., De Turck, F., and Liotta, A. (2018). A review of predictive quality of experience management in video streaming services. IEEE Trans. Broadcast. 64, 432–445. doi: 10.1109/TBC.2018.2822869
VQEG. (2022). Video quality experts group (VQEG) SAM group. Retrieved from VQEG: https://www.vqeg.org/projects/statistical-analysis-methods-sam
Youssef, Y. B., Mellouk, A., Afif, M., and Tabbane, S. (2016). Video quality assessment based on statistical selection approach for QoE factors dependency. 2016 IEEE global communications conference (GLOBECOM), 1–6
Zhao, T., Liu, Q., and Chen, C. W. (2016). QoE in video transmission: a user experience-driven strategy. IEEE Commun Surv Tutor 19, 285–302. doi: 10.1109/COMST.2016.2619982
Keywords: quality of experience, user perception, subjective quality, video, multimedia quality, theoretical model
Citation: Koniuch K, Baraković S, Husić JB, Subramanian S, De Moor K, Janowski L and Wierzchoń M (2024) Top-down and bottom-up approaches to video quality of experience studies; overview and proposal of a new model. Front. Comput. Sci. 6:1305670. doi: 10.3389/fcomp.2024.1305670
Edited by:
Andrej Košir, University of Ljubljana, SloveniaReviewed by:
Maria Torres Vega, Ghent University, BelgiumAlexander Toet, Netherlands Organisation for Applied Scientific Research, Netherlands
Copyright © 2024 Koniuch, Baraković, Husić, Subramanian, De Moor, Janowski and Wierzchoń. This is an open-access article distributed under the terms of the Creative Commons Attribution License (CC BY). The use, distribution or reproduction in other forums is permitted, provided the original author(s) and the copyright owner(s) are credited and that the original publication in this journal is cited, in accordance with accepted academic practice. No use, distribution or reproduction is permitted which does not comply with these terms.
*Correspondence: Kamil Koniuch, koniuch@agh.edu.pl; Katrien De Moor, katrien.demoor@ntnu.no