HRVEST: a novel data solution for using wearable smart technology to measure physiologic stress variables during a randomized clinical trial
 Jeffrey N. Gerwin1,2*
  Gustavo de Oliveira Almeida3,4
  Michael W. Boyce2*
  Melissa Joseph2 Ambrose H. Wong1,2
  Winslow Burleson5
  Leigh V. Evans1,2*
- 1Department of Emergency Medicine, Yale School of Medicine, Yale University, New Haven, CT, United States
- 2Yale Center for Healthcare Simulation, Yale School of Medicine, Yale University, New Haven, CT, United States
- 3Healthcare Technology Innovation Lab (SensorLab), University of Arizona, Tucson, AZ, United States
- 4Data Science Institute, University of Arizona, Tucson, AZ, United States
- 5School of Information, University of Arizona, Tucson, AZ, United States
The purpose of this study was to address the logistical and data challenges of using wearable technologies in the context of a clinical trial to measure heart rate variability (HRV) as a marker of physiologic stress in emergency healthcare providers during the COVID-19 pandemic. When using these wearable smart garments, the dilemma is two-fold: (1) the volume of raw physiological data produced is enormous and is recorded in formats not easily portable in standard analytic software, and (2) the commensurate data analysis often requires proprietary software. Our team iteratively developed a novel algorithm called HRVEST that can successfully process enormous volumes of physiologic raw data generated by wearable smart garments and meet the specific needs of HRV analyses. HRVEST is a noise-filtering and data-processing algorithm that allows the precise measurements of heart rate variability (HRV) of clinicians working in an Emergency Department (ED). HRVEST automatically processed the biometric data derived from 413 electrocardiogram (ECG) recordings in just over 15 min. Furthermore, throughout this study, we identified unique challenges of working with these technologies and proposed solutions that may facilitate future use in broader contexts. With HRVEST, using wearable smart garments to monitor HRV over long periods of time becomes logistically and feasibly viable for future studies. We also see the potential for real-time feedback to prophylactically reduce emergency physician stress, like informing optimal break-taking or short meditation sessions to lower heart rate. This could improve emotional wellbeing and, subsequently, clinical decision-making and patient outcomes.
1 Introduction
Burnout among emergency medicine physicians has been a significant concern even prior to the COVID-19 pandemic (Shanafelt et al., 2015; Panagioti et al., 2017). The demanding and high-stress nature of their work, along with long hours, sleep deprivation, and exposure to traumatic events, can contribute to burnout. However, the COVID-19 pandemic added new challenges and intensified the existing ones, leading to increased burnout due to increased workload, high-stress environments, and personal challenges (Nguyen et al., 2021). They have been on the frontlines, working tirelessly to treat and manage COVID-19 patients, often facing difficult decisions and emotional stress. Recognizing and addressing burnout is crucial to ensure the wellbeing of healthcare providers and maintain high-quality patient care.
With the recognition of the impact of mental wellbeing on healthcare providers, research has increasingly focused on methods to measure stress in both the simulated and clinical environment. Our recent work outlining the impact of COVID-19 on Emergency Department (ED) clinicians highlights the importance of supporting clinicians along a range of psychological needs, including basic safety through proper use of personal protective equipment, social supports fostering teamwork, and preparedness for clinical challenges, including difficult conversations regarding patient care (Wong et al., 2020). If these needs are unmet, healthcare workers are at an increased risk of infection, anxiety, and burnout (Lai et al., 2020; Wong et al., 2020). The syndrome of burnout in physicians increases the risk of patient safety incidents, extends patient waiting times, threatens healthcare workers leaving the profession, and reduces patient safety (De Stefano et al., 2017; Tawfik et al., 2019). Evidence suggests links between physiologic measures of acute stress, particularly HRV, and the emotional exhaustion subscale of burnout (Kanthak et al., 2017).
Heart rate variability (HRV), defined as the beat-to-beat changes in heart rate, reflects the autonomic nervous system (ANS). HRV is a physiological marker of stress, and stress is a known component to provider burnout (Shaffer and Ginsberg, 2017; Wong et al., 2020). In the absence of physiologic stress, the parasympathetic nervous system (PNS) primarily influences the pacemaker cells of the heart. The PNS and the sympathetic nervous system (SNS) compete to determine the beat-to-beat variability of the heart to balance the heart's hemodynamic status. As the SNS causes the heart rate to increase in response to stress, the beat-to-beat interval is reduced, so HRV decreases. Multiple variables contribute to measuring HRV and can be broken into three domains: time domain, frequency domain, and geometric domain. The time domain measures HRV over time intervals between normal cardiac cycles. The frequency domain quantifies the contribution of both the PNS and SNS. The geometric domain is a non-linear measurement that quantifies the unpredictability and complexity of a series of changes in the time intervals between consecutive heartbeats, called inter-beat intervals (Shaffer and Ginsberg, 2017).
During the COVID-19 pandemic, our team developed and implemented a simulation-based educational intervention designed to support preparedness for the clinical stressors physicians encountered while caring for patients. In a clinical trial entitled COVID-19 Responsive Intervention: Systems Improvement Simulations (CRI:SIS), we aimed to test the effect of our educational simulation intervention on mitigating physician stress during their subsequent clinical shifts (Evans et al., 2022). We utilized HRV as the outcome variable for stress measurement, collected via smart garments that continuously recorded physiologic data, worn by participants during work hours. The size of our overall dataset (encompassing nearly 3000 h of ECG data) led to the need for specialized analysis solutions that could be applied to the clinical assessment of stress and burnout in the ED.
Smart garments are equipped with wearable sensors that provide precise and continuous cardiac, respiratory, and activity monitoring that can be used to analyze HRV. These smart garments can provide valuable real-time data on changes in heart rate patterns, which can be used in the clinical setting in several ways: smart garments can measure HRV and provide insights into the wearer's physiologic stress levels, and subsequently, their overall mental wellbeing. This information can potentially be useful in managing conditions such as anxiety, burnout, depression, or Post-traumatic stress disorder (PTSD), as healthcare providers can track changes over time and tailor treatment plans accordingly.
This research highlights the sensor and environment-based challenges of working with these technologies in situ, and provides both recommendations and implementable solutions to the challenges of obtaining and analyzing biometric data. The fundamental barrier to using wearables for a prolonged period of time is the commensurate data analysis required to consolidate and extract the metadata. Subsequently, while current data analysis approaches allow the analysis on a single recording, they are limited in performing an integrated and custom analysis on a large set of files for several individuals collected at different time intervals. Therefore, we describe the development of a novel approach to batch analyze the physiologic data and automate the detection and removal of noise and artifacts derived from recordings produced by these wearables.
During initial development, we considered several tools to process electrocardiogram (ECG) signals captured from continuous recording, perform pre- and post-processing operations that generate HRV-related metrics: Time-domain, Frequency-domain, and Non-linear plots. Tools analyzed included independent software such as: HRV analysis (Pichot et al., 2016), Kubios (Tarvainen et al., 2014), Kardia (Perakakis et al., 2010), ARTiiFACT (Kaufmann et al., 2011), RHRV (Rodriguez-Linares et al., 2011; García Martínez et al., 2017), and the Cardiovascular Signal Toolbox developed by the PhysioNet Project (Goldberger et al., 2000; Vest et al., 2018). From the existing prefabricated options, we identified two broadly defined tool categories for processing HRV data: (1) tools with graphical user interfaces (GUI), and (2) importable libraries that can be integrated into code. GUIs, although generally more user friendly, did not have the requisite features needed for processing complex multimodal data. In particular, none of these were able to complete the processes we identified as essential to analyzing complex data collected during our clinical trial: batch processing, customizable windows, signal quality, and integrated multimodal sensor data.
These factors led to the creation of a customized solution, combining several software libraries capable of generating the analyses needed into a cohesive open-source solution. Our algorithmic solution, called Heart Rate Variability Experimental Sensor Toolkit (HRVEST), allows for multi-file and cross-file data sourcing that streamlines the pre-processing, processing, and post-processing stages of physiological data and is adaptable to meet the specific needs of HRV analyses. Our algorithmic method allows for repeated measures analysis of participant heart rates with beat-by-beat processing across multiple clinical shifts. The automation, scalability, and open-source nature of HRVEST will help facilitate future use of these smart garments in both research and clinical settings.
2 Materials and equipment
2.1 Smart garment monitoring
Hexoskin Smart Shirts (Carré Technologies Inc.) have physiologic sensors embedded within the textiles (Figure 1), and these portable sensors allow for continuous cardiorespiratory and activity monitoring via a1-lead electrocardiograph, two respiratory inductive plethysmography (RIP) sensors, and a 3-axis accelerometer. These sensors provide real-time reporting on QRS events, RR Intervals (RRi), Heart Rate (HR), HRV, accelerometry, step count, and cadence. As a portable and non-invasive technology, these smart garments allowed for the unobtrusive capture of physiological measures of the participant during normal and strenuous activities. Participants' heart rates were captured via ECG, and data from these tracings were used to calculate HRV and related metrics.
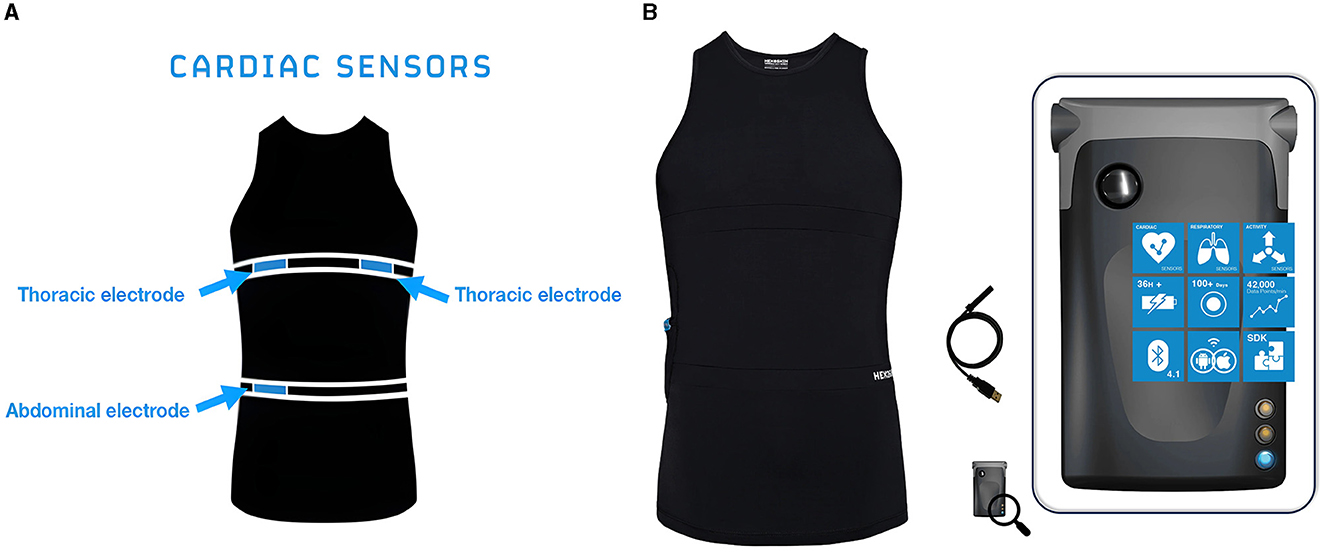
Figure 1. (A) Sensors. Location of cardiac and respiratory sensors on the Hexoskin Smart Shirt. (B) Hexoskin Smart Device connects to the Hexoskin Smart Shirts via Bluetooth to record and store physiologic measurements and can be used to visualize data in real time.
Smart garments often have different designs and fit for men and women, one of which may include a built-in bra in the women's shirt. For a precise fit, the embedded textile ECG, respiratory sensors, and activity sensors must be aligned with the thorax and naval and be in direct contact with the participant's skin. A water-soluble lubricant (ultrasound gel) was applied to the sensors to enhance conductivity. During data collection, the smart garments were worn underneath the participants' standard scrub shirts for the duration of their ED shifts.
The Hexoskin Smart Device (Figure 1) is the advanced onboard system that, when coupled with the Hexoskin Smart Shirt, monitors and records the biometric data collected from the shirt. The smart device can transmit data to in-range mobile devices via Bluetooth and can share live heart rate data, including a visualization of the ECG in real-time.
2.2 Software
Software packages were leveraged to support the development of the HRVEST. Python was used as the programming language of choice, as it provided useful packages such as PyHRV (Version 0.4.1) and HRV-Pythonic package for Heart Rate Variability Analysis (Version 0.2.10). PyHRV is an Open-Source Toolkit that supports the computation of the primary types of HRV data: Time Domain, Frequency Domain, and Non-linear (Gomes, 2018), while HRV is a package tailored to manipulate, preprocess, visualize, and analyze HRV-related data (Bartels, 2021). The HRV package was primarily employed in data preprocessing and filtering, while the PyHRV was employed to compute time and frequency domain statistics and non-linear metrics. We also employed the Python software module load_hx_data.py to convert Hexoskin's binary data output from the sensors into a readable Comma-Separated Values (CSV) format. It should be noted, our data processing required separate scripts for binary and wav formats; these are now available as a package (Hexoskin Support Community, 2023).
2.3 Hardware
The data was analyzed on an off-the-shelf computer dedicated to data analyses with the following specifications: 13th Gen Intel® Core™ i9–13900HX, 64 GB RAM, 1 TB SSD. Analyses ran successfully on computers using the MacOS and Microsoft Windows 10 operating systems.
3 Methods
3.1 Trial design and objectives
This was a prospective randomized clinical trial conducted across two clinical sites at a large hospital system to assess the efficacy of a simulation intervention on physician stress and anxiety during the COVID-19 pandemic. The primary outcome was changes in HRV as a physiologic measure of stress during the clinical care of COVID-19 patients during ED shifts pre- and post-simulation intervention. Smart garments were used to monitor and record real-time heart rate and activity measurements.
The data collection period was from January to December 2021. Each recruited participant underwent a baseline session and four data collection sessions. All participants were randomized after the second data collection. Those assigned to the intervention group received virtual simulation training (CRI:SIS). The trial intervention included an adaptive series of immersive scenarios delivered as just-in-time simulations to prepare emergency physicians working post-intervention clinical shifts (Evans et al., 2022). We hypothesized that this intervention would lower participant anxiety and stress levels when caring for acutely ill COVID-19 patients on subsequent shifts as measured by changes in resting HRV. An outline of our clinical trial can be seen in Figure 2.
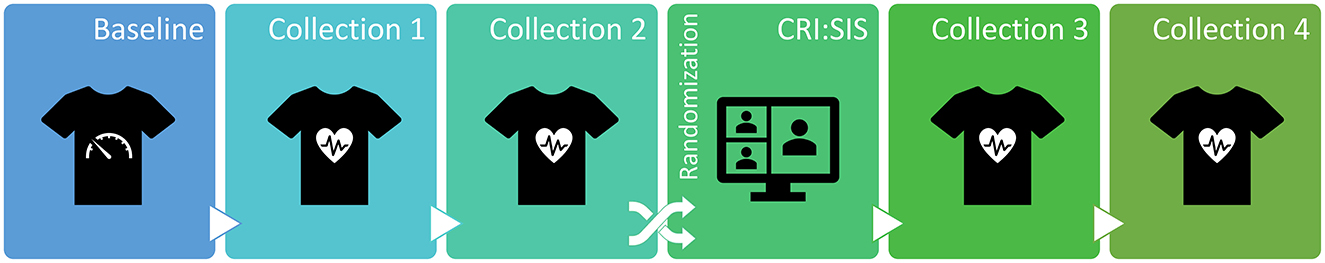
Figure 2. Study design included a baseline session, four data collections, and a virtual simulation intervention (CRI:SIS). Participants were randomized either to the intervention group or the control group.
3.2 Participants
The target participant demographic was frontline Emergency Medicine (EM) physicians across various experience levels working full-time (on average 8-h shifts) and actively treating acutely ill COVID-19 (and suspected COVID-19) in the ED. Eligible participants were enrolled across a twelve-month period starting in January 2021.
3.3 Procedure
A baseline session was conducted during a non-clinical period where the participants sat quietly for 10 min−15 min to record a baseline heart rate at rest. Each participant wore a smart garment across four clinical shifts in the ED. Our setup provided real-time visualization of the ECG signal, and a clear trace was confirmed by a research team member prior to the start of each participant's clinical shift.
3.4 Data conversion
An essential first step was converting the physiologic data collected by the wearable sensors into a usable quantitative format. Records were synced from the recording devices and stored on an online dashboard. The full, non-subsampled raw data records were downloaded from the dashboard in a compressed zip binary format. This generated the ECG in a Waveform Audio File Format (WAV) and RR intervals in binary. The ECG data is synchronous, while the RR interval data is asynchronous, returning a series of encoded timestamp/value pairs. The synchronous data does not contain the timestamps.
The WAV files required conversion into CSV, in order to be further processed in statistical and signal processing tools. We used the Hexoskin load_hx_data library as the basis to create a custom script to perform the WAV conversion. This conversion process also added the readable timestamps from the metadata statistics.csv file to the ECG recordings. Additionally, the relative time of the recordings were also added so we could match the recordings' start and end times with the hospital's schedule and calendar allowing us to precisely target windows. This conversion was run once for the whole dataset, and the results were used as the input for the data processing algorithm, discussed in detail below.
3.5 Algorithm development
Through exhaustive visual inspection and manual parsing of our ECG recordings by our data cleaning experts, we came to the realization that the complexity of the task and required expertise in the computational aspects of physiological data and sensor analysis. After market research of available software options and data services, we decided to create our own custom solution. Our team iteratively developed a Python algorithm called HRVEST to analyze the raw physiologic data collected from wearable biosensors. As part of the iterative process, we held weekly team meetings centered around the algorithm's development. This was a successful multidisciplinary collaboration where our computer science expert presented each developmental stage, challenge, and decision point, to the team which allowed for end user experience decisions to be made by our clinical experts. This open discussion allowed us to troubleshoot issues as they arose, and quickly move forward to develop a final product that met the specific HRV analysis needs of our clinical study.
HRVEST works in five phases: record analysis, metadata extraction, windowing, data selection, filtering, and analysis. These phases are thematically outlined in Figure 3 and explained in detail in Figure 4 and below.
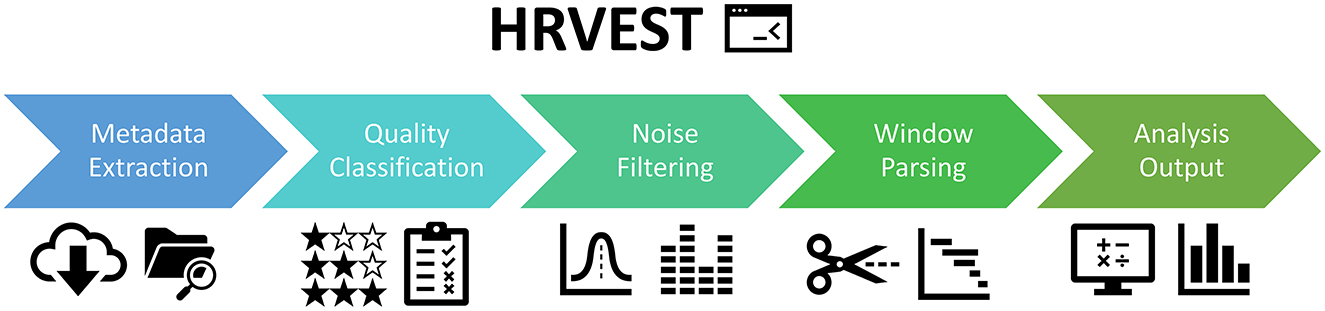
Figure 3. Thematic description of HRVEST. Algorithm design can be divided into five unique phases.
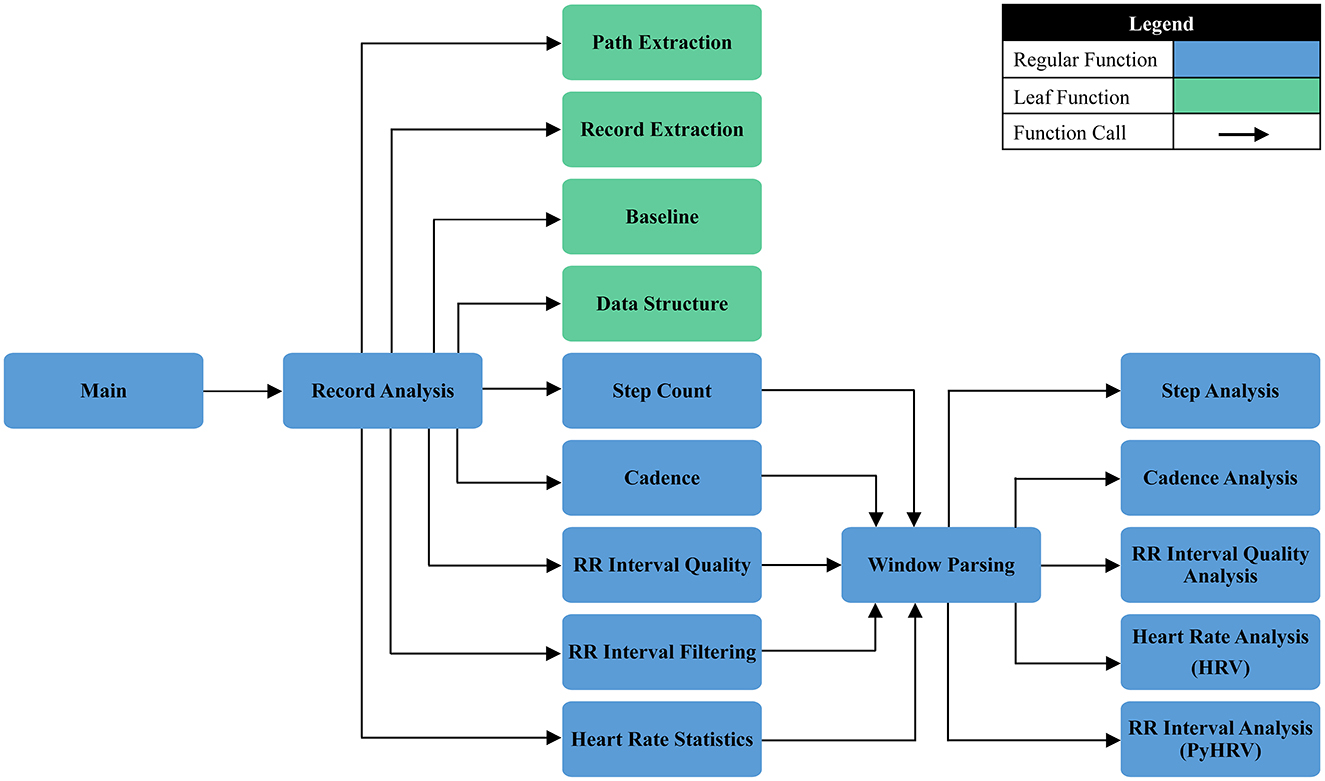
Figure 4. A detailed description of HRVEST, displayed as a function calling map outlining process flow.
3.5.1 Metadata extraction
The entry point of the code execution was the input of parameters by the user to allow the execution of the code according to the custom needs of each run. The first parameter requested was the relative path where the recordings were stored. This information was used as an entry point as the script recursively went deeper into the file structure, looking for a specific statistic file statistics.csv to process any subfolder by calling the Record Analysis function.
During this stage, the algorithm required input regarding the window size used in the analysis. We employed 5 min as the default window size, as we were looking at short term measurements for a reflection of dynamic changes and PNS tone (Shaffer and Ginsberg, 2017). Within the scope of this function, a Pystats.txt was created and populated with information regarding the specific run. This set of information allows investigators to have more information about each generated dataset and the parameters utilized, including time, the filter used, whether plots were generated, and other parameters to add traceability to the analysis. A sample statistics output is presented in the following sequence:
Folder Path: Hexoskin Raw Data
Window Size (Seconds): 300
Filter Type: Threshold
Threshold Strength: strong
Script Start Time: 2023-01-11 15:08:29
Analysis Runtime (Seconds): 4869.494397163391
Filtered: (0)
Generate Plots: False
Outliers Removed: True
Number of Standard Deviations: 3
Next, we retrieved metadata for each recording. We used the statistics.csv file, which contained information from the wearable sensor regarding the recorded session and the many parameters available (including mean HR, max HR, cadence, and step count). We retrieved time stamps related to the start and end times for each recording. Additionally, we calculated the total recording time and number of windows expected for that recording. Finally, the metadata regarding the anonymized participant IDs and the corresponding data collection stage (e.g., baseline, data collection one, two, three, or four) were collated automatically by the naming convention utilized in the directories structure, using regular expression matching.
3.5.2 Quality classification
We employed several criteria to ensure sufficient data quality to select the data that would undergo further processing. The primary quality indicator was RR signal reliability. We used the native sensor-generated data field RR_Interval_Quality, which provided an indicator of data quality for each RRi measured. These indicators were: “Reliable,” indicating good RRi and QRS quality; “Noisy,” indicating a QRS was detected in a signal with noise; and “Unreliable,” indicating a QRS could not be accurately detected. These quality categorizations are derived using histogram analyses that can flag characteristics of individual QRS signals. For more information, see Hexoskin's API documentation (Hexoskin Health Sensors AI, 2023). We only accepted data categorized as “Reliable” and recursively calculated the proportion of RRi classified as “Reliable” for each window for all recordings in the dataset. This filtering step enabled the calculation of an “Overall Quality” score based on the proportion of “Reliable” RRi out of the total identifiable RRi in the evaluated segment. For instance, an “Overall Quality” value of 0.80 would indicate that 80% of the RRi in any given segment were classified as “Reliable.”
3.5.3 Window parsing
The recordings were divided into consecutive 5-min length segments (windows). HRVEST treated each window as an independent recording, and were processed sequentially, serving as unique inputs for HRV and quality calculations.
The conventional minimum recording is 5-min durations and have been widely used and studied for decades and appear to be the most commonly found source of published HRV data (Shaffer and Ginsberg, 2017). This is likely based on a balance between capturing enough variability to make meaningful assessments and the practical constraints of real-world applications. A 5-min recording provides a sufficient number of heartbeats to obtain statistically reliable measures of HRV. In terms of clinical and research standards many HRV studies and guidelines, including those set by professional organizations (e.g., the Task Force of the European Society of Cardiology and the North American Society of Pacing and Electrophysiology), recommend a 5-min recording for HRV analysis. This timeframe strikes a balance between capturing short-term variability while keeping the analysis computationally manageable.
3.5.4 Outlier removal and noise filtering
We tested four filtering options for noise removal: moving average, moving median, quotient filter, and threshold filter:
1. The moving average, which given an order value n, replaces every RRi value by the average of its n neighbors values (Bartels and Peçanha, 2020). This smoothens the signal by reducing the impact of random fluctuations or noise. However, the moving average gives equal weight to all samples which may not suppress very noisy signals effectively. The moving average filter is a good smoothing filter in the time domain but ineffective in the frequency domain. In applications where only time-domain processing is present, moving average filters are effective, but in applications where information is encoded in both time and frequency (such as HRV), or in frequency domain solely, it may not be the optimal filter option.
2. The moving median, which works similarly to the moving average filter, but applies the median function that replaces every RRi value by the median value of its n neighboring values (Bartels and Peçanha, 2020). By running through the signal entry by entry, outliers and random fluctuations are mitigated, providing a more stable and representative signal. This technique is particularly useful in smoothing time-series data or eliminating abrupt spikes, contributing to improved signal quality. The moving median is less sensitive to outliers because the filter simply removes outliers from the result, while the moving average filter always takes into account every point. However, the moving median can be even more sensitive to short term significant spikes that span several points, especially when they span more than half of the moving window.
3. The quotient filter removes the RRi values which the ratio with its adjacent RRi is >1.2 or <0.8 (Piskorski and Guzik, 2007; Bartels and Peçanha, 2020). Quotient filtering for noise reduction involves using a specialized hash-based technique to efficiently filter out noisy elements from a set. By employing hash functions and a quotient rule, it identifies and discards elements that are likely noise. This approach is especially effective in scenarios where minimizing false positives or irrelevant information is essential.
4. The threshold filter utilizes a threshold-based artifact correction algorithm where each RRi is compared to a local value consisting of the median of adjacent RRi (local median size = 5). If the difference between a given RRi and the local median is greater than the threshold in milliseconds this RRi is considered an ectopic beat. Ectopic RRi values are replaced with cubic spline interpolation of the entire tachogram (Bartels and Peçanha, 2020).
We ultimately selected a threshold-based artifact correction filter as it allowed for the most specific detection parameters while not distorting normal RRi. Additionally, rather than simply removing artifacts, such as ectopic beats and missed beat detections, the threshold filter algorithmically corrected and replaced outlier RRi-, helping mitigate concerns of data loss. When these corrections were applied, artifact signal was replaced using cubic spline interpolation. Cubic spline interpolation is a mathematical technique used for noise reduction by creating a smooth curve that connects a set of points on a graph using cubic polynomials. By fitting cubic polynomials between adjacent points, it helps filter out high-frequency variations, reducing the impact of noise in the overall signal. This method is effective in producing a cleaner representation of the underlying data by creating a smooth and continuous curve.
Signal filtering occurred in two steps. First, we removed all RRi values over three standard deviations (SD) from the median value of the entire signal. Second, we filtered using the threshold-based artifact correction algorithm. Like in the moving median filter, each RRi was compared to the median value of neighboring RRi. We increased the local median size (N = 10) from the default (N = 5). All outlier RRi, in which the difference was greater than the local median value plus a threshold value, were replaced by cubic interpolated RRi (Figure 5). Our selected threshold value was the most sensitive, with a pre-defined strength value of 50 ms which was considered “Very Strong.” When combined, the standard deviation and threshold-based data filtering processes operated at the global and local levels for each recording. The removal of RRi based on a standard deviation metric detected outliers across the whole recording, while the filtering procedure using the threshold-based artifact correction algorithm identified outliers for each RRi.
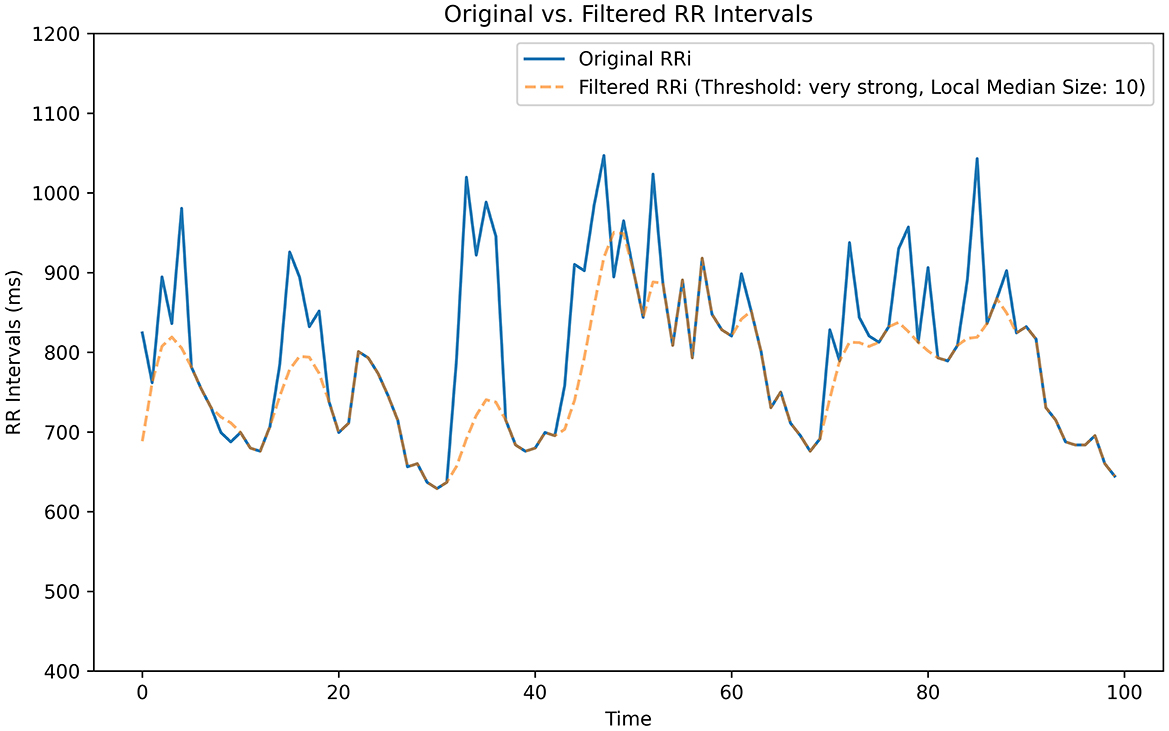
Figure 5. Threshold-based artifact correction filter. Our algorithmic threshold filter effectively reduces background noise. We tested five filter pass options: Very Low: 450 ms, Low: 350 ms, Medium: 250 ms, Strong: 150 ms, Very Strong: 50 ms. This segment was generated from a sample isolated from one of our data recordings.
In addition to noise filtering, we also implemented a quality check to verify if the amount of data we had after filtering was suitable for further analysis. This was necessary to avoid noise artifacts impacting HRV calculations. This quality check featured two criteria to ensure that each window and the generated HRV metrics would have clinical significance and interpretability. These criteria were: (1) at least 10% of the window data was usable after removing outliers and applying filtering procedures, and (2) a minimum of 10 s of continuous RRi intervals. These criteria were applied simultaneously to ensure that the RRi series fed into the analysis would be comparable among different time windows. Given our selected window size of 5 min, our two criteria covered the standards for a “reliable interval” of continuous data used to calculate HRV metrics, where HRV intervals as short as 10 s−30 s were considered reliable (Pham et al., 2021).
3.5.5 Analysis and statistical methods
Various metrics of HRV were produced both in time and frequency domains. During the analysis stage, each 5-min window served as a unique input to the Python Toolbox or Heart Rate Variability package (PyHRV), which returned a series of HRV-related metrics (e.g., time domain, frequency domain, and geometric metrics). These outputs also included HRV graphical plots for each window. Two widely used non-linear indices in the domain of HRV analysis were produced to support the future analysis of specific segments, namely Poincare and Power Spectral Density (PSD) plots (Figure 6). The Poincaré ellipse plot is a scatter plot used to display the relationship between consecutive data points in a time series, with each point corresponding to a pair of adjacent RRi values (Bartels and Peçanha, 2020). In a Poincaré plot, the shape of the resulting plot reveals information about short-term HRV patterns, such as variations in beat-to-beat intervals. Features like the plot's width and length can indicate the balance between sympathetic and parasympathetic influences on the heart, offering insights into the ANS influence on heart rate. PSD plots in HRV analysis is a graphical representation of the distribution of power across different frequency components of the HRV signal. The plot typically shows two main peaks corresponding to low-frequency (LF) and high-frequency (HF) bands. LF is associated with sympathetic and parasympathetic activity, while HF reflects parasympathetic modulation. The LF/HF ratio or the absolute power in each band can be analyzed to gain insights into the autonomic nervous system's balance and its impact on cardiovascular function during HRV assessments.
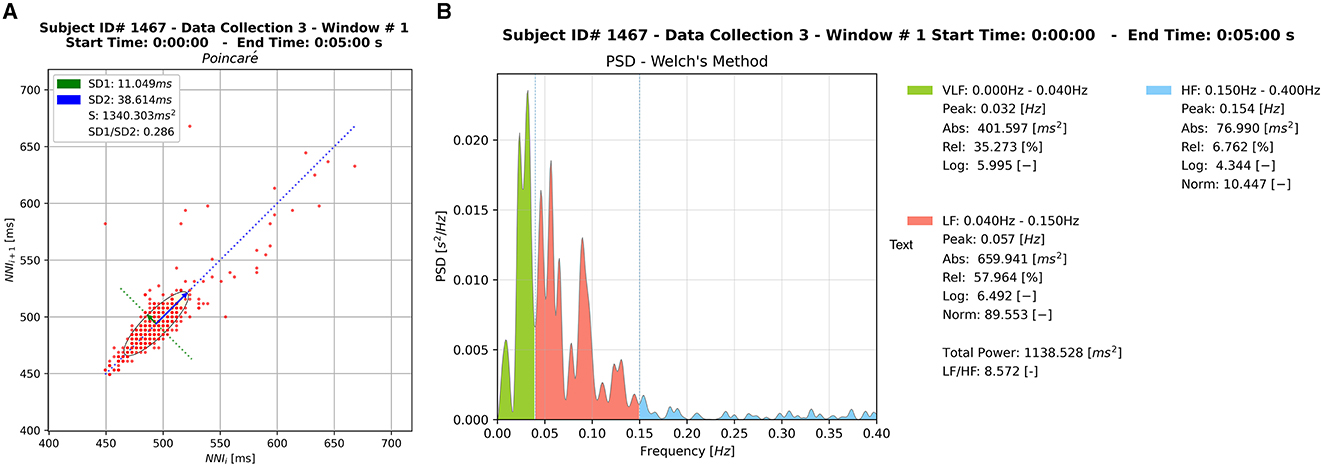
Figure 6. Sample of the graphical outputs generated by HRVEST. (A) Poincaré plot. (B) PSD plot using Welch's method for spectral density estimation. A Poincaré plot and PSD plot is generated per window analyzed.
HRV is commonly measured by calculating the successive time difference between successive Q waves on an ECG in milliseconds. Throughout the literature, this value is represented as the mean normal-to-normal (N-N) interval. The specific time value used in our analysis is the root mean square of the successive differences (RMSSD) of sequential RRi. This value assesses the root mean square of the proportion of N-N intervals that are >50 ms to the total number of N-N intervals. The RMSSD represents the peripheral nervous system (PNS) and is considered a measure of vagally mediated change which is more resistant to respiratory artifacts than other HRV measures (Shaffer and Ginsberg, 2017).
Other indicators of HRV generated were: Mean NNI difference (ms), Minimum NNI difference (ms), Maximum NNI difference (ms), and standard deviation of NNI differences (ms). Three non-linear metrics were also part of the HRV time-domain metrics: Standard deviation (SD1) of the major axis, Standard deviation (SD2) of the minor axis, and the ratio between SD1 and SD2 (SD2/SD1) (Shaffer and Ginsberg, 2017). These HRV indicators were calculated for each window. Two key indices used to visualize the time-domain (represented in a Poincaré plot) are SD1 and SD2. The former (SD1) is an indicator of short-term changes in HRV and has shown to be highly correlated with RMSSD, while the latter (SD2) correlates with the standard deviation nearest neighbor (SDNN). Additionally, the SD1 index represents the width of the ellipse in a Poincaré plot, whereas the SD2 index represents the length of the ellipse in the plot (see Figure 6A; Bartels and Peçanha, 2020).
Regarding frequency domain metrics, we calculated the PSD of the RRi series using Welch's method for spectral density estimation. The Welch method is a non-parametric approach based on Fourier Transformations and consists of the average of several PSD estimations on different segments of the same RRi series (see Figure 6B). All frequency domain parameters were then computed from this PSD according to the specified frequency bands. We retained the default values for frequency bands Very Low Frequency (VLF): (0.00Hz−0.04Hz), Low Frequency (LF): (0.04Hz−0.15Hz), High Frequency (HF): (0.15Hz−0.40Hz). The HF component is associated with the respiratory fluctuations and is produced by parasympathetic modulation. The LF is mainly coupled with variations in the blood pressure and represents the modulation of both parasympathetic and sympathetic branches of the heart (Bartels and Peçanha, 2020).
Visualized examples for both outputs can be seen in Figure 6. All metrics and plots mentioned above were generated and retained in the final data file for further statistical analysis. It should be noted that the omission of these graphical outputs can be edited in the array in the source code, diminishing the final file size and time to perform the calculations.
4 Results
4.1 Algorithm performance
We recruited 81 physicians according to our clinical trial protocol (Evans et al., 2022) who each completed a baseline session and four recorded shifts in the ED per participant, for a total of 81 baseline recordings and 324 shift recordings. Our clinical shift recordings averaged 8 h, 59 min, and 54 s in length (SD = 02 h:05 min:46 s), while the officially scheduled ED shifts are on average 7 h−10 h in length. Our entire compressed dataset, when downloaded from an online dashboard that totaled 27.6 GB. Using HRVEST, we were able to process a total of 23,241 files across 413 folders, with each folder containing 33 files of biometric data exported from the data collections. As we uncompressed the data (converted the WAV files to CSV format), the total dataset was a sizable 347 GB (composed of both compressed and uncompressed files).
4.2 Data retention
When combined, the standard deviation and threshold-based data filtering processes operated both at the file-level and interval-level variable scope for each recording. The removal of RRi based on standard deviation detected outliers across the whole recording and removed individual RRi that exceeded our established limit of three standard deviations, while the threshold-based artifact correction filter identified outliers by comparing to neighboring RRi (N = 10). Approximately 99.7% of data was retained, considering a normal distribution of RRi.
4.3 Performance advantages
HRVEST was designed to be flexible and allow key parameters to be changed during each run of the script or by changing flag variables to either include or exclude certain features, such as graphical outputs. Parameters determined by the research team that were likely to be frequently changed were defined by a prompt at the point of execution and required manual input by the user. The other parameters were implemented as a variable assignment in code and were static until otherwise edited (see Table 1).
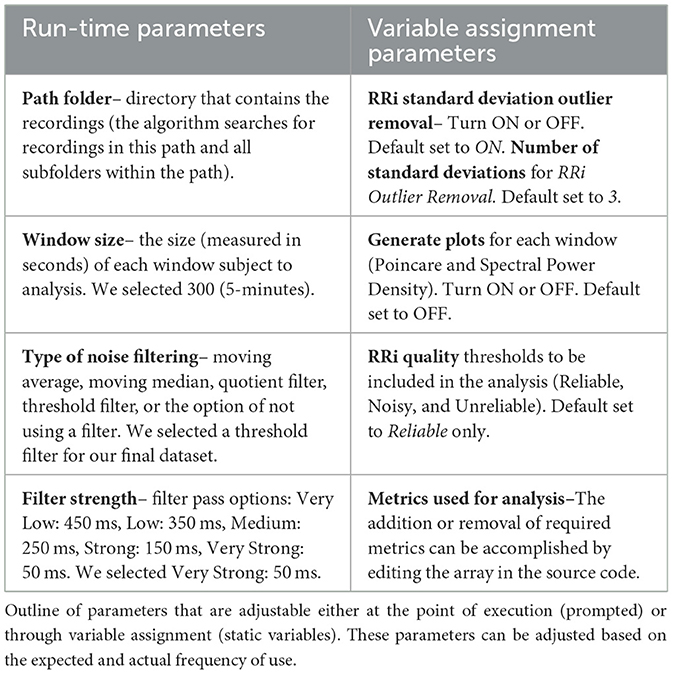
Table 1. HRVEST parameters.
4.4 Scalability
We are preparing to release HRVEST as an open-source project, along with accompanying documentation, so that it can be implemented for other research use cases. It will also provide a foundation for adding additional heart sensors or wearables. The generic parser function (Genparse) can be customized to different signals by automating the creation of windows, synchronizing and aggregating the results at various levels of granularity.
HRVEST was based on batch runs that can accommodate larger datasets, studies, and configurations. These configurations can have different types of signals and metrics (e.g., RRi, cadence, number of steps), that automatically merge the data with unique identifiers. The merger can be repeated for each participant along the different data collection points (e.g., baseline, pre-intervention, and post-intervention). Given that the most computer-intensive processes occur at the window level, the only computational limiting factor for the number of participants and recording length is based on hardware and software resources.
With regards to linear time scalability, HRVEST was able to process more than 400 ECG recordings on average of 15 min and 28 s (916.9984 s; SD = 2.72 s over 10 runs) on a laptop computer with the following specifications: 13th Gen Intel® Core™ i9–13900HX, 64 GB RAM, 1 TB SSD. This efficiency can be applied to the analysis of any RR recordings going forward. However, the runtime required is a function of the options selected. The generation of plots for each window adds significant additional runtime. Another factor influencing the total runtime is the noise filter selected during the initial setup. We used the threshold filter at the most sensitive setting (Very Strong: 50 ms) for all of our runs.
To test the scalability of HRVEST with a larger dataset, we conducted a simulated run with 50 iterations to display the mean and SD for run times of 100, 50, and 25 recordings (randomly selected). The following parameters were used: threshold filter with strong filter setting and a window size of 5 min, with plot generation disabled. The total aggregate time for the sampled 100 recordings was 749 h and 15 min. This amounted to 8,991 windows; mean = 9 h 26 min 56 s; SD = 2 h 49 min and 44 s. These results are displayed below in Figure 7.
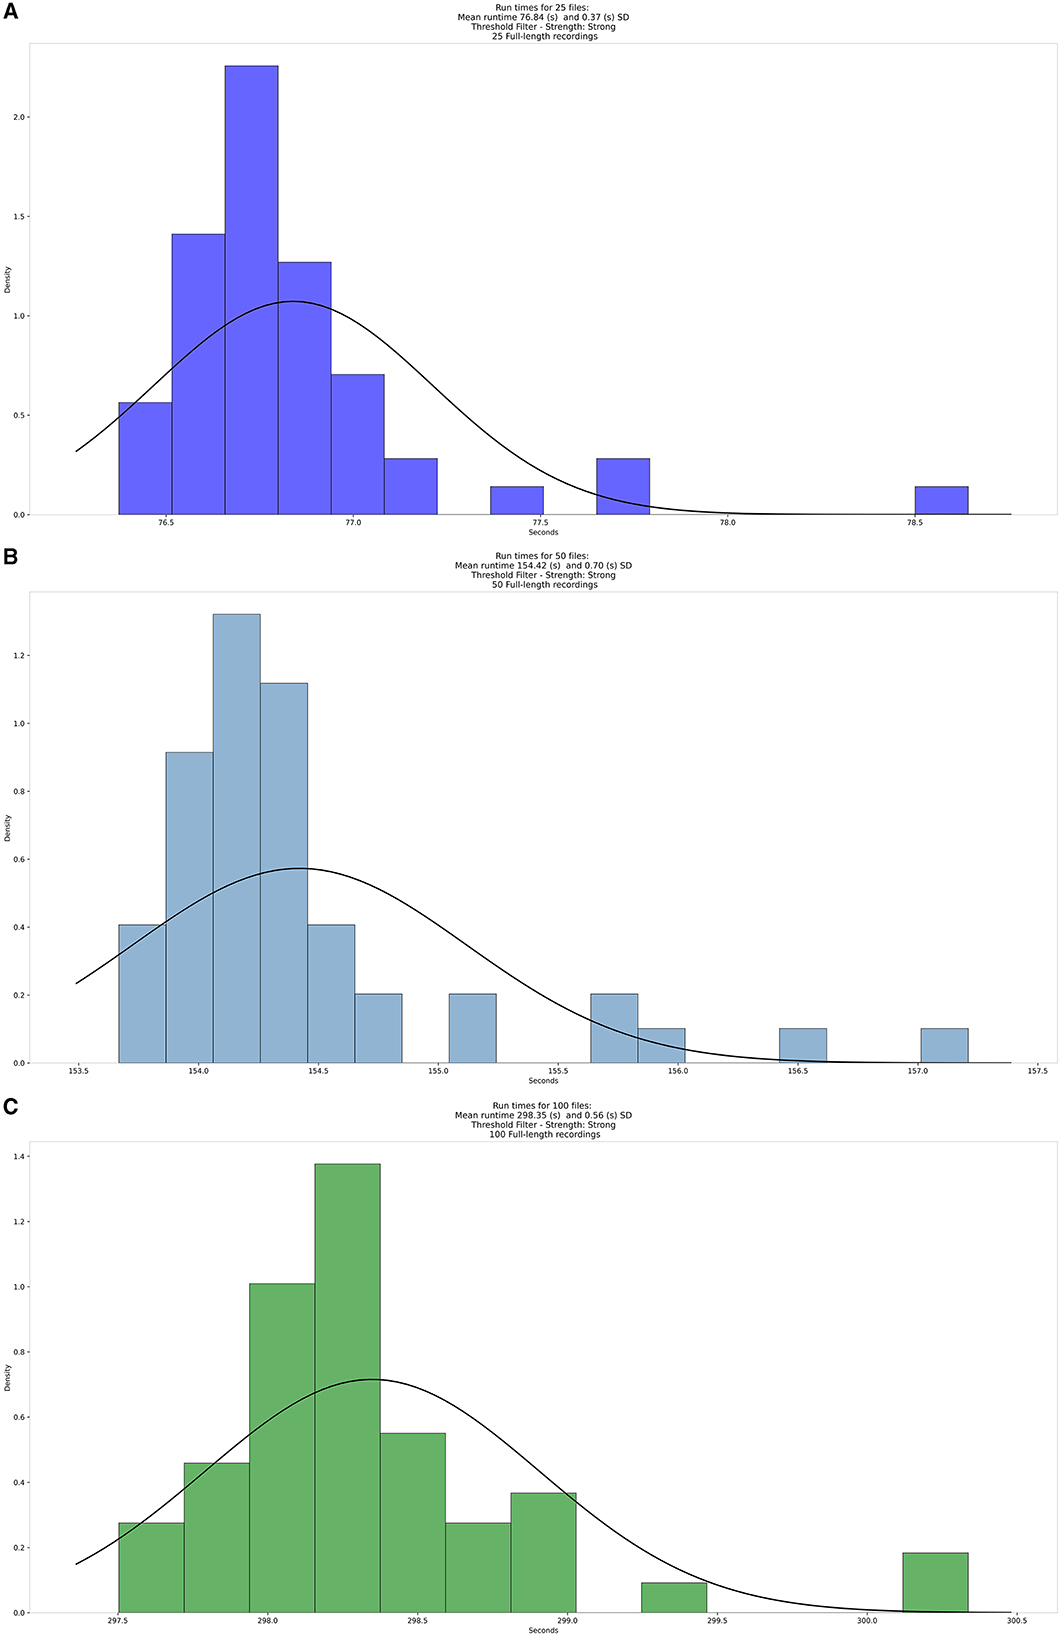
Figure 7. Density distribution of the average runtimes for (A) 25, (B) 50, and (C) 100 files, respectively.
The run times demonstrated two main properties of HRVEST: stability and linearity. The stability of the run time, defined by the Coefficient of variation (CV), was as follows for our runs of varying sample sizes: [CV (100) = 0.187 %; CV (50) = 0.453%; CV (25) = 0.481%]. Additionally, run time shows a linear growth pattern as a function of the number of recordings to be processed, with an average of 76 s to process 25 files, 154 s to process 50 files, and 298 s to process 100 files.
To verify the scalability with different sample sizes, we reran HRVEST with samples ranging from 25 to 500 recordings and timed the results over 5 consecutive runs for each sample size. The results to verify HRVEST's scalability can be seen in Figure 8. The sample recordings consisted of multiple copies of the original 100 files used in the previous timing procedure. The results of the run time analysis also demonstrated a linear growth as a function of the number of recordings to be processed, with an average of 76 s to process 25 recordings, 154 s to process 50 files, 301 s to process 100 recordings, 753 s to process 250 recordings, and 1524 s to process 500 recordings.
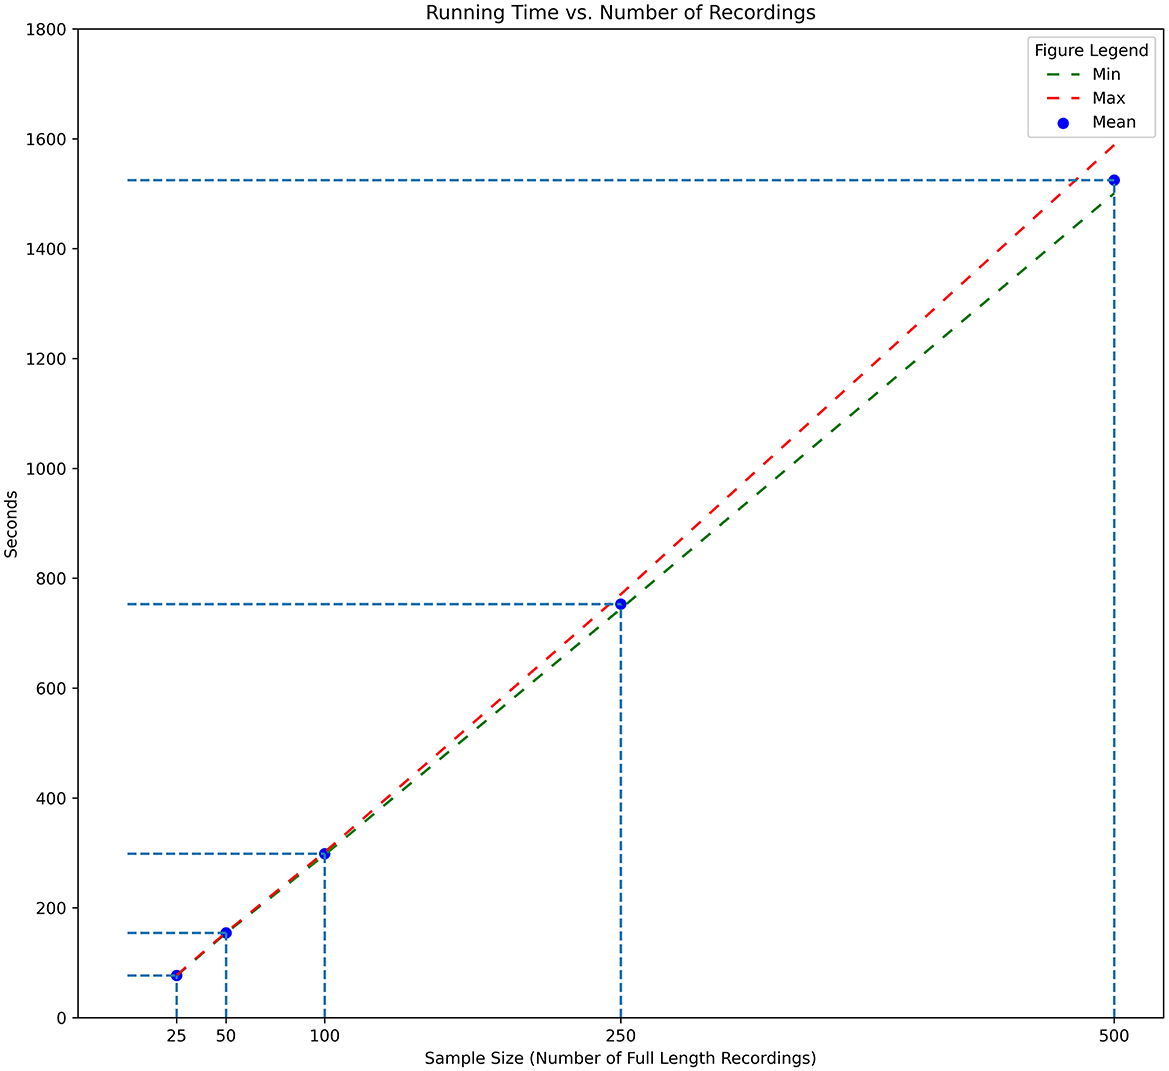
Figure 8. Processing times for full-length recordings. Number of recordings from 25 to 500. Minimum, maximum, and average time across 5 runs for each sample size.
The run times across these samples confirm the linearity of HRVEST and its ability to process large datasets on commercial off-the-shelf (COTS) systems. Execution can also be parallelly split across multiple computers, and the results can be easily merged. It is also scalable to high-performance computing (HPC) environments with minor changes to the source code.
5 Discussion
With the increased availability and affordability of wearable technologies, researchers have shown interest in predicting error-prone conditions by measuring psychological changes as they correlate with event-based stressors (Alaimo et al., 2020). Many COTS devices (Apple Watch, Whoop, Fitbit, Microsoft HoloLens, HTC Vive) are available and used in methodological studies. Our study required a wearable sensor suitable for an active environment, placing physical and emotional stressors on the wearer. We chose Hexoskin's Smart Shirts, a smart garment with embedded textile sensors worn like an athletic shirt underneath a typical healthcare uniform. Technologically, it has a large recording capacity, is not dependent on Bluetooth or Wi-Fi signal, allows for data organization of multiple participants, and provides multimodal sensor input and output.
The data solution we implemented utilizes two general purpose Python libraries that apply filters, calculate HRV metrics, generate plots, implement defined time windows for each record, and merged all results into a cohesive and complete dataset (Gomes, 2018; Bartels, 2021). Although these libraries were capable of calculating the HRV metrics, they could not help us resolve other challenges experienced when attempting to process all files sequentially, as well as in the creation of an interrelated datasets containing participant information.
Additionally, choosing the size of the time window to analyze can be challenging, as anywhere from 2 min to 24 h can be utilized for HRV calculation. The duration can reflect different characteristics of the Autonomic Nervous System (ANS) (Shaffer and Ginsberg, 2017). Our participants generally worked 8-h shifts, so in addition to choosing window length, choosing which time window to select was a study design challenge (Thielmann et al., 2021; Martinez et al., 2022). The HRVEST quality classification system simplified this task, by scoring the quality of each window, allowing for optimal window selection in future analyses. HRVEST can support other wearable sensors [with multiple complementary measures, e.g., Electrodermal Activity (EDA) and ECG] recommended in the literature to understand stress in real-world environments (Martinez et al., 2022). Another study examined wrist-based pulse rate monitors with emergency medicine physicians. The authors questioned whether the sensor technology is mature enough for the stressors and complexities of an ED setting, with high susceptibility to interference from motion and heavy occurrence of artifacts within the data (Peters et al., 2019). This research demonstrates that HRVEST can begin to overcome the environmental characteristics of the ED and can provide reliable data.
5.1 Potential applications
Existing literature describes how visual inspection and marking of physiologic data is both time-consuming and cumbersome (Hossain et al., 2022). Our previous work elucidated that manual evaluation and noise removal require several hours for a single ECG recording (Joseph et al., 2022). Manual evaluation could be feasible for individual recordings, studies with small sample sizes, or studies with short recording times.
Given our study's scope and the dataset's size, we decided to look at software-driven ECG noise-removal solutions. While testing different interactive desktop and cloud-based applications, we encountered significant limitations and found the need to develop HRVEST (see Table 2). For instance, even though batch processing is an option available in several of the packages we reviewed, most of these packages required the files be in the same folder, which would render the task of organizing the outputs back to an unified dataset infeasible. Alternatively, they would output multiple files and not combine them into a single dataset. Beyond these limitations, the specialized packages did not have a viable option to include and synchronize non RRi information as additional sensors for the same research participant. Nor were they able to synchronize across different types of data and parameters – such as time windows, RRi, number of steps, cadence, data selection based on quality, and the ability to integrate additional sensors and features.
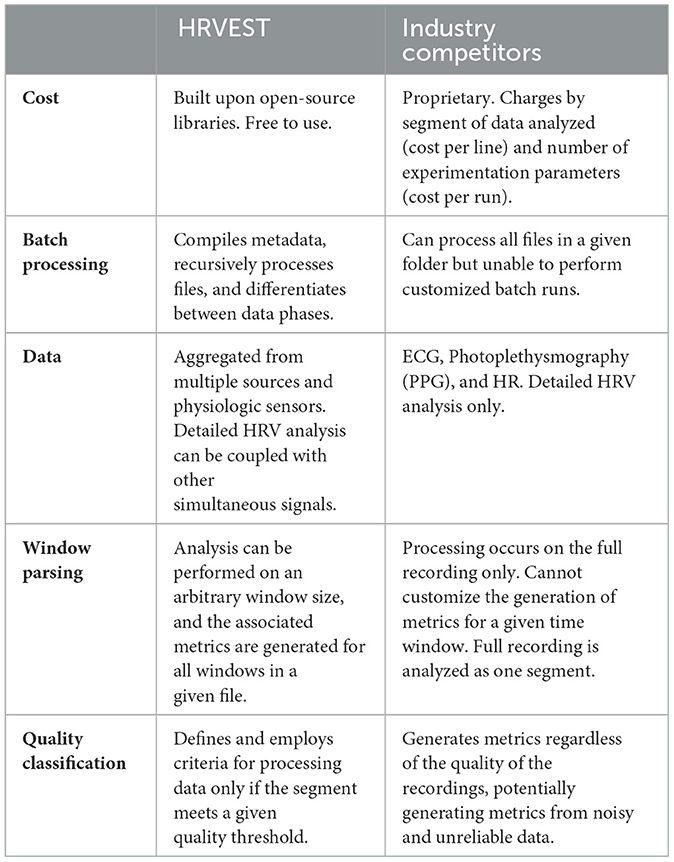
Table 2. HRVEST compared to industry competitors in key performance indicators.
The main differentiating features of HRVEST are (1) the ability to batch-run datasets, (2) the ability to create analysis segments (windows) of variable size, and (3) compilation and collation of metadata. This contrasts the industry standard that operates on an assumption of individual file analysis (one recording at a time), which proved unmanageable with our quantity of recordings. Furthermore, there are associated costs per run, which can become prohibitively expensive. This feasibly limits the quantity of data that could be analyzed, the number of adjustments that could be made, and the features that can be included. Many of these changes could only be identified through iterative testing and development.
In terms of customizability, we integrated select signals (e.g., cadence, number of steps, and data quality) and synchronized them to each window. Additionally, we included the capacity to add additional biometric data as new fields, such as continuous blood pressure, respirometry, activity level, and accelerometry. However, while initially designed in the context of Hexoskin's data formats and outputs, HRVEST can be adapted to support batch processing of other physiologic sensors and measurement devices. Our we targeted select metadata fields such as, start and end times of the recording, sensor source, and recording quality. Our customizations allow the use of a user-defined naming scheme and relative recording file locations. Finally, we were able to perform synchronization of the data at the window-level for all recordings, resulting in a unified data set.
HRVEST was built to enable the seamless addition, inheriting settings from the other signals (e.g., window size, time, and quality thresholds) while providing recursive file processing, windowing operations, filtering, and synchronization between different sensor metrics for each window. The general process to include a new sensor to HRVEST involves: (1) the conversion to CSV format (if not already provided by the device) and reading the file into memory; (2) adding relative time information (time-stamping); (3) generating information on sensor data quality; and (4) calculating any sensor-specific metric to be generated from the signal (e.g., average, maximum, minimum, frequency counts) or other statistical parameters of interest. With this universal utility, we hope to deliver HRVEST as an available resource to the academic community.
5.2 Metrics selection
The three major types of HRV measurement are time-domain, frequency domain, and geometric (Shaffer and Ginsberg, 2017). The primary measurement of interest for our analyses is a time domain value, represented by RMSSD. However, HRVEST outputs both time-domain and frequency-domain data to support usability by other developers and researchers, as well as to take advantage of functionality built into the PyHRV toolkit. Furthermore, our future research may expand to the frequency-domain data, minimizing the need for additional development. Non-linear data incorporated into HRVEST is an additional area of interest for future study. The metrics gathered from the HRVEST algorithm can also be used in conjunction with other wearable devices.
5.3 Logistics
By using wearable smart garments, we could both accurately and precisely record the heart rates of emergency physicians while working in the ED and measure HRV, a known physiologic indicator of sympathetic activity. These smart garments will be powerful clinical research tools but are not without their challenges. In situ, there are a few challenges in using wearable devices in a clinical environment. Constant skin contact with the sensor's leads and lubrication are required to obtain a clean ECG signal. We initially used ultrasound gel as the conductor for the leads, which was applied directly to the sensor on the inside of the wearable smart garment, based on recommendations from other researchers using the garments. However, we switched to a glycerin-based lotion after several participants developed contact dermatitis from the ultrasound gel. After switching lubricants, no allergic reactions occurred, and we noticed no difference in ECG recording quality. Furthermore, the lubricant must be periodically reapplied when the smart garment is worn over an extended period. Participants were instructed to reapply on their breaks, but this was not always possible and could be the cause for low-quality ECG recordings.
While the wearable smart garments were previously sized and fitted, they can loosen and shift over the course of activity and lead to the sensors not being optimally placed. Movement of the shirt may interfere with the ECG reading and cause discomfort to the participant, leading to further adjustment to the sensor position. A notable cause of artifact in the recordings of female participants was that the band of the built-in shelf bra could flip over, causing the sensors to no longer be in direct contact with skin. Additionally, some participants opted to wear a separate bra under the smart garment, which occasionally caused contact-interference with the thoracic leads.
5.4 Data processing
Other than the logistical challenges of using a wearable sensor, our largest hurdle was analyzing the amount of raw physiologic data collected as a set of interrelated sensor data recordings. HRVEST assessed the readability of RRi from large batches of participant ECG data and automated the analysis of the shift recordings while filtering outlier beats that skewed the RRi variability calculations. One advantage we had in overcoming the data challenges was the multidisciplinary nature of our research team. Our computer scientist provided clarifications of pathways in code, our human factors engineers assisted in translating code to usable human-centered output, and our research clinicians ensured relevance and accuracy within the healthcare setting in which they worked.
From a Computer Science perspective, iterative development involved testing four different lowpass filters for noise removal. We determined which protocol yielded the most usable results by comparing datasets of the four filter options: moving average, moving median, quotient filter, threshold filter, and with no filter applied. We selected a threshold-based artifact correction filter, which not only was the most sensitive to identifying ectopic beats but also corrected and replaced the RRi to maximize data retention. Literature support also establishes the threshold filter as a reliable noise-reduction methodology utilized by other industry ECG analysis software(s) (Tarvainen et al., 2014; Alcantara et al., 2020).
5.5 Baseline
The baseline required reworking in order to meet the quality requirements to maximize flexibility and baseline comparison for future studies. Below we discuss challenges as well as our implemented solution.
5.5.1 Challenges
The baseline recording posed two unique challenges. The first was the size of the baseline recordings, which were a minimum of 10 min that would typically be split into two 5-min windows. Any remaining time would be discarded if it did not fit exactly within a 5-min interval. The downside to this approach was that we were losing data and not guaranteeing the highest-quality windows from the recording. The default program sequentially defines 5-min windows starting with the beginning of the recording. However, if the highest quality window overlapped between two 5-min windows, it would not be captured (see Figure 9).
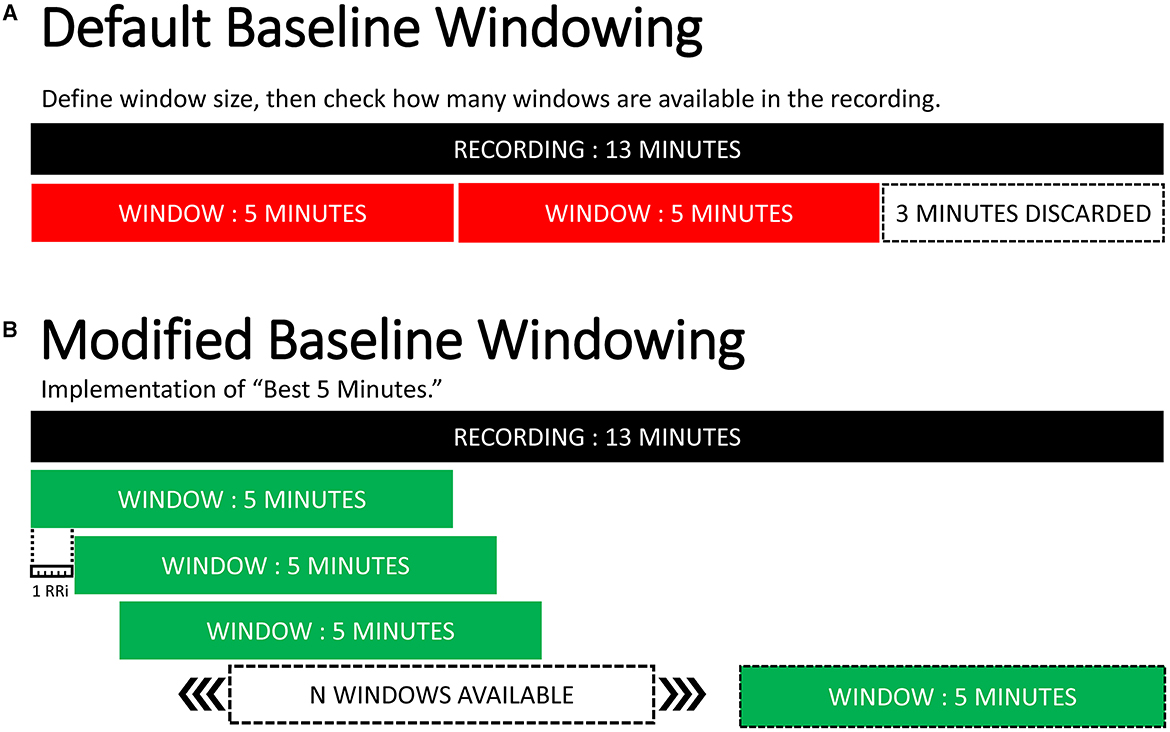
Figure 9. Baseline windowing optimization. (A) default windowing behavior for the baseline recording. (B) implemented baseline windowing algorithm. Moving reading frame every RRi logging every sequential window. Selects the highest quality 5-min window within a recording.
A second challenge was when the baseline session was combined with the first data collection, which had to be differentiated. Due to scheduling complications, some participants sat for their baseline session immediately before starting their first data collection. After leaving the baseline session, the participant continued wearing the smart garment from the baseline session and subsequently began their shift in the ED. Because the recording device was never paused or disconnected, it was still actively recording, causing the Baseline session and Data Collection #1 to be one continuous recording. These select recordings had to be manually identified, and a secondary process was utilized to split these recordings into their respective phases for analysis.
All files processed as a baseline were relocated to a specific folder to facilitate the data splitting. Once we identified the baseline, the first 20 min of the recording were analyzed with the normal protocol for identifying the best windows within the baseline, so the recording would start after the 20 min used for the baseline to prevent analyzing the same segment twice. Furthermore, all computed windows created prior to the start of the non-baseline portion of the recording were discarded.
5.5.2 Adaptation
For the baseline recordings, we selected the highest quality 5-min window by adapting and implementing a unique baseline windowing protocol. First, the script confirmed that at least one window was available in the recording, calculated the quality score, and logged the start and end times. The algorithm reading frame then sequentially assessed every RRi from the beginning of the baseline recording and logged each 5-min window and identified the window with the best signal quality. The algorithm determined if the window fit the reading frame, and if so, then calculated the quality index and stored the start and end time of the new window. A visual representation comparing the original and adapted baseline behaviors can be seen in Figure 9.
5.6 Limitations
Being that HRVEST was a custom-developed solution to fit a particular use case, the main limitations of HRVEST were introduced by the study design and the equipment used. Both limitations can be addressed since additional customization will be required as some signals differ from device to device, such as signal quality indicators (which were used to select suitable RRi segments to be processed). The limitations related to the study design are the specific folder naming schemes and the location of meta information. HRVEST assumes that the unidentified participant ID and data collection phase are embedded in the naming of the files. Furthermore, the location in specific folders, such as “Baseline” dictates how files are organized and will be processed, compared with data available on folders assigned to “normal” full-length recordings. These methods can be customized or eliminated in future adaptations according to each use case and changes in the study design.
Regarding equipment used, we employed a sensor that provides signal quality information for each RRi. In cases where devices do not provide signal quality information, this information could be added through third-party libraries or by using alternative classifiers to indicate whether the data is considered adequate for further analysis. The generated data can also be integrated into our existing record analysis with minor adjustments to ensure readability by HRVEST.
It should be noted that the default activity measurements we included were step count and cadence. Through testing, cadence was determined to be inaccurate for movement under 30 steps/min. For more precise activity measurements, we recommend combining movement with accelerometer data in order to give further insight as to whether the participant was sitting, standing, or lying down during a particular moment of rest. High-resolution activity data can be exported from the 3-axis accelerometer, and given more time to develop HRVEST, we could have incorporated accelerometer data for a more detailed picture of the participant's activity.
5.7 Future directions
The impact of burnout on healthcare providers is concerning as it can lead to increased medical errors, compromised patient care, decreased job satisfaction, and negatively affect their mental health. It is crucial to implement strategies to reduce stress, such as providing adequate support, creating an environment that promotes work-life balance, and prioritizing provider wellbeing. Data collected from wearable sensors can provide insight into directed interventions, such as targeted counseling services, guided debriefing sessions, and access to mental health resources.
While most existing literature involves wearables during simulation scenarios, our use case is one of the first to use in situ. Further investigation of combining smart garments and educational simulation should be explored to monitor and improve our colleagues' physical and emotional wellbeing. Now, with the ability to batch process data in a quality-controlled way, using wearable sensors to monitor HRV over long periods of time becomes logistically viable for future studies. We also see the potential for real-time feedback to prophylactically reduce physician stress, like informing optimal break-taking or short meditation sessions to lower heart rate. This could improve emotional wellbeing and burnout factors, subsequently improving clinical decision-making and patient outcomes. Furthermore, our algorithm can be adapted to process heart rate data exported from other common consumer wearables (i.e., Apple Watch, Whoop, and Fitbit). Using ubiquitous devices to track heart rates can greatly expand the participant base from a sensor wear ability and availability perspective.
Data availability statement
The raw data supporting the conclusions of this article will be made available by the authors, without undue reservation.
Ethics statement
This study involving humans was approved by the Yale University Institutional Review Board, and conducted in accordance with the local legislation and institutional requirements. All participants provided written statements of informed consent in order to participate in this study.
Author contributions
JG: Writing—original draft, Writing—review & editing, Data curation, Formal analysis, Methodology, Supervision. GO: Writing—original draft, Writing—review & editing, Formal analysis, Methodology, Software. MB: Writing—original draft, Writing—review & editing. MJ: Conceptualization, Formal analysis, Investigation, Methodology, Validation, Writing—review & editing. AW: Conceptualization, Funding acquisition, Writing—review & editing. WB: Supervision, Writing—review & editing. LE: Conceptualization, Formal analysis, Funding acquisition, Investigation, Project administration, Resources, Supervision, Writing—original draft, Writing—review & editing.
Funding
The author(s) declare financial support was received for the research, authorship, and/or publication of this article. This study was funded by the Agency for Healthcare Research and Quality (AHRQ), award number 1R01HS028340-01.
Acknowledgments
The authors would like to thank August Allocco, who assisted in the data cleaning and study preparation. We would also like to thank Hexoskin Health Sensors and AI and Carré Technologies for their support and guidance during the project.
Conflict of interest
The authors declare that the research was conducted in the absence of any commercial or financial relationships that could be construed as a potential conflict of interest.
Publisher's note
All claims expressed in this article are solely those of the authors and do not necessarily represent those of their affiliated organizations, or those of the publisher, the editors and the reviewers. Any product that may be evaluated in this article, or claim that may be made by its manufacturer, is not guaranteed or endorsed by the publisher.
References
Alaimo, A., Esposito, A., Orlando, C., and Simoncini, A. (2020). Aircraft pilots workload analysis: heart rate variability objective measures and NASA-task load index subjective evaluation. Aerospace 7, 137. doi: 10.3390/aerospace7090137
Alcantara, J. M. A., Plaza-Florido, A., Amaro-Gahete, F. J., Acosta, F. M., Migueles, J. H., Molina-Garcia, P., et al. (2020). Impact of using different levels of threshold-based artefact correction on the quantification of heart rate variability in three independent human cohorts. J. Clin. Med. 9, 325. doi: 10.3390/jcm9020325
Bartels, R. (2021). Pythonic Package for Heart Rate Variability Analysis. hrv 0.2.10. Available online at: https://pypi.org/project/hrv/ (accessed September 12, 2023).
Bartels, R., and Peçanha, T. (2020). HRV: a pythonic package for heart rate variability analysis. J. Open Source Softw. 5, 1867. doi: 10.21105/joss.01867
De Stefano, D., Philippon, C., Krastinova, A. L., Hausfater, E., Riou, P., Adnet, B., et al. (2017). Effect of emergency physician burnout on patient waiting times. Int. Emerg. Med. 13, 421–428. doi: 10.1007/s11739-017-1706-9
Evans, L. V., Ray, J. M., Bonz, J. W., Joseph, M., Gerwin, J. N., Dziura, J. D., et al. (2022). Improving patient and clinician safety during COVID-19 through rapidly adaptive simulation and a randomised controlled trial: a study protocol. BMJ Open 12, e058980. doi: 10.1136/bmjopen-2021-058980
García Martínez, C. A., Otero Quintana, A., Vila, X. A., Lado Touriño, M. J., Rodríguez-Liñares, L., Rodríguez Presedo, J. M., et al. (2017). Heart Rate Variability Analysis with the R Package RHRV. Use R! Cham: Springer. doi: 10.1007/978-3-319-65355-6
Goldberger, A. L., Amaral, L. A., Glass, L., Hausdorff, J. M., Ivanov, P. C., Mark, R. G., et al. (2000). PhysioBank, PhysioToolkit, and PhysioNet: components of a new research resource for complex physiologic signals. Circulation 101, E215–E220. doi: 10.1161/01.CIR.101.23.e215
Gomes, P. (2018). Python Toolbox for Heart Rate Variability. pyHRV. Available online at: https://pyhrv.readthedocs.io/en/latest/index.html (accessed September 12, 2023).
Hexoskin Health Sensors and AI (2023). Hexoskin REST API. Available online at: https://api.hexoskin.com/docs/resource/datatype/ (accessed September 12, 2023).
Hexoskin Support Community (2023). How Do I Convert the binary Data Exported From the Hexoskin Dashboard?Available online at: https://support.hexoskin.com/how-do-i-convert-the-binary-data-exported-from-the-hexoskin-dashboard (accessed December 21, 2023).
Hossain, M. B., Posada-Quintero, H. F., Kong, Y., McNaboe, R., and Chon, K. H. (2022). Automatic motion artifact detection in electrodermal activity data using machine learning. Biomed. Sig. Proc. Contr. 74, 103483. doi: 10.1016/j.bspc.2022.103483
Joseph, M., Ray, J. M., Chang, J., Cramer, L. D., Bonz, J. W., Yang, T. J., et al. (2022). All clinical stressors are not created equal: differential task stress in a simulated clinical environment. AEM Educ Train 6, e10726. doi: 10.1002/aet2.10726
Kanthak, M. K., Stalder, T., Hill, L. K., Thayer, J. F., Penz, M., Kirschbaum, C., et al. (2017). Autonomic dysregulation in burnout and depression: evidence for the central role of exhaustion. Scand. J. Work Environ. Health 43, 475–484. doi: 10.5271/sjweh.3647
Kaufmann, T., Sutterlin, S., Schulz, S. M., and Vogele, C. (2011). ARTiiFACT: a tool for heart rate artifact processing and heart rate variability analysis. Behav. Res. Methods 43, 1161–1170. doi: 10.3758/s13428-011-0107-7
Lai, J., Ma, S., Wang, Y., Cai, Z., Hu, J., Wei, N., et al. (2020). Factors associated with mental health outcomes among health care workers exposed to coronavirus disease 2019. JAMA Netw. Open 3, e203976. doi: 10.1001/jamanetworkopen.2020.3976
Martinez, G. J., Grover, T., Mattingly, S. M., Mark, G., D'Mello, S., Aledavood, T., et al. (2022). Alignment between heart rate variability from fitness trackers and perceived stress: perspectives from a large-scale in situ longitudinal study of information workers. JMIR Hum. Factors 9, e33754. doi: 10.2196/33754
Nguyen, J., Liu, A., McKenney, M., Liu, H., Ang, D., Elkbuli, A., et al. (2021). Impacts and challenges of the COVID-19 pandemic on emergency medicine physicians in the United States. Am. J. Emerg. Med. 48, 38–47. doi: 10.1016/j.ajem.2021.03.088
Panagioti, M., Panagopoulou, E., Bower, P., Lewith, G., Kontopantelis, E., Chew-Graham, C., et al. (2017). Controlled interventions to reduce burnout in physicians: a systematic review and meta-analysis. JAMA Intern. Med. 177, 195–205. doi: 10.1001/jamainternmed.2016.7674
Perakakis, P., Joffily, M., Taylor, M., Guerra, P., and Vila, J. (2010). KARDIA: a Matlab software for the analysis of cardiac interbeat intervals. Comput. Methods Prog. Biomed. 98, 83–89. doi: 10.1016/j.cmpb.2009.10.002
Peters, G. A., Wong, M. L., Joseph, J. W., and Sanchez, L. D. (2019). pulse rate variability in emergency physicians during shifts: pilot cross-sectional study. JMIR mHealth uHealth 7, e13909. doi: 10.2196/13909
Pham, T., Lau, Z. J., Chen, S. H. A., and Makowski, D. (2021). Heart rate variability in psychology: a review of HRV indices and an analysis tutorial. Sensors 21, 3998. doi: 10.3390/s21123998
Pichot, V., Roche, F., Celle, S., Barthélémy, J.-C., and Chouchou, F. (2016). HRVanalysis: a free software for analyzing cardiac autonomic activity. Front. Physiol. 7:557. doi: 10.3389/fphys.2016.00557
Piskorski, J., and Guzik, P. (2007). Filtering Poincaré plots. Comput. Methods Sci. Technol. 11, 39–48. doi: 10.12921/cmst.2005.11.01.39-48
Rodriguez-Linares, L., Mendez, A. J., Lado, M. J., Olivieri, D. N., Vila, X. A., Gomez-Conde, I., et al. (2011). An open source tool for heart rate variability spectral analysis. Comput. Methods Prog. Biomed. 103, 39–50. doi: 10.1016/j.cmpb.2010.05.012
Shaffer, F., and Ginsberg, J. P. (2017). An overview of heart rate variability metrics and norms. Front. Public Health 5:258. doi: 10.3389/fpubh.2017.00258
Shanafelt, T. D., Hasan, O., Dyrbye, L. N., Sinsky, C., Satele, D., Sloan, J., et al. (2015). Changes in burnout and satisfaction with work-life balance in physicians and the general US working population between 2011 and 2014. Mayo Clin. Proc. 90, 1600–1613. doi: 10.1016/j.mayocp.2015.08.023
Tarvainen, M. P., Niskanen, J. P., Lipponen, J. A., Ranta-Aho, P. O., and Karjalainen, P. A. (2014). Kubios HRV – heart rate variability analysis software. Comput. Methods Progr. Biomed. 113, 210–220. doi: 10.1016/j.cmpb.2013.07.024
Tawfik, D. S., Scheid, A., Profit, J., Shanafelt, T., Trockel, M., Adair, K. C., et al. (2019). Evidence relating health care provider burnout and quality of care. Ann. Intern. Med. 171, 555–567. doi: 10.7326/M19-1152
Thielmann, B., Pohl, R., and Böckelmann, I. (2021). Heart rate variability as a strain indicator for psychological stress for emergency physicians during work and alert intervention: a systematic review. J. Occup. Med. Toxicol. 16, 1–14. doi: 10.1186/s12995-021-00313-3
Vest, A. N., Da Poian, G., Li, Q., Liu, C., Nemati, S., Shah, A. J., et al. (2018). An open source benchmarked toolbox for cardiovascular waveform and interval analysis. Physiol. Measur. 39:105004. doi: 10.1088/1361-6579/aae021
Keywords: heart rate variability, smart garments, wearable sensors, sensor toolkits, emergency medicine, ECG noise reduction
Citation: Gerwin JN, de Oliveira Almeida G, Boyce MW, Joseph M, Wong AH, Burleson W and Evans LV (2024) HRVEST: a novel data solution for using wearable smart technology to measure physiologic stress variables during a randomized clinical trial. Front. Comput. Sci. 6:1343139. doi: 10.3389/fcomp.2024.1343139
Received: 23 November 2023; Accepted: 01 February 2024;
Published: 22 February 2024.
Edited by:
Bo Zhou, German Research Center for Artificial Intelligence (DFKI), GermanyReviewed by:
Colin K. Drummond, Case Western Reserve University, United StatesAgnes Gruenerbl, German Research Center for Artificial Intelligence (DFKI), Germany
Copyright © 2024 Gerwin, de Oliveira Almeida, Boyce, Joseph, Wong, Burleson and Evans. This is an open-access article distributed under the terms of the Creative Commons Attribution License (CC BY). The use, distribution or reproduction in other forums is permitted, provided the original author(s) and the copyright owner(s) are credited and that the original publication in this journal is cited, in accordance with accepted academic practice. No use, distribution or reproduction is permitted which does not comply with these terms.
*Correspondence: Jeffrey N. Gerwin, jeffrey.gerwin@yale.edu; Michael W. Boyce, michael.boyce@yale.edu; Leigh V. Evans, leigh.evans@yale.edu