Using a Modeling Approach to Inform Progress Towards Stoat Eradication From the Orkney Islands
 Karol Zub
 Pablo García-Díaz
 Sarah Sankey3
  Xavier Lambin
- 1Ecophysiology and Behavioral Ecology Research Unit, Mammal Research Institute, Białowieza, Poland
- 2The School of Biological Sciences, University of Aberdeen, Aberdeen, United Kingdom
- 3Royal Society for the Protection of Birds, Sandy, United Kingdom
Invasive non-native species eradication attempts are typically large and expensive projects that benefit from the support of quantitative tools, such as population models, to be completed within the scheduled and funded time. Managed ecosystems are constantly changing due to population and ecosystem dynamics. Accordingly, any model predictions need to be updated, using different sources of data, to inform the project about the progress toward eradication. The stoat Mustela erminea was introduced to the hitherto predatory land mammal free Orkney archipelago around 2010. In 2016, a project aiming to eradicate stoats to preserve ecologically and economically important native wildlife was designed and implemented. It entailed a “knockdown” phase followed by a “mopping-up” phase to remove stoats that escaped capture. We used data from this project to iteratively predict the progress toward eradication. We applied spatially explicit individual-based models to estimate the proportion of stoats being exposed to capture, and then compared these simulation-based predictions with removal data, allowing us to estimate changes in the population size through time. We also used sighting data from members of the public to refine eradication probability. We were also able to demonstrate how the initially wide uncertainty gradually diminished as more evidence accumulated. The information derived from different types of data and quantitative models allowed us to track the effectiveness of current trapping approaches and to help to inform project managers about when the project achieved the knockdown phase milestone. Our analyses confirmed that the expected magnitude of the initial knockdown phase has been achieved in some areas, but also revealed spatial and temporal heterogeneity in the distribution of captures, most likely caused by the sequential trapping and stoat movement and trap shy stoats exposed to capture but not caught. This heterogeneity calls for additional data sources (e.g., from camera traps or detection dogs) to estimate the proportion of trap-shy individuals and the size of the untrapped population, and ultimately the feasibility of eradication.
Introduction
Invasive non-native species threaten biodiversity, economies, and human well-being globally (Pejchar and Mooney, 2009; Pyšek et al., 2020). Although most effective strategies are directed toward prevention and rapid response, there remains a need to manage the impacts of the large number of invasive species that are already established (Robertson et al., 2020; García-Díaz et al., 2021). The challenges of eradication include identifying the most effective removal techniques, optimizing the removal process, quantifying progress toward eradication and, eventually, declaring with high confidence that the task has been achieved. These steps always require securing sufficient funding and public support, especially in inhabited places, throughout what is often a multi-year process (Glen et al., 2013). Moreover, developing effective management practices to guide how to control invasive species is hampered by uncertainties in the effectiveness of the management tools available (Samaniego et al., 2021). Reducing these uncertainties requires not only data and models that integrate different sources of information but also a framework that links the developing knowledge with a transparent decision-making process (Baker and Bode, 2021).
Adaptive management (AM) is recognized as an adequate approach in the presence of uncertainty about the potential efficacy of different and changing management interventions (Westgate et al., 2013). In short, AM can be described as “learning by doing,” which is a decision process based on frequently updated knowledge derived from monitoring and other sources of information. This knowledge is used to discriminate between competing models and interventions, testing how a given system is responding to different interventions. Despite its theoretical appeal, examples of the implementation of formal AM are relatively scarce (Westgate et al., 2013). Examples include its application to the management of native species, e.g., wolf Canis lupus in North America (Varley and Boyce, 2006) or Sika deer Cervus nippon in Japan (Kaji et al., 2010), and invasive species, e.g., brushtail possum Trichosurus vulpecula and ship rat Rattus rattus in New Zealand (Innes et al., 1999), and feral pigs Sus scrofa in Australia (Cowled et al., 2008; Nugent et al., 2018). A notable highly successful implementation of AM in Europe is the transnational shooting quota setting plan for a migratory waterbird population (Madsen et al., 2017) and the control of invasive American mink Neovison vison in Scotland (Bryce et al., 2011).
One of the main barriers faced during eradication is a need for evidence on the efficacy of removal efforts. Particularly for cryptic animals, imperfect detection of the target species and usually unknown initial population size make predicting the progress toward eradication and ultimately confirming eradication success difficult despite their critical importance (Baker and Bode, 2021). In an ideal, constraint-free world, the density and distribution of animals would be determined using one of the available survey methods before commencing the eradication programme (e.g., capture–recapture of marked individuals, snow-tracking, or camera trapping). More often than not, owing to limited time and resources, the only sources of information are the number of culled individuals. Fortunately, the judicious use of innovative quantitative models makes it possible to use this type of data to inform ongoing and future eradication efforts.
Every eradication program requires consent hence has a social component, which could hinder or facilitate the entire process (Martin et al., 2019). Due to the multi-stakeholder character of most environmental management scenarios, the barriers to the implementation of AM are often more of a social, rather than technical nature, e.g., restricted land access at the landscape scale increases the risk of reinvasion of animals from unmanaged properties and reduce the efficacy of the eradication (Glen et al., 2017). On the other hand, local communities could be also directly involved in the eradication process by trapping on their land or by providing information about the presence of invasive species (e.g., sightings, tracks, and signs) (Martin et al., 2019; Arts et al., 2020).
The stoat Mustela erminea, a native species in Europe, was introduced to the land-mammal-free Orkney archipelago in 2010 and poses a serious threat to native wildlife, ground nesting birds and the endemic Orkney vole Microtus arvalis orcadensis (Fraser et al., 2015). In 2016, Scottish Natural Heritage (rebranded as NatureScot) and the Royal Society for the Protection of Birds (RSPB), later joined by the Orkney Islands Council, formed a partnership to develop the Orkney Native Wildlife Project (ONWP), which aims to eradicate stoats across the Orkney archipelago to safeguard native biodiversity and the associated outdoor focused local economy. Social feasibility assessments conducted during the development phase of the project showed that native wildlife is a strong part of islander identity and that there was evidence of widespread support for both the conservation of native wildlife and the need for this project (ONWP, Consultation Report for mid-term review meeting 2018). With planned near simultaneous deployment and opening of up to 10,000 traps, ONWP is one of the largest invasive eradication attempts worldwide and these trapping efforts provide a great amount of data.
In order to inform on the progress of ONWP toward its preliminary milestones, we combined diverse sources of data to construct a set of complementary simulation and statistical quantitative models that were applied early in the eradication process and that shed light on the progress by providing sequential estimates of initial standing stoat density and degree of depletion. Our tools turned out to be also useful in answering some specific questions, such as the likely effect of the by-catch of non-target species (brown rats Rattus norvegicus) and the impact of restricted land access on trapping efficacy. We illustrate how the initially wide uncertainty gradually diminished as more evidence accumulated.
Materials and Methods
Study Area and Data
The Orkney archipelago is a group of 70 islands located off the north coast of Scotland and known for its uniquely abundant wildlife that thrives in the absence of terrestrial mammalian predators, other than feral cats (Felis catus). Stoats were first detected on the Orkney archipelago in 2010 despite no historical or archaeological evidence they ever colonized the area. Early limited attempts to remove stoats by trapping before they spread failed, and they colonized the Orkney's mainland and the islands linked to it by causeways, Lamb Holm, Glimps Holm, Burray, and South Ronaldsay (South Ronaldsay and Linked Isles hereafter, Figure 1). In 2021, stoats remain absent from the remaining islands forming the archipelago.
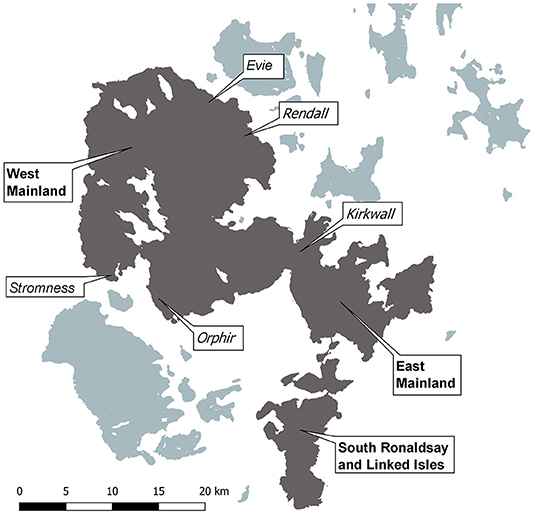
Figure 1. Orkney archipelago with three main trapping areas (bold) and biosecurity trapping areas (italics). Dark gray—confirmed presence of stoats.
Between 2017 and August 2019, a network of so-called biosecurity traps was in operation across Orkney Islands to reduce the chance of stoats swimming across narrow channels of water to colonize stoat free islands (King et al., 2014). During this period 169 traps were in operation along the coast at four different sites, Orphir, Kirkwall (Carness), Stromness, and Evie/Rendall, opposite islands at high risk of colonization due to their proximity to the land. Two lines of traps were set at each site within 1-km of the coast. These initially consisted of a mixture of DOC150 and DOC200 traps in double cubby run through tunnels and DOC200 traps in single cubby tunnels.
DOC traps are spring traps (humane killing traps) designed by the New Zealand Department of Conservation (DOC). DOC200 traps are placed in the wooden tunnels to exclude non-target species, guide target species, and provide public safety. Tunnels are approximately 520 mm long (single, one entrance) and 950 mm long (double, run-through) and are equipped with inner and external baffles made of wire mesh. More details on the DOC200 traps design can be found at https://www.doc.govt.nz/documents/conservation/ threats-and-impacts/animal-pests/doc200-predator-trap.pdf. The aperture in the outer baffle for a run-through tunnel was originally 51 mm (2 inches), made by four squares cut from 12.5 mm ( inch) wire mesh, but it was later reduced vertically to three cuts (approximately 37.5 mm) to avoid the risk of catching smallest domestic cats, which occasionally entered the traps. The traps were baited with the meat of rabbit, geese and fish in autumn and winter, and hen eggs in spring and summer.
All DOC150 were eventually replaced by DOC200 beginning in August 2019 and finishing in July 2020. In June 2020, the biosecurity network was bolstered by the addition of 139 new traps at the three West Mainland sites and 52 traps at the East Mainland site. These traps were placed along the coast in a double line to cover all land within 3-km of a stoat free island and inland 1-km from that point where land access was available. The East Mainland biosecurity traps were incorporated into the regular eradication network schedule when the full East Mainland Network was opened in July 2020 and the West Mainland biosecurity traps in December 2020.
Large scale trapping was scheduled for 2019 but was delayed due to a combination of issues encountered including securing access to land, delays in delivery of traps, and secondarily movement restrictions related to the COVID-19 pandemic. The issues with securing land access arose despite extensive consultation on a land access agreement process and a pilot trial of the process with over 100 landowners during the development phase before the project start. The main concern raised by landowners withholding access was the lack of similar financial support to reduce the growing population of breeding Greylag geese Anser anser on Orkney to reduce the extent of agricultural damage. COVID-19 both halted trap layout and checking entirely for a period and also restricted the efficiency of the project due to the need to follow COVID-19 safety procedures. South Ronaldsay traps have been in operation since September 2019. Opening of East Mainland traps began in March 2020, and was interrupted by COVID19 linked lockdown and was completed through June and July 2020. Opening of West Mainland began in December 2020 and was completed in early March 2021. The project has secured an extra year of funding to compensate for the impact of the COVID-19 pandemic.
The project has secured access agreements with over 750 landowners and tenants across the eradication area and neighboring high-risk islands. In 2021, traps cover just over 76% of the total eradication area, with the greatest coverage in East Mainland and the lowest in South Ronaldsay and the Linked Isles. Of the remaining 24% of land not covered by traps, 11.4% is in areas with trapping access that were deemed unsuitable for traps (e.g., sports fields and grass lawns or market gardens) and the remainder 12.6% are areas where the project does not currently have access to as of August 2021.
As of 07/04/2021, the eradication network consisted of 5,672 trapping locations of which most are double DOC200 traps, 783 single DOC200 traps and 264 GoodNature traps (humane, fully automatic, self-resetting traps powered by CO2 canisters, GoodNature, 2021).
The majority of GoodNature traps are deployed in upland or areas inhabited by bird species sensitive to disturbance in West Mainland because of their ability to reset after capture, they do not need to be controlled as frequently as DOC traps. Most single set traps are also deployed in upland or difficult to access areas because they are lighter.
According to the operational plan (Bambini et al., 2018), the target trap density should be 12 traps/km2, at a distance of c. 250 m from each other. Given the assumption that stoats in Orkney are at moderate to high densities and can therefore be expected to have small home ranges, such a trapping network should maximize the exposure of stoats to the traps (McMurtrie et al., 2011; Glen et al., 2017). As of April 2021, the mean trap density was 13 traps/km2 and the mean distance to the nearest trap was 196.3 m (95% CI: 192.3–200.2 m). As the traps were not evenly distributed, the mean distance to the nearest three traps was 247.8 m (95% CI: 242.6–253.0 m).
Stoat sightings have been recorded ad-hoc from 2010, with NatureScot recording and receiving sightings from members of the public. NatureScot still receives sightings and pass them on to the project but several other methods have since been used to collect sightings. These include the Facebook group “Stoats in Orkney,” direct email reporting, and the ONWP website with an interactive map and form for reporting stoat sightings. The time of sighting is reported to the nearest day where possible, otherwise a time range is specified. An accurate as the possible location is collected, as well as the number of stoats sighted, whether potential prey were present and other information on the behavior of the animal at the time. Records of both live and dead stoats are collected.
Models
We used two types of complementary models. First, we used a spatially explicit individual-based model to simulate and explore the likely efficacy of different trapping regimes under a variety of scenarios about stoat home range size, and pattern of use of home ranges and propensity to be exposed to capture therein, and by-catch rendering traps unavailable. These simulation models were not fitted to data; instead, we used existing data from other locations to define a plausible range of values of the parameters of these models and, subsequently, ran stochastic simulations of the models to understand how they behave given the input parameter values. The second type of models were Bayesian removal models fitted to the stoat trapping and sighting data collected during the eradication programme. These removal models were adjusted to the data to obtain stoat abundance estimates and evaluate the probability of capture and hence the number of stoats likely to have escaped capture as a function of the trapping effort. In an iterative fashion characteristic of AM, the estimates derived from the Bayesian removal models were used to narrow and improve the simulation models (Figure 2).
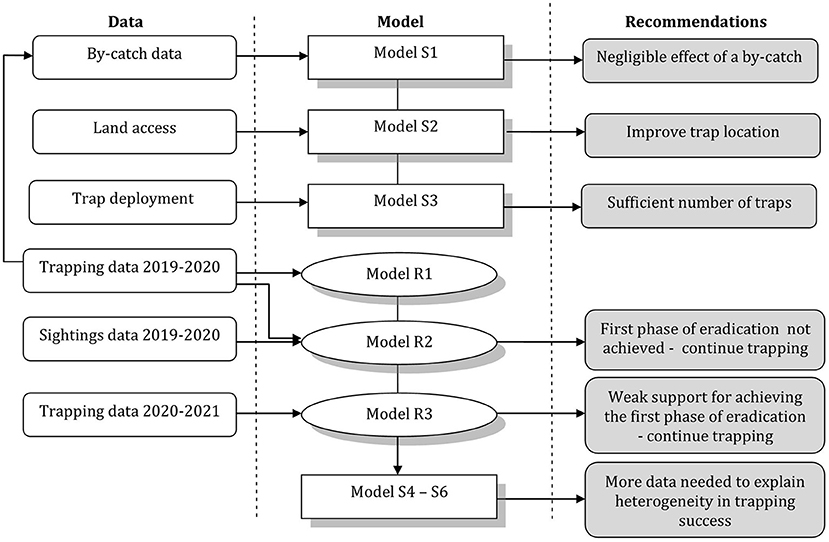
Figure 2. Chronology and relationships among used models.
Simulation Models
We used spatially explicit individual-based models to simulate the proportion of the population within the operational range of traps (referred to as exposure to trapping, for simplicity) given assumed home range sizes and then compared this with removal data, which allowed us to improve our predictions (Figure 2). Note that exposure to a trap does not imply being caught by the trap, and only reflects the probability of a stoat encountering the trap regardless of its willingness to enter the trap. Therefore, the simulation models help to evaluate and identify potential gaps in the trapping network, the effect of by-catch, trapping session length, and the impact of inaccessible areas on the trapping success. The intended milestone threshold stated in the ONWP operational plan for completing the first phase of the project (the knockdown phase) was 90% of the initial stoat population removed. Thus, our analyses aimed to assess if there was scope for this threshold to being achieved given our assumptions and how to improve the trap deployment to increase exposure to traps.
We initiated each simulation of our spatially explicit individual-based model with a varying number of stoats (Table 1) whose centers of activity (home range centers) were placed at random across all invaded Orkney islands. The probability of stoat n being exposed to trap p per trapping night during simulation s, PS,n,p, was modeled using a half-normal function:
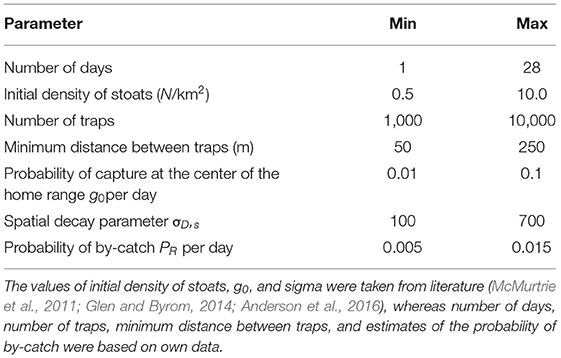
Table 1. Parameters used in simulation models.
where g0,s is the probability of being exposed at the stoat center of activity in simulation s, Dn,p,s was the distance (m) between each trap p and the center of activity of stoat n in simulation s, and ,s referred to as sigma hereafter, measures how the probability of being exposed scales with the home range size in simulation number s (Efford, 2004). The total probability of stoat n being exposed to capture, PE,n,s, given the number of traps deployed in simulation s, Ωs, the number of nights during which these traps were active in simulation s, Ks, and accounting for rat by-catch rates during simulation s, PR,s that makes traps unavailable to stoats was calculated as:
where PS,n,p was the probability of stoat n being exposed to trap p per trapping night in simulation s, PR,s was the nightly brown rat by-catch probability during simulation s, and Ks was the number of trapping nights in simulation s. The product in Equation (2) above applied over all the Ω traps deployed (i.e., multiplying the {1 – [PS,n,p(1 – PR,s)]} values of each trap deployed). To complete the model, we assumed that whether stoat n was exposed to the array of traps during simulation s, Cn,s (either 0 or 1 for no exposure or exposure, respectively) was drawn from a Bernoulli distribution:
At the first iteration, all model parameters were drawn from a wide range of uniformly distributed values, seasonally-, sex- and age-invariant, bounded by minimum and maximum values drawn from available information from literature and other systems (Table 1). We obtained values for sigma and g0 from Glen and Byrom (2014), a comprehensive review of stoat home range sizes and movement ecology. When more data on the trapping network and stoat captures became available, we updated our model parameters accordingly, e.g., imputing the initial densities based on the population density estimates obtained using removal models.
The key output of our simulation models was the number (and proportion of the initial population size) of stoats not exposed to capture by any trap. We also performed global sensitivity analyses to identify those model parameters with the largest effect on our model outputs. For this, we used a Gradient Boosting regression algorithm as implemented in the R package gbm (Ridgeway, 1999; Prowse et al., 2016). We trained each model using 10,000 iterations (trees) and estimated the importance of each variable by ranking them based on their relative influence on the model predictions. The relative influence scores of all variables add up to 100, and each variable receives a percentage based on its importance for the model predictions. The higher the relative influence scores, the highest the impact of the variable on the outcomes. To understand how the response variable changes based on the explanatory variables, we plotted the partial dependence plots. These plots show the average change in the predicted variable as a function of the target-dependent variable while holding all other variables constant (see Supplementary Materials for more details).
Our first iteration of the simulation model (Model S1) was based on a wide range of random uniform distributions of traps and stoats. Both traps and stoats were allowed to occupy the entire area, including areas where the project does not currently have access to. As the probability of by-catch of non-target species differs between ecological systems (e.g., due to different species composition or abundance), we defined the range of by-catch proportion as 95% confidence intervals of observed values from the initial trapping data (South Ronaldsay), to get estimates for the whole of the Orkneys. Although subsequent analyses revealed that the proportion of by-catch (mainly brown rats) in South Ronaldsay was much higher than in Mainland, we kept these initial values to ensure a more conservative approach.
In our second model iteration (Model S2), we restricted the locations of traps only to the areas where trapping was allowed (76% of the entire area as of August 2021), although their distribution was still random. This model enabled us to identify areas with likely higher densities of undetected stoats, mostly where access was restricted. Thus, in our next model iteration (Model S3), we used the real (improved) location of the traps instead of simulated ones since following our recommendations the project team deployed more traps along the borders of areas without trapping access.
Stoat Removal Models
The first year of large-scale trapping was restricted to South Ronaldsay (Figure 1) but it allowed us to produce estimates of the initial stoat densities. For our analyses, we also included data from biosecurity traps in the five areas on Mainland (Evie, Rendall, Kirkwall, Orphir, and Stromness). For this, we used data collected between 1 October 2019 and 22 March 2020 as trap checking and setting anew was postponed after this date due to COVID-19 restrictions. We assumed that during this period the stoat population could be treated as closed (no births and immigration or emigration). Initially, biosecurity traps were checked every 2–3 weeks and South Ronaldsay traps every 3 weeks, so there were 7–10 trapping sessions per site in 2019–2020 (Tables 2, 3). Trapping resumed in June 2020. To estimate the initial population size of stoats for East Mainland, we used trapping data collected between 1 October 2020 and 31 May 2021, and for West Mainland data collected between 1 January and 31 May 2021 due to delays to trap deployment. During 2020–2021, DOC traps were checked roughly every 3–4 weeks and, therefore, during this period were 10 trapping sessions for East Mainland and South Ronaldsay and 7 trapping sessions for West Mainland (Table 4).
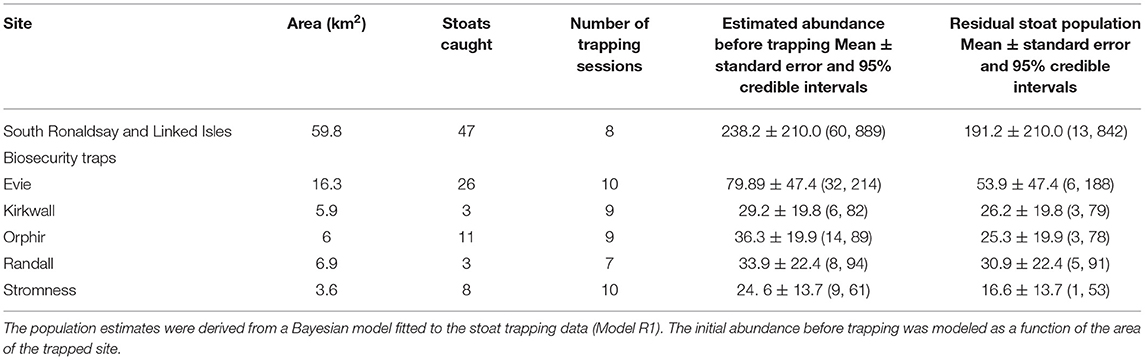
Table 2. The number of stoats captured and estimated stoat abundance before and after trapping (residual population) in six trapping sites in the Orkney archipelago, 2019–2020.
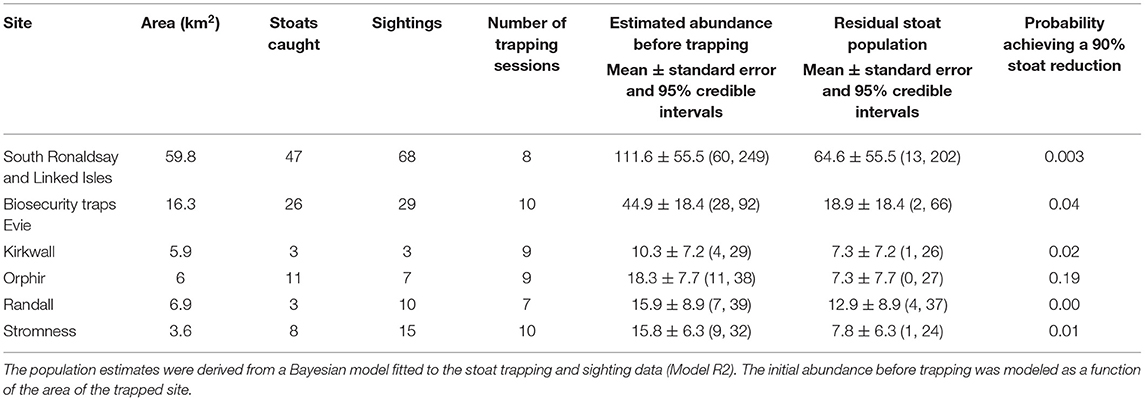
Table 3. The numbers of stoats captured, stoat sightings, and estimated stoat abundance before and after trapping (residual population) in six trapping sites in the Orkney archipelago, 2019–2020.
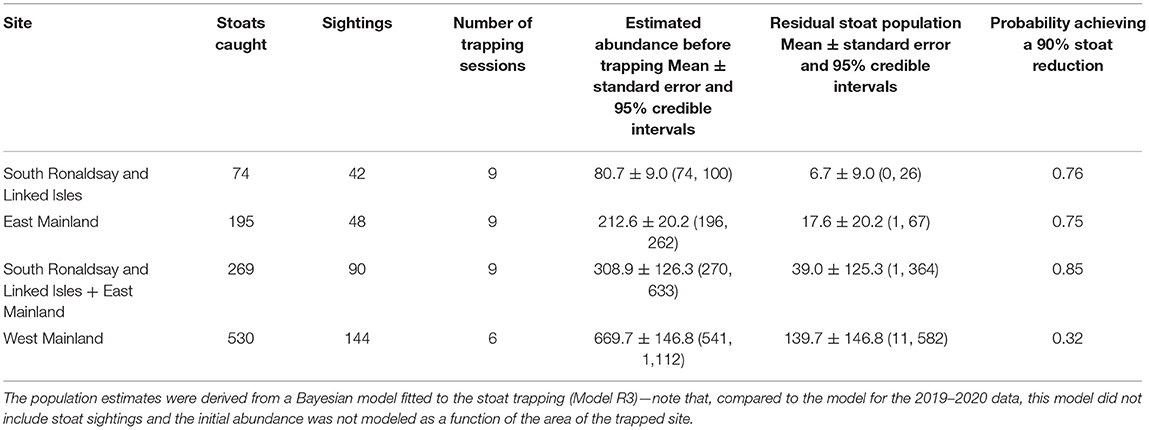
Table 4. The number of stoats captured and estimated stoat abundance before and after trapping (residual population) in three trapping sites in the Orkney archipelago, 2020–2021.
We analyzed the stoat trapping data using Bayesian removal models. We analyzed the 2019–2020 and the 2020–2021 data separately rather than combining all the data. Ideally, our models would have linked the two periods via a dynamic component (e.g., population growth). However, this was not possible because there was scant overlap in the trapping coverage between the two periods and because there was only 2 years' worth of data. For example, it was possible to model the stoat abundance in the period 2019–2020 as a function of the area of the trapped sites, given that there were six sites and no previous trapping history. Conversely, this was not feasible for the 2020–2021 data because there were three sites trapped, and some of them had been subject to trapping in the previous period and, therefore, their abundance would have been influenced by factors other than the area. In summary, these conditions make it unfeasible to parameterize a dynamic model adequately—at least for now. Additionally, the structure of the removal models was slightly different for the 2019–2020 data than for the 2020–2021 data to account for the different data availability. Our removal models are described below.
Removal Model 2019–2020 Trapping and Sighting Data (Model R1 and Model R2)
Six sites were trapped in the period 2019–2020 (Table 2), and sighting data were available for these sites. For the first removals model (Model R1), we used only trapping data modeled as the function of the area, whereas for the second model (Model R2) we modeled trapping and sightings together. Starting with the trapping data, the number of stoats present in each site j at the start of the trapping operation, just before the first trapping occasion, i = 1, Nj,i=1, was modeled as a function of the area of that site via a Poisson-log regression:
where λj were the means and variances of the stoat abundance in each site j, α1 was the intercept of the Poisson-log regression linking the stoat abundance to the area of the site j, β1 was the slope of the log10-transformed area of the site on the stoat abundance, and Aj was the area (km2) of each site trapped. We bounded Nj,i=1 to the equivalent of a maximum of 20 stoats/km2 (i.e., 20 Aj) so the model only explored realistic values. This upper bound is an acceptable constraint, since stoat densities do not reach such a high value (Clayton et al., 2011). The number of stoats caught in each site j and trapping occasion i, y j,i was modeled as:
where Nj,i was the abundance just before the commencement of trapping occasion i and, therefore, is the number of stoats available to be captured during that occasion, pj,i was the probability of capture during the trapping occasion, and Xj,i=1→i was the cumulative number of stoats caught and removed just before the start of trapping occasion i. The probability of capture, pj,i, was modeled as a function of the trapping effort deployed during that trapping occasion, Eji, via a logit link:
where α2 was the intercept of the logit model, β2 was the effect of the trapping effort on the probability of capture, Ej,i was the trapping effort in each site and occasion, and was the variance of the probability of capture on the logit scale. The latter component was included to accommodate the extra heterogeneity in the probability of capture that was not accounted for by the trapping effort. The number of stoat sightings in each of the six j sites, Oj, was modeled as a random variable drawn from a Poisson distribution:
where Nj,i=1 was the initial stoat abundance in each site j, derived from the expressions above, and ϕ was a scaling parameter that can only take positive values. This model implies that the number of sightings is proportional to the actual stoat abundance in each site, such that observation and reporting efforts are constant. Since each stoat can be observed more than once or, alternately, some stoats can be spotted multiple times whilst others are never observed, we included the parameter ϕ to account for the relationship between the true abundance and sightings. Values of ϕ below one indicate that there were fewer sightings than stoats, whereas values above one suggest more sightings than stoats. A ϕ estimate of one implies that there was approximately the same number of sightings and stoats. Note that this does not mean that each stoat was observed once, only that there were as many sightings as there were stoats. This model of stoat sightings serves to convert citizen-science data into estimates of stoat abundance, which is potentially helpful as a complementary method for monitoring stoat abundance.
Removal Model 2020–2021 Trapping Data (Model R3)
Three sites were trapped in the period 2020–2021 (Table 3)—South Ronaldsay, East Mainland, West Mainland. In this case, we did not use the sighting data to model stoat abundance as the trapping history and trapping time varied among these areas. Our model was similar to those presented above but includes a few changes to adapt to the available data. The number of stoats present in each of the three sites z at the start of the trapping operation, just before the first trapping occasion, t = 1, NR,z,t=1, was modeled as a stochastic variable drawn from a Poisson distribution:
where λR,z were the means and variances of the stoat abundance in each site z. Given that this model did not include the area of each site as a covariate, we instead bounded NR,z,t=1 to the equivalent of a maximum of 20 times the number of stoats caught so the model only explored sensible values. None of the posterior distributions of the estimated abundances reached this bound (Table 3), showing that it had no significant impact on our modeling. The number of stoats caught in each site z and trapping occasion t, y R,z,t was modeled as:
where NR,z,t was the abundance just before the commencement of trapping occasion t, pR,z,t was the probability of capture during the trapping occasion, and XR,z,t=1→t was the cumulative number of stoats caught and removed. The probability of capture, pR,z,t, was modeled as a function of the trapping effort, ER,z,t:
where α3 was the intercept, β3 was the effect of the trapping effort on the probability of capture, ER,z,t was the trapping effort in each site and occasion, and was the variance of the probability of capture on the logit scale.
We fitted the removal models to the stoat data using Bayesian Markov Chain Monte Carlo methods as implemented in package Nimble for the R statistical environment (de Valpine et al., 2017). We used three chains with 500,000 iterations each, without thinning, and discarded the first 10,000 iterations of each chain. Following these settings, we obtained 1,470,000 posterior iterations of each parameter of each of our models. Furthermore, we confirmed that the chains had converged and mixed adequately by visually assessing trace plots and calculating the Gelman-Rubin diagnostic (Hobbs and Hooten, 2015). We used relatively uninformative Normal priors for all the intercepts, αw, and slopes of the models βw, ~Normal (0, variance = 10). Likewise, we used uninformative uniform priors for the parameters ϕ and λR,z, ~uniform (0.001, 20) and uniform (1, 500), respectively.
We assessed the fit of our models to the stoat data by estimating Bayesian p-values for the number of stoats caught in each site and occasion (2019–2020 and 2020–2021 models) and the number of sightings per site (2019–2020). Bayesian p-values compare the score of a goodness-of-fit test, the Freeman-Tukey test in our case, obtained from the fitted model to the score expected if the model adequately represents the data (Hobbs and Hooten, 2015; Conn et al., 2018). If the Bayesian p-values fall within the 0.05–0.95 interval, it is commonly considered that the model fits the data adequately (Kéry and Royle, 2016).
We estimated two additional diagnostic tests to confirm that our models reflected the data adequately (Dietze, 2017). First, we used the R2 score described by Dietze (2017) to assess whether there were deviations from the 1:1 line; this is the line of a perfect relationship between predicted and observed number of captures. The closer to 1 is the model's R2 score, the better. Finally, for each model, we also estimated the ratio of the standard deviations of the model predictions and the data, SD (model)/SD (data). Values close to 1 indicate that the model is adequately replicating the variance in the data; values below 1 suggest that the model is underestimating the variance in the data, and values above 1 indicate that the model is overestimating the variance in the data. Both the R2 scores and the ratios of the standard deviations were estimated for each of the 1,470,000 posterior iterations.
Based on these Bayesian removal models, we estimated whether the number of stoats caught was equal to or >90% of the initial (at the start of that trapping session) population size estimated by the model. We estimated the probability of having achieved a 90% stoat reduction as the proportion of posterior iterations in which that threshold was reached.
Simulation Model (Model S4)
The stoat abundance estimates obtained from the remodeled models for the second trapping season were used to update our simulation model. We used the 95% confidence intervals of the abundance estimates as minimum and maximum values for initial stoat densities. This revised model allowed us not only to assess the likely proportion of stoats not exposed to capture but again to identify their spatial distribution, which was the basis for our recommendations on trap deployment for the project team.
As food resources in Orkney are relatively high and stable it was appropriate to assume that stoats maintain smaller home ranges (Cuthbert and Sommer, 2002; Veale et al., 2015; Anderson et al., 2016). Following this, we modified Model S4 by changing the values of sigma (Model S5). In the next model we allowed for the stoats to move before interacting with traps (Model S6). To simulate stoat movement, we used an algorithm implemented in the package SIMRiv (Quaglietta and Porto, 2019) which allows for simulating individual-based, spatially-explicit movements, using a wide range of parameters. Based on our previous experiences with radio-tracked weasels and stoats (KZ, pers. obs.), we assumed that dispersing/migrating individuals move in a nearly straight line. Thus, we used the directional movement of the individuals by setting values of the Correlated Random Walk between 0.95 and 0.99, which means that the direction taken in one step is highly correlated with the direction of the previous step. The values for the step length were between 100 and 300 m, and for the perceptual range between 100 and 500. The resistance value was 1 for the surrounding sea and 0 for the land, which means that animals could move freely on the land regardless of the habitat type but couldn't cross the waters surrounding the island.
The results of our simulation models are presented as a means of the proportion of the initial population size of 10,000 replicates along with 95% confidence intervals.
All analyses were performed using R (R Core Team, 2020), and our scripts are publicly available from GitHub.
Results
The first iteration of the simulation model (Model S1), assuming a random uniform distribution of traps and stoats across the entire invaded area, indicated that on average 99.7% (95% Credible Intervals: [99.6, 99.8%]) of stoats were exposed to capture during one trapping session, which corresponds to seven individuals not exposed to traps on average (95% CI: [5, 10]). These stoats were scattered randomly across the entire area (Figure 3A). Our sensitivity analysis revealed that there were two most influential variables affecting the predictions of the model—the number of traps and the sigma parameter, with relative influence scores of 61.6 and 36.6%, respectively. Moreover, our inspection of the partial dependence plots revealed that when the number of traps exceeded c. 5,000, the proportion of exposed stoats approached 100%. These results serve as a reference point for subsequent models and provide an estimate of the likely minimum number of traps necessary to complete the eradication under ideal conditions.
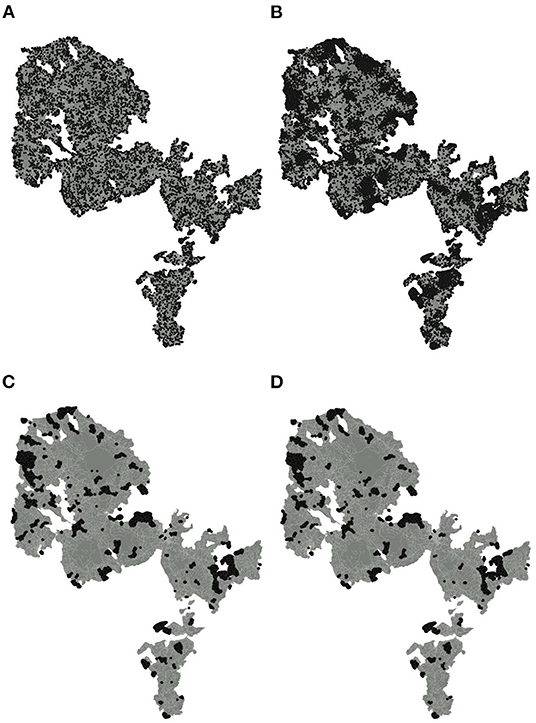
Figure 3. Distribution of undetected stoats (based on 1,000 repetitions) according to Model S1 (A), Model S2 (B), Model S3 (C), and Model S4 (D).
When the distribution of traps was restricted to the areas with trapping access (Model S2), the proportion of stoats exposed to capture was on average 98.8% (95% CI: [98.6, 99.1%]), which corresponds to on average 34 not exposed individuals across the entire area (95% CI: [27, 41] individuals). In this case, the distribution of not exposed stoats was clustered and mostly restricted to the areas without access (Figure 3B). Again, as revealed by the sensitivity analysis, only two explanatory variables were most influential in this model but this time the relative importance of the sigma parameter was higher (59.6%) than the number of traps (39.5%). Our simulations also revealed that there was a possibility to increase the probability of stoats being exposed to capture by adding more traps along the borders of the areas where access for trapping was denied.
By April 2021, over 90% of the 10,000 DOC200 traps and 265 GoodNature traps had been deployed at 5,672 locations with increased density following our recommendations. Therefore, in our next model, we used the actual distribution of traps instead of simulated ones. This iteration of the simulation model (Model S3) provided estimates significantly higher than the second model but lower than the first (the mean proportion of stoats exposed to capture was 99.2%, 95% CI: [99.1, 99.3%]), which corresponds to the mean number of not exposed stoat N = 23 individuals (95% CI: [21, 27] individuals). As in this model we used a fixed number of traps, the only influential explanatory variable was the sigma parameter with a relative importance of 95.2%. The distribution of not exposed stoats was more clustered and restricted to fewer locations as in the case of the second iteration (Figure 3C). This model indicated that the majority of stoats were within the range of used trap network.
The cumulative number of stoats caught as of 31 May 2021 was 1,401 individuals, including 98 stoats captured between 1 October 2019 and 20 March 2020 and 847 stoats captured between 1 October 2020 and 31 May 2021. These data were used to fit removal models, separately for seasons 2019–2020 (Model R1 and Model R2) and 2020–2021 (Model R3). As of August 2021, almost 6,000 sightings have been collected. The number of sightings increased between 2010 and 2018 (when almost 1,500 sightings were recorded) and then started to decrease (with only 238 sightings between January and August 2021, Orkney Native Wildlife Project, 2021).
The first removal mode1 (Model R1) fitted the data adequately, as indicated by the Bayesian p-values (captures: 0.48), the R2 scores (captures: mean: 0.69, 95% CI: [0.51, 0.83]), and the standard deviation ratio (captures: 0.92; 95% CI: [0.67, 1.21]). This model was characterized by very wide credible intervals of the abundance estimates and a high proportion of residual stoat population (Table 2).
In the second removal model (Model R2), we integrated trapping and sightings data (Table 3). This model also fitted the data adequately, as indicated by the Bayesian p-values (sightings: 0.49; captures: 0.50), the R2 scores (sightings: mean: 0.95; 95% CI: [0.87, 0.98]; captures: 0.71; 95% CI: [0.53, 0.84]), and the standard deviation ratio (sightings: mean: 0.98; 95% CI [0.75, 1.25]; captures: 0.94; 95% CI: [0.69, 1.21]) but resulted in much lower abundance estimates both before trapping (roughly two times lower) and after trapping (roughly three times lower) when compared with Model R1 (Figure 4; Table 2).
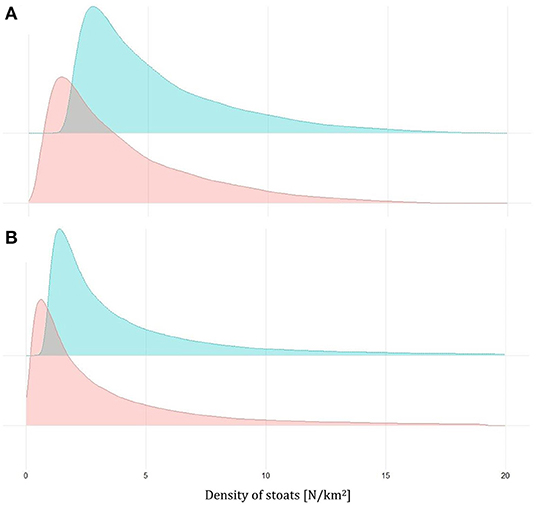
Figure 4. Density plots for the estimates of the density of stoats before (green) and after (red) the trapping based on the removal model for Biosecurity traps (A) and South Ronaldsay (B) in 2019–2020.
The third removal model (Model R3) also fitted the data adequately, as indicated by the Bayesian p-values (captures: 0.48), the R2 score (mean: 0.99; 95% CI: [0.97, 0.99]), and the standard deviation ratio (captures: 0.99; 95% CI: [0.93, 1.06]) (Figure 5; Table 4). The estimates of this model were more precise than for 2019–2020 data, except West Mainland, where stoats were trapped only between 1 January and 31 May 2021 (Figure 5). In 2020–2021 the number of sightings in the three analyzed areas well corresponded with the number of captured stoats (Pearson's r, r = 0.98, Table 4) but we did not fit the model to this data (see Materials and Methods for details).
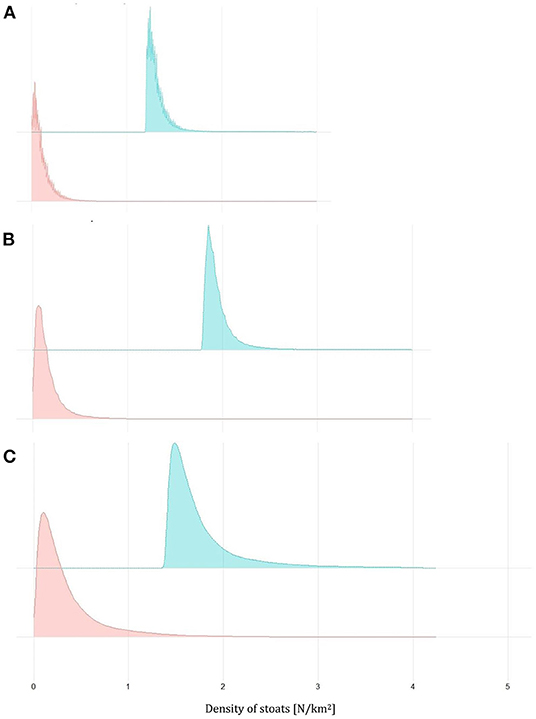
Figure 5. Density plots for the estimates of the density of stoats before (green) and after (red) the trapping based on the removal model for South Ronaldsay (A), East Mainland (B), and West Mainland (C) in 2020–2021.
Our estimates of the probabilities of having achieved a 90% reduction relative to the start of each trapping session, were extremely low for 2019–2020 (Table 3), whereas for 2020–2021 our estimates were relatively high for South Ronaldsay and East Mainland (0.76 and 0.75, respectively; Table 4) but much lower for West Mainland (0.32; Table 4). When South Ronaldsay and East Mainland were analyzed jointly, the probability of achieving the assumed stoat reduction was rather high though not a certainty (0.85, Table 4).
In the next iteration of our simulation model (Model S4), we adjusted the initial stoat abundances according to the estimates obtained from the removal model for the 2020–2021 period. The proportion of stoats exposed to capture during one trapping session predicted by Model S4 was very similar to the third iteration and averaged 99.2% (95% CI: [99.1, 99.3%]) whereas the mean estimated number of not exposed stoats was proportionately lower (N = 13 individuals, 95% CI: [11, 15]). The locations of not exposed stoats were aggregated within the areas without trapping access (Figure 3D). Our sensitivity analyses of this updated model revealed that the relative importance of the parameters other than sigma was close to 1%. This also includes the probability of a by-catch per a trap-day despite the number of captured brown rats across Orkney being on average three times higher than the number of captured stoats (two times higher in West Mainland and 10 times higher in South Ronaldsay in 2020–2021). The highest by-catch was recorded in 2019–2020 in South Ronaldsay when there were 1094 brown rats and only 47 stoats captured, but this high proportion of by-catch was offset by a large number of traps checked frequently. The biosecurity traps in 2019–2020 had the lowest proportion of by-catch as the number of captured stoats was higher than the number of brown rats.
The estimated proportion of the stoat population removed in 2020–2021 revealed by the removal models was below the proportion of stoats exposed to capture as predicted by the simulation model. Thus, we attempted to identify the possible sources of discrepancy between observations and predictions by changing the parameters of the model to see if we can recover, in simulations, the observed outcome of stoat trapping. First, we repeated the simulation model Model S4 (with known number and distribution of traps and initial densities of stoats adjusted according to the removal model) for South Ronaldsay only as we had the most complete data set for this area. This model revealed that the mean proportion of stoats exposed to capture during one trapping session was 99.1% (95% CI: [98.9, 99.3 %]) whereas the mean estimated number of not exposed stoats was N = 0.8 individuals, 95% CI: [0.6, 0.9]).
In the next iteration of the simulation model (Model S5), we reduced the range of sigma values that reflects stoat home range size. In the range of 50–200 m, the mean proportion of stoats exposed to capture decreased to 82.5% (95% CI: [81.6, 84.4%]), commensurate with the range of estimates provided by the removal model (Model R3, 83.0% on average). The mean number of not exposed stoats was N = 15 individuals (95% CI: [14, 16] individuals). The distribution of exposed stoats was quite uniform thus different from observed (Figure 5). We also attempted to adjust the probability of exposure to capture at the center of the home range (parameter g0). In the range of g0, between 0.001 and 0.01, thus extremely low, the mean proportion of stoats exposed to traps was still very high 97.9% (95% CI: [97.6, 98.3%]), most likely offset by a wide range of sigma parameter, which is more influential.
When we examined the spatial distribution of stoat captures on South Ronaldsay, we noticed that almost 80% of them were in a relatively narrow belt (around 500 m) along the coast, which might indicate that these were mostly dispersing/migrating individuals. To simulate the dispersal process, we modified the simulation model once more and allowed for randomly distributed stoats to move before interacting with traps. All other parameters were as in the previous model (Model S5). According to this simulation model (Model S6), the proportion of stoats exposed to capture averaged 83.3% (95% CI: [82.0, 84.7%]) and this corresponds to the mean number of not exposed stoat N = 14 individuals (95% CI: [13, 15 individuals]). These estimates were very similar both to the previous iteration of the simulation model (Model S5) and the removal model (Model R3, Table 4) but this time the distribution of exposed stoats was more concentrated along the coast (Figure 6).
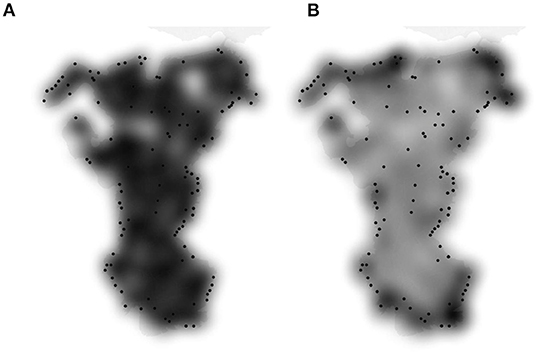
Figure 6. Distribution (visualized as a heat-map) of trapped stoat according to simulation models based on stationary individuals (Model S5, A) and stoat movement prior to interacting with traps (Model S6, B). Black dots—actual distribution of trapped stoats as of 21.06.2021.
Discussion
Quantitative models play an important role in informing the eradication of invasive species and have a large range of applications (Baker and Bode, 2021). In the case of the Orkney Islands, we used them to inform decision-making at the project level. Specifically, we sought to quantify the likelihood that a critical milestone of the knockout phase of the project, laid out in the ONWP operational plan had been met, namely that 90% of the initial stoat population had been removed. As our removal models were applied to the autumn-winter period only by the initial stoat population we mean the number of stoats at the start of each trapping session, thus at the beginning of October. We did this by combining simulation “what if” simulation models and Bayesian removal models fitted to data from various spatial subsets of the first 2 years of this 5-year project.
Our analyses showed limited support for the expected magnitude of the initial knockdown phase having been completed after the first year. The probability of achieving the 90% reduction of the stoat population that would trigger the follow-on “mop-up phase” was extremely low for 2019–2020 but much closer to this threshold for 2020–2021. In 2019–2020, when only a small part of the islands was available for trapping, stoats from neighboring areas were able to replace the removed individuals. In 2020–2021, the situation improved but still a large part (West Mainland) had been trapped for only a short time, causing again asynchronous removal at the beginning of this trapping period. Although it has been possible to eradicate stoats within the first year of trapping on smaller islands (e.g., in Fiordland, New Zealand; Clout and Russel, 2006), it usually takes several years to reach completion when the size of the area is large (Crouchley, 1994; McMurtrie et al., 2011). The largest islands in New Zealand were stoats were successfully eradicated by trapping were Coal Island (1,622 ha) and Anchor Island (1,525 ha) (King and Veale, 2020), whereas attempts to eradicate stoats from all larger islands in New Zealand have been unsuccessful (e.g., Secretary Island—8,140 ha and Resolution Island—21,300 ha, Veale et al., 2013; King and Veale, 2020). In most attempts several reinvasions by stoats were observed even before eradication had been completed. Therefore, considering the large spatial scale of the Orkney eradication project, it is very likely that at least one more period of intensive trapping in 2022 will be necessary to complete the knockdown phase for the entire area. Moreover, many attempts to eradicate stoats in New Zealand were accompanied by simultaneous aerial or hand-sewn Brodifacoum deployment (anticoagulant poison used to control rodents but also larger pests as stoats) and poisoning of all the rodents on islands (King and Veale, 2020). These are not management options in an inhabited island archipelago in the UK. Collectively, our results and previous experiences elsewhere indicate that the probability of completing the first phase of the Orkney eradication programme by trapping only might be low and will likely require the use of other methods such as detection dogs.
While the proportion of landowners giving access to trappers is increasing, there will remain a substantial proportion of those who deny access. To improve trapping success in the scenario when not all area is available for trapping, we recommended adjustments of the trap deployment and placing them along the borders and, if possible, on roadsides/shorelines within the otherwise inaccessible areas. This should increase the probability of finishing the knock-down phase of the project after the next trapping period. However, our models suggest this is most likely if a relatively large sigma value reflects the (unknown) biological reality. When food resources allow it, stoats are able to maintain very small home ranges (Cuthbert and Sommer, 2002; Veale et al., 2015) and the probability of capture is then low (King et al., 2003). Moreover, as was the case in all previous stoat eradication attempts (Efford et al., 2009), the mismatch between our simulation and removal models imply there are also trap-shy individuals characterized by a much lower probability of capture given they are the exposure to traps. Therefore, even if the dispersing offspring of those stoats not exposed to capture might eventually reach the traps on the edge of no-access areas, the presence of refuges with no trapping will make the eradication less likely and fuel reinvasion. However, the size of inaccessible blocks will be more important than the proportion of the total area they encompass (Glen et al., 2017).
There are various plausible sources of discrepancies between expectations on the proportion of the stoat exposed to capture based on the simulation models and results obtained from the removal models fitted to the stoat trapping data. The estimates from the simulation models were usually much higher as they are based on a wide range of uniformly distributed parameters. The sensitivity analyses revealed that only two parameters (number of traps and sigma) have a major effect on the simulation model estimates. The number of used traps was far above the threshold required to achieve nearly 100% exposure. The trap spacing is also sufficiently small to leave most stoats exposed to capture, providing some resilience to a large number of landowners lawfully denying access to trapping, something that was not expected based on the extensive consultation on a land access agreement process performed during project development.
To reflect the real proportion of detected and removed stoat population, the second most influential parameter—sigma, had been set to values compatible with lower bound of home range size estimates found in the literature (Efford et al., 2009; Clayton et al., 2011; Glen and Byrom, 2014). Unfortunately, no study of stoat ranging behavior has been performed in areas such as Orkney archipelago with two abundant rodent prey species (Orkney vole and brown rat) as well as rabbits Oryctolagus cuniculus (Fraser et al., 2015), which are all within the optimal prey size range for stoats (McDonald et al., 2000; Sidorovich and Solovej, 2007). In New Zealand, the availability of prey for stoats could be similar but only in seed masting-fuelled rodent outbreak years (Jones et al., 2011), whereas Orkney archipelago offers an almost constantly high abundance of food items, which could vary only seasonally (Fraser et al., 2015). Thus, we cannot rule out the possibility that the home ranges of stoats in Orkney are proportionally smaller due to the high availability of potential prey, although the maximum estimates of the density of stoat population based on the removal model (Model R3) are within the range reported for other locations. The effect of the second unknown parameter—g0 was much weaker on the estimates produced by the simulation models, particularly when a wide range of values for the sigma parameter was used. In the future, to improve the precision of the simulation model estimates and better reflect the interactions between traps and stoats, the sigma and g0 parameters should be taken from distributions which are sex, age or season-specific and ideally empirically derived. This requires additional data, e.g., on sex ratio and the age structure of the stoat population, which can be retrieved from the trapping records.
The estimates of the proportion of stoats removed provided by the simulation models could be also inflated due to an unknown proportion of stoats being reluctant to enter the traps they encounter, even in the center of their home range, as the models above do not account for the possibility that a fraction of the population is inherently or temporarily trap-shy. Information about the proportion of hypothetical “not-trappable” stoats will be crucial as the population declines to very low density and the number of newly culled animals will become very small. The fact that stoat detections can increase by up to four-fold with the addition of predator odor to traps that increase inquisitiveness by stoats suggests that the proportion of stoats which are reluctant to enter the traps could be as high as 40% (Garvey et al., 2020). In Ireland, stoats were detected on the external camera passing Mostela traps (baited with rabbit lure) but not entering them at 17% of sites (Croose et al., 2021). The Mostela trap is a modified camera trapping device comprising a camera trap and a tracking tunnel inside a wooden box (Mos and Hofmeester, 2020). On the other hand, in experiments on the behavioral response of stoats to trapping tunnels, almost 90% of individuals entered the open-end tunnel on their first approach and all of the animals had entered by their fourth approach (Brown, 2001). Therefore, the proportion of stoats avoiding traps should initially decline due to habituation but then may increase because of selection favoring “trap-shy” individuals.
As the statistical models are only as good as the provided data, more data are required to refine our models and increase the precision of estimates. Collecting certain types of informative data would require dedicated research effort (e.g., home range size and dispersal distance of stoats) but other important information could be obtained using indirect methods already deployed as part of ongoing management, e.g., camera-traps or detection dogs (for instance on habitat preferences or the proportion of the trap-shy individuals). Camera traps and wildlife detection dogs are increasingly being used to monitor populations of invasive species (Glen et al., 2016; Glen and Veltman, 2018).
The role of dispersal and immigration as a fundamental process underpinning population dynamic of mammals are often ignored but should be considered when using spatially explicit population models (Millon et al., 2019). Thus, another plausible explanation for the observed heterogeneity in the distribution of captures could be stoat movement buffering a large population from local extinction (Holyoak and Lawler, 1996). Small mustelids can cover long distances moving in one direction when in the dispersal phase and this behavior could be well described by a correlated random walk (Brandt and Lambin, 2007; McDevitt et al., 2013). When on the move, they most likely only interact with traps close to their path, hence the use of very small values of the sigma parameter to reproduce their movement is well justified (KZ, pers. obs.). Accordingly, dynamic models including reproduction and dispersal could better capture the nature of stoat behavior and predict the spatial distribution of stoat captures (at least in the case of islands), which in turn can be used to increase the probability of being exposed to traps and the trapping success.
Another source of spatial heterogeneity in trapping success could be that stoats, like other predators, stoats have habitat preferences that may be reflect the seasonal availability of the preferred prey (Jones et al., 2011; Oppel et al., 2014). Documenting differential habitat use and its impact on stoat eradication calls for more data. Our brief examination of the seasonal patterns in stoat captures provides some support for the notion that there is some shift in their distribution during winter. This in turn may inflate our estimates of the resident stoat population left after trapping as the closure assumption is violated due to animal movements.
Conclusions
The expected reduction of the stoat population based on the simulation models differed significantly from the estimated residual number of stoats left after trapping based on Bayesian removal models fitted to the real data. Our estimates derived from our spatially explicit individual-based models were most likely inflated because the simulated exposure is not equal to the willingness to enter the trap. Thus, the number of not trapped stoats will scale with the proportion of trap-shy individuals in the population. On the other hand, the residual population of stoats after trapping could be smaller because our estimates are biased due to high mobility of these predators. Thus, the discrepancies between the simulation models and models based on the real data might be much smaller than reported.
Despite the fact that our analyses do not support the achievement of a 90% reduction in the stoat population after the first year of trapping, we provided abundant useful information for the project, e.g., confirming that the current deployment of traps is sufficient to expose most stoats to capture even if the entire area is not accessible for trapping. Our integrated removal-sightings model revealed that the reported sightings are not only part of the local community engagement in the project but also provide valuable information that can be used in our modeling approach. We expect that the importance of stoat sightings provided by the public will further increase as the project moves to the mop-up phase as sightings improved the estimates obtained from the Bayesian models when the population density of stoats is low. Further support for the eradication process also requires the application of dynamic models accounting for the reproduction and dispersal of stoats. This type of modeling calls for additional data to parameterise the models, and sightings could be used to predict potential ways of reinvasion after the initial reduction in stoat numbers.
The Orkney Native Wildlife Project embraced a very demanding aim to achieve archipelago-wide stoat eradication. As it tries to tackle the challenges of a potentially not trappable fraction common to mustelids (Craik, 2008) and unexpected difficulties in securing the necessary land access that reflects a separate, no less complex wildlife management issue linked to the rapidly growing greylag geese population, it overcame all initial problems typical of attempts to manage invasive species and is work in progress. Through embracing a formal AM approach, including the iterative evaluation of model-based representation of the system, it continues with eyes wide open.
Data Availability Statement
The scripts presented in this study can be found in online repositories. The names of the repository/repositories and accession number(s) can be found below: https://github.com/karolzub/Stoat-in-Orkney. The datasets are owned by Orkney Native Wildlife Project and can be accessed when permitted by the owner.
Ethics Statement
Ethical review and approval was not required for the animal study because the project involves the capture and removal of stoat by the staff employed by project partners, volunteers, and fellows. Following detailed discussions with inspectors enforcing the UK Home Office and the Animal (Scientific Procedures). Act 1986, it has been established that these procedures do not require a license from the Home Office because animals are dispatched humanely upon capture for the purpose of conservation and only subsequently used for research. All other field techniques are non-invasive and do not require a license from the Home Office or approval by an Ethical Review Committee.
Author Contributions
KZ, PG-D, and XL conceived the ideas, designed methodology, and led the writing of the manuscript. SS and RE provided and prepared the data. KZ and PG-D analysed the data. All authors contributed critically to the drafts and gave final approval for publication.
Funding
For the analyses reported in this paper study, KZ was financed by the Bekker programme of the Polish National Agency for Academic Exchange (NAWA), grant PPN/BEK/2019/1/00036 to KZ. PG-D and XL were supported in part by the NERC grant (NE/S011641/1). The ONWP funders: National Lottery Heritage Fund, EU life programme (LIFE17 UK/NAT/000557), Nature Scot and RSPB.
Conflict of Interest
The authors declare that the research was conducted in the absence of any commercial or financial relationships that could be construed as a potential conflict of interest.
Publisher's Note
All claims expressed in this article are solely those of the authors and do not necessarily represent those of their affiliated organizations, or those of the publisher, the editors and the reviewers. Any product that may be evaluated in this article, or claim that may be made by its manufacturer, is not guaranteed or endorsed by the publisher.
Acknowledgments
We would like to acknowledge all the ONWP staff and volunteers who have collected and facilitated the collection of data, all the landowners on Orkney who have generously given access to their land, the ONWP steering group members (Graham Neville and Daniel Brazier, NatureScot; Susan Shearer and Stuart West, Orkney Islands Council and Kirsty Nutt and Leigh Lock, RSPB) and the Technical Advisory Group (Peter Robertson, Newcastle University; Robbie Macdonald, University of Exeter; Des Thompson, NatureScot; Tony Martin, University of Dundee; Lindsay Waddell, National Gamekeepers' Organization; Karen Varnham, RSPB; Grant Harper, Biodiversity Restoration; Angela Newport, Conservation Dog specialist).
Supplementary Material
The Supplementary Material for this article can be found online at: https://www.frontiersin.org/articles/10.3389/fcosc.2021.780102/full#supplementary-material
References
Anderson, D. P., McMurtrie, P., Edge, K. A., Baxter, P. W. J., and Byrom, A. E. (2016). Inferential and forward projection modeling to evaluate options for controlling invasive mammals on islands. Ecol. Appl. 26, 2548–2559. doi: 10.1002/eap.1415
Arts, K., Melero, Y., Webster, G., Sharma, N., Tintarev, N., Tait, E., et al. (2020). On the merits and pitfalls of introducing a digital platform to aid conservation management: volunteer data submission and the mediating role of volunteer coordinators. J. Environ. Manage. 265:110497. doi: 10.1016/j.jenvman.2020.110497
Baker, C. M., and Bode, M. (2021). Recent advances of quantitative modeling to support invasive species eradication on islands. Conserv. Sci. Pract. 3:e246. doi: 10.1111/csp2.246
Bambini, L., Sankey, S., and Neville, G. (2018). Orkney Native Wildlife Project: Stoat Eradication Operational Plan. RSPB Scotland unpublished report. P. 79.
Brandt, M. J., and Lambin, X. (2007). Movement patterns of a specialist predator, the weasel Mustela nivalis exploiting asynchronous cyclic field vole Microtus agrestis populations. Acta Theriol. 52, 13–25. doi: 10.1007/BF03194195
Brown, S. (2001). The Behavioural Responses of Stoats (Mustela erminea) to Trapping Tunnels. MSc Thesis, Lincoln University.
Bryce, R., Oliver, M. K., Davies, L., Gray, H., Urquhart, J., and Lambin, X. (2011). Turning back the tide of American mink invasion at an unprecedented scale through community participation and adaptive management. Biol. Conserv. 144, 575–583. doi: 10.1016/j.biocon.2010.10.013
Clayton, R. I., Anderson, D., Byrom, A., Edge, K.-A., McMurtrie, P. M., Veale, A., et al. (2011). “Using genetic analysis and trapping data to model the probability of persistence of feral stoats (Mustela erminea) on Resolution Island, New Zealand,” in Island Invasives: Eradication and Management, eds C. R.Veitch, M. N. Clout, and D. R. Towns (Gland: IUCN), 413–417.
Clout, M. N., and Russel, J. C. (2006). “The eradication of mammals from New Zealand islands,” in Assessment and Control of Biological Invasion Risks, eds F. Koike, M. N. Clou, M. Kawamichi, M. De Poorter, and K. Iwatsuki (Kyoto: Shoukadoh Book Sellers; Gland: IUCN), 127–141.
Conn, P., Johnson, D., Williams, P., Melin, S., and Hooten, M. (2018). A guide to Bayesian model checking for ecologists. Ecol. Appl. 88, 526–542. doi: 10.1002/ecm.1314
Cowled, B. D., Aldenhoven, J., Odeh, I. O. A., Garrett, T., Moran, C., and Lapidge, S. J. (2008). Feral pig population structuring in the rangelands of eastern Australia: applications for designing adaptive management units. Cons. Gen. 9, 211–224. doi: 10.1007/s10592-007-9331-1
Craik, J. C. A. (2008). Sex ratio in catches of American mink - how to catch the females. J. Nat. Conserv. 16, 56–60. doi: 10.1016/j.jnc.2008.01.003
Croose, E., Hanniffy, R., Hughes, B., McAney, K., MacPherson, J., and Carter, S. (2021). Assessing the detectability of the Irish stoat Mustela erminea hibernica using two camera trap-based survey methods. Mammal Res. doi: 10.1007/s13364-021-00598-z
Cuthbert, R., and Sommer, E. (2002). Home range, territorial behaviour and habitat use of stoats (Mustela erminea) in a colony of Hutton's shearwater (Puffinus huttoni), New Zealand. N. Z. J. Zool. 29, 149–160. doi: 10.1080/03014223.2002.9518298
de Valpine, P., Turek, D., Paciorek, C. J., Anderson-Bergman, C., Lang, D. T., and Bodik, R. (2017). Programming with models: writing statistical algorithms for general model structures with NIMBLE. J. Comput. Graph. Stat. 26, 403–413. doi: 10.1080/10618600.2016.1172487
Efford, M. (2004). Density estimation in live-trapping studies. Oikos 106, 598–610. doi: 10.1111/j.0030-1299.2004.13043.x
Efford, M. G., Borchers, D. L., and Byrom, A. E. (2009). “Density estimation by spatially explicit capture–recapture: likelihood-based methods,” in Modeling Demographic Processes in Marked Populations, eds D. L. Thomson, E. G. Cooch, M. J. Conroy, and J. Michael (Berlin; Heidelberg; New York, NY: Environmental and Ecological Statistics 3, Springer-Verlag US), 255–269.
Fraser, E. J., Lambin, X., McDonald, R. A., and Redpath, S. M. (2015). Stoat (Mustela erminea) on the Orkney Islands - assessing risks to native species. Scottish Natural Heritage Commissioned Report No. 871.
García-Díaz, P., Cassey, P., Norbury, G., Lambin, X., Montti, L., Pizarro, J. C., et al. (2021). Management policies for invasive alien species: addressing the impacts rather than the species. Bioscience 71, 174–185. doi: 10.1093/biosci/biaa139
Garvey, P. M., Banks, P. B., Suraci, J. P., Bodey, T. W., Glen, A. L., Jones, C. J., et al. (2020). Leveraging motivations, personality, and sensory cues for vertebrate pest management. Trends Ecol. Evol. 35, 990–1000. doi: 10.1016/j.tree.2020.07.007
Glen, A. S., Anderson, D., Veltman, C. J., Garvey, P. M., and Nichols, M. (2016). Wildlife detector dogs and camera traps: a comparison of techniques for detecting feral cats. N. Z. J. Zool. 43, 127–137. doi: 10.1080/03014223.2015.1103761
Glen, A. S., Atkinson, R., Campbell, K. J., Hagen, E., Holmes, N. D., Keitt, B. S., et al. (2013). Eradicating multiple invasive species on inhabited islands: the next big step in island restoration? Biol. Invasions 15, 2589–2603. doi: 10.1007/s10530-013-0495-y
Glen, A. S., and Byrom, A. E. (2014). Implications of Landholder Buy-in for the Success of Regional-Scale Predator Control. Part 1: Review of Predator Movements. Contract Report LC1956 for Hawke's Bay Regional Council. Landcare Research, Lincoln.
Glen, A. S., Latham, M. C., Anderson, D., Leckie, C., Niemiec, R., Pech, R. P., et al. (2017). Landholder participation in regional-scale control of invasive predators: an adaptable landscape model. Biol. Invasions 19, 329–338. doi: 10.1007/s10530-016-1282-3
Glen, A. S., and Veltman, C. J. (2018). Search strategies for conservation detection dogs. – Wildl. Biol. 2018, wlb.00393. doi: 10.2981/wlb.00393
GoodNature (2021). GoodNature. Availabe online at: https://goodnature.co.nz/products/a24-rat-stoat?variant$=$7457129889855 (accessed November 15, 2021).
Hobbs, N. T., and Hooten, M. B. (2015). Bayesian Models: A Statistical Primer for Ecologists. Princeton, NJ: Princeton University Press.
Holyoak, M., and Lawler, S. P. (1996). Persistence of an extinction-prone predator-prey interaction through metapopulation dynamics. Ecology 77, 1867–1879.
Innes, J., Hay, R., Flux, I., Bradfield, P., Speed, H., and Jansen, P. (1999). Successful recovery of North Island kokako Callaeas cinerea wilsoni populations, by adaptive management. Biol. Cons. 87, 201–214.
Jones, C., Pech, R., Forrester, G., King, C. M., and Murphy, E. C. (2011). Functional responses of an invasive top predator Mustela erminea to invasive meso-predators Rattus rattus and Mus musculus, in New Zealand forests. Wild. Res. 38, 131–140. doi: 10.1071/WR10137
Kaji, K., Saitoh, T., Uno, H., Matsuda, H., and Yamamura, K. (2010). Adaptive management of sika deer populations in Hokkaido, Japan: theory and practice. Pop. Ecol. 52, 373–387. doi: 10.1007/s10144-010-0219-4
Kéry, M., and Royle, A. J. (2016). Applied Hierarchical Modeling in Ecology. Analysis of Distribution, Abundance and Species Richness in R and BUGS. London: Academic Press.
King, C. M., Davis, S. A., Purdey, D., and Lawrence, B. (2003). Capture probability and heterogeneity of trap response in stoats (Mustela erminea). Wildl. Res. 30, 611–619. doi: 10.1071/WR02091
King, C. M., and Veale, A. (2020). “Stoat,” in The Handbook of New Zealand Mammals, eds C. M. King and D. M. Forsyth (Dunedin: Otago University Press), 285–309.
King, C. M., Veale, A., Patty, B., and Hayward, L. (2014). Swimming capabilities of stoats and the threat to inshore sanctuaries. Biol. Invasions 16, 987–995. doi: 10.1007/s10530-013-0564-2
Madsen, J., Williams, J. H., Johnson, F. A., Tombre, I. M., Dereliev, S., and Kuijken, E. (2017). Implementation of the first adaptive management plan for a European migratory waterbird population: The case of the Svalbard pink-footed goose Anser brachyrhynchus. Ambio 46(Suppl. 2), S275–S289. doi: 10.1007/s13280-016-0888-0
Martin, P., Alter, T., Hine, D., and Howard, T. (2019). Community-Based Control of Invasive Species. CABI Publishing.
McDevitt, A. D., Oliver, M. K., Piertney, S. B., Szafrańska, P. A., Konarzewski, M., and Zub, K. (2013). Individual variation in dispersal associated with phenotype influences fine-scale genetic structure in weasels. Cons. Gen. 14, 499–509. doi: 10.1007/s10592-012-0376-4
McDonald, R. A., Webbon, C., and Harris, S. (2000). The diet stoats (Mustela erminea) and weasels (Mustela nivalis) in Great Britain. J. Zool. 252, 363–371. doi: 10.1111/j.1469-7998.2000.tb00631.x
McMurtrie, P., Edge, K.-A., Crouchley, D., Gleeson, D., Willans, M. J., and Veale, A. J. (2011). “Eradication of stoats (Mustela erminea) from Secretary Island, New Zealand,” in Island Invasives: Eradication and Management, eds. C. R. Veitch, M. N. Clout, and D. R. Towns (Gland: IUCN), 455–460.
Millon, A., Lambin, X., Devillard, S., and Schaub, M. (2019). Quantifying the contribution of immigration to population dynamics: a review of methods, evidence and perspectives in birds and mammals. Biol. Rev. 94, 2049–2067. doi: 10.1111/brv.12549
Mos, J., and Hofmeester, T. R. (2020). The Mostela: an adjusted camera trapping device as a promising non-invasive tool to study and monitor small mustelids. Mammal Res. 65, 843–853. doi: 10.1007/s13364-020-00513-y
Nugent, G., Gormley, A. M., Anderson, D. P., and Crews, K. (2018). Roll-back eradication of Bovine Tuberculosis (TB) from wildlife in New Zealand: concepts, evolving approaches, and progress. Front. Vet. Sci. 5:277. doi: 10.3389/fvets.2018.00277
Oppel, S., Burns, F., Vickery, J., George, K., Ellick, G., Leo, D., et al. (2014). Habitat-specific effectiveness of feral cat control for the conservation of an endemic ground-nesting bird species. J. Appl. Ecol. 51, 1246–1254. doi: 10.1111/1365-2664.12292
Orkney Native Wildlife Project (2021). Stoat Map. Available online at: https://www.orkneynativewildlife.org.uk/stoat-map (accessed August 25, 2021).
Pejchar, L., and Mooney, H. A. (2009). Invasive species, ecosystem services and human well-being. Trends Ecol. Evol. 24, 497–504. doi: 10.1016/j.tree.2009.03.016
Prowse, T. A. A., Bradshaw, C. J. A., Delean, S., Cassey, P., Lacy, R. C., Wells, K., et al. (2016). An efficient protocol for the global sensitivity analysis of stochastic ecological models. Ecosphere 7:e01238. doi: 10.1002/ecs2.1238
Pyšek, P., Hulme, P. E., Simberloff, D., Bacher, S., Blackburn, T. M., Carlton, J. T., et al. (2020). Scientists' warning on invasive alien species. Biol. Rev. 95, 1511–1534. doi: 10.1111/brv.12627
Quaglietta, L., and Porto, M. (2019). SiMRiv: Individual-Based, Spatially-Explicit Simulation and Analysis of Multi-State Movements in River Networks and Heterogeneous Landscapes. R package version 1.0.4. Available online at: https://CRAN.R-project.org/package=SiMRiv (accessed August 25, 2021).
R Core Team (2020). R: A Language and Environment for Statistical Computing. Vienna: R Foundation for Statistical Computing.
Robertson, P. A., Mill, A., Novoa, A., Jeschke, J. M., Essl, F., Gallardo, B., et al. (2020). A proposed unified framework to describe the management of biological invasions. Biol. Invasions 22, 2633–2645. doi: 10.1007/s10530-020-02298-2
Samaniego, A., Kappes, P., Broome, K., Cranwell, S., Griffiths, R., Harper, G., et al. (2021). Factors leading to successful island rodent eradications following initial failure. Conserv. Sci. Pract. 3:e404. doi: 10.1111/csp2.404
Sidorovich, V. E., and Solovej, A. (2007). The stoat Mustela erminea population decline in northern Belarus and its consequences for weasels Mustela nivalis. N. Z. J. Zool. 34, 9–23. doi: 10.1080/03014220709510059
Varley, N., and Boyce, M. S. (2006). Adaptive management for reintroductions: updating a wolf recovery model for Yellowstone National Park. Ecol. Model. 193, 315–339. doi: 10.1016/j.ecolmodel.2005.09.001
Veale, A. J., Edge, K. A., McMurtrie, P., Fewster, R. M., Clout, M. N., and Gleeson, D. M. (2013). Using genetic techniques to quantify reinvasion, survival and in situ breeding rates during control operations. Mol. Ecol. 22, 5071–5083. doi: 10.1111/mec.12453
Veale, A. J., McMurtrie, P., Edge, K. A., and Clout, M. N. (2015). The effects of mice on stoats in southern beech forests. Austral Ecol. 40, 32–39. doi: 10.1111/aec.12161
Keywords: adaptive management, citizen science, invasive species, Orkney, spatially explicit model, stoat
Citation: Zub K, García-Díaz P, Sankey S, Eisler R and Lambin X (2022) Using a Modeling Approach to Inform Progress Towards Stoat Eradication From the Orkney Islands. Front. Conserv. Sci. 2:780102. doi: 10.3389/fcosc.2021.780102
Received: 20 September 2021; Accepted: 16 December 2021;
Published: 18 January 2022.
Edited by:
Krithi K. Karanth, Centre for Wildlife Studies, IndiaReviewed by:
Jamie McAulay, Department of Conservation, New ZealandAndrew Veale, Manaaki Whenua Landcare Research, New Zealand
Daniel Spring, The University of Melbourne, Australia
Copyright © 2022 Zub, García-Díaz, Sankey, Eisler and Lambin. This is an open-access article distributed under the terms of the Creative Commons Attribution License (CC BY). The use, distribution or reproduction in other forums is permitted, provided the original author(s) and the copyright owner(s) are credited and that the original publication in this journal is cited, in accordance with accepted academic practice. No use, distribution or reproduction is permitted which does not comply with these terms.
*Correspondence: Karol Zub, karolzub@ibs.bialowieza.pl