Recovery units under the Endangered Species Act should be used more widely
 Michael J. Evans1,2*†
  Jacob W. Malcom2†
- 1Environmental Science and Policy Dept., George Mason University, Fairfax, VA, United States
- 2Center for Conservation Innovation, Defenders of Wildlife, Washington, DC, United States
Recovering species is the main goal of the Endangered Species Act (ESA). In the face of limited conservation budgets, diverse tools are needed to efficiently recover species. Recovery units may be one such tool - designated portions of a species’ range that must be recovered individually before an entire species can be considered recovered. Recovery units allow for spatial flexibility in developing recovery goals and may be used in regulatory decisions such as ESA section 7 consultation. Despite the advantages, very little information exists on how recovery units have been developed and used. We mined available public data to determine the number and types of species for which recovery units have been designated; evaluated species and geographic characteristics associated with recovery unit designation; and examined how recovery units have been used in implementing the ESA, such as during consultation. We found 49 listed species had designated recovery units through December 2017, and that these species typically had relatively large ranges and were well-studied. We found taxonomic biases in recovery unit designation as well, with fish species being disproportionately likely to have recovery units and plants disproportionately less. These species were also more likely to have their recovery units considered and used in subsequent ESA implementation – a probability that decreased as time since unit designation passed. Improvements in recovery priority numbers among species with recovery units indicate that the theoretical benefits of this tool may have translated to improved status. These data indicate that recovery units could be applied to additional wide-ranging species to improve recovery under the ESA.
Introduction
Most species listed as threatened or endangered under the U.S. Endangered Species Act (ESA) are not yet recovered (Neel et al., 2012). The threats they face are increasingly diverse, and the agencies responsible for their recovery are challenged with limited budgets that do not match the growing number of listed species (Gerber, 2016). Thus, conservationists need to develop and apply methods that can improve the effectiveness and efficiency of species recovery. Opportunities abound to do that through administrative reforms, without amending the ESA. The use of species “recovery units” is one such example of an existing ESA tool that may currently be underused.
Recovery units allow the agencies responsible for overseeing recovery under the ESA – the U.S. Fish and Wildlife Service (FWS) and National Marine Fisheries Service (NMFS) – to split the population of a listed species into multiple units for recovery planning, rather than treating the species as a single entity. Importantly, recovery units differ from Distinct Population Segments (DPS). Under the ESA, species, subspecies, and any ‘distinct population segment’ may be placed on the endangered species list (USFWS, 1996). Thus, DPS constitute listed entities equivalent to species under the ESA and are listed and de-listed individually, processes subject to statutory and regulatory requirements. Recovery units are subsets of listed entities, defined in the Services’ Recovery Planning Guidance Handbook as “a special unit of the listed entity that is geographically or otherwise identifiable and is essential to the recovery of the entire listed entity” (NMFS, 2020). Thus, each recovery unit must be conserved to recover the species, but units themselves are not added to or removed from the endangered species list. Recovery units are designated at the Services’ discretion during the recovery planning process, during which recovery actions and criteria may be defined per unit, allowing for more targeted and efficient recovery planning. Because the Services can delineate recovery units using a variety of factors – including genetic diversity, ecosystem diversity, and variation in threats – they can apply the tool to a wide range of taxa.
Section 7 of the ESA is one of the most important tools for protecting listed species (Malcom and Li, 2015; Evans et al., 2019) and is particularly relevant to understanding the utility of recovery units. Section 7(a)(2) requires federal agencies to ensure that any actions they take, fund, or authorize do not jeopardize the existence of any listed species or destroy or adversely modify critical habitat. During the process of Section 7 consultation (hereafter ‘consultation’), the Services evaluate whether a proposed federal action is likely to jeopardize the species. For species without recovery units the action’s effect is evaluated relative to the entire species. The Services rarely determine that actions jeopardize species or adversely modify critical habitat (Malcom and Li, 2015; Evans et al., 2019), in part because most actions affect only a small fraction of a species’ population. Because FWS rarely tracks the cumulative effects of these actions (Government Accountability Office, 2009), it may authorize levels of habitat disturbance that impede species recovery (Evans et al., 2016; Li et al., 2020).
However, for species with recovery units, the Services may conduct the jeopardy analysis on the affected recovery unit. As the Services’ Section 7 Handbook explains, “when an action appreciably impairs or precludes the capability of a recovery unit from providing both the survival and recovery function assigned it, that action may represent jeopardy to the species” (USFWS, and NMFS 1998). The effect of the proposed federal action can therefore be considered relative to its effect on an individual recovery unit, and if the action impairs the unit a jeopardy determination can be made for the listed species. By evaluating the effects of proposed actions through the lens of recovery units, the Services may be more likely to determine these actions jeopardize listed species. For example, if a species’ total range is 100 km2 and an action will remove 1 km2 of habitat, that 1% loss is unlikely to trigger a jeopardy conclusion. But if the same species has ten, 10 km2 recovery units and the same action affects one of those units, the loss is now 10% for the affected unit. That loss increases the risk of impairing the survival and recovery of the unit, which in turn increases the risk of jeopardizing the entire species. Thus, recovery units provide the Services with a tool to reduce the chances of a ‘death by 1,000 cuts’ scenario.
By requiring the recovery of multiple subunits of listed species, recovery units help to maintain the ‘3Rs’ of conservation – Representation, Resilience, and Redundancy (Shaffer and Stein, 2000; Wolf et al., 2015). This framework is consistent with a metapopulation approach to conservation, which recognizes that for some species persistence and recovery may depend on the maintenance of multiple populations (Hanski and Simberloff, 1997; Akcakaya et al., 2007). Here we present a series of analyses that advance our understanding of the Services’ use of recovery units through 2017 and evaluate the utility of recovery units for recovering species. Our first objective was to determine when and how the Services designate recovery units. Determining this fills an important gap, as no publication has yet described how many or what types of species have recovery units. Our second objective was to assess how the Services use recovery units in recovery planning and during consultation. Finally, we assessed whether species with recovery units show greater evidence of recovery than those without units. We use the results of these analyses to recommend how the Services can more effectively use recovery units to conserve listed species. None of these recommendations requires legislation or regulatory changes, as the Services have all the necessary authority to implement the recommendations.
Materials and methods
Recovery unit data
We used data from the Services to characterize and quantify patterns of recovery unit designation and use. Recovery units are designated in recovery plans, and recovery plans are written only for domestic U.S. listed species. We therefore considered only species with existing recovery plans – about 75% of ESA-listed species (Malcom and Li, 2018) – in our analyses and refer to this set as “all species.” We obtained all available recovery plans from FWS’s ECOS website (https://ecos.fws.gov) and NMFS’s recovery site (http://www.nmfs.noaa.gov/pr/recovery/plans.htm ). To identify species with recovery units, we performed optical character recognition on these documents to generate machine readable text and automatically searched for the term “recovery unit” in each recovery plan using the Linux grep command. We read documents with a match to ensure true positives. To guard against false negatives, we used the same process to search for the term ‘species,’ which successfully returned matches in all recovery plans.
We considered several predictor variables that may explain why some species have recovery units and others do not. We collected species listing status (threatened or endangered), taxonomic membership, geographic region, FWS field office, range size, and recovery prioritization number from the ECOS Recovery Plan Ad Hoc Report using the `ecosscraper` package (https://github.com /ermi-ogre/ecosscraper) for R (R Core Team 2017). Ecosscraper is no longer maintained, and these data can now be obtained through the FWS Data Explorer API (https://ecos.fws.gov/ecp/report/ad-hoc-documentation?catalogId=species&reportId=species ). Geographic region refers to one of eight FWS Regional Offices responsible for a listed species, or NMFS. We estimated range size as the total area (km2) of all counties in which a species is reported to occur in ECOS. In addition, we identified ~400 species that had ambiguous county occupancy data and manually refined the county lists using specimen and imagery databases including GBIF (GBIF: The Global Biodiversity Information Facility, 2020) and eBird (Sullivan et al., 2009). We joined these records with U.S. County data (U.S. Census Bureau, 2019) to calculate the total area of occupied counties for each species. This sum of county areas overestimated the range size of each species because species typically occupy only select habitats in any county. For our analyses, we assumed the over-estimation did not bias towards species with or without recovery units.
Recovery prioritization numbers (RPNs) are used by the Services to prioritize recovery efforts among listed species. RPNs range from 1 – 18, with 1 representing high priority, and are based hierarchically on the degree of threat a species faces (‘High’, ‘Moderate’, or ‘Low’), the species’ potential for recovery (‘High’, or ‘Low’), and its taxonomic uniqueness (‘Monotypic genus’, ‘Species’, ‘Subspecies’). Additionally, the Services may designate a species as potentially in conflict with economic activities using a ‘C’ suffix to RPNs (USFWS, 1983). We extracted RPNs from the recovery plan table on ECOS and separated the priority number and conflict designation into two variables, Priority and Conflict.
Because the Recovery Handbook references the importance of genetic diversity and robustness for delineating recovery units (NMFS, 2020), we considered the relative amount of genetic research for a species as a potential predictor of recovery unit designation. That is, a species that has been subject to a substantial body of genetics research may be more likely to have recovery units than a poorly studied species. We used Google Scholar to search for papers matching the term “[Species] population genetics,” and used the number of citations returned as a proxy for the extent of scientific knowledge of a species’ population genetics. We refer to this measure as “genetic citations.”
Recovery unit characteristics
We hypothesized that species range sizes differ among taxa, and that the rate of genetic citations has increased over time. We used one-way analysis of variance (ANOVA) to test for differences in species range size among taxonomic groups using the log of the area of occupied counties as the response variable. Range sizes differed among taxonomic groups (F9,1352 = 18.72, p< 0.001). A linear model of the number of genetic citations between 1985 and 2015 among all species as a function of year indicated increasing genetic research over time (β = 8.81 ± 1.25, p< 0.001). Thus, we standardized range size per taxonomic group and genetic citations per year using z-scores in all subsequent analyses. These transformations prevent confounding range size with taxonomic status, and level of genetic research with age of recovery plans when evaluating which species characteristics predict recovery unit designation.
We used a bootstrapping procedure to compare characteristics of species with recovery units to all species with recovery plans. We drew random samples of 49 species without recovery units and compared mean range size, mean genetic citations, mean RPN, and proportion of species with conflict designations to the 49 species with units. This procedure was repeated 100 times and we evaluated the proportion (p) of random samples with measures less than species with recovery units, deeming p< 0.05 to indicate real differences between the two groups.
We then used logistic regression to evaluate the effect of genetic citations, range size, and RPN on the log odds of recovery unit designation, while controlling for taxonomic group and FWS region. Using all species with recovery plans, we modeled binary recovery unit designation as a function of a linear combination of the above variables using a logit link function. We report coefficient estimates with standard error and p-values for genetic citations, range size, and RPN. To assess differences in the proportion of species with and without recovery units among taxonomic groups and FWS regions we used Wald’s Chi-squared tests and Tukey post-hoc tests for pairwise comparisons between taxa.
We further investigated the relationship between species characteristics and recovery unit designation by comparing each species with recovery units to 1 – 3 taxonomically similar listed species without recovery units. We chose taxonomically similar listed species with recovery plans, prioritizing shared genera and no more distantly related than a shared family. For example, Preble’s meadow jumping mouse (Zapus hudsonius preblei) was compared to the New Mexico meadow jumping mouse (Zapus hudsonius luteus), and El Segundo blue butterfly (Euphilotes battoides allyni) was compared to Smith’s blue butterfly (Euphilotes enoptes smithi). We used conditional logistic regression (Connolly and Liang, 1988) to estimate the log odds of recovery unit designation as a function of the same set of predictor variable used in logistic regression analyses, eliminating taxonomic group. First, we fit univariate models for all predictors, and then a full model including all variables that were important (p< 0.10) univariate predictors. We report coefficient estimates with standard error and p-values for these variables.
To provide a more intuitive understanding of the characteristics delineating species with and without designated recovery units, we applied a classification tree analysis predicting recovery unit designation based on taxonomic group, genetic citations, range size, RPN, and listing status. We used a minimum threshold of α< 0.90 for node creation and evaluated tree performance using receiver operating characteristic (ROC) curves. Because of the overrepresentation of plants among all U.S. listed species (~57%), we generated trees using all species with recovery plans and using all species excluding plants, then selected the tree with the greatest predictive ability indicated by the area under the curve (AUC). We generated classification trees and ROC curves using the party (Hothorn et al., 2006) and pROC (Robin et al., 2011) packages for R v.3.5.1 (R Core Team, 2018).
ESA implementation
To understand how the Services developed recovery units, we examined all recovery plans with recovery units for four criteria:
1.) Does the recovery plan explicitly state that the recovery units are “essential to the recovery of the entire listed entity,” as explained in the Recovery Handbook?
2.) On what basis did the Service designate the recovery units? We characterized the reasons according to factors in the Recovery Handbook, including variation in threats, and preservation of redundancy, representation, and resilience (‘3Rs’) related to geographic or genetic distinctiveness.
3.) Does the recovery plan refer to the role of recovery units in section 7 consultations, as discussed in the Section 7 Handbook?
4.) Does the recovery plan enumerate recovery criteria and/or actions for each recovery unit?
We determined that actions/criteria were enumerated per recovery unit only when differences among recovery units were described in a recovery plan. Thus, if recovery units were referenced but actions were listed generically for all units (e.g., “High-quality habitat sufficient to ensure long-term survival and recovery is protected within each recovery unit”), we did not consider that recovery plan to have enumerated these factors per unit. We tabulate and report the frequency of each of these 4 criteria.
We also examined biological opinions (BiOps) to assess the use of recovery units during consultation. For each species with recovery units, we randomly sampled up to ten BiOps from FWS’s TAILS database, restricting sampled consultations to those initiated after recover units were designated for a given species. We evaluated two aspects of each BiOp: whether species’ recovery units were mentioned and whether recovery units were used in the jeopardy analysis. We determined that recovery units were used in the analysis if one of two criteria were met:
1. The Service used recovery units when estimating the amount or effect of expected incidental take (harm to a listed species incidental to an otherwise lawful activity). Either number of individuals relative to the population within the recovery unit, or amount of habitat loss relative to the area of the unit.
2. The Service explicitly stated the role of recovery units in its jeopardy analysis.
We tested for differences in recovery unit mention and use in jeopardy analysis among taxa and FWS field offices using Chi-square contingency tests. When comparing these rates among field offices, we collapsed records by BiOp, which can include multiple species. To determine whether the recency of recovery unit designation affected the probability that recovery units were used in BiOps, we estimated the relationship between the log odds of mention and usage and days elapsed between recovery unit designation and BiOp completion using logistic regression models. We report coefficient estimates with standard error and p-values.
Additionally, we spoke with eight FWS biologists involved in recovery planning in FWS regions 1, 2, 3, 4, 6, and 8 to ascertain their qualitative opinions and experiences designating and using recovery units. These conversations were open-ended, but in each we asked biologists if they were aware of recovery units, in what circumstances they might use them, and how units affect ESA implementation.
Recovery progress
We examined five-year reviews to compare recovery of listed species with and without recovery units. First, we determined the extent to which five-year reviews discuss recovery units. For every species with recovery units, we calculated the proportion of five-year reviews completed after the units were designated that mentioned the units. We also determined how often these reviews reported species status and recovery objectives by recovery unit. Five-year reviews also provide recommendations as to whether changes in listing status or recovery prioritization are warranted (i.e., recommended delisting, increase in priority number, or down listing from endangered to threatened). We recorded changes in species’ recovery priority numbers as a proximal indicator of status improvement, only considering changes that reflected either reduced threat level or increased recovery potential. For example, a change from 2 to 3 represents a reclassification from species to subspecies, and not an improvement in status. Recommended down listings also indicated status improvement. We tested for differences in the proportion of species showing improvement at five-year reviews between species with recovery units and a random sample of 560 five-year reviews for all species with recovery plans. To evaluate whether these proportions were statistically different, we performed a bootstrapping procedure taking random samples of five-year reviews and comparing the frequency with which improvements were observed in each sample to the observed frequency among species with recovery units. We took 100 samples of size equal to the number of five-year reviews available for recovery unit species and used the proportion (p) of samples with a higher frequency as a measure of the probability of a true difference.
Results
Recovery unit characteristics
We identified 40 FWS recovery plans designating recovery units for 49 listed species (Table 1). We digitized the boundaries of all units that had maps, and the GIS files are available in an OSF repository (Evans, 2019). The number of units per species ranged from 2 to 19. Units were as small as 7 ac and as large as 12,492,233 ac (Table 1). The rate of recovery unit designation has remained consistently low, between 0 and 3 species per year since 1995, except for eight species given recovery units in 2003 (Figure 1).
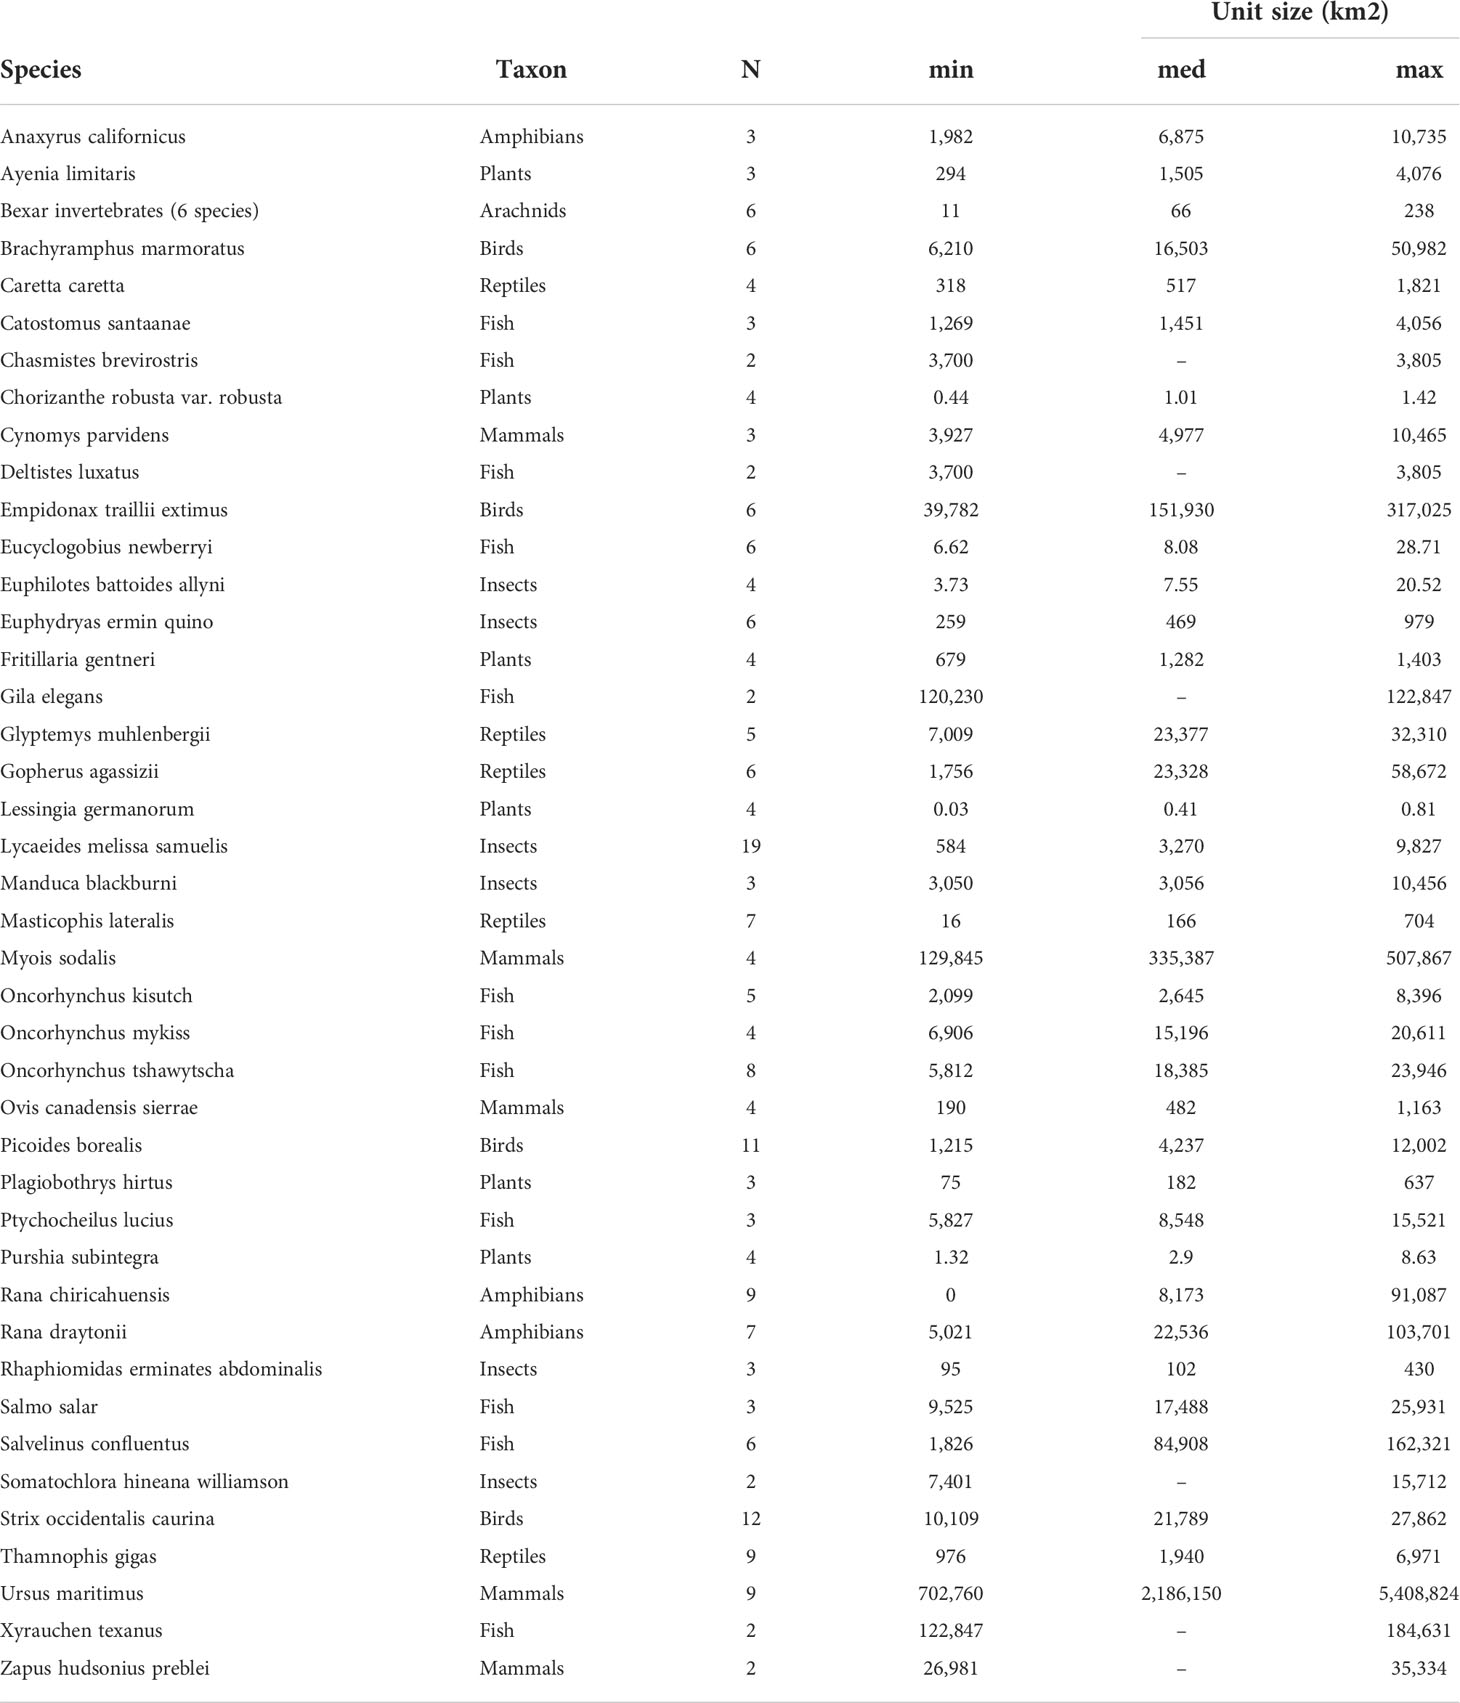
Table 1 Species with recovery units designated as of as of January, 2018.
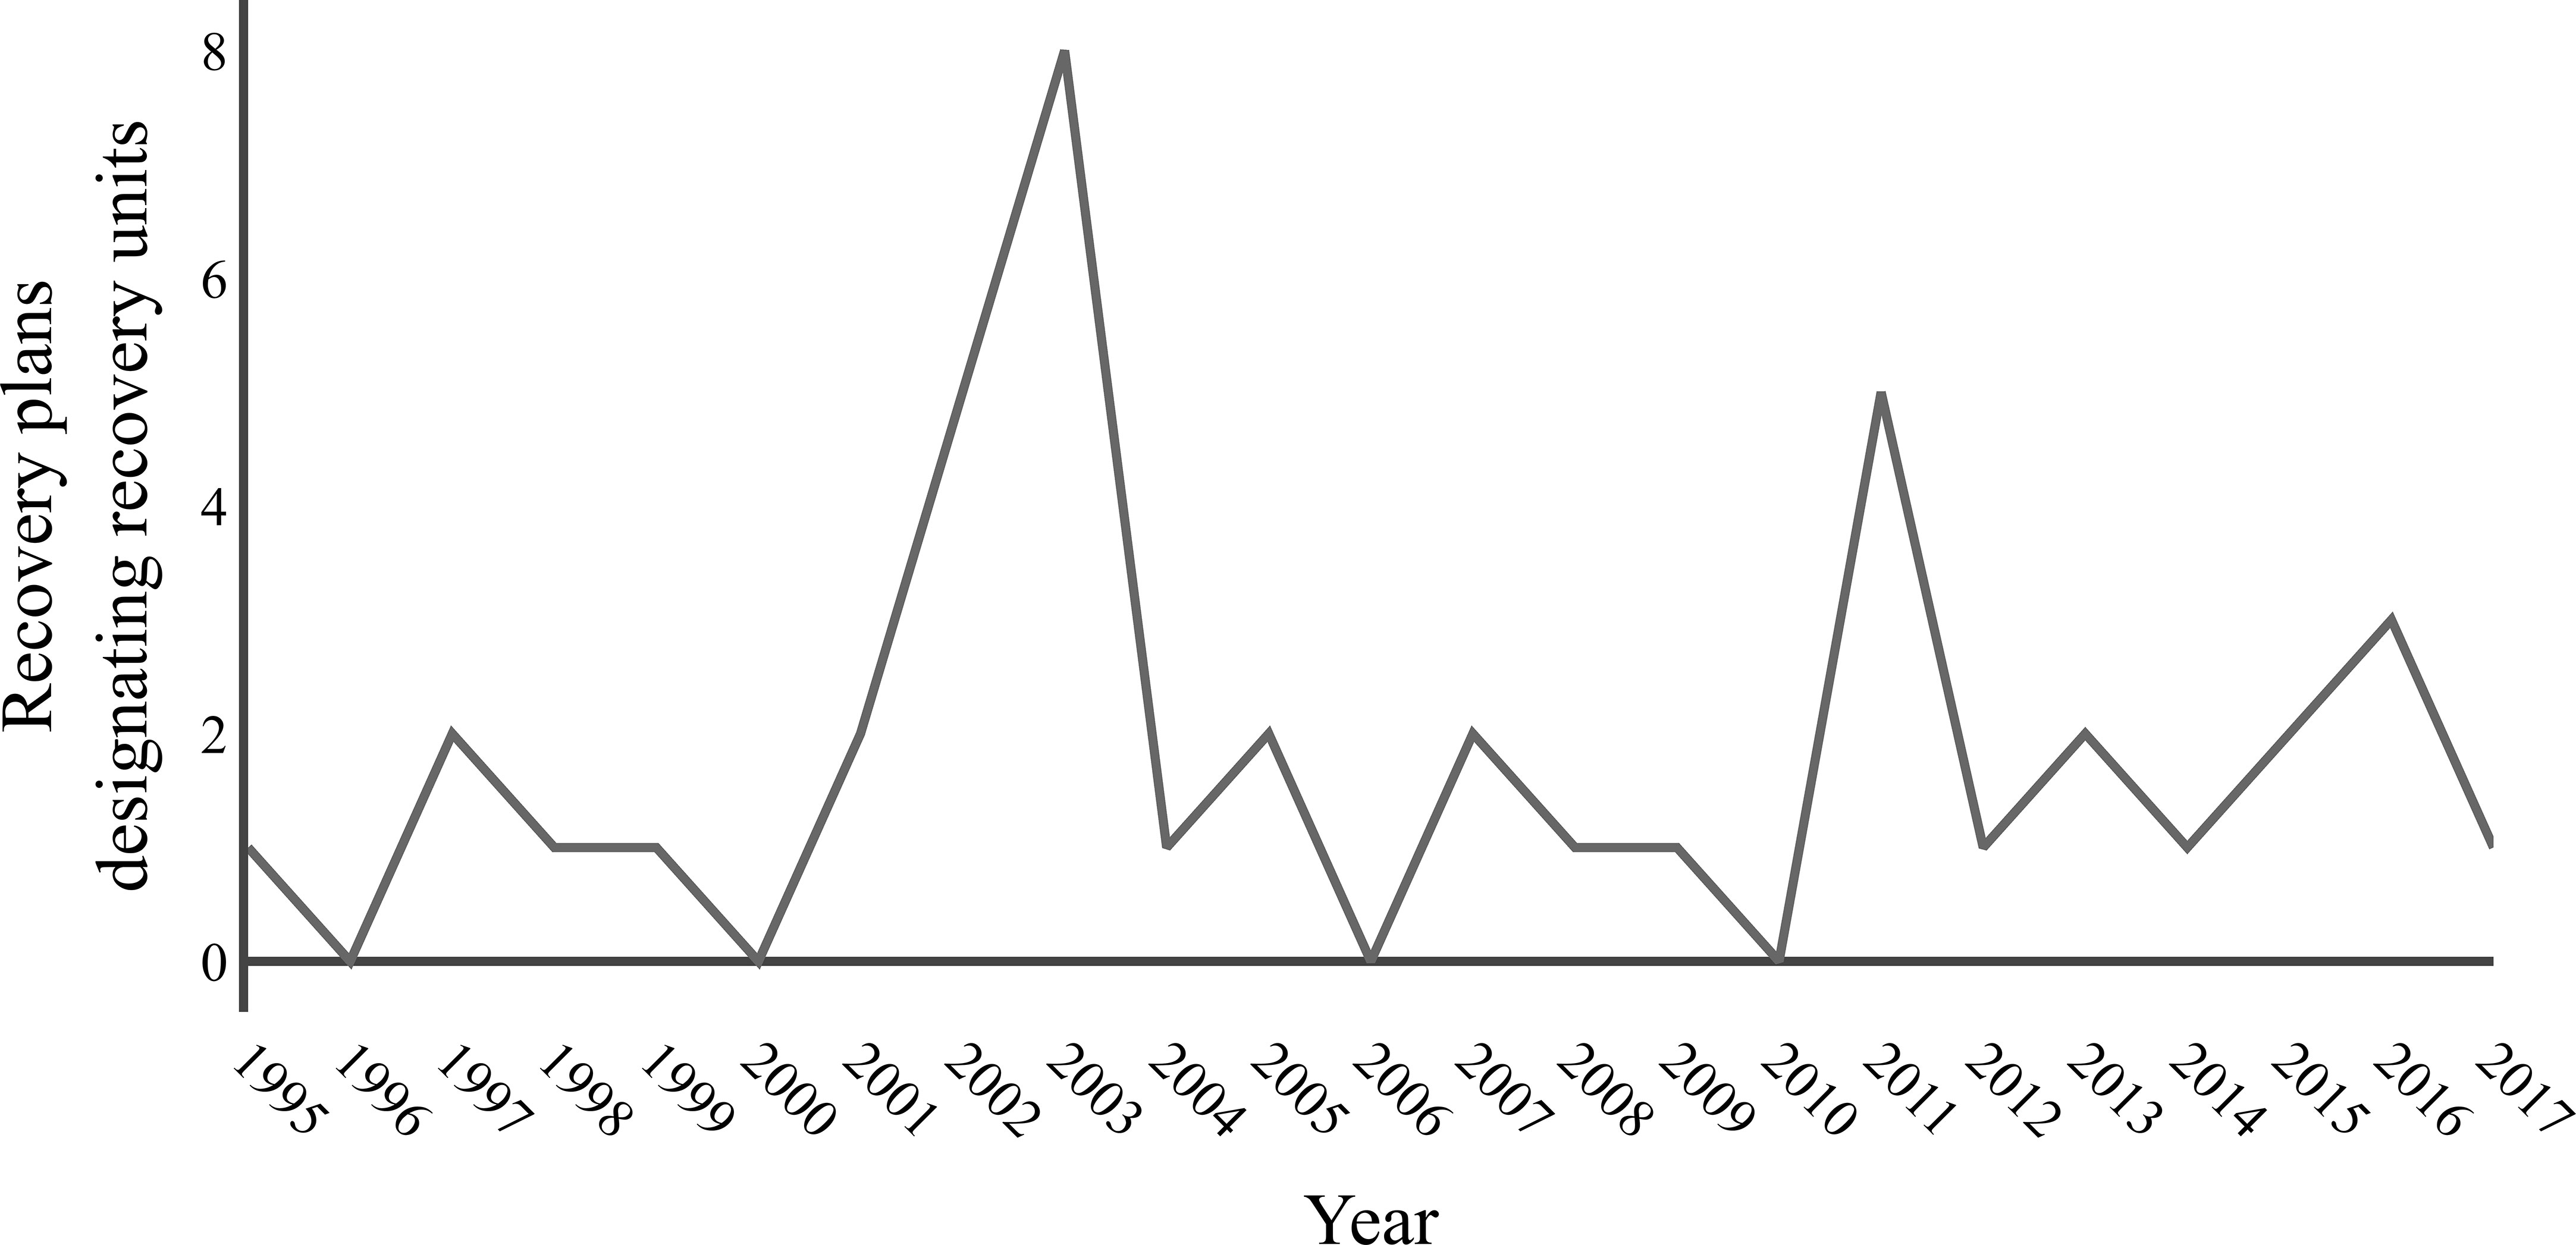
Figure 1 Recovery unit designation has been constant through time, except for 2003. Plot shows the number of recovery plans designating recovery units for threatened and endangered species per year from 1995 – 2017.
Species with recovery units tend to have larger range sizes than taxonomically similar species without recovery units. Bootstrapping procedures indicated taxonomically adjusted mean range size was greater (p< 0.001) among species with recovery units (μ = 48,621,401 ac, s = 65,707,842 ac) than among all species with recovery plans (μ = 9,211,038 ac, s = 36,022,003 ac). Annually adjusted mean number of genetic citations were higher (p< 0.001) for recovery unit species (x̅ = 512, σ = 1127) than for all species with recovery plans (x̅ = 30, σ = 146.9). Mean RPN did not differ between species with and without recovery units (p = 0.683). However, a greater proportion (p< 0.001) of species with recovery units had an economic conflict designation (72%) than did all species with recovery plans (29%), and all listed species as of 2014 (27%). These findings were corroborated by logistic regression results, which indicated negative relationships between the log odds of recovery unit designation and species’ genetic citations (β = -0.34 ± 0.14, p = 0.01) and range size (β = -0.67 ± 0.15, p< 0.001), and no relationship with RPN (β = 0.01 ± 0.06, p = 0.84).
The proportion of species with recovery units differed among taxa (χ29 = 101.43, p< 0.001). Amphibians, birds, fish, insects, mammals, and reptiles were more frequently given recovery units relative to the proportions of these taxa among all species with recovery plans (Figure 2). The odds of designation for plants were lower than those for amphibians (Odds Ratio = 0.069, p = 0.006), fish (OR = 0.082, p< 0.001), insects (OR = 0.085, p< 0.001), mammals (OR = 0.101, p = 0.005), and reptiles (OR = 0.043, p< 0.001). No other odds ratios were statistically significant. There were no significant differences in frequency of recovery unit designation among FWS regions (χ242 = 48, p = 0.243).
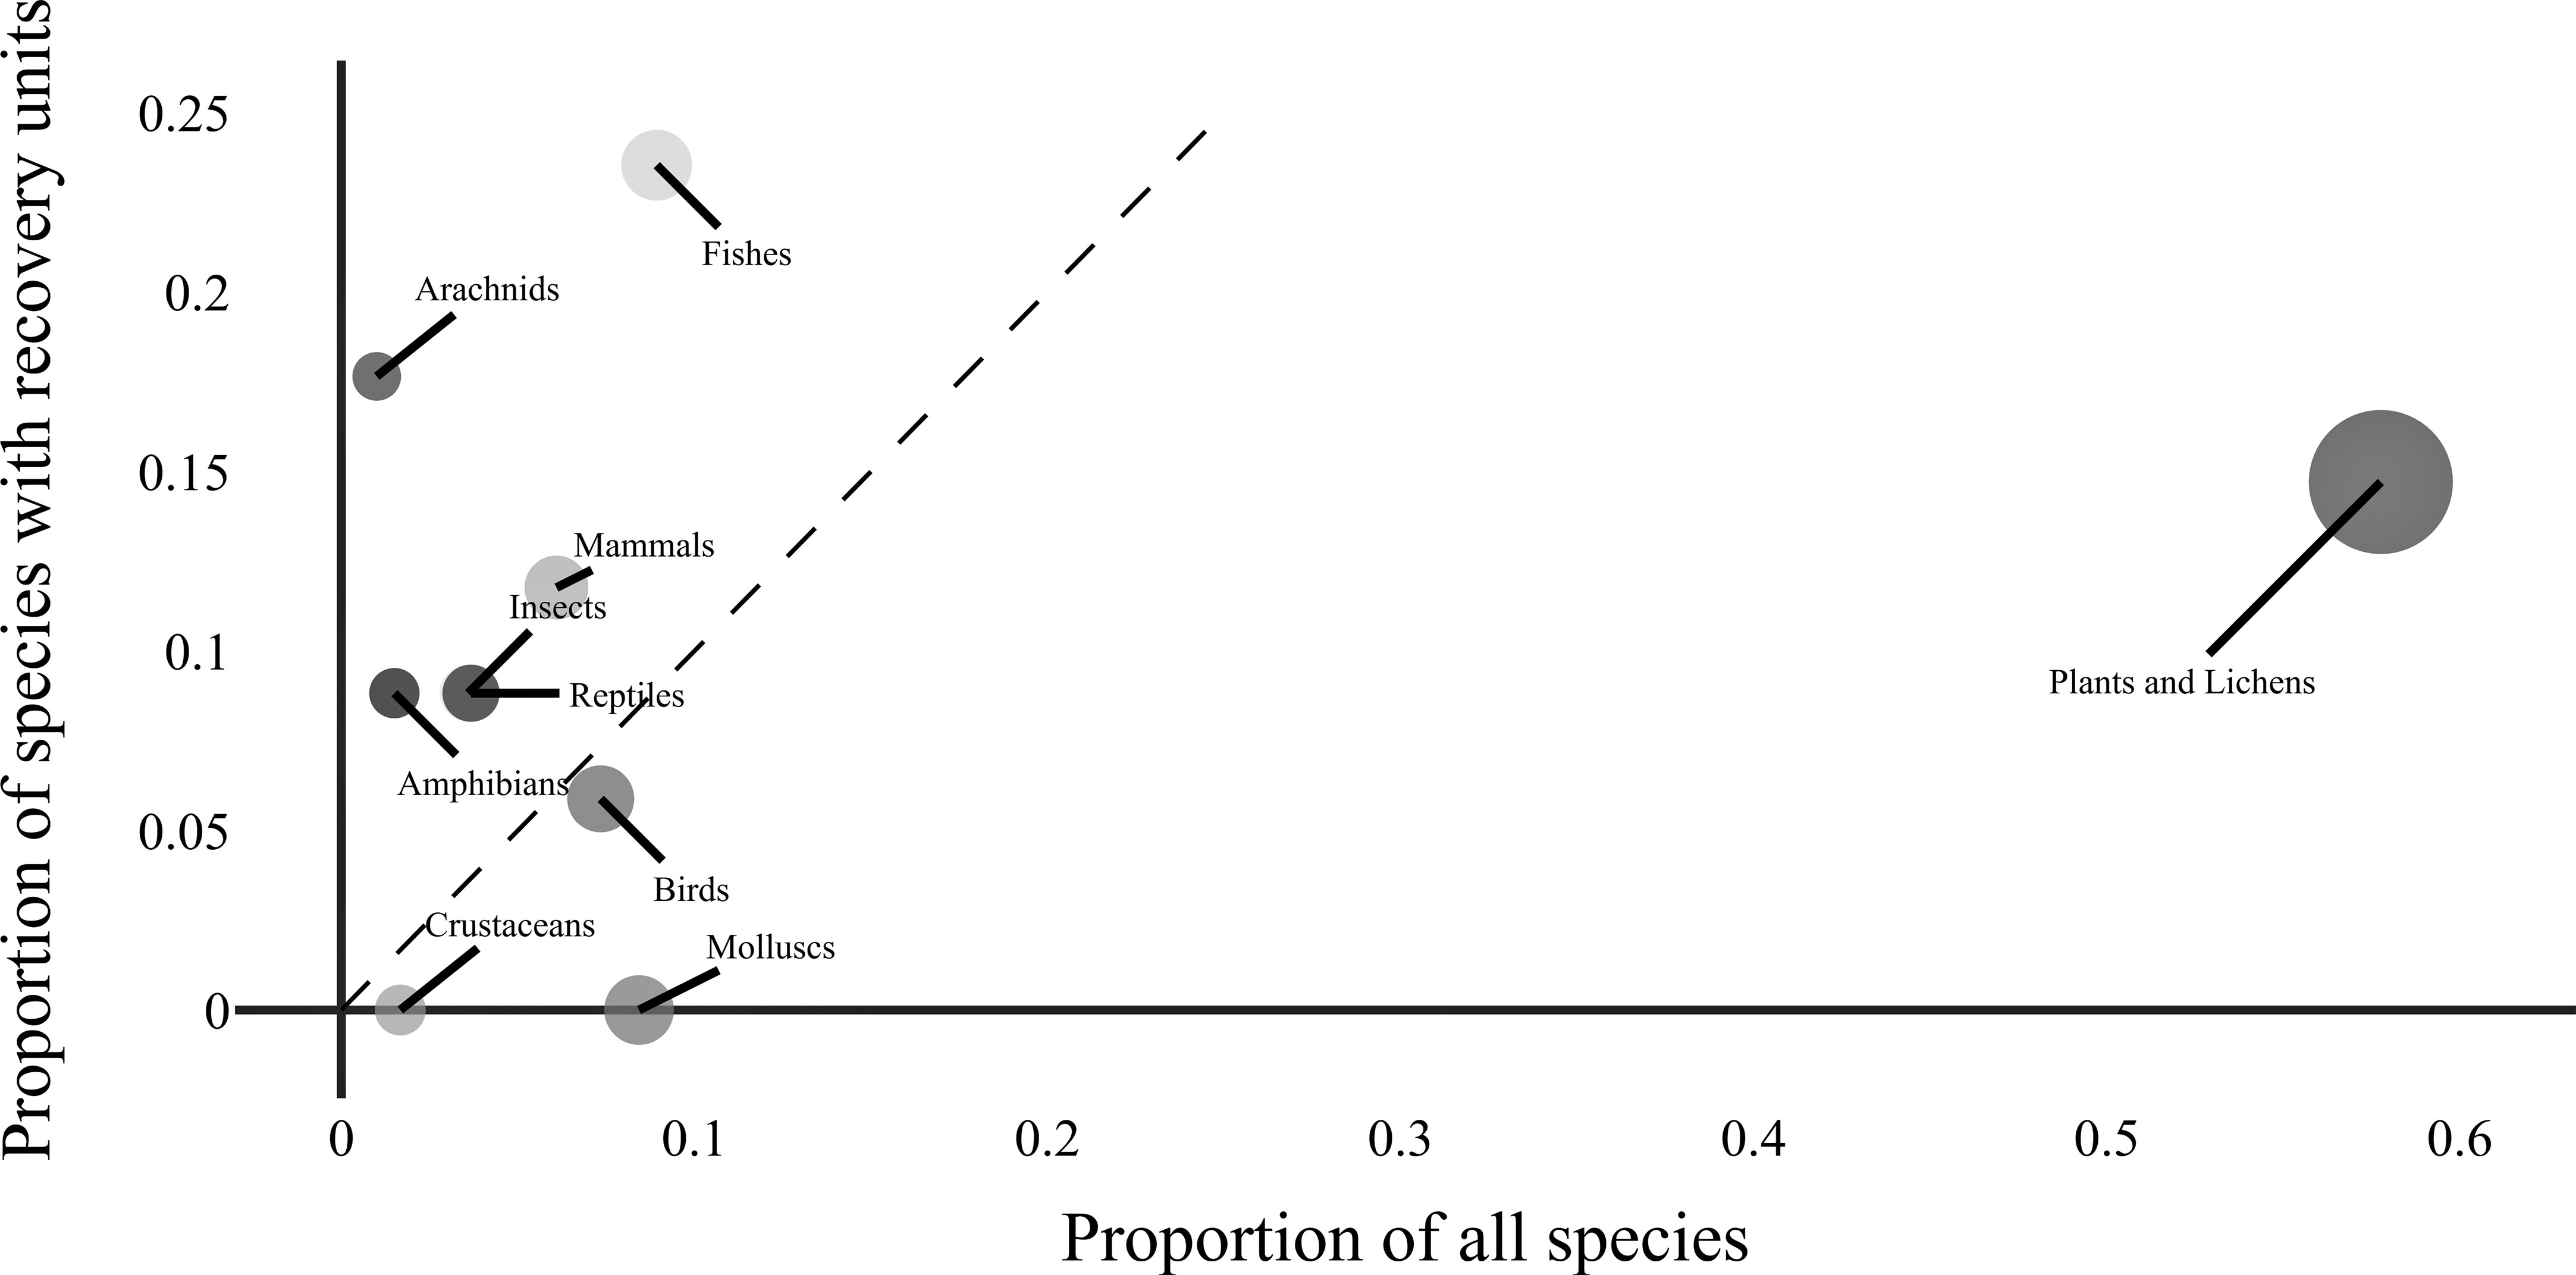
Figure 2 Designation of recovery units is biased among taxonomic groups. Circles are located to show the proportion of listed species and species with recovery units comprised by a given taxon, with circle size is proportional to the number of listed species per taxon. The dotted line indicates an expected 1:1 relationship if the probability of recovery unit designation did not depend on a species’ taxonomic grouping. For example, fishes received disproportionately more designations than expected (above 1:1 line), whereas plant species received disproportionately fewer.
Results from conditional logistic regression comparing closely related species were consistent with results from general analyses. The log odds of recovery unit designation increased with genetic citations (β = 0.68 +- 0.29, p = 0.019) and range size (β = 0.53 +- 0.21, p = 0.011). No other univariate predictors were significantly related to recovery unit designation. A full model including these predictors did not indicate any statistically significant relationships between species characteristics and probability of recovery unit designation.
Classification trees built using all species with recovery plans exhibited better predictive performance of recovery unit designation (AUC = 0.91) than trees built excluding plant species (AUC = 0.84). The best performing tree included taxonomic group, citation rate, and range size, and indicated that species with range sizes above the 67th percentile of their taxonomic group, and annually adjusted genetic citation rates above the 72nd percentile, had a 0.70 probability of having recovery units designated. Taxonomic group was an important predictor for species falling below the citation rate threshold (Figure 3).
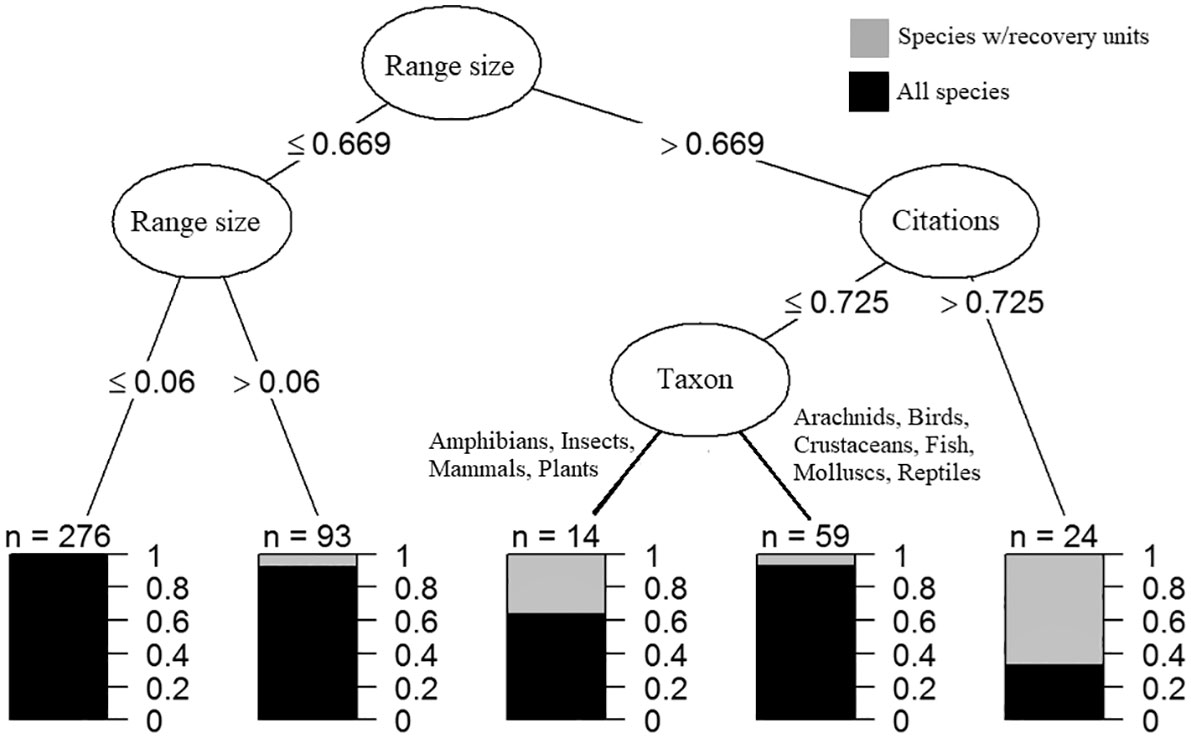
Figure 3 Species’ range size and rate of genetic citation determine likelihood of recovery unit designation. Figure illustrates the best-performing classification tree predicting species with recovery units. Ovular nodes show significant predictors of recovery unit designation and delineating threshold values for those variables are displayed along adjacent edges. Range size and genetic citations were adjusted to z-scores per taxon and year, respectively. Terminal bar plots indicate the proportion of species with and without recovery units among those meeting criteria defined by the branch (e.g., species with adjusted range size > 0.669 and adjusted genetic citations > 0.725).
ESA implementation
Of the 40 recovery plans designating recovery units, 24 stated that recovery units are ‘essential for species recovery’ (Table 2). Except for five species (Lessingia germanorum, Masticophis lateralis euryxanthus, Ptychocheilus lucius, Somatochlora hineana williamson, Oncorhynchus kisutch), all plans provided some explanation for the designation of recovery units in terms of their role and importance in facilitating persistence and recovery of the entire species. Explanations fell into two major categories: addressing variation in the threats species face (and needed recovery actions) between units; and addressing the ‘3Rs’ of conservation: Redundancy; Representation; and Resilience (Wolf et al., 2015; Malcom and Carter, 2021). Of the 35 plans providing explanations, 29 plans referenced the importance of preserving either geographic and/or genetic variability and representation. All but 9 recovery plans specified different recovery actions and/or criteria per unit. Additionally, 10 recovery plans provided guidance on the role of recovery units during consultation, explicitly referring to the use of recovery units in jeopardy analysis (Table 2).
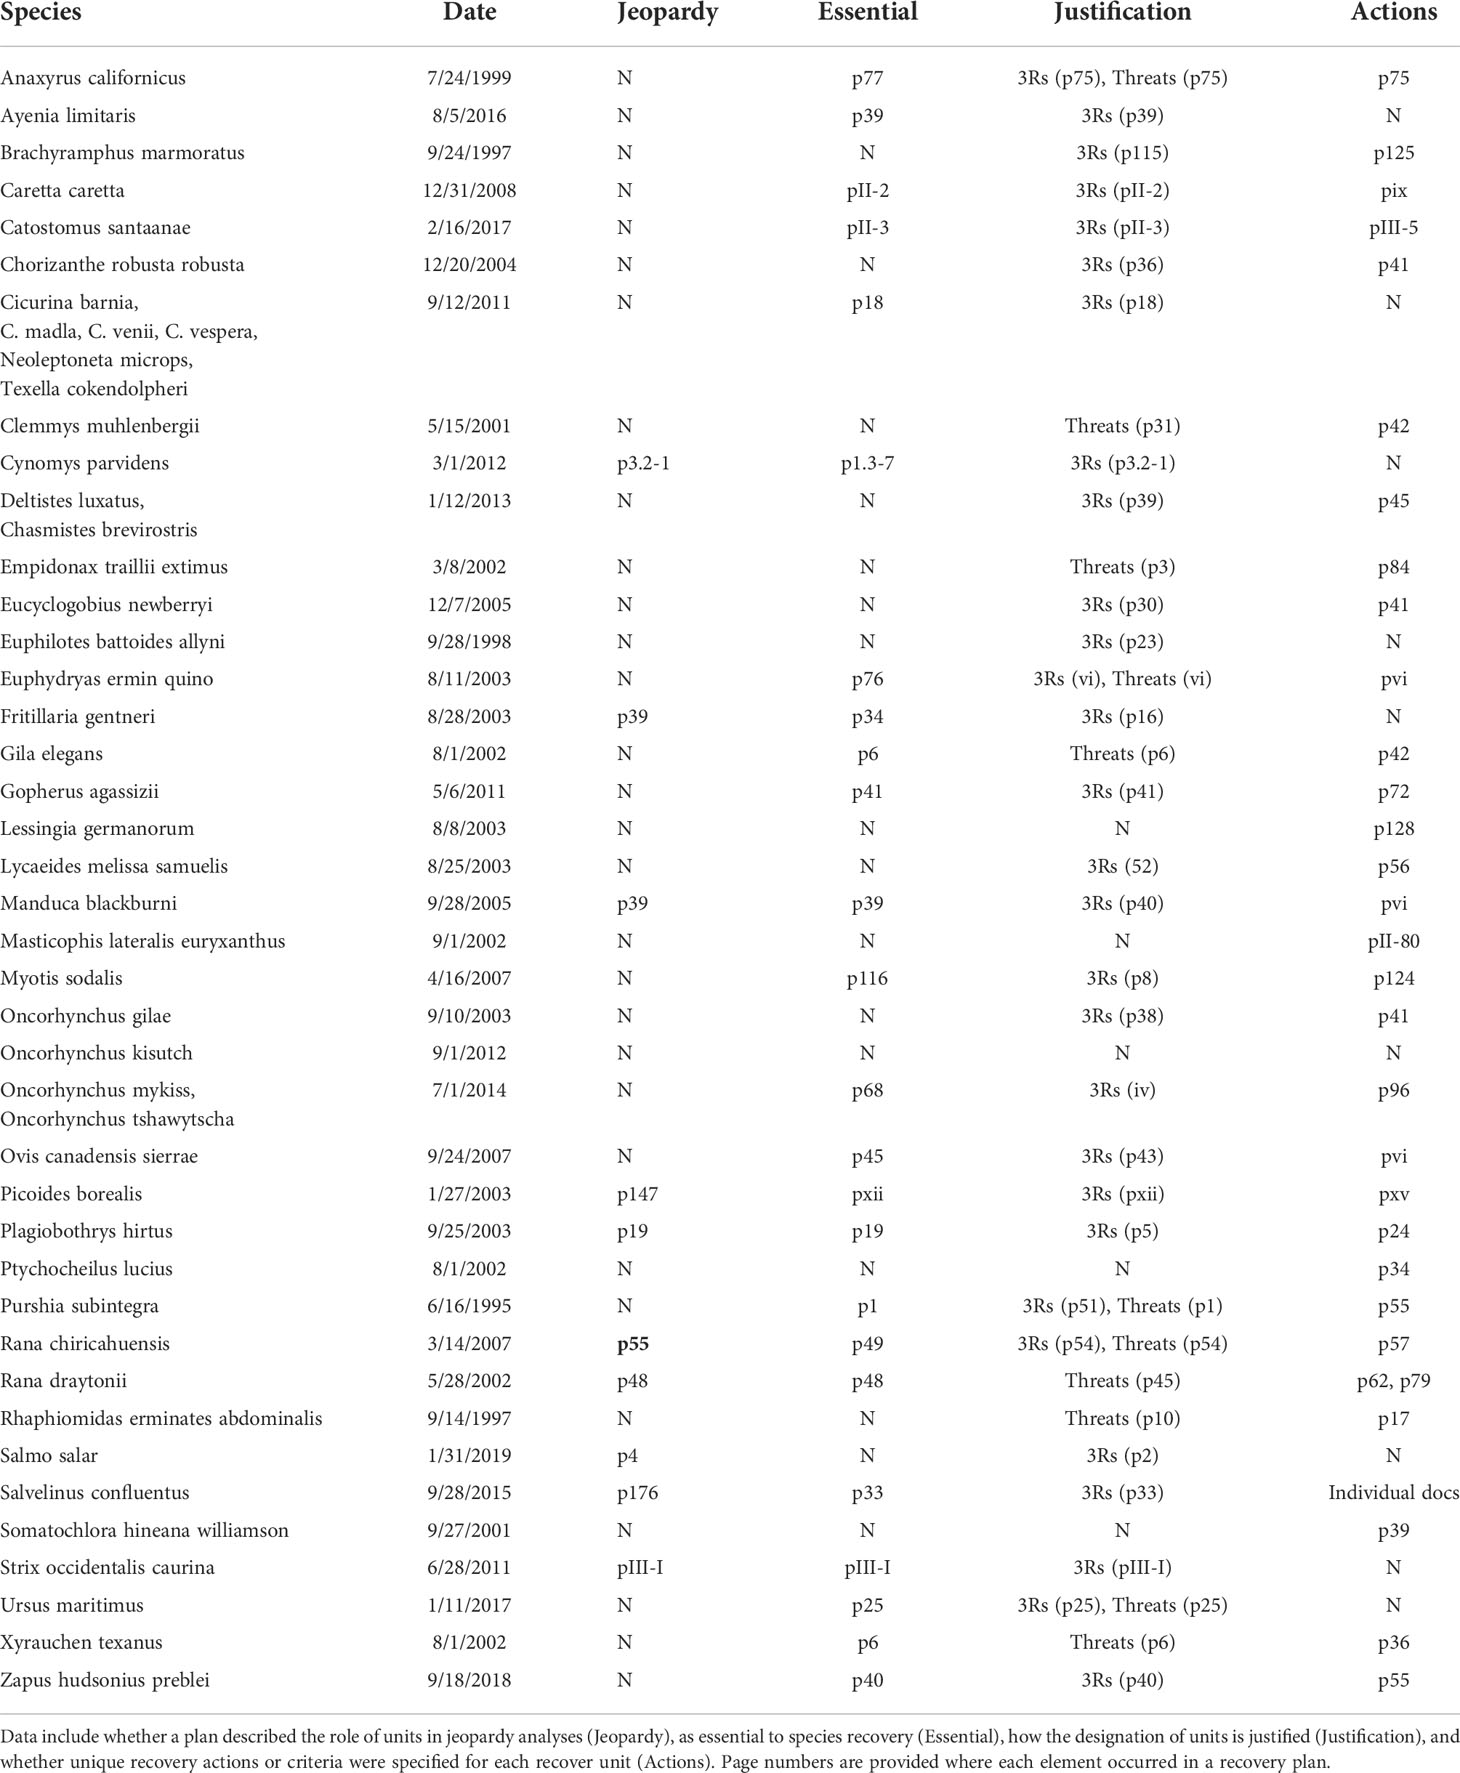
Table 2 Summary of details related to ESA implementation provided in recovery plans designating recovery units.
We read 216 BiOps from 32 different FWS field offices that could have considered recovery units in jeopardy determinations. Of these, 62% mentioned the existence of recovery units for the relevant species. Of those BiOps, 67% used recovery units in the jeopardy analysis. Overall, 42% of BiOps that could have used recovery units in the jeopardy analysis did so explicitly. These rates varied by taxa and FWS office . The odds of recovery units being mentioned in BiOps decreased (β = -3.24*10-4 ± 7.92*10-5, p< 0.001) with time. On average, the odds of mention drop to 1 (i.e., 50% chance) after 12 years. The odds that recovery units were used in jeopardy analysis also decreased (β = -2.153*10-4 ± 7.48*10-5, p = 0.004) over time, dropping to 1 after 5 years on average (Figure 4). A post-hoc test for correlation indicated that species with high probability of recovery unit designation were also more likely to have their recovery units mentioned (r = 0.63, p = 0.09) and used (r = 0.74, p = 0.036) during consultation (Figure 4).
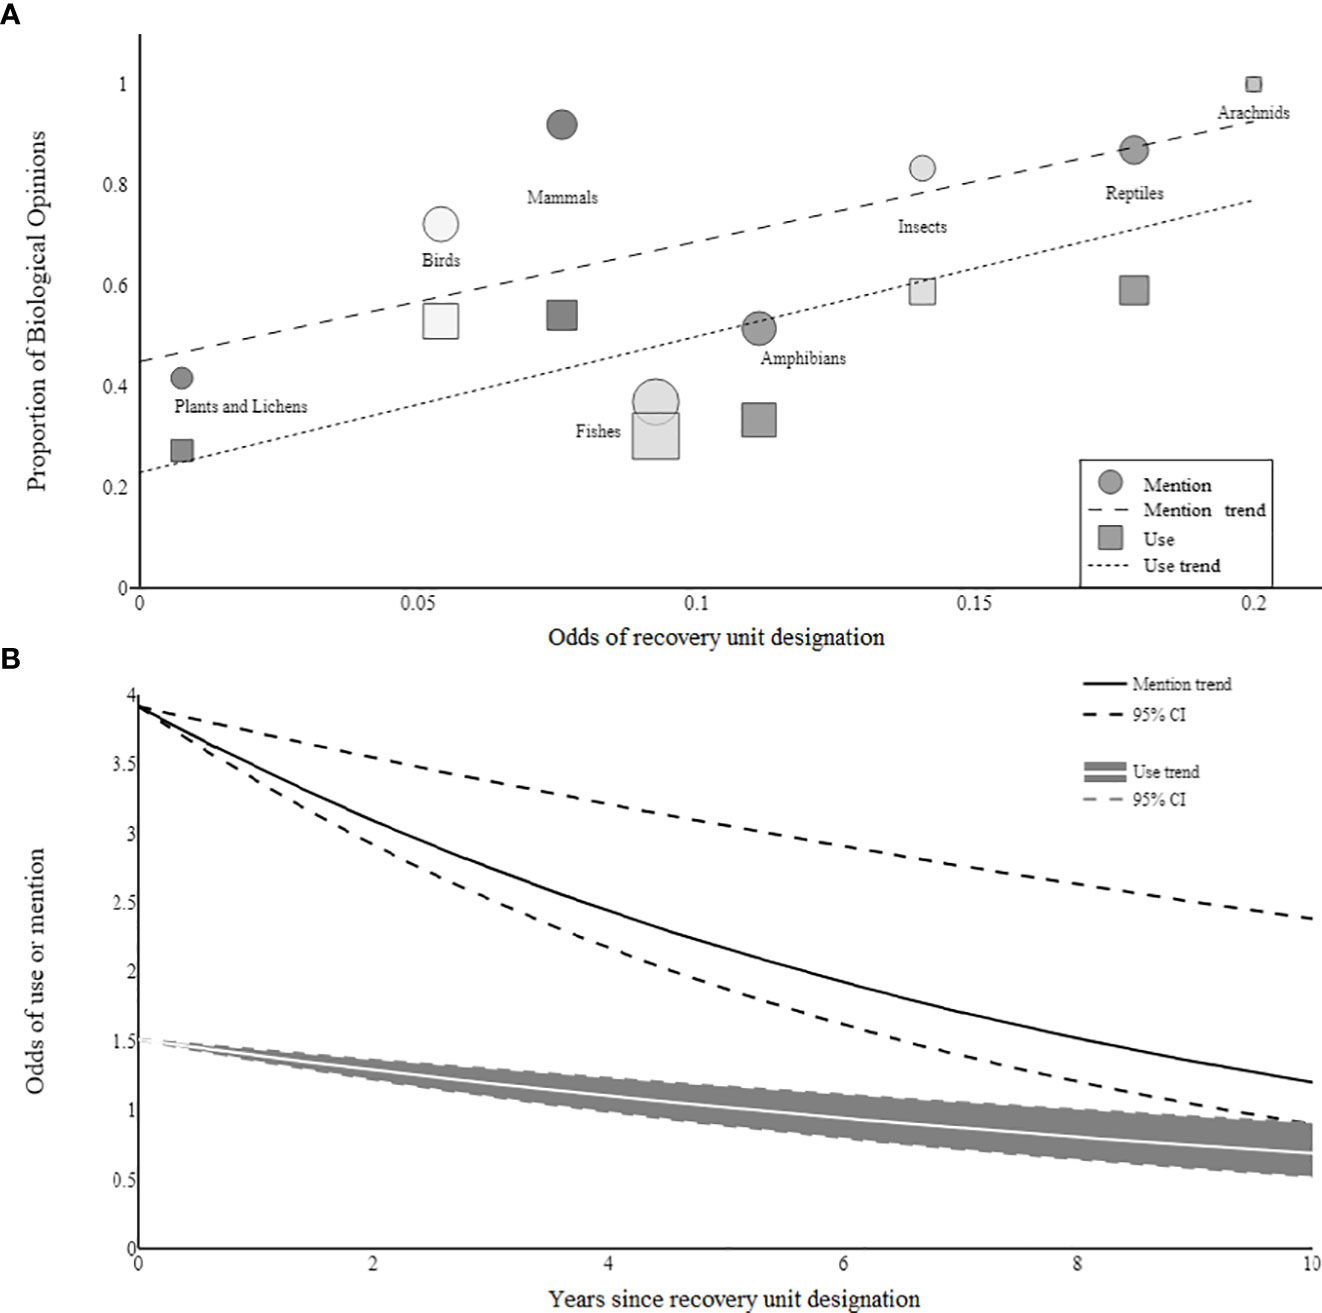
Figure 4 Recovery unit consideration in ESA consultation changed over time and among taxonomic groups. Plot displays (A) the proportion of biological opinions (BiOps) in which recovery units were mentioned or used as a function of the odds that recovery units were designated per taxonomic group. Marker size is proportional to the number of BiOps evaluated for each taxonomic group. Dashed and dotted lines show the linear relationship between odds of unit designation and recovery unit mention and use, respectively, in BiOps. Curves in (B) show the odds that recovery units were mentioned and used during Sec. 7 consultation over time, as estimated by logistic regression. Confidence intervals around estimated slopes are indicated by dotted lines.
Recovery progress
Of the 49 species with recovery units, 24 had at least one five-year review conducted after the species’ recovery units were established. Of these 24 reviews, recovery units were explicitly mentioned for all but one species (Manduca blackburnii). For these species, population statuses and recovery criteria were evaluated and reported by recovery unit. The frequency of species improvement, indicated by changes in recovery priority number, was higher (p< 0.01) among species with recovery units (17.4%), than the rate observed among all five-year reviews (8.6%), as determined by bootstrapping.
Discussion
Recovery units are an existing tool under the ESA that provide flexibility and potentially stronger conservation measures for listed species. Units can be used to refine recovery criteria within a species’ range, and in theory better align jeopardy analyses during ESA Section 7(a)(2) consultations (‘consultations’) with the recovery goals for a species. Here we analyzed recovery plans, consultations, and five-year reviews to characterize how recovery units have been designated and used under the ESA. Recovery units were designated for only 2.9% of U.S. listed species (as of January 2018), and our analyses indicated common characteristics among species receiving recovery unit designation. Species with a greater number of genetic studies and larger range size were more likely to receive recovery units. These criteria may not have been used explicitly by Service biologists during recovery plan development, but rather reflect those species that are inherently more likely to match the description (i.e., ‘geographic subsets’) and purpose (i.e., ‘preserve genetic robustness’) of recovery units in the Recovery Handbook. These patterns suggest the influence of guidelines presented in the recovery planning document. Taxonomic biases, as well as spatial and temporal variation in the designation and consideration of recovery units indicate opportunities to improve standardization in how this tool is used. Conceptually, and some empirical evidence suggest benefits of using recovery units, so rectifying these inconsistencies could improve species recovery under the ESA.
Overlooking recovery units during consultation could undermine species recovery, as consultations are one of the primary ways the ESA protects listed species. The ability to consider how an action affects a species at a refined geographic scale during consultation is one of the primary benefits that recovery units provide. Some FWS staff expressed concern that recovery units would force biologists to call jeopardy, while others doubted that recovery units would ever actually be used as the basis for a jeopardy determination – indicating a lack of clarity regarding their implications. For some extremely wide-ranging species (e.g., Northern spotted owl) each recovery unit still covers a large enough area such that the great majority of federal actions are not extensive enough to seriously affect the entire unit. However, such scenarios do not explain the observed low proportion of biological opinions (BiOps) written during consultation that evaluated the effects of a proposed action on recovery units. For recovery units to be used to improve protection and recovery of listed species, FWS will at a minimum need to train staff more clearly and consistently on their designation and use. One way to increase the application of recovery units would be for the Services to more frequently emphasize in recovery plans the use of recovery units as an important unit of jeopardy analysis during consultations. We found only 10 out of 40 plans made the connection to jeopardy analysis explicit (Table 2). Although jeopardy has rarely been called during consultations, the Services are able to use this process to negotiate conservation measures with regulated entities to avoid jeopardy (Malcom and Li, 2015; Evans et al., 2019). Even absent a jeopardy determination, the smaller geographic unit of analysis provided by recovery units may enable more conservation benefits.
We found some evidence that recovery units were associated with improved species recovery. Greater frequency of improvement in recovery priority numbers among species with recovery units suggests these species exhibited either greater demographic improvement or reduction in threats, compared to species without recovery units. Considering that recovery units were inconsistently used during consultation, the impact of recovery units on recovery could potentially be even greater than observed. The relationship between recovery units and species recovery is likely mitigated by many factors. For example, species that exist primarily on federal lands might be expected to show greater status improvement than those on primarily private land because of differences in how the ESA is implemented in these contexts (Eichenwald et al., 2020), and recovery units have been designated in both contexts. A larger sample of species status assessments would be needed to conduct an analysis of recovery that accounts for other variables. Additionally, recovery priority numbers are an imperfect means by which to assess species conservation status (Malcom et al., 2016), and our inferences are limited by the coarse nature of RPNs for assessing species status. However, they were the only dataset available that provide an extensive, consistent means by which to quantify listed species recovery. Quantitative population data and monitoring reports, such as those provided in the 2012 Utah prairie dog five-year review, or a consistent key for scoring threat and demography status, would allow for more robust assessment of the effect on both recovery units and listed species recovery (Malcom et al., 2016).
Assuming there are benefits to recovery unit designation, then objective criteria for additional designation could help extend this benefit to other applicable species. The listed species without a final recovery plan (491 as of January 2018) provide perhaps the best opportunity to designate recovery units for appropriate species. Since January 2018, we are aware of only two new species that have had recovery units designated. Three units are mentioned in the 2019 revision of the Texas blind salamander (Typhlomolge rathbuni) recovery plan, and five units are mentioned in the 2022 revision of the Houston toad (Anaxyrus houstonensis) recovery plan. Thresholds in important characteristics identified by classification tree analyses can be used to identify additional species that would be consistent with those for which the Services have historically provided recovery units. Our results showed that species in the upper 30th percentiles of range size relative to taxonomic means, and upper 27th percentile of annually adjusted genetic citation rate, would be consistent with current recovery unit designation patterns. These results do not allow for an inference of causation, and it is unclear whether these criteria represent a best practice. Thus, many additional species not fitting this profile might also benefit from recovery units. Plant species especially may benefit from expanded use of recovery units. They receive fewer protections under the ESA, less recovery funding than animals (Negron-Ortiz, 2014; Gerber, 2016), and were the least likely taxon to have recovery units designated or used (Figure 4A). Thus, consistent use of recovery units among plants could yield the greatest marginal improvement in recovery among all taxa.
Patterns in recovery unit designation and application suggest inconsistencies in how this recovery tool is used within the Services. We found differences among FWS offices in the rate of recovery unit designation and their inclusion in BiOps. This variation was corroborated by our interviews with FWS staff who expressed differing views on recovery units. For instance, some staff hesitated to designate units because doing so may impede the delisting of species due to recovery if all but one unit has met recovery criteria. Others thought recovery units should be applied liberally. In our review of recovery plans, inconsistent language at times obfuscated the existence of recovery units. For instance, recovery plans for Evolutionarily Significant Units (equivalent to DPS [NMFS, 1991]) of Pacific salmonids focus on ‘diversity groups.’ While these plans explicitly state diversity groups serve as recovery units, this connection could easily be missed. Consistent language in recovery plans may be important given patterns indicating variation in staff familiarity with recovery units can affect their use. Following designation for a given species, recovery units became less likely to be considered during consultation over time (Figure 4B). Several FWS staff noted that recovery units were likely to be used during consultation if recovery planning training had been completed recently, or a species’ recovery team happened to be familiar with recovery units. Thus, the observed decline in application over time might be expected as an initial emphasis on the use of recovery units fades or as new staff become involved with a species. Together, these patterns in space and time suggest a need for standardized practices and established institutional knowledge regarding the use of recovery units.
Our examination of recovery plans indicated that the Services generally provide thorough and robust explanations for the designation and importance of recovery units. Recovery plans most often cited the importance of maintaining multiple sub-segments of a species’ population to preserve diversity and provide resilience, and FWS staff that supported the use of recovery units expressed similar reasons to designate recovery units. These explanations for using and delineating recovery units closely matched the reasons in the Recovery Handbook (e.g. ‘genetic robustness’, ‘demographic robustness’, ‘important life-history stages’). While the guidance provided in the handbook leaves room for interpretation with the phrase ‘or some other feature necessary for long-term sustainability of the entire listed entity,’ the Services primarily use the specific examples identified. Thus, it seems the language in the Recovery Handbook can shape how the Services use recovery units to uphold stronger protection for species. Updates to the handbook present a potential opportunity to expand the use of recovery units to offer more robust protection. For instance, population fragmentation (Crooks et al., 2017) and climate change (Thomas et al., 2004; Díaz et al., 2019) are two of the most often cited threats to species persistence, aside from direct habitat loss. As connectivity (Donaldson et al., 2019) and the capacity to adapt to climate change are clearly scientifically supported as necessary for long-term persistence, the Services might use recovery units to afford extra protection in areas of a species’ range providing connectivity and future capacity for range shifts.
Finally, we provide an important step towards achieving consistent implementation of recovery units by publishing spatially referenced GIS data for recovery units (Evans, 2019). To our knowledge, unit maps exist only as static images in recovery plans. Accessible, geocoded maps can make it easier for the Services to consider recovery units during a jeopardy analysis. Currently, an inability to locate action areas within recovery units may contribute to the disparity between the rate at which recovery units are mentioned in BiOps and the rate at which they are used in jeopardy analysis, as spatial data is more essential to the latter. GIS data for recovery units also provides a critical basis for further analyses investigating the potential role of recovery units in ESA implementation and species recovery. For example, variation in a species’ vulnerability or stability among recovery units can be informed by analyzing the distribution of public versus private land ownership, and critical habitat between units. Additionally, the distribution of spatially referenced consultation locations among units could inform recommendations for adjusted levels of authorized take and disturbance on a per unit basis. These kinds of analyses are important to evaluate the utility of recovery units, and how they can continue to be used to improve endangered species conservation.
Data availability statement
The datasets presented in this study can be found in online repositories. The names of the repository/repositories and accession number(s) can be found below:. Open Science Framework - Recovery Units Under the Endangered Species Act DOI: 10.17605/OSF.IO/HNR46 https://osf.io/hnr46/.
Author contributions
MJE contributed to study design, and led data collection, statistical analysis, and manuscript writing. JWM led study design, and contributed to data collection, analysis, and manuscript writing. All authors contributed to the article and approved the submitted version.
Acknowledgments
We thank Services personnel for their time talking us through their views on and approaches to using recovery units in ESA implementation.
Conflict of interest
The authors declare that the research was conducted in the absence of any commercial or financial relationships that could be construed as a potential conflict of interest.
Publisher’s note
All claims expressed in this article are solely those of the authors and do not necessarily represent those of their affiliated organizations, or those of the publisher, the editors and the reviewers. Any product that may be evaluated in this article, or claim that may be made by its manufacturer, is not guaranteed or endorsed by the publisher.
References
Akcakaya H. R., Resit G. M., Doncaster C. P. (2007). “The role of metapopulations in conservation,” in Key Topics in Conservation Biology, Eds. Mcdonald D.W., Service K. (Oxford, UK. Blackwell Publishing), 64–84.
Connolly M. A., Liang K.-Y. (1988). Conditional logistic regression models for correlated binary data. Biometrika 75, 501–506. doi: 10.1093/biomet/75.3.501
Core Team R. (2018) R: A language and environment for statistical computing. Available at: https://www.R-project.org/.
Crooks K. R., Burdett C. L., Theobald D. M., King S. R. B., di Marco M., Rondinini C., et al. (2017). Quantification of habitat fragmentation reveals extinction risk in terrestrial mammals. Proc. Natl. Acad. Sci. U.S.A. 114, 7635–7640. doi: 10.1073/pnas.1705769114
Díaz S., Settele J., Brondízio E. S., Ngo H. T., Agard J., Arneth A., et al. (2019). Pervasive human-driven decline of life on earth points to the need for transformative change. Sci. (1979) 366, eaax3100. doi: 10.1126/science.aax3100
Donaldson L., Bennie J. J., Wilson R. J., Maclean I. M. D. (2019). Quantifying resistance and resilience ot local extinction for conservation prioritization. Ecol. Appl. 29 (8), e01989. doi: 10.1002/eap.1989
Eichenwald A. J., Evans M. J., Malcom J. W. (2020). US Imperiled species are most vulnerable to habitat loss on private land. Front. Ecol. Environ. 18 (8), 439–446. doi: 10.1002/fee.2177
Evans M. J. (2019). Recovery units under the US endagered species act. Open Sci. Framework p27. doi: 10.17605/OSF.IO/HNR46
Evans D. M., Che-Castaldo J. P., Crouse D., Davis F. W., Epanchin-Niell R., Flather C. H., et al. (2016). Species recovery in the united states: Increasing the effectiveness of the endangered species act. Issues Ecol. 20, 27.
Evans M. J., Malcom J. W., Li Y. W. (2019). Novel data show expert wildlife agencies are important to endangered species protection. Nat. Commun. 10, 1–9. doi: 10.1038/s41467-019-11462-9
GBIF: The Global Biodiversity Information Facility (2020). Available at: https://www.gbif.org/what-is-gbif.
Gerber L. R. (2016). Conservation triage or injurious neglect in endangered species recovery. Proc. Natl. Acad. Sci. U.S.A. 113, 3563–3566. doi: 10.1073/pnas.1525085113
Government Accountability Office (2009). Endangered species act: The U.S. fish and wildlife service has incomplete information about effects on listed species from section 7 consultations (Washington, DC: U.S. Government Accountability Office).
Hanski I., Simberloff D. (1997). “The metapopulation approach, its history, conceptual domain, and application to conservation,” in Metapopulation biology. Eds. Hanksi I., M., Gilpin E. (Cambridge, MA: Academic Press), 5–26. doi: 10.1016/B978-012323445-2/50003-1
Hothorn T., Hornik K., Zeileis A. (2006). Unbiased recursive partitioning: A conditional inference framework. J. Comput. Graphical Stat 15, 651–674. doi: 10.1198/106186006X133933
Li Y.-W., Malcom J. W., Che-Castaldo J. P., Neel M. C. (2020). Recovery plans need better science to support decisions that allow species to decline in abundance but be recovered. bioRxiv 2020, 2.27.966101. doi: 10.1101/2020.02.27.966101
Malcom J., Carter A. (2021). Better representation is needed in U.S. endangered species act implementation. Front. Conserv. Sci. 0. doi: 10.3389/FCOSC.2021.650543
Malcom J. W., Li Y. W. (2015). Data contradict common perceptions about a controversial provision of the US endangered species act. Proc. Natl. Acad. Sci. U.S.A. 112, 15844–15849. doi: 10.1073/pnas.1516938112
Malcom J. W., Li Y. W. (2018). Missing, delayed, and old: The status of ESA recovery plans. Conserv. Lett. 11, e12601. doi: 10.1111/conl.12601
Malcom J. W., Webber W. M., Li Y. W. (2016). A simple, sufficient, and consistent method to score the status of threats and demography of imperiled species. PeerJ 2016, e2230. doi: 10.7717/PEERJ.2230/SUPP-4
Neel M. C., Leidner A. K., Haines A., Goble D. D., Scott J. M. (2012). By the numbers: How is recovery defined by the US endangered species act? BioScience 62, 646–657. doi: 10.1525/bio.2012.62.7.7
Negron-Ortiz V. (2014). Pattern of expenditures for plant conservation under the endangered species act. Biol. Conserv. 171, 36–43. doi: 10.1016/j.biocon.2014.01.018
NMFS (1991). Policy on applying the definition of species to under the endangered species act to pacific salmon. Federal Register 56 (224), 58612. Available at: https://archives.federalregister.gov/issue_slice/1991/11/20/58608-58618.pdf#page=5.
NMFS (2020) Recovery planning handbook v1.0. NMFS. Available at: https://s3.amazonaws.com/media.fisheries.noaa.gov/2020-10/NMFS%20Recovery%20Handbook_10-02-2020_final_v1.0_508.pdf?null (Accessed August 1, 2022).
Robin X., Turck N., Hainard A., Tiberti N., Lisacek F., Sanchez J.-C., et al. (2011). pROC: An open-source package for r and s+ to analyze and compare ROC curves. BMC Bioinf. 12, 77. doi: 10.1186/1471-2105-12-77
Shaffer M. L., Stein B. A. (2000). “Safeguarding our precious heritage,” in Precious heritage: The status of biodiversity in the united states. Eds. Stein B. A., Kutner L. S., Adams J. S. (New York, NY: Oxford University Press), 301–321.
Sullivan B. L., Wood C. L., Iliff M. J., Bonney R. E., Fink D., Kelling S. (2009). eBird: A citizen-based bird observation network in the biological sciences. Biol. Conserv. 142, 2282–2292. doi: 10.1016/j.biocon.2009.05.006
Thomas C. D., Cameron A., Green R. E., Bakkenes M., Beaumont L. J., Collingham Y. C., et al. (2004). Extinction risk from climate change. Nature 427, 145–148. doi: 10.1038/nature02121
U.S. Census Bureau (2019). TIGER/Line: Counties (and equivalent). (Washington, DC: U.S. Census Bureau).
USFWS (1983). Endangered and threatened species listing and recovery priority guidelines. Federal Register 48 (184), 43098–43105. Available at: https://archives.federalregister.gov/issue_slice/1983/9/21/43096-43105.pdf#page=3.
USFWS (1996). Policy regarding the recognition of distinct vertebrate population segments under the endangered species act. Federal Register 61 (26), 4722–4725. Available at: https://www.govinfo.gov/content/pkg/FR-1996-02-07/pdf/96-2639.pdf.
USFWS, and NMFS (1998) Endangered species act consultation handbook. Available at: https://www.fws.gov/sites/default/files/documents/endangered-species-consultation-handbook.pdf.
Keywords: consultation, policy, recovery, section 7, threats
Citation: Evans MJ and Malcom JW (2022) Recovery units under the Endangered Species Act should be used more widely. Front. Conserv. Sci. 3:1018159. doi: 10.3389/fcosc.2022.1018159
Received: 12 August 2022; Accepted: 17 October 2022;
Published: 07 November 2022.
Edited by:
Aaron Haines, Millersville University of Pennsylvania, United StatesReviewed by:
Paul M Severns, University of Georgia, United StatesPeter Moyle, University of California, Davis United States
Copyright © 2022 Evans and Malcom. This is an open-access article distributed under the terms of the Creative Commons Attribution License (CC BY). The use, distribution or reproduction in other forums is permitted, provided the original author(s) and the copyright owner(s) are credited and that the original publication in this journal is cited, in accordance with accepted academic practice. No use, distribution or reproduction is permitted which does not comply with these terms.
*Correspondence: Michael J. Evans, mevans@chesapeakeconservancy.org
†Present addresses: Michael J. Evans, Conservation Innovation Center, Chesapeake Conservancy, Annapolis, MD, United States
Jacob W. Malcom, Environmental Science and Policy Dept., George Mason University, Fairfax, VA, United States