Community livelihoods and forest dependency: Tourism contribution in Nyungwe National Park, Rwanda
 Providence Akayezu1*
  Isidore Ndagijimana2 Marie Claire Dushimumukiza3
  Katie P. Bernhard4
  Thomas A. Groen5
- 1Global Challenges Programme, African Leadership University, Kigali, Rwanda
- 2Department of Nature Conservation, Integrated Polytechnic Regional College of Kitabi, Nyamagabe, Rwanda
- 3East Africa Office, Horwath HTL, Kigali, Rwanda
- 4Department of Recreation, Park and Tourism Management, Pennsylvania State University, University Park, PA, United States
- 5Department of Natural Resources, Faculty of Geo-information Science and Earth Observation (ITC), University of Twente, Enschede, Netherlands
Introduction: Communities living adjacent to protected areas in Africa are characterized by high poverty rates and their well-being often depends on park resources. This often results in forest degradation and decline in wildlife populations, for example due to illegal hunting for bush meat. To counter this challenge in Rwanda, a tourism revenue sharing program was initiated in 2005, with 5% (doubled to 10% in 2017) of the park gate fees invested in community development projects. We evaluated the effectiveness of this tourism revenue sharing from 2005 to 2017, targeting communities adjacent to Nyungwe National Park located in south-western Rwanda.
Methods: We used questionnaires addressed to members of community associations and local government in 24 sectors around Nyungwe National Park. Additionally, data on illegal resource use and socio-economic status of the surrounding communities were obtained to quantitatively triangulate and draw insights from communities’perceptions. Using spatial analyses and spatial regression, we mapped trends in illegal activities relative to socio-economic characteristics.
Results and discussion: Both the qualitative and quantitative results indicate that the tourism revenue sharing program has not fully succeeded in improving community well-being around Nyungwe National Park. The tourism revenue sharing can consider targeting areas that demonstrate more need and reassessing prioritization of interventions supported by the program to achieve both poverty reduction around Nyungwe National Park and improved conservation outcomes in this protected area.
1 Introduction
East African countries such as Rwanda generate a significant percentage of their national budgets from tourism (Nielsen and Spenceley, 2011; Republic of Rwanda, 2014). Indeed, the Government of Rwanda is committed to the development of the tourism sector, and, although challenged by the COVID-19 pandemic, the number of visitors has been generally increasing over the past decade (Republic of Rwanda, 2014; Rwanda Development Board, 2018). Visitors pay fees for specific activities in parks, such as mountain gorilla and chimpanzee trekking, while outside of protected areas and parks, tourists observe the scenic landscapes of the country and learn about local history and culture, with fees for some attractions or tours (Table 1 shows fees collected in Nyungwe National Park from 2010 to 2017). According to the World Travel & Tourism Council (WTTC), in 2018, tourism and travel contributed to 14.9% of Rwanda’s total Gross Domestic Product (GDP) (WTTC, 2019). This adds value to the national economy, but also has the potential to contribute considerable direct benefits to the local people living adjacent to the touristic sites (Spenceley et al., 2010).
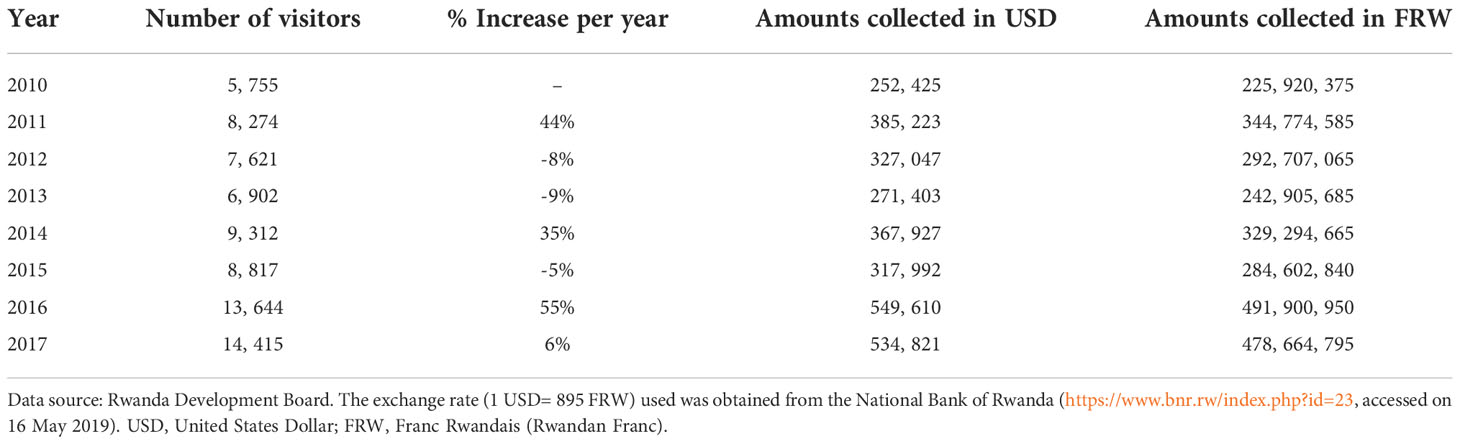
Table 1 The number of tourists and revenues generated in Nyungwe National Park from 2010 to 2017.
In Rwanda, the touristic attractions, especially protected areas, have high biodiversity value but are commonly surrounded by communities with high population density that are often poor (Masozera and Alavalapati, 2004; Plumptre et al., 2004; Hartter et al., 2016; Sabuhoro et al., 2017). While sustainable tourism in protected areas is achieved when biological resources are also properly managed (Leung et al., 2018), the poor communities near national parks in developing countries such as Rwanda rely heavily on harvesting resources from protected areas; for instance, fuel wood and bush meat for livelihood purposes (Masozera and Alavalapati, 2004; Sunderlin et al., 2005; Bernhard et al., 2020). In order to create a more mutually beneficial situation (i.e., increase the park protection, while ensuring community involvement in conservation); a tourism revenue sharing program has been introduced in Rwanda, as it has across sub-Saharan Africa and other high-biodiversity regions in the world (ORTPN, 2005; Ahebwa et al., 2012; Sabuhoro et al., 2017). With this initiative, the communities living adjacent to protected areas receive a percentage of the revenue from local tourism, and it is posited that this economic benefit may result in improved development, including food and/or economic security, and therefore reduce reliance on resources from the protected area (Bookbinder et al., 1998).
To achieve these goals in Rwanda, the tourism revenue sharing program was initiated in 2005 by the Rwanda Development Board [former Office Rwandais du Tourisme et des Parcs Nationaux (ORTPN)], the authority governing protected areas and national parks. In this program, originally 5% of the foreign exchange earnings from park visitation (gate fees and trekking permits) are returned to communities living adjacent to national parks (Nielsen and Spenceley, 2011; USAID, 2014); this percentage was increased to 10% in 2017. Through continuous support to communities, the tourism revenue sharing program is expected to contribute to reducing the dependency on park resources by funding projects which improve community-based enterprises and increase communities’ participation in park conservation (Mulindahabi et al., 2011). The tourism revenue sharing can therefore supplement the direct benefits from tourism, including employment in the parks as guides or porters, tour operators and hotels that provide jobs to communities adjacent to national parks. The indirect tourism benefits comprise of the tourism revenue sharing itself and support to community projects and basic infrastructure (Spenceley et al., 2010; Munanura et al., 2020).
The types of projects to be supported are selected through a process that involves community associations (cooperatives), the local government (sector, district) and the park management (ORTPN, 2005).
While the tourism revenue sharing programs have shown positive impacts in some parts of the world (Ahebwa et al., 2012; Leung et al., 2018; Spenceley et al., 2019), researchers continue to question the contribution of tourism to the development and economic growth of poor communities living near rich biodiversity areas (Bookbinder et al., 1998; Isaacs, 2000; Sabuhoro et al., 2017). Around Volcanoes National Park in northern Rwanda, researchers have found that some projects fail to reduce people’s dependency on park resources (Sabuhoro et al., 2017; Bernhard et al., 2020).
This study contributes to this growing literature, identifying linkages between community livelihoods, tourism revenue sharing, and trends in forest dependency in Rwanda specifically, by presenting data from Nyungwe National Park located in south-western Rwanda. The study objectives are the following: (1) determine communities’perceptions on the tourism revenue sharing program; (2) assess spatio-temporal trends in illegal forest dependency activities in the park relative to tourism revenue funding; and (3) explore the tourism revenue sharing projects’ socio-economic impacts over the 13-year period from its inception in 2005 to 2017. The study pools the tourism revenue sharing budget allocation into two periods for analysis: 2005-2011 and 2012-2017. The period of 2005-2011 corresponds to when the program on tourism revenue sharing started until its first formal evaluation by the Wildlife Conservation Society (WCS, 2012), and the period of 2012-2017 constitutes the period after evaluation. During the first period (2005-2011), the percentage of the tourism revenue sharing was at 5% of the total gross earned in each park; but this percentage was increased to 10% in 2017 to improve the funding allocated to community projects around national parks in Rwanda.
2 Materials and methods
2.1 Study area
This study was conducted in and around Nyungwe National Park, a tropical montane rainforest located in south-western Rwanda (2° 0’ 0’’ S -3° 0’ 0’’ S and 29° 0’ 0’’ E -29° 30’ 0’’ E). The park covers a total area of approximately 1,019 km2, including the fragment of Cyamudongo forest (i.e., Nyungwe: ca 1,015 km2; Cyamudongo: ca 4 km2). Towards the south, Nyungwe National Park is connected with Kibira National Park in Burundi, and the two are part of the largest remnant Afromontane forests in Central Africa (Plumptre et al., 2002). Nyungwe National Park consists of different rainforest habitats, savannah, and swamps, lying on an elevation range of 1,600 m-2,950 m a.s.l and supplying approximately 60% of the water sources to Rwanda (Republic of Rwanda, 2003). The park is an important conservation area as it is home to around 86 mammal species, 280 bird species and 230 tree species (Plumptre et al., 2007). The total number of mammals recorded comprises 13 primate species (Plumptre et al., 2002): including, chimpanzee (Pan troglodytes; endangered), colobus monkey (Colobus angolensis; least concern), blue monkey (Cercopithecus mitis; least concern), l’hoesti’s monkey (Cercopithecus lhoesti; vulnerable) and mangabey (Lophocebus albigena; least concern).
Upon the establishment of Nyungwe as a forest reserve in 1933, tourist and visitor numbers were low and remained so until 2004, when a tourism development strategy was developed (Walpole, 2004). Since 2005, research and conservation activities and park infrastructure have seen substantial improvement, as touristic infrastructure inside and around the park area has been developed and tourist and visitor numbers have steadily increased (Lal et al., 2017). Alongside these developments, a tourism revenue sharing program was established in 2005 with multiple objectives, including, as previously mentioned, community involvement in sustainable conservation and livelihoods improvement (Nielsen and Spenceley, 2011). According to the policy document (ORTPN, 2005), the projects supported through tourism revenue sharing are implemented at the level of the sector (administrative boundary) and they aim at improving community livelihoods, long-term projects, provide jobs to locals and target the most vulnerable communities as beneficiaries. Since the initiation of the tourism revenue sharing in Rwanda, the minimum budget for each project was set at approximately $1,000, while the maximum budget was fixed at $120,000 (ORTPN, 2005).
2.2 Primary data
We used both key informant interviews via questionnaire and focus group discussions (Nyumba et al., 2018), and this approach allowed to optimise time and reach all the targeted communities in the area of interest (Figure 1). We conducted a six-week fieldwork from the 6th May to 13th June 2018. All the 24 administrative sectors around Nyungwe National Park were visited, and data were collected about the benefits of the tourism revenue sharing, perceptions, awareness and livelihoods improvement. Additionally, structured interview questionnaires were distributed to either the sector’s business development officer or the agronomist, and only 19 questionnaires could be completed. The outcomes of this survey with the local government could complement the discussions with communities. In the community associations (cooperatives), we interviewed those who benefit from the tourism revenue sharing program (TRS) and those who had no direct connection with the TRS. This method would allow comparison of the perceptions of local communities having a project in their cell and those without a project in their cell. Two administrative cells in each of the 24 sectors were selected using a stratified random sampling. The data on projects supported through the tourism revenue sharing and the projects locations (sectors, cells) were obtained from the park management and validated by the local administration. In total, 48 cells were selected and 761 community members participated in the focus group discussions. Both men, women and the youth attended; the smallest focus group had four and the largest thirty-three participants. In this article, the term ‘‘community’’ is used to mean a homogenous social structure with shared norms (Agrawal and Gibson, 1999). We used the term ‘‘(local) communities’’ as the plural of ‘‘community’’ and it refers to farmers, villagers living in the same administrative unit and usually all practicing the same economic activity (e.g., agriculture, livestock).
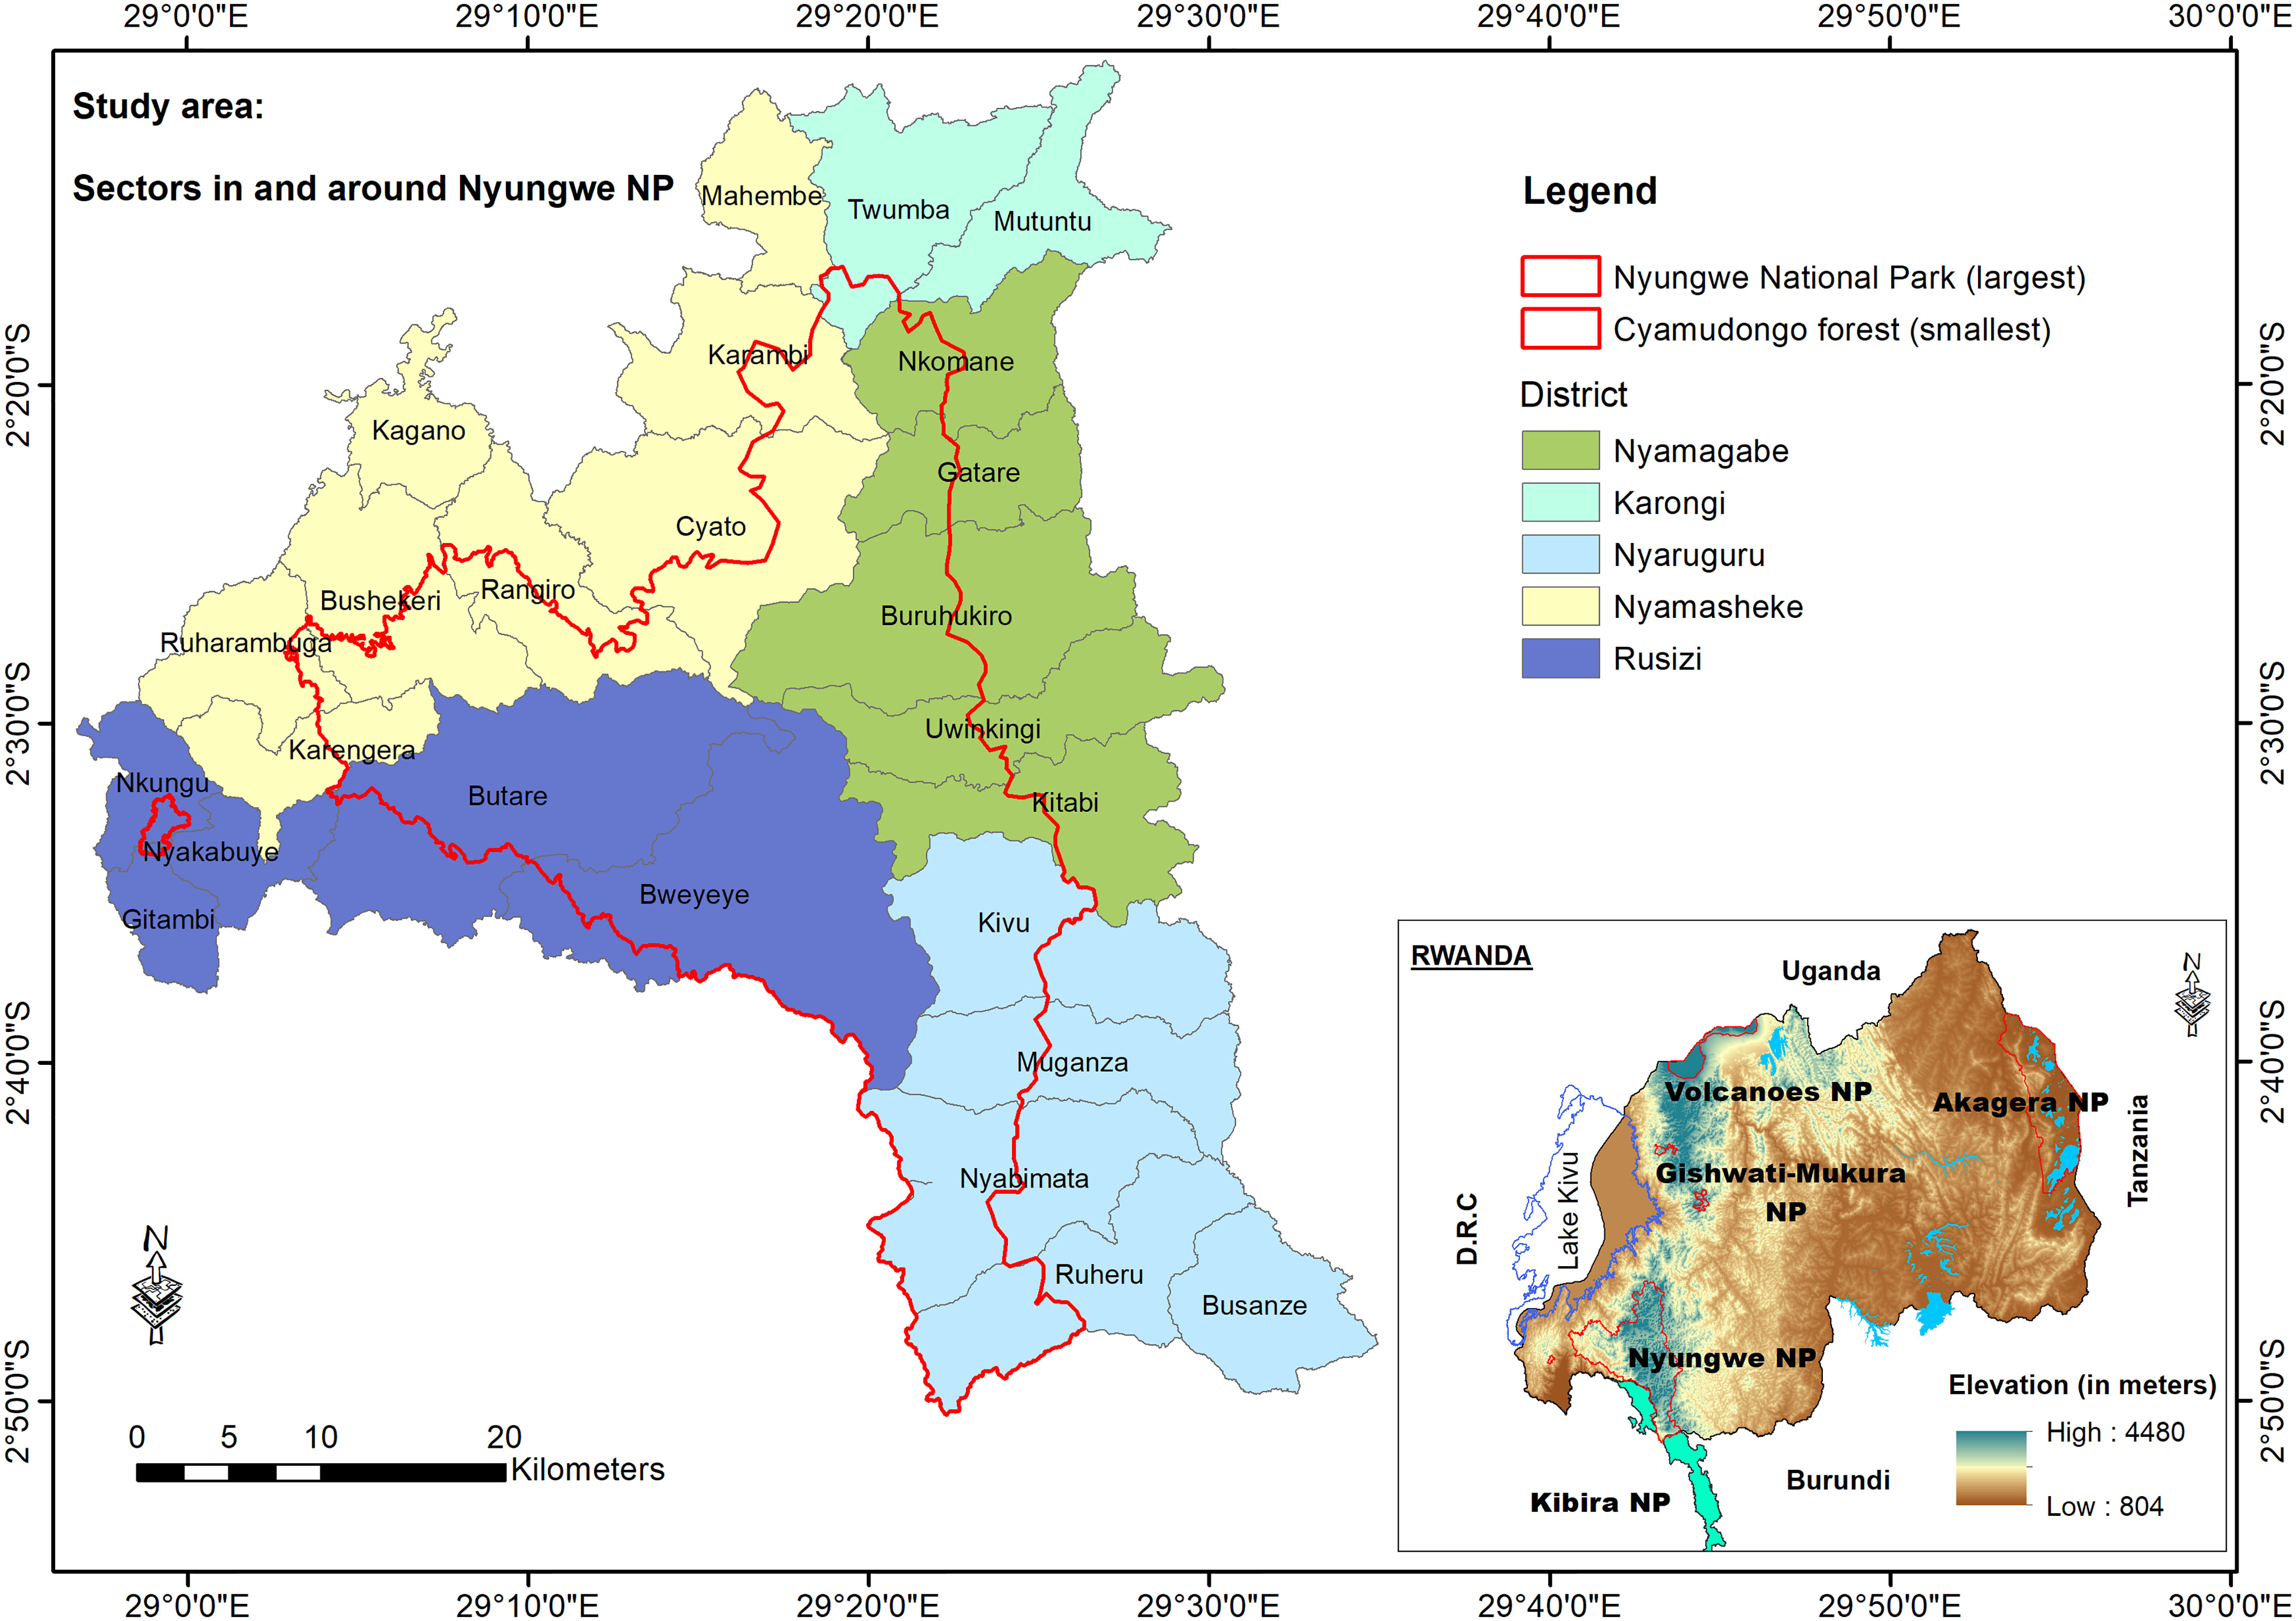
Figure 1 Administrative boundaries of the area of interest: 25 sectors within five districts bordering Nyungwe National Park are the primary spatial unit of quantitative analysis in this study. Cells are the administrative unit within sectors in Rwanda. Only 24 sectors are targeted for tourism revenue sharing (TRS), but we also considered the sector of Kagano, which received TRS funding only once.
2.3 Secondary data
We used three types of secondary data to complement outcomes from key informant interviews and focus group discussions. The data on tourism revenue sharing projects and ranger-based monitoring were obtained from Rwanda Development Board, Nyungwe National Park management. We requested data on socio-economic status of communities living adjacent to the park, and these were shared by the National Institute of Statistics of Rwanda (NISR, 2018). Additional data on population density could be downloaded from AidData GeoQuery (Goodman et al., 2019).
The data on tourism revenue sharing investments in sectors around Nyungwe National Park included 136 total projects supported for all sectors from 2005-2017 and the total annual funding to each of those projects. The funding was in Franc Rwandais (FRW). Although the tourism earnings are mostly in US Dollars, the institution responsible for park management collects all the money for each park and considers the updated exchange rates to convert the tourism budgets in the local currency: FRW. The dataset on ranger-based monitoring contained 93,556 total summed observations of illegal activities recorded in the park and an unbalanced panel aggregated to the 24 sectors to 268 observations (due to dropouts over both time and space) over the period of 2005-2017. The additional socio-economic variables were used as control variables in a regression analysis that estimated the effect of tourism revenue sharing on illegal resource harvesting inside Nyungwe National Park. These variables constisted of population density, household consumption and education variables extracted from the Integrated Household Living Conditions Surveys (EICVs 3, 4 and 5) administered by the National Institute of Statistics of Rwanda. The population density and household consumption were merged by sector and year as indentifiers and provided key socio-economic insights (see Supplementary Materials). Analyses were performed using Stata IC 16, ArcGIS 10.6.1 and GeoDa. Microsoft Excel was used to compile qualitative data.
2.4 Analysis
2.4.1 Project types and funding size
The tourism revenue sharing projects around Nyungwe National Park were classified into six groups: (i) education, (ii) environmental protection, (iii) water, health and sanitation, (iv) basic infrastructure, (v) food security, and (vi) income generating activities (Table 2). Note, the projects were grouped following the same categorization as in other protected areas such as the Volcanoes National Park (Spenceley et al., 2010).
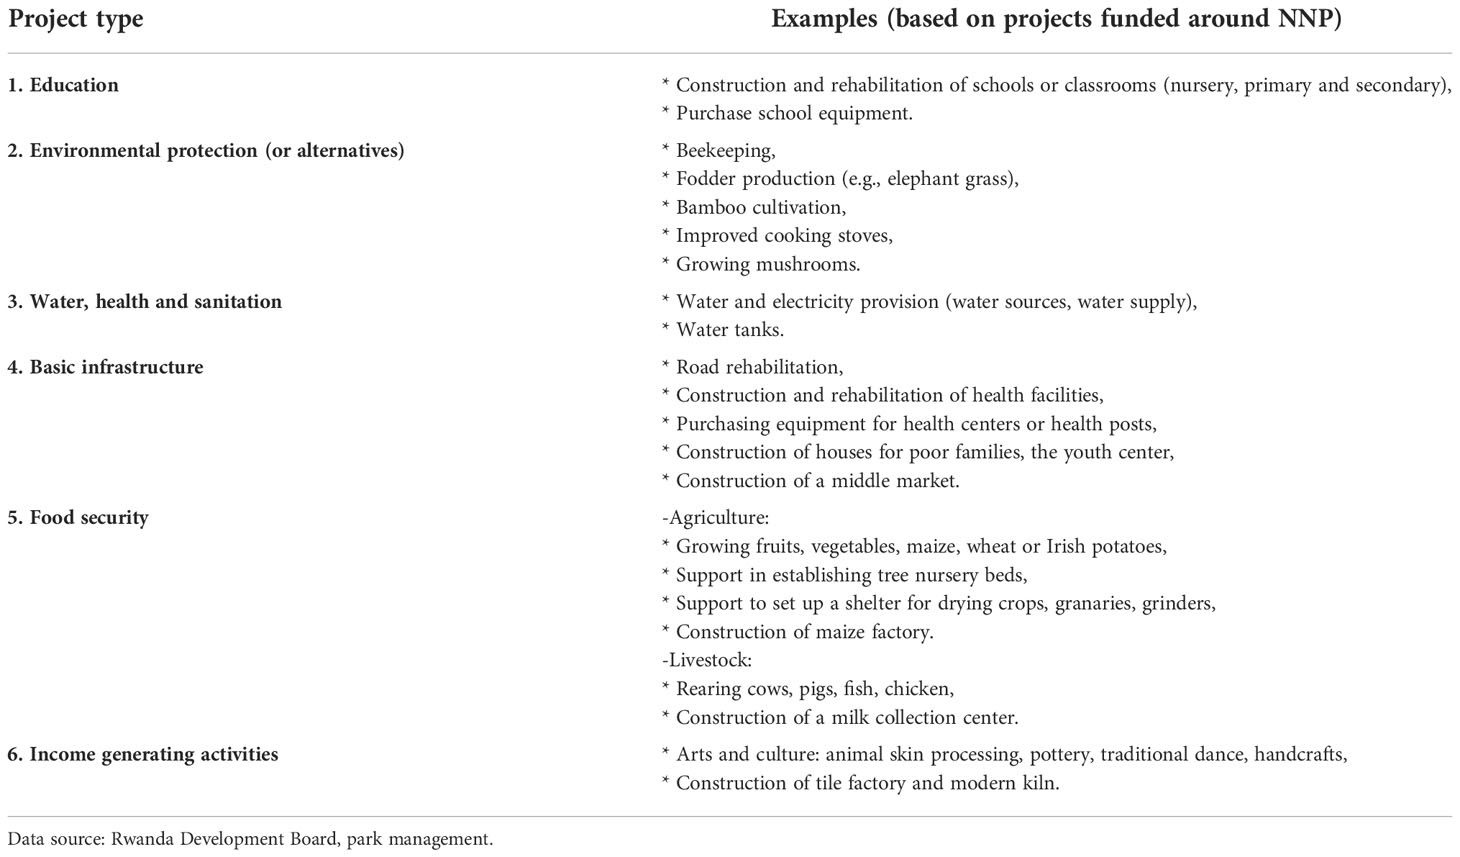
Table 2 Categories of the tourism revenue sharing projects around Nyungwe National Park (NNP), Rwanda.
2.4.2 Communities’ perceptions on the tourism revenue sharing
The focus group discussions targeted one cell per sector that benefit from the tourism revenue sharing (TRS) and one cell that does not receive support from this program. In total 48 cells (2 cells for each of the 24 sectors) constituting 761 focus group discussions were considered for the analysis; including 336 communities who receive support from the TRS and 425 who do not directly benefit. The percentage of ‘Yes’ and ‘No’ responses was determined, and verbatim from some respondents were shared as quotes. The Chi-square test of independence was used to identify whether differences are significant among the views of communities who receive direct support and those who are not supported by the tourism revenue sharing program.
2.4.3 Quantitative analysis: Linking tourism revenue sharing and forest dependency
The quantitative analysis was performed to identify spatial and temporal trends in illegal activities relative to changes in population density, socio-economic behaviors and changes in community livelihoods. The data on illegal activities were first cleaned, then corrected for bias.
Bias presents a key issue with the use of ranger-based monitoring data (Keane et al., 2011). As a law enforcement tool, ranger patrols involve non-random spatial patterns of patrolling and introduce sampling bias. Increasing effort can reduce total illegal activities through deterrence, but also increase the proportion of activities detected (Albers, 2010; Keane et al., 2011; Critchlow et al., 2017; Moore et al., 2018). Preferably, we would account for both ranger effort and coverage using a spatially-extracted variable for proportion of park area covered in patrols. As such kind of data was not available, we calculated as best feasible proxy weighted encounter per unit effort using annual patrol days as the proxy for effort:
where δ is weighted detected encounters in sector s for year t. Encounters is raw encounters in sector s for year t. Effort is proxied by annual number of rangers participating in routine patrols.
In the spatial analysis of tourism revenue sharing relative to forest dependency, we first created kernel density based maps using the point pattern of encounters. This produced raster-based maps visualizing regions with high density of encounters of illegal activity in Nyungwe National Park. Kernel density estimates for illegal activity were overlaid with proportional symbols for tourism revenue sharing funding for each sector in each period, with 2005-2017 split into 2005-2011 and 2012-2017. Here we excluded any funding that was distributed to multiple sectors without information on the specific amount disbursed to each individual sector within the district. The % of the overall amount of funding that fell into this category is 1.41%. Then, we used the bivariate local Moran’s I statistic to test the statistical significance of the relation of clusters to each other. The bivariate local indicator of spatial association and significance maps show sectors of high-low and low-high, which respectively indicate sectors receiving high tourism revenue sharing in a cluster of low illegal activities, or low tourism revenue sharing in a cluster of high illegal activities. A bivariate local Moran’s I value of zero indicates random sorting of one variable relative to the other. -1 signifies dispersion and 1 signifies clustering (Lee, 2001; Anselin, 2002). The local Moran’s I considers only the value of X at location A and the neighbourhood’s value of Y, using the spatial lag of Y (queen contiguity). The bivariate local Moran’s I is given by:
where xi is tourism revenue sharing at sector i. Wijyj is the spatial lag of y, which is the illegal activities count in sector j, using a row-normalized queen contiguity matrix, which was selected to accommodate the sector-level. The overall significance threshold for interpretation of bivariate Moran’s I outputs in this study was 10%.
2.4.4 Econometric modelling
A spatial econometric model was constructed for panel regression analysis, of the type ‘spatial lag of x’ (SLX). Time-variant factors addressed by SLX regression at sector level include tourism revenue sharing investment (the variable of interest), population density, and local biophysical conditions such as precipitation. Time-invariant factors that we have controlled for include proportion of a sector that is inside protected area boundaries and areas with high tourist activity. Spatial autocorrelation was tested using univariate local Moran’s I and constructed spatially lagged variables for those exhibiting Moran’s I greater than 0.4. Therefore, the relationship between illegal activities and tourism revenue sharing investment was estimated by the model:
where δst is weighted detected encounters in sector s and year t. Xst is a vector of controls, such as human population density and precipitation, and area of a sector within park boundaries calculated in ArcGIS (Goodman et al., 2019). trsst is the tourism revenue sharing funds distributed to sector s for year t. W indicates spatially lagged variables. A temporal lag of one year was also incorporated to account for the delay between tourism revenue sharing investments and potential reduction in illegal activities. Standard errors were clustered to sector to ensure robustness to heteroscedasticity (Stock and Watson, 2008).
3 Results
3.1 Project types and funding size
The funds allocated to projects under the tourism revenue sharing have increased between the two periods studied, 2005-2011 and 2012-2017 (Figure 2). The largest amounts have been invested in projects supporting education (e.g., construction of classrooms) and basic infrastructure (e.g., construction of houses for the poorest communities and relocating some households that were living in the buffer zone of Nyungwe National Park). Smaller budgets were allocated to environmental protection initiatives or alternatives (e.g., beekeeping, bamboo or elephant grass multiplication) and income generating activities (e.g., pottery, handcrafts).
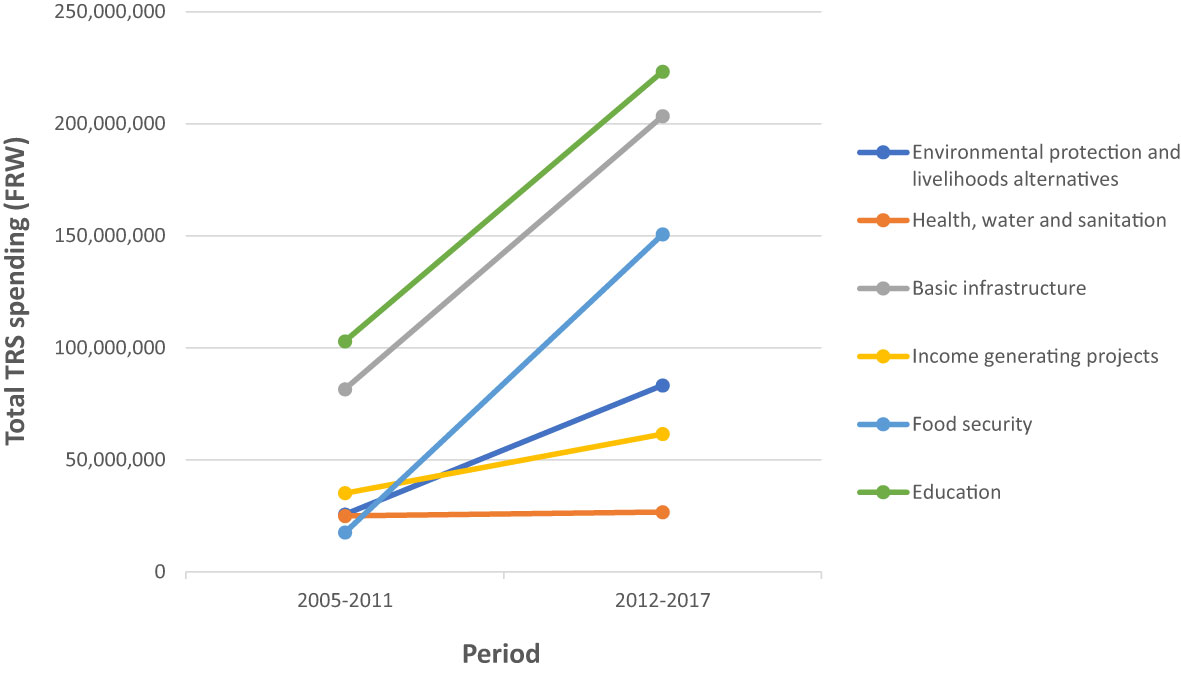
Figure 2 Tourism revenue sharing funding allocation per project type, demonstrating increases between periods 2005-2011 and 2012-2017. There was no project supported in 2011. TRS, tourism revenue sharing; FRW, Franc Rwandais. Data source: Rwanda Development Board.
3.2 Communities’ perceptions of tourism revenue sharing
First, communities were largely aware of tourism revenue sharing projects, mainly since the year 2006. However, 11.3% of the total interviewees reported that they only heard about this program on the day of interview for this study (Supplementary Materials). These communities are from the cooperatives located in cells (administrative units composing a sector) without a project funded under the tourism revenue sharing program. However, communities members of cooperatives from cells with a funded project could understand the tourism revenue sharing since its initiation in 2005 (44.15% of the interviewees in this category understand what the program is about). Next, communities generally perceived the tourism revenue sharing to be an important program. There was no significant difference in the views on this between funded cooperatives and those that are not funded (χ2 = 3.334, df =1, P–value=0.067), and indeed 40% of communities from supported cooperatives and 60% of communities from non-funded cooperatives agreed that the tourism revenue sharing is important (see Supplementary Materials). Critically, members of non-funded cooperatives had noticed that the neighbors’ members of funded cooperatives receive additional support, from which they saw some benefits as well but not in the same way. Members of non-funded cooperatives emphasized that they are able to buy materials such as honey from cooperatives that are funded under tourism revenue sharing, which benefit them. One of the respondents from a funded cooperative explained:
‘‘The tourism revenue sharing contributed a lot: now our children can get milk as we received cows under this program. Malnutrition is controlled. We wish to continue collaborating with the park management and get more support. We would like to get support on improving farming during dry seasons (e.g., setting up infrastructure for irrigation).’’
The cooperatives that receive funding were also asked about their awareness of the development of tourism revenue sharing projects, and their involvement in project design, approval and implementation. Of the total, only 47.2% of the respondents confirmed that they had previously been asked about developing and submitting projects to be funded, yet 69.8% of respondents have contributed to the later project implementation. As indicated on Table 3, the same community group could share that they do not clearly understand the steps towards the projects approval (70% of respondents); but a few of them participate in the projects approval (29.6% of respondents).
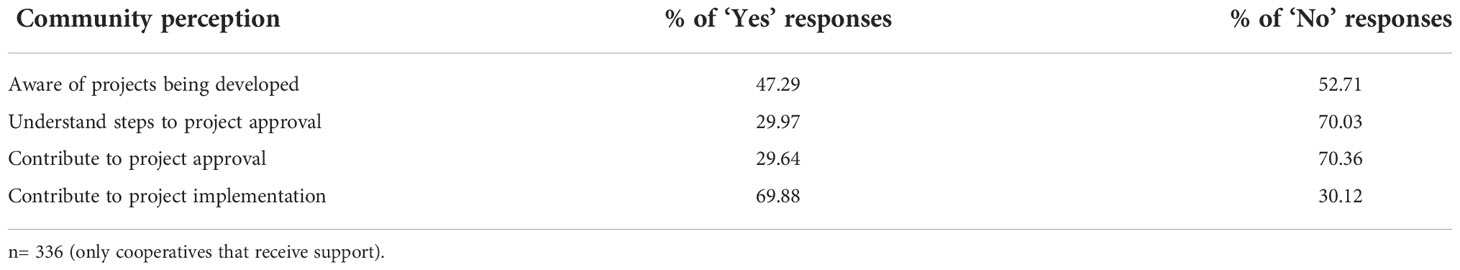
Table 3 The communities’ perceptions of involvement in tourism revenue sharing’ project design, approval and implementation.
The community associations generally face some challenges with implementing tourism revenue sharing projects, but they appreciate these projects and recommend their continuation with suggested improvements (Table 4). The majority of respondents want the tourism revenue sharing program to continue and improve (> 90% of responses) but they also recognize that some of the objectives of the program have not been achieved so far (51.8% of responses). A member of a funded cooperative underlined:
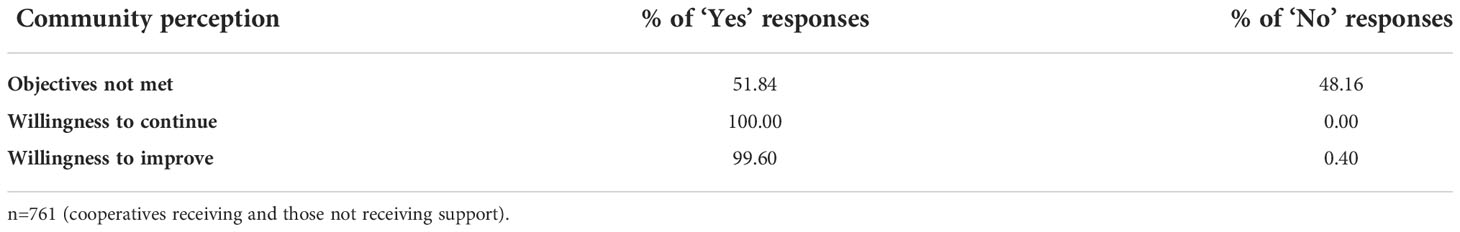
Table 4 The communities’ perceptions on whether the objectives of the tourism revenue sharing were achieved and willingness for improvement of the program.
‘‘The tourism revenue sharing program should continue because there is a long way to go for communities adjacent to Nyungwe National Park. The problems of crop raiding and increasing poverty rates are still there. The program can consider funding other cooperatives that are not close to the park boundary, as they also illegally harvest resources from the park.’’
The local government representatives could share examples of supported projects that are achieving the tourism revenue sharing objectives; including reducing harvesting resources from the park and improving community livelihoods. These leaders highligted beekeeping, agriculture, livestock and infrastructure projects (e.g., construction of classrooms, health facilities, water and electricity provision).
3.3 Tourism revenue sharing relative to forest dependency behaviors
The spatial regression analysis found that socio-economic characteristics contribute to community behaviors, in that they can exacerbate forest dependency in the form of illegal harvesting of forest resources. Unfortunately, however, the support provided by the tourism revenue sharing appears to have had a limited effect in terms of reducing these activities over time and space. Spatial regression results at the sector level consistently showed a significant negative relationship between the sectors’ contribution to the national per capita Gross Domestic Product and illegal activities in Nyungwe National Park (Table 5). The two most recorded illegal activities are ‘snares (illegal hunting)’ and ‘tree cutting’ (see Supplementary Materials). During our interviews, we asked communities why some of their colleagues still practice the illegal hunting and tree cutting in Nyungwe National Park. One of the respondents explained:
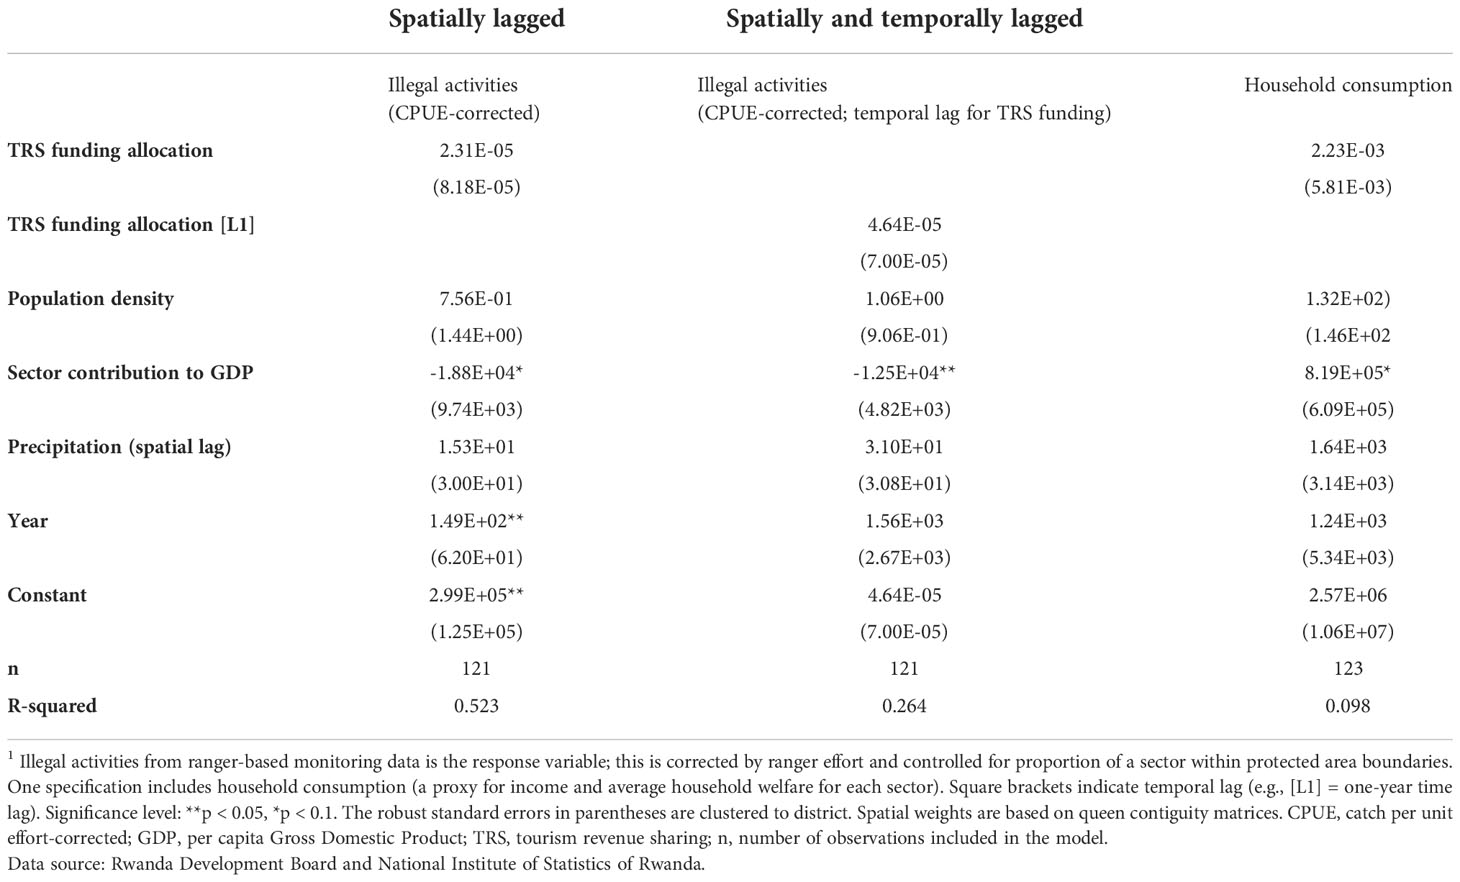
Table 5 Results of spatial regression analysis1, using a panel of sectors and years.
‘‘There are communities who still consider hunting as a normal practice that is part of their daily life. This is the case of Batwa group. Additionally, the value of a material made from park resources (e.g., timber) is higher than another object made of material from outside the park.’’
The results of the separate spatial statistical analysis using bivariate local Moran’s I further support this finding. Some administrative sectors, like Bweyeye, Ruheru, Butare, and Karambi received high tourism revenue sharing funding during the period of 2005-2011; but still experienced high encounter rates of illegal activities in the years following. The sectors of Gitambi, Mahembe, Nyabimata, Twumba and Mutuntu are likely to have low encounter rates of illegal activities, in contrast to the sectors of Bweyeye, Butare, Cyato, Ruheru and Uwinkingi (Figure 3). However, incongruity between tourism revenue sharing and illegal activity rates was also found. The negative statistic (Moran’s I= -0.0361293) was observed in the period of 2005-2011, indicating that tourism revenue sharing funding is not clustered by sector and is dispersed across the area of interest. But there is improvement in the spatial targeting of the funding in the period of 2012-2017 where positive statistic (Moran’s I= 0.0870272) was found (Figure 4).
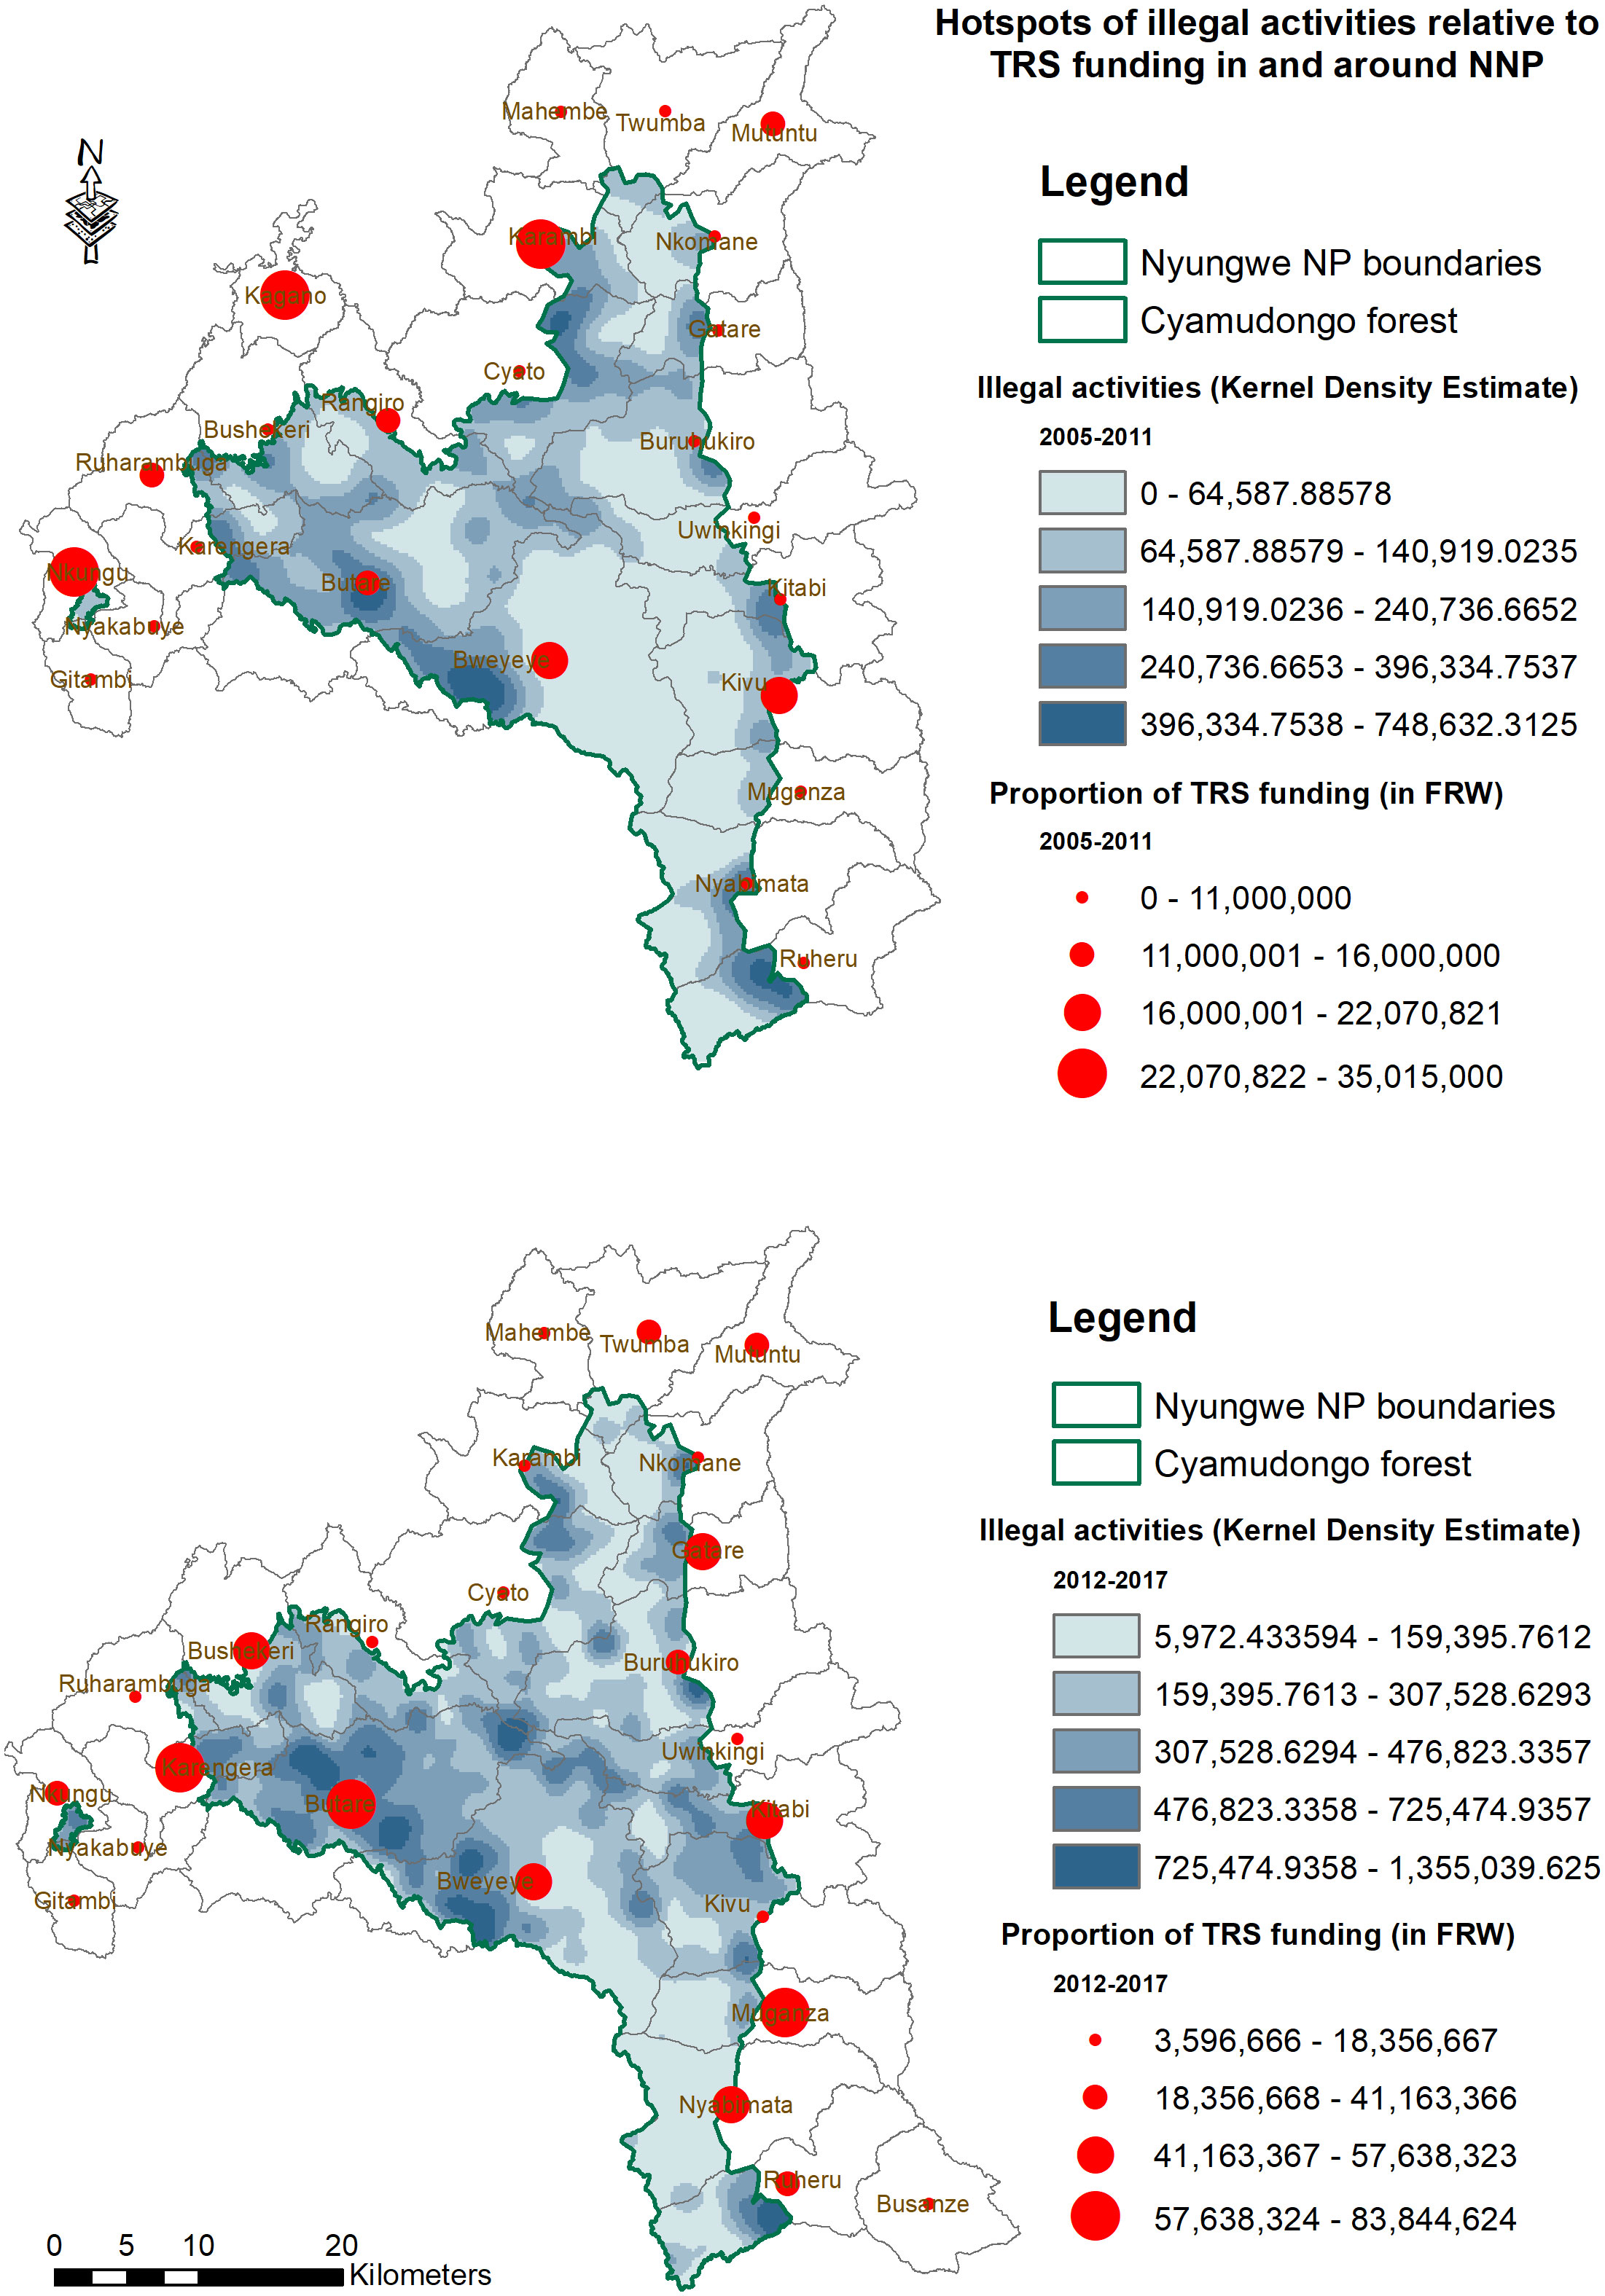
Figure 3 Hotspots of illegal activities in Nyungwe National Park relative to tourism revenue sharing funding to sectors bordering the park from 2005-2017, split into two periods 2005-2011 and 2012-2017. NNP, Nyungwe National Park; TRS, tourism revenue sharing; FRW, Franc Rwandais. Data source: Rwanda Development Board.
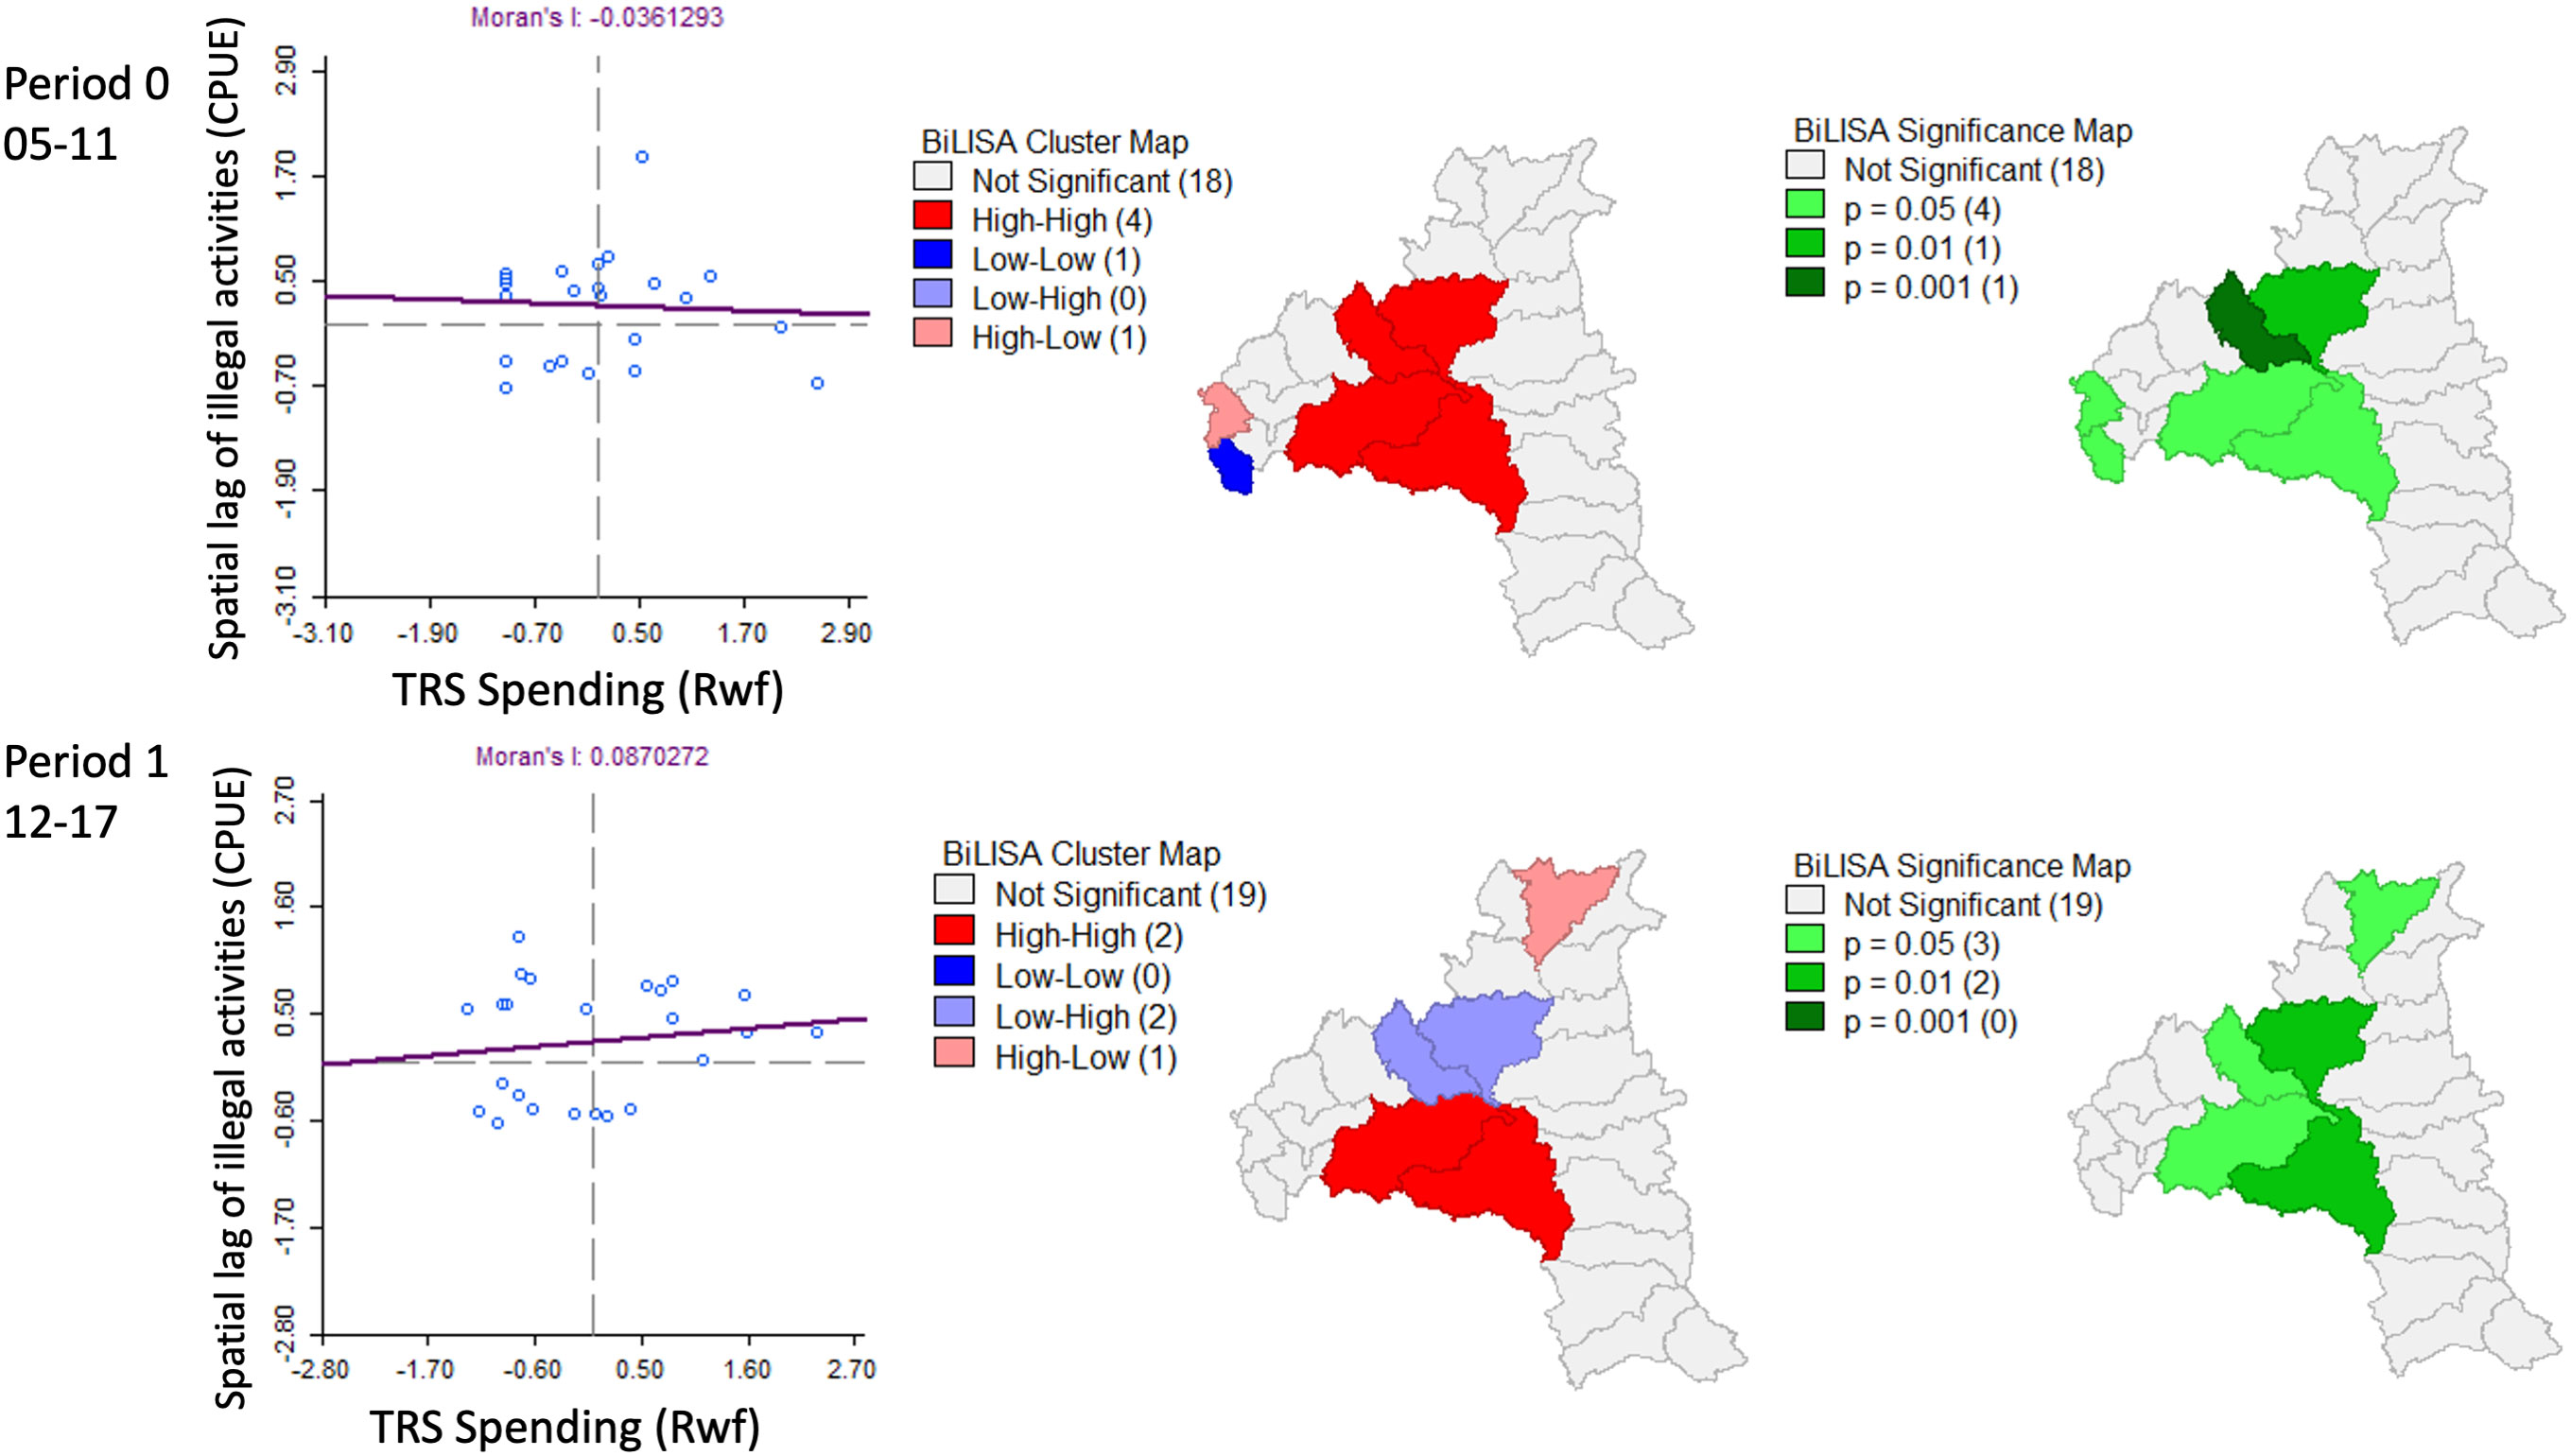
Figure 4 Bivariate local Moran’s I of TRS funding allocation relative to the spatial lag of illegal activities in sectors adjacent to Nyungwe National Park (essentially, the ‘neighborhood’ of illegal activities). The green significance maps show the level of statistical significance of these clusters. For both map types, numbers in parentheses (e.g., Not Significant (18) or High-High (2)) indicate the number of observations within that category. High-High: a sector of high TRS funding surrounded by sectors of high illegal activities; Low-Low: a sector of low TRS surrounded by sectors of low illegal activities; Low-High: a sector of low TRS surrounded by sectors of high illegal activities; High-Low: a sector of high TRS surrounded by sectors of low illegal activities. TRS, tourism revenue sharing; Rwf, Rwandan Franc/Franc Rwandais.
4 Discussion
This study aimed at finding out the impacts of the tourism support to improving the livelihoods and reducing community dependency on harvesting resources from Nyungwe National Park, a protected area located in the south-western Rwanda. We presented the communities’ perceptions about the tourism revenue sharing, their willingness to have the program continue and improve. We also quantitatively analyzed the relationship between the tourism revenue sharing funding and encounter rates of illegal activities inside the park. In the following sections, we reflect on two main study findings: (1) communities perceptions about the support from tourism and (2) contribution of this community support to their livelihoods and reduction in illegal harvesting of resources in the adjacent protected area.
4.1 Communities’ perceptions of the tourism revenue sharing program
We found that the tourism revenue sharing is important for local communities living adjacent to Nyungwe National Park, and that these communities wish to have continued support under this program. However, interview responses of tourism revenue sharing’ beneficiaries stress that improvements need to be made as some of the objectives have not been fully achieved in the last 13 years (2005-2017). It is important to note that communities are now aware of the tourism revenue sharing, in contrast to the outcomes of the program assessment conducted in 2011 (WCS, 2012). Our research participants also shared some challenges they face during the implementation of the tourism revenue sharing program (Table 6). In particular, the projects beneficiaries are not strongly engaged in the project design process. Communities are engaged in projects implementation, but with limited power over which projects are implemented at selected locations in different sectors around the park. This is true for basic infrastructure projects, which are usually developed by local government and receive much of the funding. The projects supported through tourism revenue sharing can focus on activities which improve the community livelihoods, and this may reduce the forest dependency behaviors. This recommendation was also made during the first evaluation of this program by WCS; communities would appreciate smaller projects that directly come from the park revenues: e.g., beekeeping, handcraft making. Future research can consider interviewing those that make illegal use of the park resources about their motivations. More importantly, assess the impact of the tourism revenue sharing after 2017 as the percentage was increased to 10%.
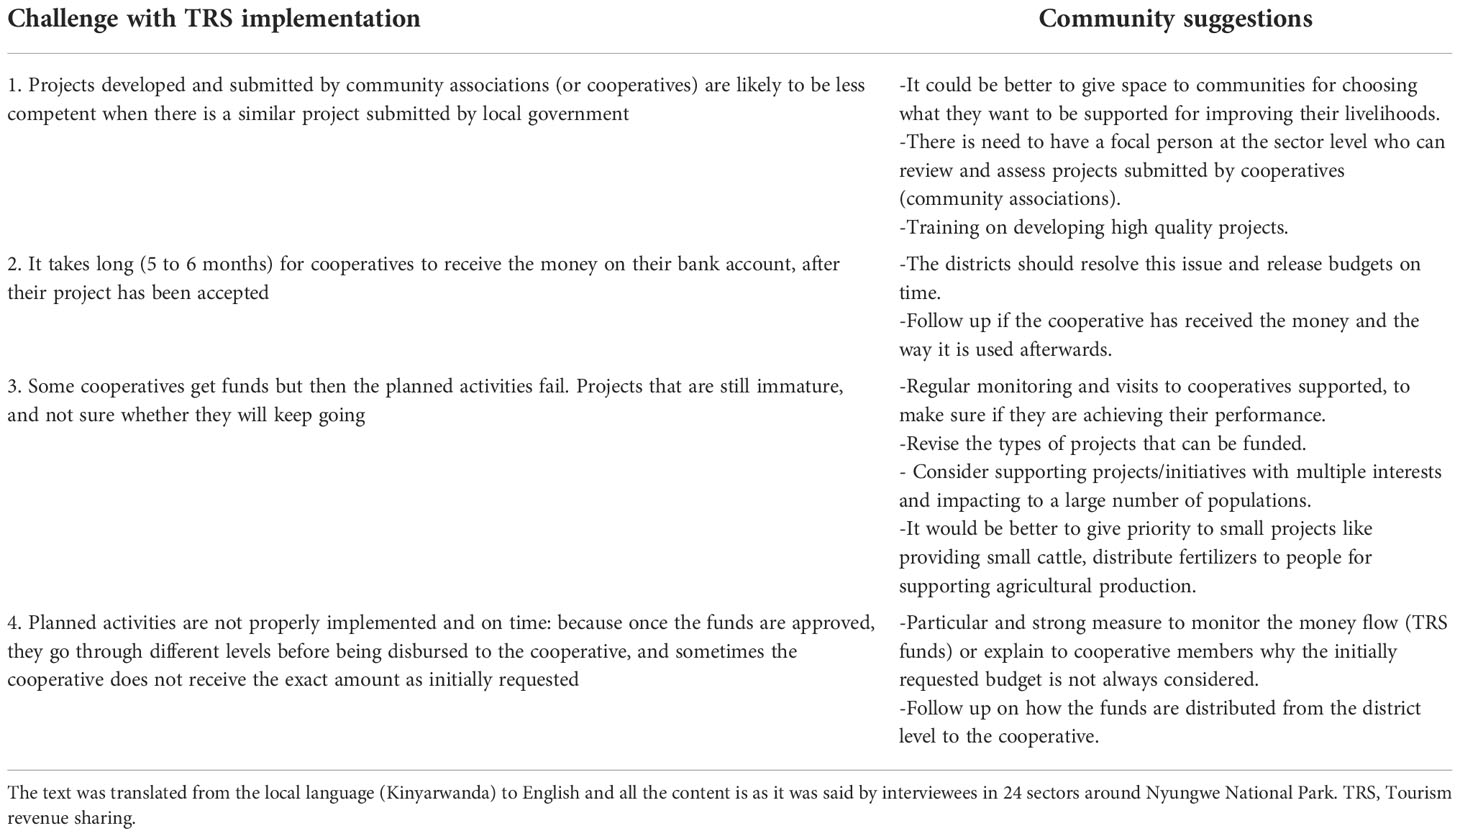
Table 6 Major challenges in the implementation of the tourism revenue sharing (TRS) and possible recommendations.
On one hand, these results indicate that the community projects funded under tourism revenue sharing are perhaps still immature and have not yet shown tangible impact; projects supported might not have yet directly addressed high poverty rates of communities around Nyungwe National Park, but they could be contributing to improved socio-economic conditions in the longer term. On the other hand, this supports the literature which has shown that tourism revenue programs require complementary initiatives, focused on capacity building and cultural benefits, and greater community ownership over the projects selected (Spenceley et al., 2019).
What, then, would be required of tourism revenue sharing projects around Nyungwe National Park, in order to make the program more effective in reducing poverty and community dependency on the forest resources in the park? It appears that greater community ownership over project selection and approval, and greater spatial alignment of projects with community needs and incidence of forest dependency, would improve the tangible poverty-related impacts of the tourism revenue sharing program (Bernhard et al., 2020). To take a regional perspective, Carius and Job (2019) found that the tourism revenue sharing contributed to sustainable development goals in the region around Jozani-Chwaka Bay National Park and Biosphere Reserve, Zanzibar (Tanzania). This success was due to different factors, including: (1) 90% of the staff in the national park are community members; (2) the community involvement in governance and management of tourism revenue sharing is high; (3) tourism revenue sharing empowers local communities to invest according to their priorities; (4) the equitable contribution of both government and civil society ensures fair sharing to all beneficiaries; and (5) progress and decision is guided by regular monitoring and evaluation of tourism revenue sharing by semi-independent investors.
However, potential pitfalls still remain. Spenceley et al. (2019) reviewed the tourism revenue sharing around terrestrial protected areas in Africa and highlight that the initiative is among a suite of benefits for local communities adjacent to protected areas, and while beneficiaries already perceive that the support is important, there are still cases of failures in implementing tourism revenue sharing programs (Tumusiime and Vedeld, 2012; Spenceley et al., 2019). Tourism benefits have to be very high, more equitably and directly distributed to potential beneficiaries in need, to enable the theoretical linkages between conservation and improved community livelihoods to come to fruition as a result of the program. Before implementing community support projects, it is important to first identify conservation and community socio-economic needs and determine whether these projects align with community incentives (Kiss, 2004; Carius and Job, 2019). Additionally, follow up on the flow of money and who benefit from the tourism revenue sharing fund is essential as indicated by one of the respondents during our interviews:
‘‘We developed a project and were aware that we will receive funding, but surprisingly we were later communicated that our fund was stuck at the district as we do not meet all the requirements to get the tourism revenue sharing fund on this particular project. We feel like the district dominates when it’s time to decide which projects to be supported, instead of giving priority to the local communities to share what kind of support they need”.
Challenges in implementing the tourism revenue sharing program were also identified in a similar protected area in Uganda: Bwindi Impenetrable National Park. Ahebwa et al. (2012) suggest addressing the imbalances in designing projects and distributing funds to community projects. The situation here still shows complications in accessing the tourism revenue sharing funds due to difficult conditions on these funds, and low budgets invested in the program. Most of the problems are likely to be under control of the government; especially the park management (Uganda Wildlife Authority).
4.2 Tourism revenue sharing and forest dependency behaviors
The results of the quantitative socio-economic analysis in this study show that sector contribution to per capita Gross Domestic Product has a significant negative relationship with illegal activities in Nyungwe National Park. In other words, the sectors with the most relative economic activity see the least illegal activity, controlling for the size of park area in that sector, among other variables. This is interpreted as evidence to suggest that insufficient economic opportunity could be among the main drivers of communities to illegally harvest resources from the park. This is also further supported by the results illustrating that the sectors that receive low funding for projects under tourism revenue sharing are often surrounded by a cluster of sectors with high illegal activities (Figure 4). Poverty persists in communities living adjacent to Nyungwe National Park and, while tourism revenue sharing is not a panacea, some of this forest dependency behavior could be more effectively addressed through continuous support under the tourism revenue sharing with improved implementation of the program. Additionally, the privatization of the park’s buffer zone affected community behaviors as harvesting resources in the buffer zone is no longer allowed as it was before (Gross-Camp et al., 2015). Critically, these findings therefore recommend increasing the initiatives in highly forest-dependent areas to elevate the socio-economic conditions of the poor communities living in those areas. More importantly, projects that consider gender might contribute to behavioral change as mostly men do the illegal hunting and carry meat at home while women and children are usually involved in firewood collection from the park. Snares and tree cutting are the most encountered illegal activities in Nyungwe National Park (see Supplementary Materials). Particular attention could be on community projects that address meat and timber needs. This also may require a reassessment of projects, including their prioritization and selection, in areas which are already receiving high funding but are located in a cluster of sectors with high illegal activities (e.g., Cyato, Rangiro, Butare and Bweyeye in the period 2005-2011; Butare and Bweyeye in the period of 2012-2017), and sectors receiving low funding surrounded by sectors of high illegal activities (e.g., Cyato and Rangiro for the period 2012-2017). Similar findings in Rwanda’ Volcanoes National Park also suggest that, going forward, a list of the community-supporting initiatives that would reduce forest dependency should be compiled in partnership with communities, and those projects enacted (Munanura et al., 2014; Sabuhoro et al., 2017). Future research could investigate additional data to better understand the impact of the tourism revenue sharing program. For example, the production data from cooperatives and data from education projects could enrich the results. Future studies could also concentrate on determining the contribution of projects funded by conservation NGOs and other civil society organizations that support community initiatives around Nyungwe National Park. Additionally, in light of the COVID-19 pandemic and its impact on tourism in East Africa and indeed across world, it will be important to revisit these data and analyses in the post-COVID-19 era to determine how the restrictions on travel and tourism have limited the ability of the tourism revenue sharing to support communities.
Data availability statement
The raw data supporting the conclusions of this article will be made available by the authors, upon formal request and approval from the institutions that shared these data.
Ethics statement
Ethical review and approval was not required for the study on human participants in accordance with the local legislation and institutional requirements. The patients/participants provided their written informed consent to participate in this study.
Author contributions
PA, TG contributed to the design of the study. PA, MD and IN conducted fieldwork. PA, KB performed the data analysis. PA, KB developed the first draft of the manuscript. All authors read, revised and approved the manuscript before its submission. All authors contributed to the article and approved the submitted version.
Funding
This research was funded by the National Geographic Society (Grant #HJ-134R-17). The funding was used for stakeholder workshops (inception meeting) and data collection (fieldwork).
Acknowledgments
Thanks very much to Dr Julie Shapiro, a National Geographic Explorer, for taking time to review the draft of this manuscript before its submission.We recognize the data sharing from Rwanda Development Board, the National Institute of Statistics of Rwanda and AidData GeoQuery. Much gratitude to field assistants who tirelessly helped with the data collection: Thaulin Dushimiyimana, Josine Tuyishime and Felix Niyonzima. We also appreciate the collaboration and facilitation from the local government at the district and sector level, which enabled conducting focus group discussions with communities.
Conflict of interest
The authors declare that the research was conducted in the absence of any commercial or financial relationships that could be construed as a potential conflict of interest.
Publisher’s note
All claims expressed in this article are solely those of the authors and do not necessarily represent those of their affiliated organizations, or those of the publisher, the editors and the reviewers. Any product that may be evaluated in this article, or claim that may be made by its manufacturer, is not guaranteed or endorsed by the publisher.
Supplementary material
The Supplementary Material for this article can be found online at: https://www.frontiersin.org/articles/10.3389/fcosc.2022.1034144/full#supplementary-material
References
Agrawal A., Clark C. G. (1999). Enchantment and disenchantment: The role of community in natural resource conservation. World Dev. 27, 629–649. doi: 10.1016/S0305-750X(98)00161-2
Ahebwa W. M., van der Duim R., Sandbrook C. (2012). Tourism revenue sharing policy at bwindi impenetrable national park, Uganda: A policy arrangements approach. J. Sustain. Tour. 20, 377–394. doi: 10.1080/09669582.2011.622768
Albers H. J. (2010). Spatial modelling of extraction and enforcement in developing country protected areas. Resour. Energy Econ. 32, 165–179. doi: 10.1016/j.reseneeco.2009.11.011
Anselin L. (2002). Under the hood: issues in the specification and interpretation of spatial regression models. Agric. Econ. 27, 247–267. doi: 10.1111/j.1574-0862.2002.tb00120.x
Bernhard K. P., Smith T. E. L., Sabuhoro E., Nyandwi E., Munanura I. E. (2020). Effects of integrated conservation-development projects on unauthorized resource use in volcanoes national park, Rwanda: a mixed-methods spatio-temporal approach. Oryx 55, 613–624. doi: 10.1017/S0030605319000735
Bookbinder M. P., Dinerstein E., Rijal A., Cauley H., Rajouria A. (1998). Ecotourism’s support of biodiversity conservation. Conserv. Biol. 12, 1399–1404. doi: 10.1111/j.1523-1739.1998.97229.x
Carius F., Job H. (2019). Community involvement and tourism revenue sharing as contributing factors to the UN sustainable development goals in Jozani-chwaka Bay national park and biosphere reserve, Zanzibar. J. Sustain. Tour. 27, 826–846. doi: 10.1080/09669582.2018.1560457
Critchlow R., Plumptre A. J., Alidria B., Nsubuga M., Driciru M., Rwetsiba A., et al. (2017). Improving law-enforcement effectiveness and efficiency in protected areas using ranger-collected monitoring data. Conserv. Lett. 10, 572–580. doi: 10.1111/conl.12288
Goodman S., BenYishay A., Lv Z., Runfola D. (2019). GeoQuery: Integrating HPC systems and public web-based geospatial data tools. Comput. Geosci. 122, 103–112. doi: 10.1016/j.cageo.2018.10.009
Gross-Camp N. D., Martin A., McGuire S., Kebede B. (2015). The privatization of the Nyungwe national park buffer zone and implications for adjacent communities. Soc Nat. Resour. 28, 296–311. doi: 10.1080/08941920.2014.948246
Hartter J., Dowhaniuk N., MacKenzie C. A., Ryan S. J., Diem J. E., Palace M. W., et al. (2016). Perceptions of risk in communities near parks in an African biodiversity hotspot. Ambio 45, 692–705. doi: 10.1007/s13280-016-0775-8
Isaacs J. C. (2000). The limited potential of ecotourism to contribute to wildlife conservation. Wildl. Soc Bull. 28, 61–69.
Keane A., Jones J. P. G., Milner-Gulland E. J. (2011). Encounter data in resource management and ecology: Pitfalls and possibilities. J. Appl. Ecol. 48, 1164–1173. doi: 10.1111/j.1365-2664.2011.02034.x
Kiss A. (2004). Is community-based ecotourism a good use of biodiversity conservation funds? Trends Ecol. Evol. 19, 232–237. doi: 10.1016/j.tree.2004.03.010
Lal P., Wolde B., Masozera M., Burli P., Alavalapati J., Ranjan A., et al. (2017). Valuing visitor services and access to protected areas: The case of Nyungwe national park in Rwanda. Tourism Tour. Manage. 61, 141–151. doi: 10.1016/j.tourman.2017.01.019
Lee S. I. (2001). Developing a bivariate spatial association measure: An integration of pearson’s r and moran’s I. J. Geogr. Syst. 3, 369–385. doi: 10.1007/s101090100064
Leung Y. F., Spenceley A., Hvenegaard G., Buckley R., Groves C. (Eds.) (2018). Tourism and visitor management in protected areas: guidelines for sustainability. best practice protected area guidelines series no. 27 (Gland, Switzerland: International Union for Conservation of Nature (IUCN).
Masozera M. K., Alavalapati J. R. R. (2004). Forest dependency and its implications for protected areas management: A case study from the nyungwe forest reserve, Rwanda. Scand. J. For. Res. 19, 85–92. doi: 10.1080/14004080410034164
Moore J. F., Mulindahabi F., Masozera M. K., Nichols J. D., Hines J. E., Turikunkiko E., et al. (2018). Are ranger patrols effective in reducing poaching-related threats within protected areas? J. Appl. Ecol. 55, 99–107. doi: 10.1111/1365-2664.12965
Mulindahabi F., Aaron N., Rugerinyange L. (2011). Nyungwe national park, Rwanda: 5 year ranger-based monitoring. comparison report 2006 to 2010 (Kigali, Rwanda: Wildlife Conservation Society).
Munanura I. E., Backman K. F., Moore D. D., Hallo J. C., Powell R. B. (2014). Household poverty dimensions influencing forest dependence at volcanoes national park, Rwanda: An application of the sustainable livelihoods framework. Nat. Resour. 05, 1031–1047. doi: 10.4236/nr.2014.516087
Munanura I. E., Backman K. F., Sabuhoro E., Bernhard K. P. (2020). The potential of tourism benefits to reduce forest dependence behavior of impoverished residents adjacent to volcanoes national park in Rwanda. Tour. Plan. Dev. 17, 475–496. doi: 10.1080/21568316.2019.1640282
Nielsen H., Spenceley A. (2011). The success of tourism in Rwanda: Gorillas and more. in: Yes Africa can: Success stories from a dynamic continent. Eds. Chunhan-Pole P., Angwafo M. (Washington, DC, USA: World Bank), 231–249.
NISR (National Institute of Statistics of Rwanda) (2018) EICV5 main indicators report. Available at: https://www.statistics.gov.rw/publication/eicv-5-main-indicators-report-201617 (Accessed March 1, 2020).
Nyumba T. O., Wilson K., Derrick C. J., Mukherjee N. (2018). The use of focus group discussion methodology: Insights from two decades of application in conservation. Methods Ecol. Evol. 9, 20–32. doi: 10.1111/2041-210X.12860
ORTPN (Office Rwandais du Tourisme et des Parcs Nationaux) (2005) Tourism revenue sharing in Rwanda: provisional policy and guidelines. Available at: https://carpe.umd.edu/sites/default/files/documents/carpe_guidance/Rwanda_Policy_tourism_revenue_sharing_2005.pdf (Accessed March 31, 2020).
Plumptre A., Davenport T., Behangana M., Kityo R., Eilu G., Ssegawa P., et al. (2007). The biodiversity of the albertine rift. Biol. Conserv. 134, 178–194. doi: 10.1016/j.biocon.2006.08.021
Plumptre A. J., Kayitare A., Rainer H., Gray M., Munanura I., Barakabuye N., et al. (2004). The socio-economic status of people living near protected areas in the central albertine rift (Kigali, Rwanda: Wildlife Conservation Society (WCS)). Albertine Rift technical reports Vol. 4.
Plumptre A. J., Masozera M., Fashing P. J., McNeilage A. M., Ewango C., Kaplin B. A., et al. (2002). Biodiversity surveys of the Nyungwe forest reserve in the south-western Rwanda (Kigali, Rwanda: Wildlife Conservation Society).
RDB (Rwanda Development Board) (2018) 2017 annual report. Available at: http://rdb.rw/wp-content/uploads/2018/08/RDB-Annual-Report-2017-Final.pdf (Accessed January 3, 2020).
RoR (Republic of Rwanda) (2003) National strategy and action plan for the conservation of biodiversity in Rwanda. Available at: https://rema.gov.rw/fileadmin/templates/Documents/rema_doc/publications/Planning%20docs/NATIONAL%20BIODIVERSITY%20STRATEGY%20AND%20ACTION%20PLAN%20Final%20version.pdf (Accessed January 3, 2020).
RoR (Republic of Rwanda) (2014) Fifth national report to the convention on biological diversity. Available at: https://www.cbd.int/doc/world/rw/rw-nr-05-en.pdf (Accessed January 3, 2020).
Sabuhoro E., Wright B., Munanura I. E., Nyakabwa I. N., Nibigira C. (2017). The potential of ecotourism opportunities to generate support for mountain gorilla conservation among local communities neighboring volcanoes national park in Rwanda. J. Ecotourism 20, 1–17. doi: 10.1080/14724049.2017.1280043
Spenceley A., Habyalimana S., Tusabe R., Mariza D. (2010). Benefits to the poor from gorilla tourism in Rwanda. Dev. South. Afr. 27, 648–662. doi: 10.1080/0376835X.2010.522828
Spenceley A., Snyman S., Rylance A. (2019). Revenue sharing from tourism in terrestrial African protected areas. J. Sustain. Tour. 27, 720–734. doi: 10.1080/09669582.2017.1401632
Stock J. H., Watson M. W. (2008). Heteroskedasticity-robust standard errors for fixed effects panel data regression. Econometrica 76, 155–174. doi: 10.1111/j.0012-9682.2008.00821.x
Sunderlin W. D., Belcher B., Santoso L., Angelsen A., Burgers P., Nasi R., et al. (2005). Livelihoods, forests, and conservation in developing countries: An overview. World Dev. 33, 1383–1402. doi: 10.1016/j.worlddev.2004.10.004
Tumusiime D. M., Vedeld P. (2012). False promise or false premise ? using tourism revenue sharing to promote conservation and poverty reduction in Uganda. Conserv. Soc 10, 15–28. doi: 10.4103/0972-4923.92189
USAID (United States Agency for International Development) (2014) Rwanda Environmental threats and opportunities assessment. Available at: http://www.brucebyersconsulting.com/wp-content/uploads/2014/12/Rwanda-Environmental-Threats-and-Opportunities-Assessment-2014.pdf (Accessed January 2, 2020).
Walpole M. (2004). Tourism development strategy for nyungwe national park, Rwanda (Kigali, Rwanda: Office Rwandais du Tourisme et des Parcs Nationaux).
WCS (Wildlife Conservation Society). (2012) Valuation of effectiveness of the revenue sharing program around Nyungwe National Park, Rwanda. Kigali, Rwanda: Wildlife Conservation Society
WTTC (World Travel & Tourism Council) (2019)Rwanda 2018 key data. Available at: https://wttc.org/Research/Economic-Impact/country-analysis/country-data (Accessed January 3, 2020).
Keywords: Community development, forest dependency, Nyungwe National Park, tourism revenue sharing program, Rwanda
Citation: Akayezu P, Ndagijimana I, Dushimumukiza MC, Bernhard KP and Groen TA (2022) Community livelihoods and forest dependency: Tourism contribution in Nyungwe National Park, Rwanda. Front. Conserv. Sci. 3:1034144. doi: 10.3389/fcosc.2022.1034144
Received: 01 September 2022; Accepted: 14 November 2022;
Published: 30 November 2022.
Edited by:
Katherine Whitehouse-Tedd, Nottingham Trent University, United KingdomReviewed by:
Naomi N. Moswete, University of Botswana, BotswanaAnna Behm Masozera, Yale University, United States
Copyright © 2022 Akayezu, Ndagijimana, Dushimumukiza, Bernhard and Groen. This is an open-access article distributed under the terms of the Creative Commons Attribution License (CC BY). The use, distribution or reproduction in other forums is permitted, provided the original author(s) and the copyright owner(s) are credited and that the original publication in this journal is cited, in accordance with accepted academic practice. No use, distribution or reproduction is permitted which does not comply with these terms.
*Correspondence: Providence Akayezu, pakayezu@alueducation.com