Hierarchy and Scale Influence the Western Monarch Butterfly Overwintering Microclimate
 Kiana Saniee
  Francis Villablanca*
- Biological Sciences Department, California Polytechnic State University, San Luis Obispo, CA, United States
Migratory species are expected to demonstrate habitat selection that occurs at multiple spatial and temporal scales. Western monarch butterflies migrate seasonally to overwintering groves at geographically predictable locations along the coast of California. To date, overwintering habitat selection by western monarch butterflies has primarily been studied assuming the microclimate hypothesis. Specifically, that microclimate habitat selection occurs when monarchs form dense overwintering aggregations in overwintering groves. However, western monarch butterflies are migratory; thus, previous habitat selection studies could have commingled selection at different scales into a single local scale in the site of aggregation. Therefore, we explore monarch overwintering habitat selection to determine whether an explicit spatial framework is necessary. We studied nine groves on the coast of California, and at each we collected temperature, humidity, and light data from grove edges, grove interiors, and aggregation locations for several weeks during the overwintering season. We tested the hypothesis that monarchs aggregate in locations in groves that have a unique microclimate that is consistently selected across groves (the microclimate hypothesis). We find no evidence supporting the hypothesis that aggregation locations have a unique microclimate that differs significantly from that of other locations inside the grove or that aggregation locations are uniform in their microclimatic attributes across overwintering groves. Rather, we find that microclimatic attributes in aggregation locations vary spatially with latitude, and that aggregation conditions exist in a large portion of each grove. We conclude that it will be necessary to consider spatial effects when studying or managing western monarch butterfly overwintering habitats, and that interpretations of habitat selection to date likely commingle habitat selection on the local and geographical scales.
Introduction
Many species demonstrate specific habitat associations and are known to select habitat components on different spatial and temporal scales (Johnson, 1980; Wiens, 1989; Mayor et al., 2009). Migratory species in particular should have an inherent propensity to demonstrate habitat selection on multiple scales (Hutto, 1985; Kristan, 2006). Habitat selection, implying choice, is typically quantified as disproportionate use relative to availability (Mayor et al., 2009), or as use (occupancy) and nonuse (MacKenzie et al., 2017) of particular habitat elements. In addition to scale, relevant habitat attributes, such as those under selection, can themselves be structured in a hierarchical or non-hierarchical fashion (Kristan, 2006). Hierarchical attributes depend on the pre-existence of another attribute (e.g., a slow-moving riverine system is dependent on low topographical relief), and habitat selection is determined with threshold models, resulting in patterns of use and non-use or presence-absence (Kristan, 2006). Non-hierarchical attributes are correlated (e.g., solar radiation and temperature), potentially non-generalizable across scales (Mayor et al., 2009), and selection is expressed as gradients of use rather than use and non-use (Kristan, 2006). While recognizing that use on a specific scale does not equate with selection on that exact scale, explicit methodologies are being developed to directly quantify the hierarchical nature of habitat selection (e.g., Bellamy et al., 2020) given that the scale of selection is not always intuitive (Mayor et al., 2009). Hierarchical perspectives are necessary, because they combine a perspective of geographic space (described by geographic variables like latitude and longitude) with a perspective of the environmental space (described by environmental variables like microclimate). In essence, hierarchical perspectives are a conceptual means by which local environmental space can be nested in a geographic space (Matthiopoulos et al., 2020). Furthermore, species can show habitat selection that is variable across temporal scales, where temporal variation can be even more important than spatial variation (Wiens, 1989; Fahrig, 1992; Mayor et al., 2009). For example, over the course of time, be it hours or days, selection could shift if the attributes under selection change, or as a function of nonlinear interactions between variables (Mayor et al., 2009). For example, a migratory organism might show a hierarchical spatial selection process, where selection of specific roosting groves would be dependent on preexisting selection of specific migratory routes (Hutto, 1985). Then, after selecting a grove, a migratory organism might show non-hierarchical selection of roost locations constrained to a gradient of conditions in a grove (Mayor et al., 2009). If conditions in one gradient change over time, then the organism might select alternative conditions in that or other gradients (Wiens, 1989; Fahrig, 1992; Mayor et al., 2009).
When a species is shown to express specific habitat affinities and those affinities or preferences are not contextualized in environmental space, geographic space, and time, then the scale of the affinity has not been considered. Selection on different scales would be confounded into a single conceptual or analytical spatially/temporally non-explicit scale such that the interaction of selection and scale would be obscured (Mayor et al., 2009; MacKenzie et al., 2017; Bellamy et al., 2020; Matthiopoulos et al., 2020). In this case, the importance of scale would go undetected. Conceptually, selection occurring on multiple scales would be commingled into a single scale (Johnson, 1980). Confounding and commingling selection and scale would have an effect of adding error, because variance would not be appropriately partitioned in space and time. This would add error to interpretations of realized niche and potentially misdirect management and restoration to an inappropriate or non-existent scale.
One example of species with specific habitat affinities is the migratory North American monarch butterfly (Danaus plexippus). The North American population is known to overwinter by forming dense aggregations in groves of trees in geographically predictable locations in highlands of central Mexico and along the coastline of California (Urquhart and Urquhart, 1978; Brower, 1995; Brower and Missrie, 1998; Martínez-Méndez et al., 2016; Ortiz-Bibian et al., 2017; Fisher et al., 2018). On a continental scale, the migratory route used by a monarch butterfly (Urquhart et al., 1970; Brower, 1995; Pyle, 2014; Billings, 2019) predicates whether habitat choices are available in highlands of Mexico, where monarch butterflies show disproportionate selection of Oyamel fir forests (Brower, 1995), or where available choices are in mixed tree-species groves in coastal California (Frey and Schaffner, 2004). Therefore, some specific habitat attributes are hierarchical whereby the environmental space is predicated on the geographic space.
The overwintering habitat of western monarch butterflies has been studied extensively and leads to acceptance of the “microclimate hypothesis.” In part, this is because habitat use by overwintering monarch shows habitat selection on various temporal scales, ranging from use of individual trees for a month or more (Anderson and Brower, 1996) to use of individual trees or branches for a few days or hours (Leong et al., 1991; Weiss et al., 1991; Frey and Leong, 1993; Frey and Schaffner, 2004). The literature on overwintering monarch butterfly ecophysiology sensu lato supports the theoretical and empirical effects of wind, temperature, relative humidity, and solar radiation on survival and fecundity (e.g., Barker and Herman, 1976; Rawlins, 1980; James, 1982; Calvert et al., 1983; Masters et al., 1988; Anderson and Brower, 1996). As such, the microclimate hypothesis posits that in individual overwintering groves there are ecophysiologically suitable areas and others that are unsuitable. Suitable conditions are inferred to occur in a part(s) of a grove where monarch butterflies form overwintering aggregation. Therefore, temporal variation and associated microhabitat and microclimate selection by overwintering monarch butterflies is currently inferred to occur (Leong et al., 1991; Weiss et al., 1991; Frey and Leong, 1993; Anderson and Brower, 1996; Fisher et al., 2018).
In the narrower literature on western monarchs, Leong (1990), Leong et al. (1991, 2004), and Frey and Schaffner, 2004 have used the microclimate hypothesis to argue that wind, temperature, relative humidity, and solar radiation are important to overwintering western monarchs given that these climatic attributes appear to be selected in aggregation sites in groves. However, using these same attributes on the landscape scale (i.e., conditions outside of groves), Fisher et al. (2018) found habitat suitability models that reliably predict the location of occupied overwintering groves. This means habitat selection for these attributes could be occurring within and outside of groves, or that attributes grade across the grove edge into the interior, or that the scale of selection has been confounded or comingled. In addition, Leong et al. (2004) report that monarchs “choose groves that face south/west near the ocean and north/east near bays and inlets.” Lane (1993) concludes that overwintering sites are located in shallow canyons and gullies, or on the leeward side of hills. If these statements are correct, then habitat attributes outside of groves are under selection and hierarchical if they predispose the conditions inside of groves. On an even larger spatial scale, Chaplin and Wells (1982) conclude that geographic variation in temperature from Northern to Southern California could actually be sufficient to limit the southern distribution of overwintering range and to determine the annual duration of the aggregation phenomenon associated with overwintering. Consistent with this idea, Fisher et al. (2018) tested whether climatic attributes thought to be under selection by western monarchs (Leong, 1990; Leong et al., 1991, 2004; Frey and Schaffner, 2004) are important for the duration of the 5-to-6-month overwintering season, or if attributes are more important in certain months, and they concluded the latter.
Therefore, we present an analysis that tests for the existence of spatial non-hierarchical variation in groves (wherein selection may be expressed as relational or gradients of use) and hierarchical spatial variation between groves (wherein selection could be predicated on location). Our analysis partitions between the two scales. The microclimatic attributes we analyze are the ones thought to be under selection by monarch butterflies in coastal California's overwintering groves (Leong, 1990; Leong et al., 1991, 2004; Weiss et al., 1991; Anderson and Brower, 1996; Frey and Schaffner, 2004) and potentially between them (Fisher et al., 2018). We test the microclimate hypothesis by assessing whether these attributes provide evidence that habitat selection is occurring on a grove scale (sensu the microclimate hypothesis), whether habitat selection is uniform across space, meaning that the spatial or geographic scale is not important, whether habitat selection correlates with position in the landscape, meaning that the spatial or geographic scale is actually important, and whether the attributes correlate with each other. Temporal variation and associated attribute selection are currently inferred to occur (Leong et al., 1991; Weiss et al., 1991; Frey and Leong, 1993; Anderson and Brower, 1996; Fisher et al., 2018), and we do not address it directly. Our intent is not to elucidate spatial and temporal hierarchical and non-hierarchical patterns of habitat selection and their interactions. Instead, we test whether, in addition to the temporal habitat selection that is inferred to occur, the patterns of variation and habitat utilization provide evidence of a spatial component to habitat selection that has previously been confounded or commingled across scales.
Materials and Methods
Study Groves
Our initial goal was to select 25 groves from the top 50 (according to Pelton et al., 2016), cover a large geographic range (from Marin to Ventura counties), and have 1,000 or more butterflies per grove. Unfortunately, in the fall of 2018 and the winter of 2019, the western monarch population was at a historical low (Pelton et al., 2019, westernmonarchcount.org), and monarchs were absent from many groves that they had occupied in previous winters. Therefore, sites we chose had the largest populations we could locate and included nine groves along the central California coast from Ventura (V), through Santa Barbara (SB) to San Luis Obispo (SLO) counties (Figure 1). The groves from south to north are: Arundell Barranca (V), Harbor Blvd. (V), Tecolote Canyon (SB), Hollister Ranch (SB), Spring Canyon Vandenberg Air Force Base (SB), Black Lake (SLO), Oceano Campground (SLO), Pismo Beach State Park (SLO), and Morro Bay Golf Course (SLO).
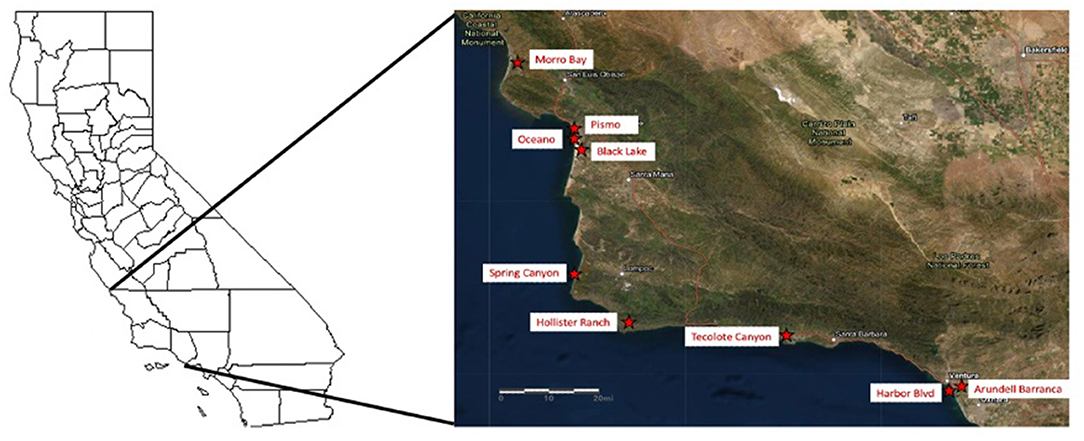
Figure 1. Nine groves sampled along the California coast in Ventura, Santa Barbara, and San Luis Obispo counties that met study design criteria (see text). The groves from south to north are: Arundell Barranca (V), Harbor Blvd (V), Tecolote Canyon (SB), Hollister Ranch (SB), Spring Canyon Vandenberg Air Force Base (SB), Black Lake (SLO), Oceano Campground (SLO), Pismo Beach State Park (SLO), and Morro Bay Golf Course (SLO).
Duration of Study
The start and stop dates in each grove varied (Figure 2). We planned to start data collection once the number of overwintering monarchs reached ≥1,000 in each grove. However, in early December, upon realizing the population was historically low, we began collecting data (start dates in Figure 2). Data collection continued in each grove until monarchs were no longer aggregating, which is naturally variable across locations (end dates in Figure 2). In summary, sampling was adaptive.
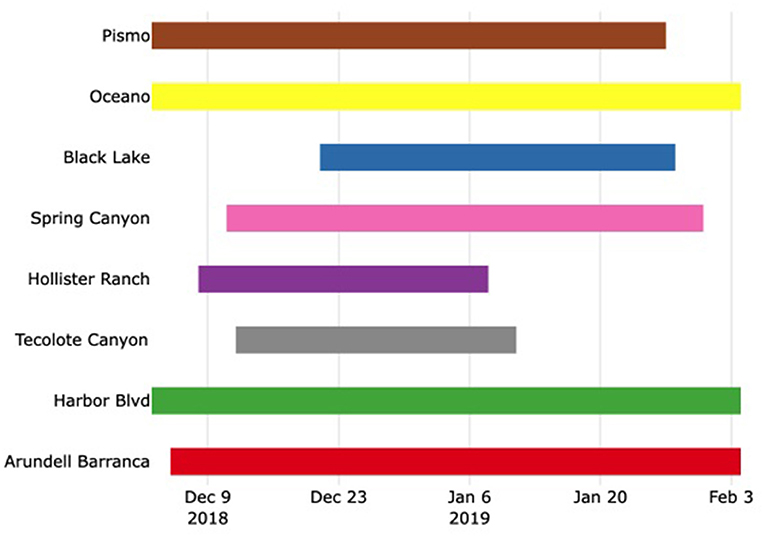
Figure 2. Start and end dates for data collection for each grove in the study. The start dates were delayed awaiting 1,000 or more monarchs per grove and varied as a function of monarch presence and counts and by access availability once the monarchs were present. The end dates were defined by monarchs departing entirely from a grove. The shortest sampling period was 30 days, and the longest was 61 days (mean = 43 days).
Sampling Design
In each of the nine groves, data was collected in five locations, herein referred to as “groves” containing “sample locations” (Figure 3). In each grove, one sample location was in an accessible monarch aggregation (Figure 3, aggregation) representing selected attributes (microclimate and microhabitat). Sampling in the aggregation location should identify suitable overwintering conditions under the microclimate hypothesis sensu Leong (1990), Leong et al. (1991, 2004), and Frey and Schaffner (2004). A second sample location was inside each grove and halfway between the aggregation's location and the edge of the grove in the southwest direction (Figure 3, SW interior). A third sample location was inside each grove and halfway between the aggregation location and the edge of the grove but in the northeast direction (Figure 3, NE interior). Interior sample locations represent random samples from each grove, potentially representing (a) suitable but unoccupied microclimate and microhabitat or (b) unsuitable microclimate and microhabitat. Two sample locations were on outer edges of each grove, one was on the southeast edge (relative to the aggregation's location) and represents maximum morning sunlight and storm wind exposure (Figure 3, SE edge), the other was on the northwest grove edge (relative to the aggregation's location) and represents minimum light exposure and maximum prevailing wind exposure (Figure 3, NW edge). Under the microclimate hypothesis, edge locations would be regarded as unsuitable microclimate and microhabitat.
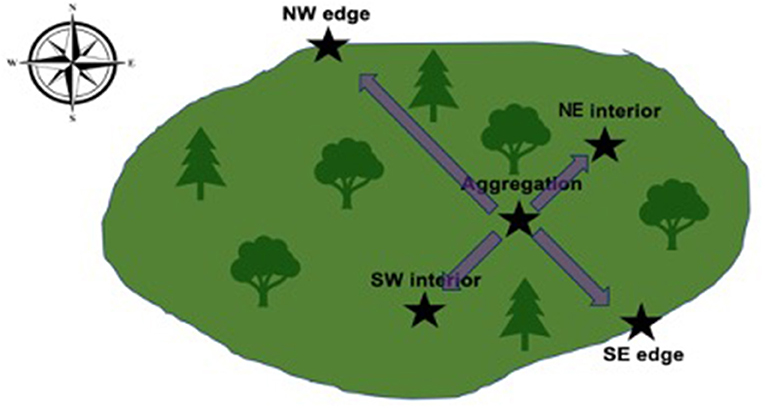
Figure 3. Sampling design relative to the aggregation's location in the groves. The first sample location was placed in the location of an aggregation (Aggregation). Two more sample locations were placed on the SE and NW edges of each grove relative to the aggregation's location to capture morning light and prevailing wind (SE edge and NW edge, respectively). Two interior sample locations were placed halfway between the aggregation's location and the grove's edge in the NE and SW directions (NE interior and SW interior, respectively).
Microclimate Data Collection and Instrumentation
We built small weather stations to collect climatic data and placed one in each of the five sample locations (Figure 3) in each of the nine groves (Figure 1). The stations consisted of a light intensity (measured in lux, “L” hereafter) data logger (HOBO Pendant Light 8K Data Logger Part # UA-002-08), a humidity and temperature (measured in percent and degrees Celsius, “H” and “T” hereafter) data logger (Lascar EL-USB-2), and a wind speed and direction data logger (RainWiseWindLog Wind Data Logger). Unfortunately, we were unable to collect enough wind data to conduct an analysis because of file-type errors and downstream system incompatibilities. Sensors were attached to a directional PVC support on the wind data logger set to true north. The H and T logger was attached to the PVC with a locking collar and positioned to face northwest (in the shade of the PVC support and facing away from the winter sun). The L sensor was anchored onto the same collar and positioned to face southeast. The sensors collected data every 5 min, and all the sensors in each grove were synchronized. Data were downloaded every 12 days given the storage capacity of one sensor (L) when set at 5-min intervals.
Microclimate Weather Station Deployment
Weather stations were hung in an aggregation's location at a height of and within 2 m of the aggregation. All five stations in each grove were hung at the same height (±1 m). Thus, sensor heights represented selected habitat height and could vary between groves but not within. Each station was assembled in the following manner. In brief, a tree with a sturdy trunk was selected to which we attached a lock box (with screws or steel cable; Pro Strand; 1/8” diameter, part no: 21005100), a telescoping pole (Unger 30 Foot Pole, item #: U-TF900) base was inserted into the lockbox and attached, a second tree with an accessible branch higher than a monarch aggregation was selected, a steel cable (Pro Strand; 1/8” diameter, part no: 21005100) was put over this branch, and this cable, once attached to the tip of the telescoping pole, was used to lift and guide the pole into place. The sensors hung as a single array, had uniform directional settings, were drawn up to the tip of the telescoping pole via a cord (threaded through the pole), and could be lowered for data download.
More specifically, the following approach was used. Each wind meter (supporting all the sensors) was inverted, allowing for upward attachment of the meter's PVC support to the end of the telescoping pole. The wind meter's PVC was coupled with a custom-built directional attachment (the “insert”). The insert fit into a custom-built directional sleeve hanging down vertically from the end of each telescoping aluminum pole. The sleeve's direction relative to north was adjusted for each sample location. The insert, thus, rotated and locked with the sleeve, resulting in directionality for all the sensors. We then threaded a paracord through the base of the pole, the directional sleeve, and the insert, and tied it off at the tip of the insert. Thus, the insert and a weather station could be separated by gravity from the sleeve of the aluminum pole by allowing the station's weight to pull the paracord and drop or lower the station. Gravity would pull the paracord through the pole as we fed the cord into the pole, thus dropping a weather station to ground level while the pole remained deployed. After downloading data, we pulled the paracord, which pulled the insert (and sensors) back up into the directional sleeve, relocking the insert directionally. The paracord was then coiled and placed into the lock box and secured with a keyed padlock. The aluminum lock box (approx. 3” × 3” × 9”) was custom-built and secured by wood screws or a cable to a base tree. The extended telescoping pole was placed into a hinged aluminum socket in each lock box and secured with lock nut and bolt. The pole was then extended into the air to appropriate length and lowered, and its tip was secured to the cable. Finally, we raised the pole into position by pulling the cable over the branch. Once the pole was in position, the supporting cable was anchored by threading it through the lock box and securing it with crimp locks.
Data Collection of Physical Habitat
Microhabitat data were collected once in each grove, giving an attribute snapshot of late February. We quantified the amount of vegetative cover in the emergent layer, canopy, understory, and shrub layers, and ground cover layer by image analysis. Different lenses were used to capture images from different layers (details below). Habitat data were used to explore correlations between habitat attributes and microclimate attributes under habitat selection (if any) given that correlated habitat attributes might serve as tools for in-grove restoration or management.
Standing below weather stations, each station was placed at the center of a fisheye lens (Shuttermoon, 198°) image, viewed through a camera (iPhone 8). This lens captures a circular image, encompassing 198° out of a possible 360° (top 55% of a sphere with the observer at the center). Each lens was held 1.83 m above ground, so the resulting image represents vegetation from 1.83 m up, capturing emergent, canopy, and upper understory layers. Functionally, these vegetative layers could contribute a vertical component of light and wind abatement or obstruction.
Standing directly beneath each weather station and using a 0.63 × wide lens with a 74° field of view in portrait format, a photo was taken in the NW, SW, NE, and SE directions, resulting in a 360° view (minus a 16° gap between images). A 3-m extension pole was used so the images could capture understory, shrub, and ground cover layers and topographical hillside obstructions. Functionally, these layers and topographical features could contribute a horizontal component of light and wind abatement or obstruction.
A camera with a 0.63 × wide lens and facing downward was placed atop a 13-m pole directly below each weather station, resulting in an image covering a ground area of 4.5 × 4.5 m and capturing the ground cover layer.
In each station location, we collected five random samples of litter depth by creating a 4.5 × 4.5 m grid centered under each sensor array and using a random number generator to get two values (range 1–450 cm) that were used as x and y coordinates to determine where to collect a litter depth sample. Litter depth was measured using a meter stick placed vertically with its end touching bare ground.
The distance from below each sample location to the nearest nectar source was determined using a range finder (Leica LRF 800 Lazer Rangemaster) and by measuring the horizontal distance from the observer to the nectar source. Distances were readily observable, since most nectar was in stands or beds of low flowering plants and flowering shrubs rather than in the canopy. Each value was corrected for the height of the weather station to determine the straight-line distance.
Analysis
We defined microclimate conditions in individual overwintering groves as local and part of environmental space as defined by light, temperature, and relative humidity. In this way, local variation was also non-hierarchical. We defined microclimate conditions that are spatial as those which are geographically variable because of their location in a geographic space. Latitude and longitude served as a proxy for functional attributes (i.e., distance from coastline and regional topography, etc.), which are covariates associated with space. If local microclimates were predictable in part by a location's geographic variables, then the microclimates would demonstrate hierarchical variation. All statistical analyses and figures were conducted in R version 4.0.5. The external packages used were tidyverse, nlme, stats, and multcomp.
Microclimate Hypothesis: Test for Whether Aggregation Attributes Differ in Other Locations
Microclimate
The microclimate hypothesis posits that monarch aggregation locations have distinct climatic attributes (Leong et al., 1991, 2004; Weiss et al., 1991; Frey and Leong, 1993; Anderson and Brower, 1996) that are suitable, thereby predicting that aggregation locations would have different climatic attributes in interior and edge sample locations. Therefore, daily (midnight to 11:59 PM) minimum, average, maximum, and standard deviation values for each variable in each sample location in each grove were calculated. Minimum L values were zero at night. We conducted a repeated measures ANOVA with sample locations as the fixed effect, climatic attributes as response variables, and grove as a random effect. We accounted for temporal autocorrelation using an autocorrelation structure of order 1 [AR(1)] for each variable. Because adjacent days are more similar to each other than non-adjacent days, AR(1) is commonly used for time series data. A significant result (p < 0.05) led to a Tukey pairwise comparison to determine what specific differences existed among the five sample locations.
Microhabitat
The microclimate hypothesis generally posits that unique microclimatic attribute values are created by specific microhabitat features (Leong et al., 1991, 2004; Weiss et al., 1991; Frey and Leong, 1993; Anderson and Brower, 1996), thereby predicting that aggregation locations should have microhabitat characteristics different from those of interior and edge locations. Specifically, microhabitat is inferred to obstruct or abate wind and light (which may impact temperature and humidity). To render a quantitative variable, the vertical and horizontal vegetative images were adjusted via hue, saturation, and brightness in ImageJ (1.50i), until all vegetation pixels were unselected, leaving only sky. The inverse of sky, or the proportion of vegetation obstructing sky in each of the photos, was calculated. To render a quantitative variable for ground cover, a 5- × -5 grid was overlaid onto each image, with each square in the grid being categorized as “bare ground,” “live cover,” or “dead cover,” yielding quantitative variable percent cover. The final quantitative variable, distance to the closest nectar source, was coupled with a categorical variable indicating if the source of nectar was an herb, a shrub, or a tree. Nectar type was analyzed separately from distance.
We conducted an ANOVA using the five sample locations as the fixed effect, the vertical and horizontal habitat obstructions as response variables, and grove as a random effect. For the type of nectar source available, we pooled the sample locations across groves to increase our sample size, since we had one record for each sample location in each grove. For type of nectar, we conducted a Chi-squared test using sample location as the fixed effect and nectar type as the response variable.
Microclimate Hypothesis: Test for Whether Grove Interiors Differ From Grove Edges
Habitat selection did not appear to happen at the level of individual sample location. Therefore, we tested a more general microclimate hypothesis that posited that monarch butterflies overwinter inside groves because the interior of groves contains suitable attributes that differ from those of the exterior of groves. From this more general hypothesis, we predicted that climatic attributes in three sample locations inside the grove would differ from climatic attributes in sample locations on two edges of groves. To test the prediction “interior locations,” aggregation, SW interior, and NE interior (Figure 3), were pooled (reflecting collective and pairwise results, Table 1). Sample locations SE edge and NW edge remained their own categories to avoid pooling distinct climatic attribute's effects and reflecting pairwise results (Table 1). Again, we conducted a repeated measures ANOVA using interior vs. edge location as the fixed effect, climatic attributes as response variables, and grove as a random effect while accounting for temporal autocorrelation AR(1). We followed up the significance testing with a Tukey pairwise comparison.
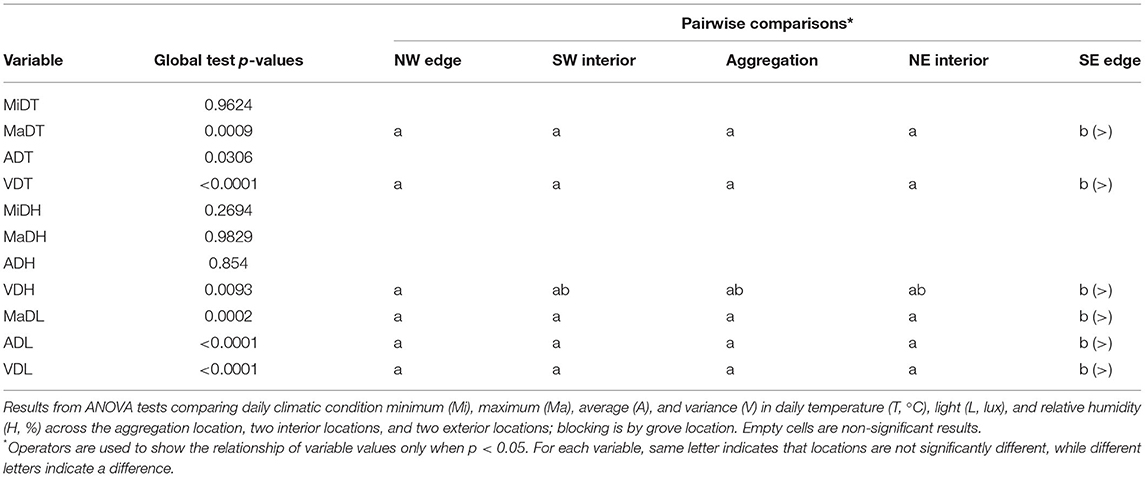
Table 1. Tests of aggregation location effect.
Test for Whether Habitat Selection Was Uniform Across Geography
To test the hypothesis (Leong et al., 1991, 2004; Weiss et al., 1991; Frey and Leong, 1993; Anderson and Brower, 1996) that monarchs select for a uniform overwintering-realized microclimatic niche, we tested the prediction that climatic attributes in aggregation locations would be more uniform across groves than other sample locations using a two-step process. We used a fixed effects model to test for the effect of the interaction of grove and sample location on each climatic variable, using a temporal correlation structure of AR(1). In this analysis, the fixed effects were grove and sample location, and the response variables were climatic attributes. We then took the random effect estimates for the interaction of every grove and sample location combination and conducted Levene's test for unequal variances across sample locations for each climatic variable. Effectively, this allowed for us to determine directly if microclimatic variation was lower in aggregation locations than in the four other sample locations. If variation was lower in aggregation locations, then the microclimate in the aggregation location might be independent of grove location. This would mean that aggregation attributes could not be hierarchical or spatially dependent.
Test for Spatial Autocorrelation Between Latitude and Selected Microclimate Attributes
In order to directly test for a hierarchical geographic scale, we hypothesized that if there was a hierarchical or between-grove spatial scale, then there would be spatial autocorrelation in daily values of climatic data. Therefore, we predicted a spatial correlation with latitude for both temperature and light because of the correlation between latitude and day length. We focused exclusive on aggregation location data (defined as selected habitat) and conducted a Durbin-Watson test for spatial autocorrelation of each climatic variable for latitude, and thereby tested for a latitudinally correlated climatic niche (hierarchically or geographically correlated) rather than a uniform climatic niche (non-hierarchical or geography independent test above).
Tests for Lack of Independence Among Climatic Attributes
We hypothesized that some climatic variables would be correlated. We predicted that light and temperature would have a positive correlation, and that humidity and temperature would have a negative correlation. We also predicted that daily minimums, averages, and maximums in the same variable would be highly correlated. We used a linear correlation matrix to identify pairwise significant correlations (p < 0.05) among daily minimums, averages, maximums, and standard deviations for all climatic variables. Significant results for the analyses presented above were interpreted more conservatively if variables were found to be correlated.
Results
Microclimate Hypothesis: Did Aggregation Attributes Differ in Other Locations?
The microclimate hypothesis posits that habitat selection occurs in an aggregation site and that microclimate attributes are selected en mass, leading to aggregation. Below, we evaluate whether there is evidence of habitat selection by assessing whether microclimate attributes in an aggregation location are different from those in other sample locations. The direction and magnitude of significant differences in climatic attributes across all the five sample locations are shown in Figure 4.
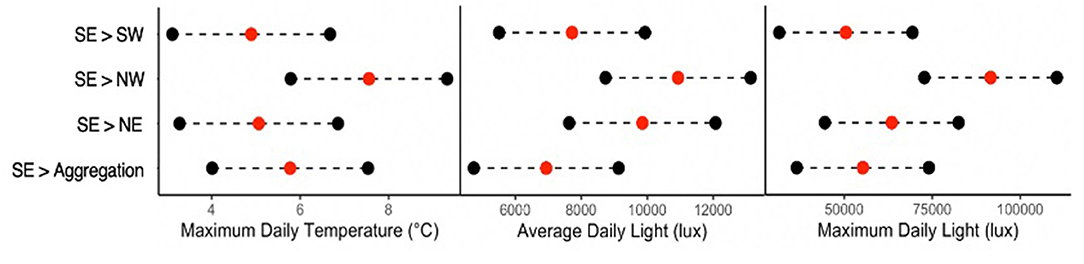
Figure 4. Magnitude and direction of significant pairwise differences (Table 1) across all the five locations in the groves are shown on the ordinate (the location of the pair with the greatest absolute value is shown by the “<” symbol. Tests account for blocking among the groves and temporal autocorrelation of the data. All significant pairwise differences were between SE and the four other locations, and for maximum daily temperature, average daily light, and maximum daily light.
Temperature
We found some significant differences in temperature between aggregation locations and the two interior and two exterior locations of the groves (Table 1). However, on this fine-grained scale, aggregation location did not differ from all the other sample locations. There was no evidence of a difference in minimum daily temperature (MiDT) across the sample locations. There was a difference in average daily temperature (ADT) across the sample locations (p = 0.0306), although the Tukey pairwise comparisons did not identify which pair(s) of locations differ. To reduce the likelihood of missing a significant result, less conservative t-tests between each pair of locations were conducted, followed with a Holm's Sequential Bonferroni test (Holm, 1979), showing SE with a higher ADT than the three locations in the interior of the groves (p = 0.0237, adjusted alpha = 0.025). There was also evidence that the SE location had higher maximum daily temperature (MaDT) than all the other sample locations (p = 0.0009). Finally, the SE sample location had larger variance in daily temperature (VDT) than all the other sample locations (p < 0.0001). Therefore, we were unable to find evidence to support the hypothesis that monarchs cluster in parts of a grove that has unique temperature attributes relative to all other sample locations, and that, at best, aggregation location only differ from one exterior location.
Humidity
On this fine-grained scale, aggregation location did not differ from any of the other sample locations for any of the humidity variables. There was no evidence for difference in minimum daily humidity (MiDH), average daily humidity (ADH), or maximum daily humidity (MaDH) across the sample locations. Variance in daily humidity (VDH) across the sample locations did differ (p = 0.0093), and the Tukey comparison showed that this was because SE had higher VDH than NW. Again, we found no evidence supporting the hypothesis that monarchs cluster in parts of a grove that has unique humidity attributes relative to all other sample locations.
Light
On this spatial scale, we found a few significant differences in light between aggregation locations and the four other grove locations. There was a difference in maximum daily light (MaDL) across the sample locations (p = 0.0002), with the SE MaDL being higher than in the aggregation, NW edge, and NE interior sample locations. Average daily light (ADL) and variance in daily light (VDL) both differed across the sample locations (p < 0.0001 and p < 0.0001), where the Tukey comparison resolved higher ADL and VDL for the SE sample location than for all the other locations. With regard to aggregation location, we found no evidence supporting the hypothesis that monarchs cluster in parts of a grove that has unique light intensity attributes relative to all other sample locations.
Overall, aggregation location did show instances of being different from other locations for certain variables, but only as a member of a group that collectively showed a difference. In these cases, aggregation location grouped with either all the interior sites (NE, A, and SW) or all the interior sites plus the NW edge. These results do not provide evidence to support the within-grove microclimate hypothesis, meaning monarch aggregations did not seem to form in locations with a specific microclimate. If anything, on this fine-grained scale, temperature, humidity, and solar radiation effectively set the SE location apart from all the other locations combined, and a large portion of the grove appears to support a suitable microclimate.
Generalized Microclimate Hypothesis: Did Grove Interiors Differ From Grove Edges?
Given we did not find strong evidence that aggregations formed where there was evidence for habitat selection, we proposed and tested a more general version of the microclimate hypothesis. We proposed the hypothesis that monarchs overwinter in groves because the interior, rather than just aggregation location, represented suitable climatic attributes. We tested this more generalized hypothesis by pooling aggregation location with two interior locations (which were not significantly different collectively or pairwise, Table 1 and above), thereby comparing climatic attributes between sample locations inside (pooled) and on the edges of groves (NW and SE separately). Significant differences in climatic attributes between the interior and edges of the groves are shown in Table 2 and their direction and magnitude in Figure 5.
Table 2. Tests of grove effect.
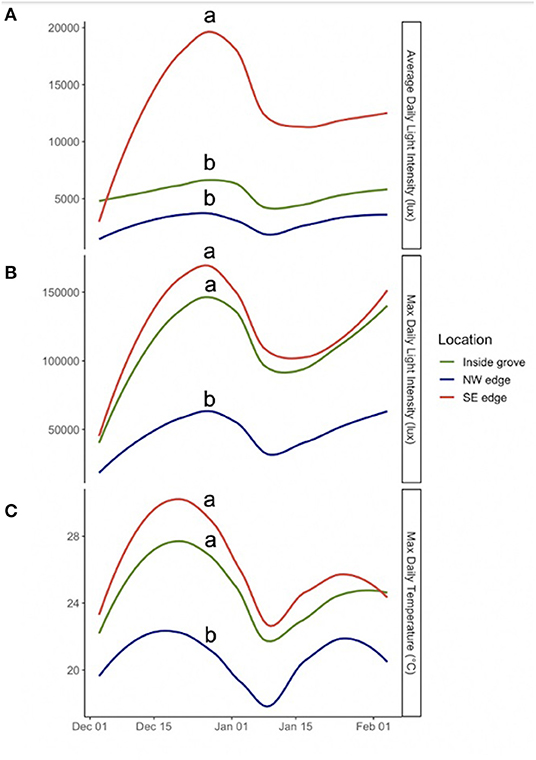
Figure 5. Climate data comparing the interior, NW edge, and SE edge of the groves in December and January of the 2018–2019 overwintering season for (A) average daily light (ADL) intensity (lux), (p < 0.0001), (B) maximum daily light (MaDL) intensity (lux), (p < 0.0001), and (C) maximum daily temperature (MaDT) (°C), (p < 0.0012). Lines have been smoothed to capture important patterns in the data and reduce noise. In each panel, same letter indicates that locations are not significantly different, while different letters indicate a difference. These are some of the significant results. All results are shown in Table 2.
Temperature
There were some differences in temperature between the interior of the grove and the edges (Table 2). There was no evidence that MiDT differed between the interior and the edges of the groves. We did find a difference in ADT among the interior and edges of the groves (p = 0.0211), and thought the Tukey comparison did not resolve any pairwise differences, the less conservative pairwise t-tests, followed with a sequential test (Holm, 1979), resolved the SE ADT is higher than the interior (p = 0.0237, adjusted alpha = 0.025). Likewise, MaDT differed between the interior and the edges of the groves (p = 0.0012), with the interior and SE sample location having a higher MaDT than the NW sample location (Figure 5). VDT was also higher for the SE sample location than for the interior and NW locations (p = 0.0002). Collectively, we did not support for the hypothesis being tested, since every time a difference was found relative to the interior locations, they grouped with one of the edges (either SE and interior, or NW and interior).
Humidity
There was no evidence that ADH or MaDH differed between the edges and interior of the groves. MiDH did differ between grove interiors and edges (Table 2), but this was a collective difference between the interior and edges of the groves (p = 0.0168), with no pairwise differences resolved by the Tukey comparison. Therefore, if there were differences in MiDH, we could not determine what the nature of the differences was between the interior and exterior of the groves. There was evidence that VDH was different between the grove edges and interior (p = 0.0158), where the SE edge had higher VDH than the NW edge. Overall, we did not find direct support for the hypothesis being tested, with the caveat that interior locations may group more or less with one of the edges than they did with temperature. We were unable to resolve whether more or less. If we had resolved more, then the interior would have been found to differ in MiDH from both edges.
Light
There were some significant differences in light between grove interior and edges (Table 2). SE had higher ADL than the interior and NW edge (p < 0.0001), and, conversely, NW had lower MaDL than both the interior and the SE edge (p < 0.0001), as shown in Figure 5. VDL was higher for SE than for both the interior and the NW edge (p < 0.0001), and larger for the interior than for the NW edge (p = 0.0482). Overall, we did not find direct support for the hypothesis being tested, because the interior locations grouped with one of the edges except for VDL.
Collectively, we found qualified support for the hypothesis tested that monarchs aggregated in groves because the interior and exterior of overwintering groves were significantly different in terms of temperature, humidity, and solar radiation (Table 2). What we found instead was that the interior locations grouped with one of the exterior locations under MaDT, MaDH, MaDL, ADT, ADL, VDT, and VDH (Table 2). This grouping pattern is shown across time for some of these variables (MaDT, MaDL, and ADL) in Figure 6. Only for VDL was the interior different from both exterior locations. Therefore, the hypothesis supported was not a “grove interior” effect but rather a “one edge plus interior” effect. These results suggest the more general version of the microclimate hypothesis may be correct but not on the scale of the entire grove and not as much for specific values but more so for patterns of variance. Finally, we visualized variation in daily light and temperature in interior vs. edge locations and found an interaction between MaDL and ADL and MaDT, as seen in Figure 7. Grove interiors can apparently be characterized by high MaDL but low ADL (Figure 5 and right panel of Figure 7). This combination is possible if maximum light is of short duration. Bright light of short duration would also allow for the observed MaDT similarity of the interior and SE relative to the NW edge (Figure 5 and left panel of Figure 7), particularly if light and temperature are correlated (see below).

Figure 6. Magnitude and direction of significant pairwise differences (Table 2) across three locations in the groves, SE, NW, and interior (pooling NE and SW and Aggregation) are shown on the ordinate (the location of the pair with the greatest absolute value is shown by the “<” symbol. Tests account for blocking between groves and temporal autocorrelation of the data. All significant pairwise differences were between the interior grove locations (collectively) and one but not both edges, or between the two edges, and for MaDT, ADL, and MaDL.
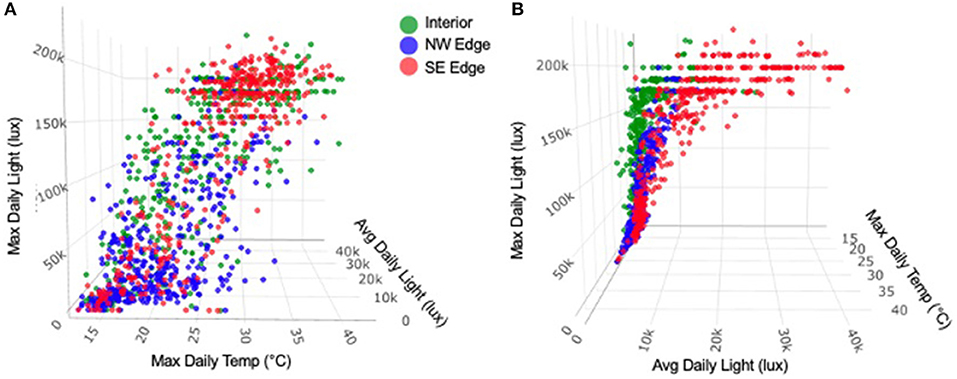
Figure 7. Relationship between MaDL, ADL, and MaDT. The two interior locations were pooled with the aggregation location, since these three were not significantly different (p > 0.6762) collectively or pairwise. (A) Grove interior had relatively low ADL in comparison to the SE (brightest) edge of the grove (p < 0.0001). In addition, the inside of the grove has relatively high MaDL in comparison to the NW edge of the grove (p < 0.0001), such that the interior of the grove is characterized by low ADL and high MaDL. This is possible if the maximum light is of short duration. (B) shows the positive correlation between MaDL and MaDT.
Microhabitat Hypothesis: Did Vegetative Obstruction Differ Across Locations?
The hypothesis that monarchs cluster in parts of groves that have unique microclimate conditions is based on the hypothesis that conditions are created by unique microhabitat attributes. We tested the microhabitat hypothesis by testing the prediction that aggregation locations would have microhabitat attributes that are different from those of all other (interior and edge) locations. We also considered the interior locations collectively, and thereby considered the microhabitat hypothesis as it relates to the more general microclimate hypothesis. Our focus was on vegetative (and other) obstructions, as these are expected to greatly impact wind (Leong, 1990; Weiss et al., 1991; Leong et al., 2004). The magnitude of obstruction was analyzed across five components: overhead obstruction and horizontal obstruction in the SW, NW, NE, and SE directions.
In contrast to the predictions, we found no evidence that percent canopy cover (overhead obstruction component) differs across the five sample locations when accounting for grove differences. Likewise, there was no evidence of horizontal obstruction differences in the SW and NE directions across the five sample locations. In contrast, differences in horizontal obstruction were found in the NW and SE directions for some locations. The aggregation locations had less obstruction to the SE than to the NW location (p = 0.0855), meaning the aggregation locations were somewhat more open to SE than might be expected given their location in the grove. The SE location had more obstruction in the NW direction (p < 0.01) than in the NW location (documenting the NW edge of the grove). The SE location had less obstruction in the SE direction (p < 0.0001) than all the other locations (documenting the SE edge of grove). The NE location had more obstruction in the SE direction than in NW (p = 0.0253), meaning the NE location was somewhat less open to the SE than might be expected because of the location in the groves. Therefore, aggregation location was only different in having less obstruction in the SE horizontal component than expected. This result suggests that the microhabitat hypothesis is not correct, or that it is only correct for horizontal exposure to SE. Two of the interior grove locations (aggregation and NE) differed in obstruction to SE. This suggests that the more generalized hypothesis is more correct, although it did not apply to all the interior locations and only applied to the SE obstruction.
Ground Cover
Percent of live ground cover was different across the sample locations (p = 0.0029), where aggregation locations had more live ground cover than the NE and NW sample locations. Conversely, there was a difference in dead ground cover (p = 0.0055), where aggregation location had less cover than the NE and NW sample locations. The difference between the interior (NE) and the edge (NW), and the aggregation location was exchange between dead and live ground covers, as there was no difference in percent bare ground cover across the sample locations.
Overall, we found no evidence supporting the hypothesis that aggregation location was significantly different in ground cover from all other sampling locations in the overwintering groves. With regard to three categories of ground cover, we only found that the aggregation location was significantly different from NW and NE in terms of percent of live and percent of dead ground covers. This result suggests that the microhabitat hypothesis is not correct, or that at best, it is only correct relative to parts of the grove, implying that the more generalized microhabitat hypothesis is more likely correct.
Litter Depth/Nectar
There was no difference in litter depth across the sample locations. There was no difference in distance to nectar or type of nectar across the sample locations.
Collectively, the results suggest that the microhabitat hypothesis is not at all correct, or at least not at a scale that includes multiple locations in the interior of the grove, and specifically not correct in aggregation location.
Test for Whether Habitat Selection Was Uniform Across Geography
On the next larger scale (the portion of overwintering range sampled), we directly tested the potential for hierarchical effects on habitat selection. Specifically, we tested the hypothesis that there are no hierarchical effects, and that, therefore, monarchs overwinter in a uniform set of climatic conditions (i.e., within grove overwintering climatic niche). This was conducted by testing the prediction that climatic attributes in aggregation location would not be significantly different across overwintering groves (no impact of geographic space). Instead, they should be uniform (only a function of a selected environmental space). In complete contrast to the prediction (Figure 8), we found that aggregation locations across the groves were different in minimum daily (MiD), average daily (AD), and maximum daily (MaD) values of temperature (T), humidity (H), and light (L) (all p < 0.0001). We further tested this hypothesis via the prediction that climatic attributes in aggregation locations would be less variable across groves than climatic attributes in the other sample locations. There was no evidence that the sample locations differ in their uniformity across groves (Figure 9) in ADT (p = 0.2295), ADL (p = 0.4518), and ADH (p = 0.1204). Thus, we cannot support the hypothesis that monarch butterfly aggregation locations represent a variation constrained, unique, or uniform non-hierarchical climatic niche across overwintering groves.
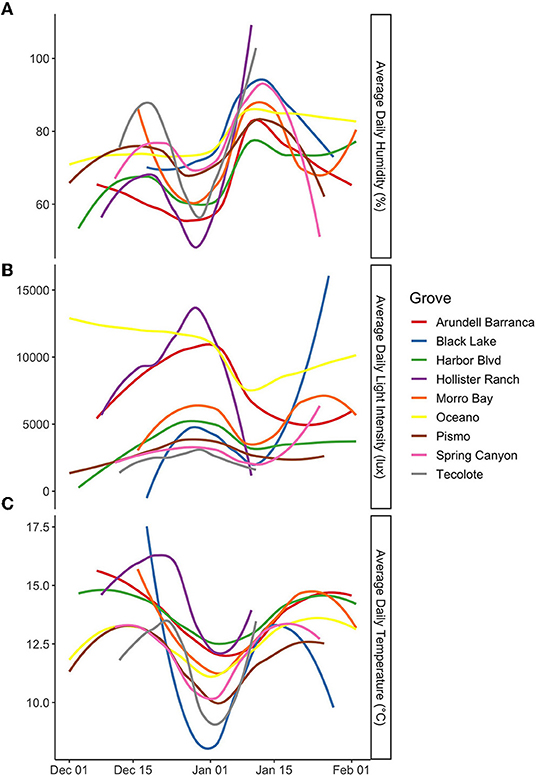
Figure 8. Climate data for the interior of the groves in December and January of the 2018–2019 overwintering season for (A) average daily humidity (%), (B) average daily light intensity (lux), and (C) average daily temperature (°C). Lines have been smoothed to capture important patterns in the data and reduce noise. In an attempt to define uniform climatic attributes that occur in aggregation locations across the groves, instead, we find that the aggregation locations are no more uniform than the other parts of the groves, and that taken collectively, the insides of the groves are quite dissimilar.
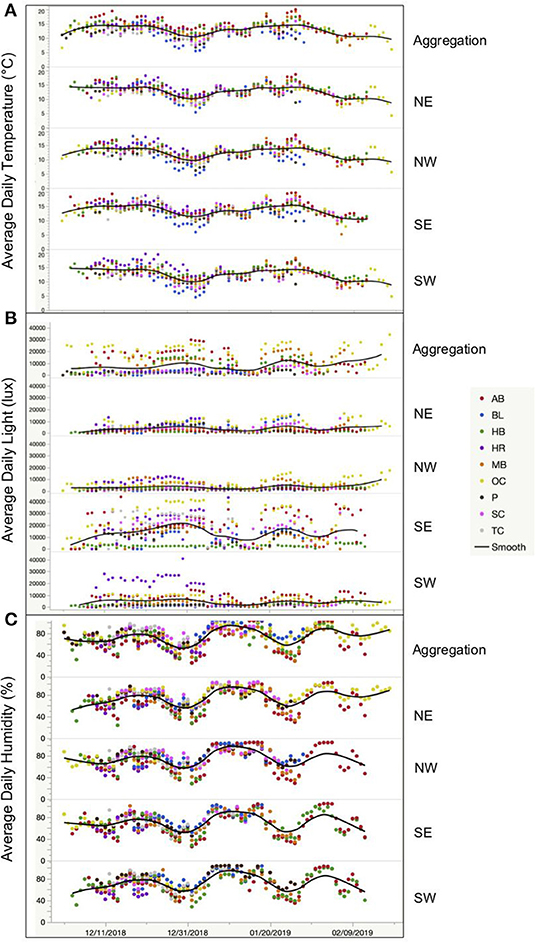
Figure 9. Climate data for each sample location across the groves in December and January of the 2018–2019 overwintering season for (A) average daily temperature (°C), (B) average daily light intensity (lux), and (C) average daily humidity (%). When testing for uniformity across the groves in each sample location, we find that the aggregation does not show less variation for any of the climatic variables across the groves than the other sample locations. Less variation would be visualized as a flatter less variable line. Site names are as in Figure 8 and are abbreviated.
Test for Whether Latitude and Climatic Attributes Showed Spatial Autocorrelation
As an alternative to the hypothesis that microclimate selection is non-hierarchical and only based on a set of local environmental conditions that are repeatedly selected in aggregation locations across overwintering groves, we tested whether across the nine overwintering groves the aggregation locations showed a hierarchical latitudinally correlated climatic niche. For average values, there was a latitudinal correlation with ADL in aggregation locations (p < 0.0001) but none with ADT or ADH. For maximum values, there was a latitudinal correlation with MaDT (p < 0.0001) and MaDL in aggregation locations (p < 0.0001) but none with MaDH. For minimum values, there was no latitudinal correlation with MiDT or MiDH. Finally, considering variances, we saw a latitudinal correlation with VDT (p < 0.0001) and VDL in aggregation locations (p < 0.0001) but not with VDH. To summarize, aggregation locations showed a significant latitude correlation with ADL, MaDL, VDL, MaDT, and VDT.
Test for Whether Climatic Attributes Showed Lack of Independence
We predicted correlations among variables and discovered correlations consistent with the predictions. There was a positive linear relationship between ADL and ADT (p < 0.0001, R squared = 0.3717) and a negative linear relationship between ADT and ADH (p < 0.0001, R squared = 0.2337), plus a negative relationship between ADL and ADH (p < 0.0001, R squared = 0.1784). The results support the hypothesis that temperature, humidity, and light are correlated. This result compounds with the latitudinal correlation of microclimate attributes, which are not independent themselves.
Discussion
Overall, we do not find support for the prediction that aggregation locations have distinct microclimates relative to the other sample locations in overwintering groves. The results do support the hypothesis that temperature, humidity, and light are microclimate attributes under selection by overwintering monarch butterflies. Specifically, we find that the aggregation locations are associated with differences in ADL, MaDL, VDL, MaDT, VDT, and MiDH. However, we find that the non-aggregation locations share the same microclimate attributes. Generally, the aggregation locations group with the other interior grove locations and one edge location. Likewise, we do not find support for the prediction that aggregation locations represent a variation constrained, unique, or uniform set of climatic attributes across overwintering groves. Instead, we find that microclimate attributes in the aggregation locations (except for MiDH) show a significant correlation with latitude. Therefore, it appears that monarchs select groves, that aggregation locations are not entirely conditioned on local microclimate attributes, that a large proportion of each overwintering grove represents suitable aggregation locations, and that what is selected as aggregation microclimate varies geographically. We conclude that if a climatic niche does exist, it is a geographically variable realized niche, thus broader than what can be discovered in a single grove, and broader than what has been recognized to date.
Generalizing, ecologically we find that aggregation locations become brighter, hotter, and not necessarily drier in a southern progression. Conceptually, we find that the conditions selected by overwintering aggregations of monarch butterflies are described by both local environmental attributes and spatial or geographically variable environmental attributes. Although it was difficult to find support for the microclimate hypothesis expressed as habitat selection in aggregation locations, it was possible to support a microclimate hypothesis on the non-hierarchical scale of grove interior. In stark contrast, for aggregation locations, it was quite easy to find support for latitude-correlated hierarchical habitat attributes. This means that it will not be possible to understand the overwintering ecology of monarch butterflies in California without explicitly considering scale. Local environmental attributes are nested in and interact with larger geographic variations.
Tracking aggregations over time proves to be more problematic than anticipated and presents a challenge to any study on habitat selection on the shortest time scale. Sensor groups needed to be moved to new locations as aggregations moved, but those locations blinked on or off in time, creating a dynamic system. We think that valid fine-grained (hourly) comparisons on the time axis will require real-time tracking of aggregations, which we were not able to accomplish. Instead, our results address habitat selection on a daily scale. Thus, we acknowledge habitat selection by overwintering monarch on a previously recognized temporal scale, including for months at a time (Anderson and Brower, 1996), for individual months (Fisher et al., 2018), and for days or hours (Leong et al., 1991; Weiss et al., 1991; Frey and Leong, 1993; Frey and Schaffner, 2004). Here, we contribute a daily perspective to habitat selection, but we also add a spatial one. Therefore, we conclude that it is necessary to address monarch butterfly overwintering microclimate selection over space and time.
We acknowledge that we likely missed chronicling specific microclimate changes that triggered movement episodes and that at best we capture microclimate changes on a daily scale. However, we would argue that sorts of fine-scale studies that show movement can happen over hours (e.g., Leong et al., 1991; Weiss et al., 1991; Frey and Leong, 1993; Frey and Schaffner, 2004) will eventually need to be replicated across groves, as responses to microclimate change may have a spatial component. In other words, we can readily show that there is a spatial component to overwintering microclimate; therefore, we argue that the spatial and temporal components will need to be better coupled in future studies. Only then will we understand what the limiting factors are and what the tolerable ranges of variation are. In addition, we hypothesize that monarchs can select aggregation locations given light, temperature, and humidity conditions upon arrival at overwintering sites. We hypothesize this assuming that these attributes are perceptible to monarchs. In contrast, we hypothesize that only predominant winds could be readily detected. Storm winds are episodic and, by definition, could only be perceived and, therefore, reacted to during a storm episode. This is relevant, because responses to microclimate attributes might be nonlinear if one attribute overrides the importance of others. This would further complicate the coupling of spatial and temporal components.
A significant and predictable complication was that attributes are correlated with each other. This suggests a potential limitation to separating climatic attributes statistically, although these conditions are ecologically correlated as well. In other words, our conceptual interpretation might be off if only one of these attributes is the driver and the others only seem important because they correlate with the driver, or, alternatively, they may all be important but to variable degrees or under different conditions. The data are, thus, inherently difficult to analyze. In particular, we suspect that a model selection approach would end up selecting a single attribute if the analysis incorporated an attribute disqualification step based on correlation. We also suspect that the collection or real-time data across multiple groves will be necessary in order to understand which attributes are the most important under what conditions and on what scale.
Mechanistic Model for Habitat Selection in Grove Interiors
The microclimatic data from interior grove locations (including the aggregation locations) show that selection across the continuum of possible values is for high maximum daily light, low average daily light, and low maximum daily temperature (Table 2 and Figure 7). This pattern would develop if light is bright (high MaDL) but of short duration (low ADL), and if values of temperature and light are correlated (Figure 7). Short-duration bright light coupled with low maximum temperature due to low average light would facilitate the preservation of lipids, which is known to be associated with overwintering success (Chaplin and Wells, 1982; Masters et al., 1988).
Specifically, overwintering monarch butterflies exposed to energy fluxes from light can passively raise their body temperature, avoid energetically expensive shivering, and exceed the body temperature required for flight while also minimizing energy expenditure (Masters et al., 1988; Alonso-Mejia et al., 1993). Additionally, short-duration energy fluxes result in low average daily light, resulting in low maximum daily temperature. Low MaDT allows for monarchs to maintain low internal body temperature (Masters et al., 1988). This is important for survival given that oxygen consumption (associated with lipid metabolism) increases exponentially with temperature (Chaplin and Wells, 1982). Thus, based on habitat selection, we cannot assert a narrow conclusion that aggregation locations show narrowly defined and unique overwintering conditions, except to the degree that light exposure to the southeast is energetically essential. However, we can support the broader inference that grove interiors are energetically favorable for overwintering monarchs and likely increase overwinter survival.
The potential for the latitudinal dependent pattern we are suggesting seems to have been recognized by Chaplin and Wells (1982). They state: “Some of the monarch butterfly aggregations in central California, such as the ones at Santa Cruz, persist somewhat longer than those in southern California (Tuskes and Brower, 1978). Progressive tightening of the energy balance due to higher nocturnal temperatures as one moves down the California coast may limit the southerly distribution and duration of aggregations.” Thus, Chaplin and Wells recognize a latitudinal variation in the available climatic conditions in overwintering groves.
Coupling Mechanistic Energetic Hypothesis, Local Environment, and Latitudinal Variation
The correlation between increase in day length and decrease in latitude (Hooker et al., 2018) is a possible coupling between the presence of multiple scales (proposed here) and a mechanistic energetic hypothesis. Our results, combined with a mechanistic energetic hypothesis from the study of Chaplin and Wells (1982) and its latitudinal correlates (Tuskes and Brower, 1978), lead us to infer that a spatially explicit framework will be meaningful for understanding habitat selection by overwintering western monarch butterflies. While attributes are significantly different across groves and correlated with latitude, high maximum daily light (MaDL), low average daily light (ADL), and low maximum daily temperature (MaDT) seem to be under selection across all groves. While the specific level of light and temperature available seems dependent on grove placement relative to latitude, overwintering monarchs could still select from the available conditions in groves in a manner that appears to locally benefit lipid reserves. Thus, if correct, a mechanistic energetic hypothesis coupled with understanding of latitudinal differences among groves could potentially inform our understanding of overwintering with regard to range limits, geographically variable phenology, responses to climate change, and fitness (Tuskes and Brower, 1978; Chaplin and Wells, 1982; Masters et al., 1988; Fisher et al., 2018). We suggest that overwintering western monarchs can tolerate a larger range of climatic attributes than previously appreciated, because climatic variability among groves is more than previously appreciated (Figure 8, but see Tuskes and Brower, 1978; Chaplin and Wells, 1982). This suggests some novel research questions.
The exploration of beneficial grove attributes based on grove locations rather than intrinsic (local internal environment) grove characteristics seems particularly ripe for exploration or modeling. For example, Fisher et al. (2018) showed that the location of an occupied overwintering site can be predicted using models of climatic variables with a resolution of ~1 km2(30 arc seconds) (WorldClim2.0 Hijmans et al., 2005; Fick and Hijmans, 2017). A 1 km2 resolution is more descriptive of overwintering grove locations than of groves (average size 0.17 km2, Pelton et al., 2016). It might be fruitful to ask whether there are additional variables at the landscape level that are good predictors of suitable overwintering grove locations.
Given climate change has effects on butterflies (Halsch et al., 2021); it might be fruitful to consider habitat attributes associated with what Chaplin and Wells (1982) call the “Progressive tightening of the energy balance…” which “…may limit the southern distribution and duration of overwintering aggregations.” Not only may lack of cold negatively influence overwintering monarch's energy balance, it may also interfere with the timer that terminates diapause, as suggested by Green and Kronforst (2019). Climate change affects maybe geographic variable (Halsch et al., 2021) and, thus, may impact overwintering monarch butterflies differently in different portions of their range. Therefore, it seems that both excessive heat and lack of cold could be relevant parameters influencing the geography of overwintering.
Finally, our finding that the aggregation location does not have a unique set of attributes suggests that we should question why monarchs aggregate. If it is not to concentrate itself into a limited and unique microclimate in the aggregation location, then maybe there is a fitness benefit derived from the aggregation behavior itself. It has been shown in monarchs and other insects (Brower et al., 2008; Szejner-Sigal and Williams, 2022) that diapaused individuals in aggregations benefit from an energetic fitness advantage. Metabolic rates decrease with increase in aggregation size, although the effects may only be detected at lowest temperatures. This means that under certain conditions, aggregating may be a group strategy for energy conservation. Aggregations have also been shown to provide a fitness advantage for aposematic prey that is very unpalatable (Sillen-Tullberg and Leimar, 1988). Interestingly, unpalatable prey individuals with strong aposematic signals benefit most from aggregations, because their detectability is increased only slightly by grouping. This is true especially in a large group, because a large group is already more detectable than a small group, which is more detectable than an individual. “If the increased detectability of a group compared with solitary prey does not translate into increased mortality risk per individual, then grouping is always more favorable than a solitary lifestyle. A decreased per capita mortality risk can be produced by a dilution effect, which means that when a predator cannot eat the whole group, an individual's chance of being eaten is smaller in a group than when it is solitary” (Riipi et al., 2001). In addition to the individual fitness advantage due to dilution, predators show faster avoidance learning of unpalatable aposematic prey as prey group size increases. Therefore, should we consider that if an overwintering site is composed of several small or a few large aggregations it could be a function of a local visual predator community or thermal ecology but not necessarily grouping into a location with the most suitable microclimate?
Scale and Hierarchical vs. Non-Hierarchical Structure
There does not appear to be a unique set of microclimate conditions across all the overwintering aggregation locations. Therefore, it is not surprising that habitat selection is not uniform across the overwintering range. Instead, we find variable selection for ADL, MaDL, VDL, MaDT, VDT, and MiDH. We also find that these attributes show a significant correlation with latitude, again, making it not surprising that habitat selection is not uniform across the range. In addition, overwintering habitat is not distributed continuously over the landscape, and instead it occurs in distinct groves. This makes it plausible that at least some of the variations among the groves are hierarchical (i.e., habitat selection predicated on geographic position). These hierarchical attributes depend on the pre-existence of another attribute (Kristan, 2006).
A variable regarded as relevant to habitat selection by overwintering western monarch butterflies is wind. We think it is important to speculate that wind has the potential to be significantly confounded if spatial and temporal hierarchical variations are underappreciated. In the long term (weeks to months), the prevailing winds in coastal California are from the west or northwest [Greeley et al., 1996; Western Regional Climate Center-Climate of California (WRCC), https://wrcc.dri.edu/]. An overwintering grove located on a flat marine terrace exposed to the west or northwest is predicated to experience all prevailing (NW) wind events. In contrast, an overwintering grove located on a south facing coastline, on the leeward side of an east-west or southwest-northeast oriented ridgeline (see Lane, 1993) would be significantly buffered from prevailing wind events (WRCC). In addition to wind, fog (impacting humidity), solar radiation, and temperature could be significantly different between these two grove locations (WRCC), even if they are less than a kilometer apart. In the short term (hours to days), damaging storm winds blow from the south or southeast (Leong et al., 2004; WRCC). These are episodic winds. Even though there is an agreement in the literature that wind is important and that SE storm winds can reduce monarch survival, the literature is mixed as to whether it addresses prevailing winds from the NW (Weiss et al., 1991; Leong et al., 2004) or whether it addresses episodic winds from the SE (Leong et al., 1991), or both (Leong et al., 2004). If both are relevant, then not only do they both need to be addressed as distinct variables, but their effects and contributions to habitat selection in groves would need to be partitioned using both hierarchical and non-hierarchical perspectives. This is a clear example where ascribing a habitat attribute solely to aggregation location would be to collapse hierarchical attributes onto non-hierarchical ones by not recognizing the contribution of a geography-based scale.
Potential for Type II Error
We consider some possible sources of a type II error (a potential to not find differences when they actually exist).
It was difficult to place sensors directly onto the aggregation of monarch butterflies given we wanted to avoid disturbing the aggregation or impacting clustering behavior. Therefore, sensor groups were placed approximately 2 m from the actual aggregation (but at the same height). Thus, if attribute(s) under selection varied over a horizontal distance of <2 m, we would not have had the resolution to measure them.
The historically low overwintering monarch population (Pelton et al., 2019) could have made it difficult to find a difference among aggregation locations and other locations in groves. In particular, if monarchs were not saturating locations with suitable attributes, it means there could have been locations in the grove that were suitable but simply not occupied. Lack of occupancy, or under-occupancy, might have led to what we called “interior” locations having been defined as “aggregation” locations in years with a larger overwintering population. This might have made it harder for us to find support for the microclimate hypothesis. However, the potential of obtaining type II error(s) does not negate the fact that when we find differences, they are very likely to exist. We argue that this study brings forth additional spatial scales on which monarch butterflies select an overwintering habitat, and importantly shows that some variables under selection have values that correlate with latitude.
Our microhabitat data were collected at one time and toward the end of the overwintering season. The microhabitat data were a snapshot of mostly fixed attributes. However, for variable attributes (i.e., distance to and type of nectar source and percent live cover) and to the degree that they vary, it is possible we could have gotten different results had we taken the data at a different time.
It is possible that there are important characteristics that we did not monitor. Wind may be an attribute that defines suitable microclimate for monarchs given the conclusion that monarch clustering behavior may be heavily dependent on avoiding wind (Leong, 1990). Regardless, we see a need to explicitly consider prevailing and episodic winds, and hierarchical and non-hierarchical patterns of variation, vis-a-vis in grove vegetative obstructions. On the one hand, we might conclude that any approach that uses in-grove habitat obstruction and modeling to define wind conditions under selection (i.e., Weiss et al., 1991) would logically need to first demonstrate significant differences in habitat obstruction across grove locations, and subsequent selection of specific conditions. We suggest this step, because we were unable to show that the aggregation location had a significantly different habitat obstruction relative to the other sample locations. Thus, in our study, wind would not be predicted to be significantly different across the sample locations, because vegetation obstruction was not significantly different. However, on the other hand, if we come to our conclusion erroneously (type II error), then a wind modeling approach might be fully justified.
Managing Overwintering Habitat
We cannot find evidence that groves need management for aggregation locations per se. Instead, the entire grove interior seems to be the management target. The range of tolerance, as we know it thus far when considering a spatial scale, can be seen in Figure 8. This Figure describes microclimate attributes in occupied aggregation sites.
Vegetation
We cannot define one set of suitable overwintering microhabitat attributes that apply to all aggregation locations in our suite of groves. This is likely because we found no singular suite of microhabitat attributes that correlated with microclimate. Individual attributes are considered below.
Light
We find that aggregation locations were significantly different from NW locations in terms of having less vegetative obstruction in the SE direction. This pattern could be consistent with exposure to short-duration bright light and the associated energetically favorable habitat. Managing the interior of overwintering groves so some locations could have exposure to SE seems appropriate.
Wind
Groves are currently managed for tree covers as a means to dampen wind and light. We did not measure wind in the sampling locations within groves. Instead, we measured its proxy: vegetative obstruction. We were surprised that the aggregation locations differed by having less vegetative obstruction in the SE direction. Less obstruction to SE makes sense in terms of thermal ecology (see above) but suggests that aggregation sites are vulnerable to SE storm winds. Would we recommend using trees to dampen SE winds? No, dampening SE winds seems at odds with maintaining sufficient light from SE. An additional difference we found was that the NE sample locations (interior) have more obstruction to SE than expected. Thus, the NE sample locations would provide a more significant wind break in the SE direction (storm winds) than an average portion of the grove. Taken together, this suggests the following management strategy: focus on using trees for wind abatement should be in the NE section of overwintering groves, while some SE sun exposure should be maintained in other interior portions by not overplanting to abate SE winds.
We were likewise surprised that the aggregation locations did not differ from the other locations in some additional components of obstruction. Logically, it seems that if there is no difference in tree cover among locations in the groves we sampled, then there should also be no difference in wind. Therefore, we suggest more critical theoretical and empirical assessments of the relationship among vegetative obstruction, obstruction positioning, landscape obstruction, and wind in aggregation locations, and the contribution of hierarchical and non-hierarchical attributes at geographic and local grove scales.
Humidity
Humidity does vary across overwintering groves, but it does not vary significantly with latitude. Minimum daily humidity (MiDH) and variance in daily humidity (VDH) both differ across some sample locations, but collectively, the interior locations are different from the edges. Thus, if humidity is a plausible management target, it would be at the level of grove interior and not at the level of aggregation. The aggregation locations did have a more live ground cover. Alonso-Mejia and Arellano-Guillermo (1992) found that monarchs elevated even just 30 cm above the ground surface had lower mortality due to freezing than monarchs on the ground. Here, live ground cover may provide a necessary thermal refuge or structure for climbing. This suggests a management strategy: planting live ground covers may be a way of maintaining relative humidity in groves while also providing the structural benefit of ground cover.
Overwintering Attributes Vary in Space and Time
To characterize a species' environmental associations, habitat preference and habitat selection implicitly require assumptions on appropriate spatial scale (Mertes et al., 2020). However, only explicitly considering scale allows for discovery of relevant scales (Mertes et al., 2020) and their associated local and spatial attributes. Importantly, there is no single relevant a priori grain size or scale (Lawler and Torgersen, 2020). Generally speaking, across a diversity of taxa and habitat types, when the appropriate spatial scale has been explicitly considered, it has been found to be plural: scales. This means that local environmental non-hierarchical attributes are nested in hierarchical geographic variables. For example, local environmental attributes in sample locations and geographically variable conditions impact abundance and diversity in wetland birds (Hanioka et al., 2018). Local environmental factors influence the presence and abundance of multiple insect species in their communities on small spatial scales, while spatial variation becomes a more important determinant than local environment on a larger spatial scale (He et al., 2020). Lawler and Torgersen's (2020) recent review concludes that it is clear from theoretical and empirical research that ecological processes are indeed affected by processes operating on multiple spatial scales.
We find that non-hierarchical local environmental conditions and hierarchical latitudinally variable attributes are relevant to characterizing western monarch butterfly overwintering microclimate. We predict that for the overwintering distribution of monarch butterflies, as has been found by Siegloch et al. (2018) for a diversity of insects and by Halsch et al. (2021) for breeding California butterflies including monarchs, the contribution of environmental and spatial predictors will vary according to the scale of observation. Indeed, it seems impossible to recognize spatial predictors if none are considered or if they are all presumed to be environmental. Here, we show that they can no longer all be considered environmental because some are geographic. Thus, it is important to accept that scale is relevant to overwintering monarchs. It will be important in the future to explore which factors are important and on what scale they operate (Siegloch et al., 2018; Lawler and Torgersen, 2020).
Data Availability Statement
The raw data supporting the conclusions of this article will be made available by the authors, without undue reservation.
Author Contributions
FV conceptualized the theoretical context and experimental design and contributed significantly to the writing. KS contributed to the theoretical context and experimental design, conducted the analysis, and contributed significantly to the writing. All authors contributed to the article and approved the submitted version.
Funding
United States Fish and Wildlife Service grants number 48733 and 52035: support for equipment and personnel. Larkin Group: donation to the Western Monarch Butterfly Fund, College of Science and Mathematics, California Polytechnic State University, San Luis Obispo: support for supervision of student research.
Conflict of Interest
The authors declare that the research was conducted in the absence of any commercial or financial relationships that could be construed as a potential conflict of interest.
Publisher's Note
All claims expressed in this article are solely those of the authors and do not necessarily represent those of their affiliated organizations, or those of the publisher, the editors and the reviewers. Any product that may be evaluated in this article, or claim that may be made by its manufacturer, is not guaranteed or endorsed by the publisher.
Acknowledgments
We thank Dr. Clinton Francis and Dr. Andrew Schaffner for their collaboration in the study design and analysis. We thank Charis van der Heide and Makenna Glisson for their assistance in equipment deployment and data collection. We thank Rob Brewster and Doug Brewster for their support in building the equipment for the study. This study arose at United States Fish and Wildlife Service Expert Elicitation that addressed the conservation status of western monarch butterflies and was principally supported by a grant from the Department of Interior, U.S.F.W.S, Coastal Division. We thank the organizers and participants of the elicitation for their collective guidance.
References
Alonso-Mejia, A., and Arellano-Guillermo, A. (1992). Influence of temperature, surface body moisture and height aboveground on survival of monarch butterflies overwintering in Mexico. Biotropica 415–419. doi: 10.2307/2388612
Alonso-Mejia, A., Glendinning, J. I., and Brower, L. P. (1993). “The influence of temperature on crawling, shivering, and flying in overwintering monarch butterflies in Mexico,” in Biology and Conservation of the Monarch Butterfly, eds S. B. Malcolm and M. P. Zalucki, 309–314.
Anderson, J. B., and Brower, L. P. (1996). Freeze-protection of overwintering monarch butterflies in Mexico: critical role of the forest as a blanket and an umbrella. Ecol. Entomol. 21, 107–116. doi: 10.1111/j.1365-2311.1996.tb01177.x
Barker, J. F., and Herman, W. S. (1976). Effect of photoperiod and temperature on reproduction of the monarch butterfly, Danaus plexippus. J. Insect Physiol. 22, 1565–1568. doi: 10.1016/0022-1910(76)90046-9
Bellamy, C., Boughey, K., Hawkins, C., Hawkins, C., Reveley, S., Spake, R., et al. (2020). A sequential multi-level framework to improve habitat suitability modelling. Landsc. Ecol. 35, 1001–1020. doi: 10.1007/s10980-020-00987-w
Billings, J. (2019). Opening a window on southwestern monarchs: fall migrant monarch butterflies, Danaus plexippus (L.), tagged synchronously in southeastern Arizona migrate to overwintering regions in either southern California or Central Mexico. J. Lepidopter. Soc. 73, 257–267. doi: 10.18473/lepi.73i4.a1
Brower, L. P. (1995). Understanding and misunderstanding the migration of the monarch butterfly (Nymphalidae) in North America: 1857-1995. J. Lepidopter. Soc. 49, 304–385.
Brower, L. P., and Missrie, M. (1998). Fires in the monarch butterfly sanctuaries in México, Spring 1998. Que Pasa 3, 9–11.
Brower, L. P., Williams, E. H., Fink, L. S., Zubieta, R. R., and Ramirez, M. I. (2008). Monarch butterfly clusters provide microclimatic advantages during the overwintering season in Mexico. J. Lepidopterists' Soc. 62, 177–188.
Calvert, W. H., Zuchowski, W., and Brower, L. P. (1983). The effect of rain, snow and freezing temperatures on overwintering monarch butterflies in Mexico. Biotropica 15, 42–47. doi: 10.2307/2387997
Chaplin, S. B., and Wells, P. H. (1982). Energy reserves and metabolic expenditures of monarch butterflies overwintering in southern California. Ecol. Entomol. 7, 249–256. doi: 10.1111/j.1365-2311.1982.tb00664.x
Fahrig, L. (1992). Relative importance of spatial and temporal scales in a patchy environment. Theor. Popul. Biol. 41, 300–314. doi: 10.1016/0040-5809(92)90031-N
Fick, S. E., and Hijmans, R. J. (2017). WorldClim 2: New 1-km spatial resolution climate surfaces for global land areas. Int. J. Climatol. 37, 4302–4315. doi: 10.1002/joc.5086
Fisher, A., Saniee, K., Van der Heide, C., Griffiths, J., Meade, D., and Villablanca, F. (2018). Climatic niche model for overwintering monarch butterflies in a topographically Complex Region of California. Insects 9:167. doi: 10.3390/insects9040167
Frey, D., and Schaffner, A. (2004). “Spatial and temporal pattern of monarch overwintering abundance in western North America,” in The Monarch Butterfly: Biology and Conservation, eds K. Oberhauser and M. J, Solensky (Ithaca, NY: Cornell University Press), 167–176.
Frey, D. F., and Leong, K. L. (1993). Can microhabitat selection or differences in 'catchability' explain male-biased sex ratios in overwintering populations of monarch butterflies? Anim. Behav. 45, 1025. doi: 10.1006/anbe.1993.1120
Greeley, R., Blumberg, D. G., and Williams, S. H. (1996). Field measurements of the flux and speed of wind-blown sand. Sedimentology 43, 41–52. doi: 10.1111/j.1365-3091.1996.tb01458.x
Green, D. A., and Kronforst, M. R. (2019). Monarch butterflies use an environmentally sensitive, internal timer to control overwintering dynamics. Mol. Ecol. 28, 3642–3655. doi: 10.1111/mec.15178
Halsch, C. A., Shapiro, A. M., Fordyce, J. A., Nice, C. C., Thorne, J. H., Waetjen, D. P., et al. (2021). Insects and recent climate change. Proc. Natl. Acad. Sci. 118:e2002543117. doi: 10.1073/pnas.2002543117
Hanioka, M., Yamaura, Y., Yamanaka, S., Senzaki, M., Kawamura, K., Terui, A., et al. (2018). How much abandoned farmland is required to harbor comparable species richness and abundance of bird communities in wetland? Hierarchical community model suggests the importance of habitat structure and landscape context. Biodivers. Conserv. 27, 1831–1848. doi: 10.1007/s10531-018-1510-5
He, S., Soininen, J., Deng, G., and Wang, B. (2020). Metacommunity structure of stream insects across three hierarchical spatial scales. Ecol. Evol. 10, 2874–2884. doi: 10.1002/ece3.6103
Hijmans, R. J., Cameron, S. E., Parra, J. L., Jones, P. G., and Jarvis, A. (2005). Very high resolution interpolated climatesurfaces for global land areas. Int. J. Climatol. 25, 1965–1978 doi: 10.1002/joc.1276
Hooker, J., Duveiller, G., and Cescatti, A. (2018). A global dataset of air temperature derived from satellite remote sensing and weather stations. Sci. Data 5:180246. doi: 10.1038/sdata.2018.246
Hutto, R. (1985). “Habitat selection by nonbreeding, migratory land birds,” in Habitat Selection in Birds, ed M. L. Cody (New York, NY: Academic Press), 455–473.
James, D. (1982). Ovarian dormancy in Danaus plexippus (L.)(Lepidoptera: Nymphalidae)-oligopause not diapause. Austr. J. Entomol. 21, 31–35. doi: 10.1111/j.1440-6055.1982.tb01761.x
Johnson, D. H. (1980). The comparison of usage and availability measurements for evaluating resource preference. Ecology 61, 65–71. doi: 10.2307/1937156
Kristan, W. B. (2006). Sources and expectations for hierarchical structure in bird-habitat associations. Condor 108, 5–12 doi: 10.1093/condor/108.1.5
Lane, J. (1993). “Overwintering monarch butterflies in California: past and present,” in Biology and Conservation of the Monarch Butterfly, eds S. B. Malcolm and M. P. Zalucki, 335–344
Lawler, J. J., and Torgersen, C. E. (2020). Assessing the relative importance of factors at multiple spatial scales affecting terrestrial and aquatic wildlife. Curr. Landsc. Ecol. Rep. 5, 12–24. doi: 10.1007/s40823-019-00047-3
Leong, K. L. H. (1990). Microenvironmental factors associated with the winter habitat of the monarch butterfly (Lepidoptera: Danaidae) in central California. Ann. Entomol. Soc. Am. 83, 906–910. doi: 10.1093/aesa/83.5.906
Leong, K. L. H., Frey, D., Brenner, G., Baker, S., and Fox, D. (1991). Use of multivariate analyses to characterize the monarch butterfly (Lepidoptera: Danaidae) winter habitat. Ann. Entomol. Soc. Am. 84, 263–267. doi: 10.1093/aesa/84.3.263
Leong, K. L. H., Sakai, W. H., Bremer, W., Feuerstein, D., and Yoshimura, G. (2004). “Analysis of the pattern of distribution and abundance of monarch overwintering sites along the California coastline,” in The Monarch Butterfly: Biology and Conservation, eds K. S. Oberhauser and M. J. Solensky (Ithaca, NY: Cornell University Press), 177–185.
MacKenzie, D. I., Nichols, J. D., Royle, J. A., Pollock, K. H., Bailey, L., and Hines, J. E. (2017). Occupancy Estimation and Modeling: Inferring Patterns and Dynamics of Species Occurrence. Netherlands: Elsevier Science. doi: 10.1016/B978-0-12-407197-1.00019-3
Martínez-Méndez, N., Aguirre-Planter, E., Eguiarte, L. E., and Jaramillo-Correa, J. P. (2016). Ecological niche modeling of species of the genus Abies (Pinaceae) in Mexico: some taxonomic and conservation implications. Botan. Sci. 94, 5–24. doi: 10.17129/botsci.508
Masters, A., Malcolm, S., and Brower, L. P. (1988). Monarch butterfly (Danaus plexippus) thermoregulatory behavior and adaptations for overwintering in Mexico. Ecology 69:458. doi: 10.2307/1940444
Matthiopoulos, J., Fieberg, J., and Aarts, G. (2020). Species-Habitat Associations: Spatial Data, Predictive Models, and Ecological Insights. University of Minnesota Libraries Publishing. Retrieved from: http://hdl.handle.net/11299/217469
Mayor, S. J., Schneider, D. C., Schaefer, J. A., and Mahoney, S. P. (2009). Habitat selection at multiple scales. Ecoscience 16, 238–247. doi: 10.2980/16-2-3238
Mertes, K., Jarzyna, M. A., and Jetz, W. (2020). Hierarchical multi-grain models improve descriptions of species' environmental associations, distribution, and abundance. Ecol. Appl. 30:e02117. doi: 10.1002/eap.2117
Ortiz-Bibian, M. A., Blanco-García, A., Lindig-Cisneros, R. A., Gómez-Romero, M., Castellanos-Acuña, D., Herrerías-Diego, Y., et al. (2017). Genetic variation in abies religiosa for quantitative traits and delineation of elevational and climatic zoning for maintaining monarch butterfly overwintering sites in Mexico, considering climatic change. SilvaeGenetica 66, 14–23. doi: 10.1515/sg-2017-0003
Pelton, E., Jepsen, S., Schultz, C., Fallon, C., and Black, S. H. (2016). State of the Monarch Butterfly Overwintering Sites in California. Report to USFWS. The Xerces Society for Invertebrate Conservation, Portland, OR.
Pelton, E. M., Schultz, C. B., Jepsen, S. J., Black, S. H., and Crone, E. E. (2019). Western Monarch population plummets: status, probable causes, and recommended conservation actions. Front. Ecol. Evol. 7:258. doi: 10.3389/fevo.2019.00258
Pyle, R. M. (2014). Chasing Monarchs: Migrating With the Butterflies of Passage. New Haven, CT: Yale University Press.
Rawlins, J. E. (1980). Thermoregulation by the black swallowtail butterfly, Papiliopolyxenes (Lepidoptera: Papilionidae). Ecology 61, 345–357. doi: 10.2307/1935193
Riipi, M., Alatalo, R. V., LindstroÈm, L., and Mappes, J. (2001). Multiple benefits of gregariousness cover detectability costs in aposematic aggregations. Nature 413, 512–514. doi: 10.1038/35097061
Siegloch, A. E., da Silva, A. L. L., da Silva, P. G., and Hernández, M. I. M. (2018). Local and regional effects structuring aquatic insect assemblages at multiple spatial scales in a Mainland-Island region of the Atlantic Forest. Hydrobiologia 805, 61–73. doi: 10.1007/s10750-017-3277-1
Sillen-Tullberg, B., and Leimar, O. (1988). The evolution of gregariousness in distasteful insects as a defense against predators. Am. Naturalist 132, 723–734.
Szejner-Sigal, A., and Williams, C. M. (2022). Aggregations reduce winter metabolic rates in the diapausing ladybeetle Hippodamia convergens. J. Insect Physiol. 137:104357. doi: 10.1016/j.jinsphys.2022.104357
Tuskes, P. M., and Brower, L. P. (1978). Overwintering ecology of the monarch butterfly, Danaus plexippus L., in California. Ecol. Entomol. 3, 141–153. doi: 10.1111/j.1365-2311.1978.tb00912.x
Urquhart, F. A., and Urquhart, N. R. (1978). Autumnal migration routes of the eastern population of the monarch butterfly (Danaus plexippus L.; Danaidae; Lepidoptera) in North America to the overwintering site in the Neovolcanic Plateau of Mexico. Can. J. Zool. 56, 1759–1764. doi: 10.1139/z78-240
Urquhart, F. A., Urquhart, N. R., and Munger, F. (1970). A study of a continuously breeding population of Danaus plexippus in southern California compared to a migratory population and its significance in the study of insect movement. J. Res. Lep 7, 169–181.
Weiss, S., Rich, P., Murphy, D., Calvert, W., and Ehrlich, P. (1991). Forest canopy structure at overwintering monarch butterfly sites: measurements with hemispherical photography. Conserv. Biol. 5, 165–175. doi: 10.1111/j.1523-1739.1991.tb00121.x
Keywords: Danaus plexippus, overwintering, microclimate, western monarch, habitat selection, scale, environmental space, geographic space
Citation: Saniee K and Villablanca F (2022) Hierarchy and Scale Influence the Western Monarch Butterfly Overwintering Microclimate. Front. Conserv. Sci. 3:844299. doi: 10.3389/fcosc.2022.844299
Received: 27 December 2021; Accepted: 07 April 2022;
Published: 16 May 2022.
Edited by:
Oded Berger-Tal, Ben-Gurion University of the Negev, IsraelReviewed by:
Sylvain Pincebourde, UMR7261 Institut de Recherche sur la Biologie de l'Insecte (IRBI), FranceYasuhiro Sato, University of Zurich, Switzerland
Copyright © 2022 Saniee and Villablanca. This is an open-access article distributed under the terms of the Creative Commons Attribution License (CC BY). The use, distribution or reproduction in other forums is permitted, provided the original author(s) and the copyright owner(s) are credited and that the original publication in this journal is cited, in accordance with accepted academic practice. No use, distribution or reproduction is permitted which does not comply with these terms.
*Correspondence: Francis Villablanca, fvillabl@calpoly.edu