Mitochondrial DNA and Population Genomics Reveal Additional Cryptic Diversity in the Green Salamander (Subgenus Castaneides) Species Complex
 Matthew L. Niemiller1*
  Mark A. Davis2
  Milton Tan2
  J. J. Apodaca3,4
  Katherine E. Dooley1
  Roberto V. Cucalón2 Joseph B. Benito1 K. Denise Kendall Niemiller1 Rebecca H. Hardman5
  Daniel Istvanko6
  Dustin Thames7
- 1Department of Biological Sciences, The University of Alabama in Huntsville, Huntsville, AL, United States
- 2Illinois Natural History Survey, Prairie Research Institute, University of Illinois Urbana-Champaign, Champaign, IL, United States
- 3Tangled Bank Conservation, LLC, Asheville, NC, United States
- 4Amphibian and Reptile Conservancy, Louisville, KY, United States
- 5Center for Wildlife Health, University of Tennessee, Knoxville, TN, United States
- 6Tennessee Wildlife Resources Agency, Biodiversity Division, Crossville, TN, United States
- 7Tennessee Wildlife Resources Agency, Biodiversity Division, Nashville, TN, United States
Cryptic species present particular challenges to biodiversity conservation, as true species diversity and distributional boundaries remain obscured. However, modern molecular tools have afforded unparalleled opportunities to elucidate cryptic species, define their distributions, and, ultimately, develop conservation interventions to extend their evolutionary trajectories into the future. The Green Salamander (Aneides aeneus) complex provides an evolutionary focal point and the Appalachian Highlands an ecological context for the exploration of cryptic speciation in an imperiled taxon. A recent study uncovered significant levels of genetic and genomic variation geographically structured across the Appalachian Highlands, including up to four lineages, one of which (A. caryaensis) was described therein. Here we extend the genetic and genomic examination of the Castaneides species complex by intensive sampling of additional populations along Cumberland Plateau and Appalachian Valley and Ridge of Alabama and Tennessee, employing both mtDNA and RADseq species delimitation approaches to delineate cryptic diversity and boundaries in this region. Analyses of two mitochondrial loci (nd4 and cytb) identified two reciprocally monophyletic lineages, which are also supported by population clustering and phylogenetic analyses of SNPs, that identified two population clusters with no evidence of gene flow. Our genetic and genomic results support the recognition of two additional cryptic lineages in the Castaneides species complex. Ultimately, this information is critical in developing successful adaptive management strategies for this important and endemic component of Appalachian Highland biodiversity.
Introduction
Significant challenges that continue to impede the conservation and management of biodiversity include our lack of taxonomic knowledge on true levels of species diversity (i.e., the Linnean shortfall; Brown and Lomolino, 1998) and our lack of knowledge regarding the related issue of species distributions (i.e., the Wallacean shortfall; Whittaker et al., 2005). Understanding true levels of diversity and distributions of species is of paramount importance in identifying biodiversity hotspots, informing preserve design, and guiding targeted conservation measures for individual species (Myers et al., 2000; Bickford et al., 2007; Niemiller et al., 2013; Espíndola et al., 2016). The discovery of cryptic species complexes—multiple related taxa with little or no morphological differentiation (Struck et al., 2018) that are evolutionarily distinct—is an increasingly common finding from the investigation of broadly distributed “morphospecies” across varying geographic regions, habitats, and taxonomic groups (Beheregaray and Caccone, 2007; Bickford et al., 2007; Adams et al., 2014; Pérez-Ponce de León and Poulin, 2016;). Identifying and recognizing cryptic species is particularly important for morphospecies that are already threatened and experiencing population declines (Niemiller et al., 2013; Delić et al., 2017). Such species may be comprised of multiple lineages at even greater extinction risk (Bickford et al., 2007; Niemiller et al., 2013) and may obfuscate both current and future biodiversity patterns (Fišer et al., 2018; Theodoridis et al., 2019).
The Southern Appalachians in the eastern United States are a global hotspot of salamander biodiversity. In particular, the lungless salamanders of the family Plethodontidae are exceptionally diverse, with high levels of endemicity (Petranka, 1998; Milanovich et al., 2010; Rissler and Smith, 2010). These high levels of salamander diversity and endemism are related to the long geologic history, topography, varying climatic zones, and rich assortment of ecosystems in this region (Pickering et al., 2003; Marshall and Camp, 2006; Kozak and Wiens, 2010). Despite elevated levels of species diversity and evidence of rapid diversification, most taxa are extremely morphologically conserved (Kozak et al., 2006a). Consequently, plethodontid salamanders of the Southern Appalachians have been identified as a textbook example of a non-adaptive radiation (Kozak et al., 2006a; Rundell and Price, 2009) driven by phylogenetic niche conservatism (Kozak and Wiens, 2006, 2010). Cryptic plethodontid species are the products of this non-adaptive radiation (reviewed in Camp and Wooten, 2016), with several cryptic species complexes identified (including both described and undescribed genetic lineages) from the Southern Appalachians, particularly in the genera Desmognathus (Tilley and Mahoney, 1996; Camp et al., 2002; Anderson and Tilley, 2003; Jones et al., 2006; Crespi et al., 2010), Eurycea (Kozak et al., 2006b; Pierson et al., 2019), and Plethodon (Highton, 1989, 1995, 1997, 1999; Highton and Peabody, 2000; Kozak et al., 2006a; Kuchta et al., 2018).
The Green Salamander (Aneides aeneus) is a habitat specialist of moist crevices in rock outcrops, woody cover, and arboreal habitats in mature hardwood cove forests of the Appalachian Highlands (Gordon, 1952; Cupp, 1991; Petranka, 1998). A. aeneus has been assessed as Near Threatened on the IUCN Red List due to evidence of declining populations in portions of its range (Hammerson, 2004) and has been assessed as Vulnerable (G3) by NatureServe (NatureServe, 2021). The salamander is a species of conservation concern in every state throughout its range. Recently, Patton et al. (2019) uncovered substantial geographically structured genetic variation at two mitochondrial loci (cytb and 12s), 12 microsatellite loci, and a nuclear RADseq single-nucleotide polymorphism (SNP) dataset across the range of A. aeneus but focused on populations in western North Carolina. Population genetic, phylogenetic, species delimitation, and morphological evidence supported the recognition of a restricted lineage in the Hickory Nut Gorge area of western North Carolina as a distinct species—A. caryaensis (Patton et al., 2019). In addition, three other primarily non-overlapping lineages were supported by genetic and genomic datasets, including at least two lineages from the southern Cumberland Plateau, Cumberland Plateau, Appalachian Plateau, and Appalachian Valley and Ridge and a third lineage from the southern Blue Ridge Escarpment (Figure 2A in Patton et al., 2019). The authors recommended that these lineages be recognized and managed as evolutionary significant units (ESUs; Moritz, 1994) until additional molecular and morphological studies are conducted to ascertain if these molecular-delimited lineages warrant recognition as full species.
Here, we extend the work of Patton et al. (2019) by sampling additional populations along the escarpments of the southern Cumberland Plateau and Appalachian Valley and Ridge of Alabama and Tennessee where a northern and southern lineage identified by Patton et al. (2019) contact. We employed mtDNA and RADseq delimitation approaches to delineate cryptic molecular diversity and boundaries of these two lineages. Population structure and sequence-based delimitation analyses, which included the mtDNA dataset of Patton et al. (2019), strongly support the recognition of an additional two undescribed species corresponding to the northern and southern lineages, corroborating the results of Patton et al. (2019). Our results strengthen the need for a comprehensive taxonomic revision of the Castaneides species complex.
Materials and Methods
Field Sampling
We collected tissue samples from 113 individuals among 32 sites across the Cumberland Plateau and Appalachian Valley and Ridge of central and eastern Tennessee and northeastern Alabama, USA (Table 1; Figure 1). Tissue samples were obtained from captured salamanders and comprised of tail tips (<5 mm) that were immediately preserved in 95–100% ethanol, then stored at −20°C at The University of Alabama in Huntsville until extraction.
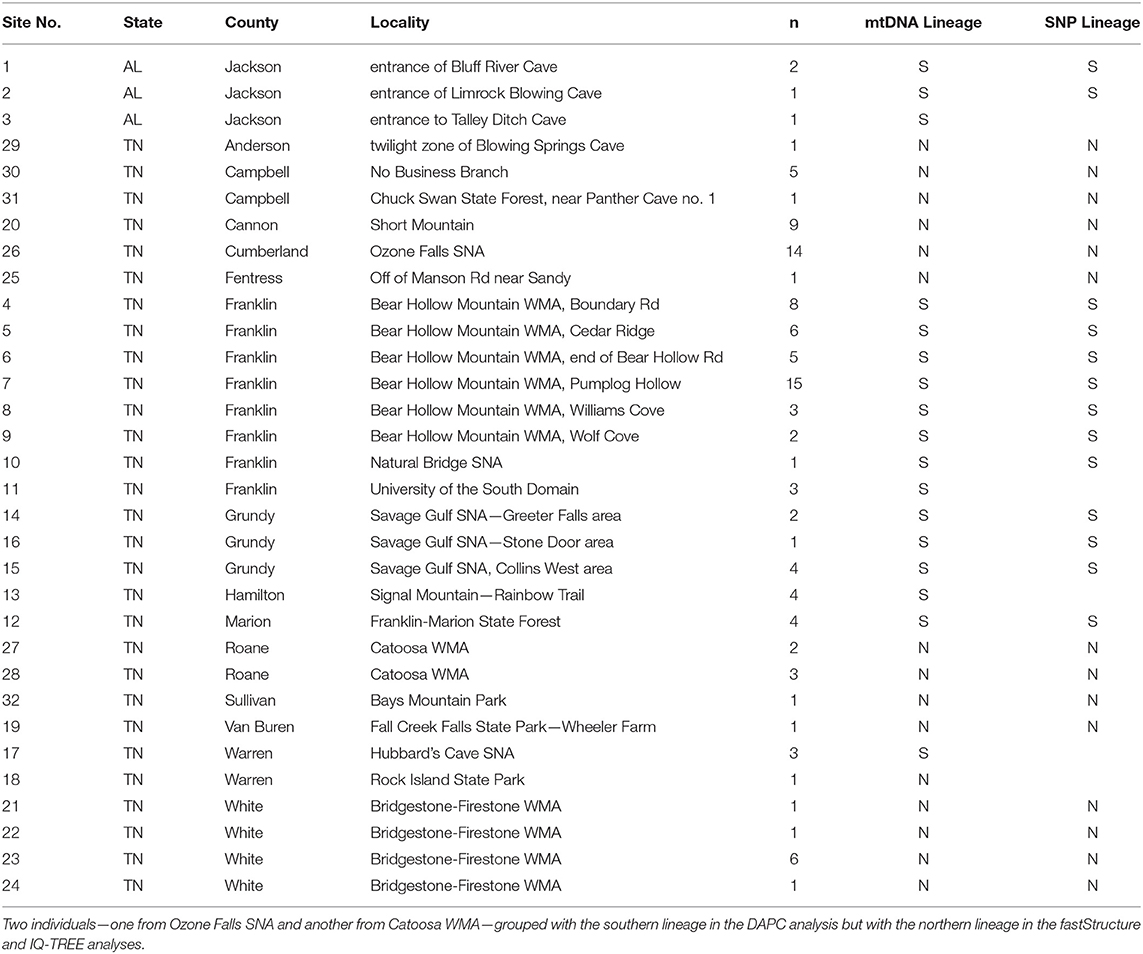
Table 1. Sites of Aneides aeneus sampled in Tennessee and northeastern Alabama for genetic and genomic analyses, including site information, number of individuals (n) sampled from each population, and primary group assignment for mtDNA (nd4 and cytb) and nuclear SNP analyses based on fastStructure, DAPC, and IQ-TREE (N = northern lineage; S = southern lineage).
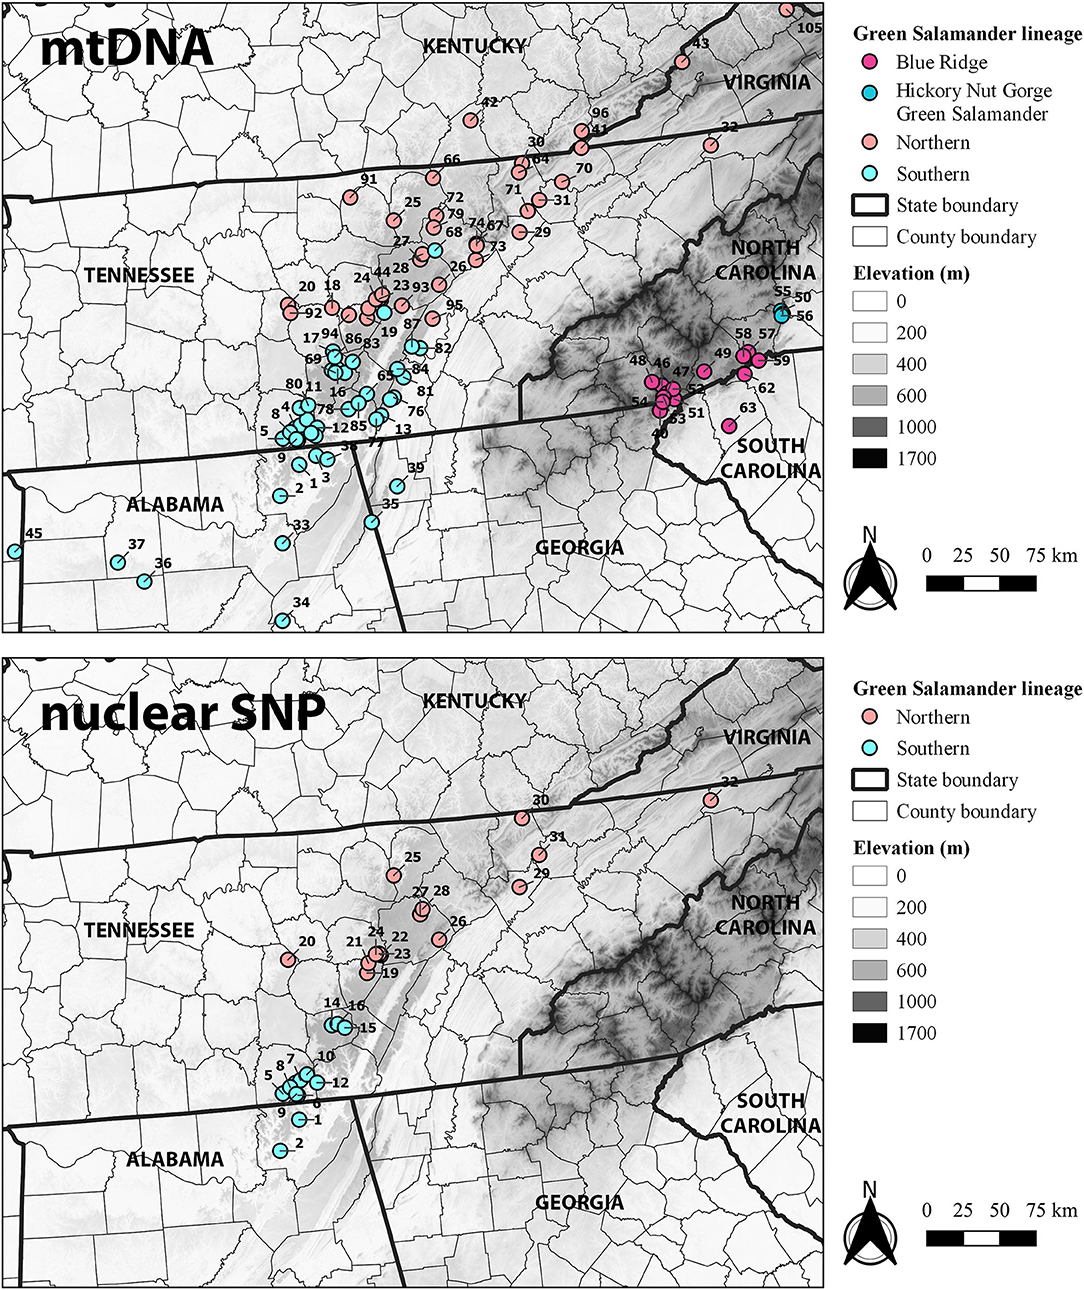
Figure 1. Map showing sample sites by major mitochondrial lineage based on the cytb dataset (A) and by major lineage for fastStructure and IQ-TREE analyses of the nuclear SNP dataset (B). Site numerical labels correspond to those in Table 1; Supplementary Table S1. State labels are shown.
Mitochondrial DNA Sequence Analyses
PCR and Sequencing of Mitochondrial Loci
DNA was extracted from ethanol-preserved tail tissues using a Qiagen DNeasy Blood and Tissue Kit following the manufacturer's protocol (Qiagen Inc., Germantown, Maryland). DNA extracts were quantified using an Invitrogen Qubit 4 fluorometer followed by quality assessment via gel electrophoresis. Polymerase chain reaction (PCR) was used to amplify two mitochondrial loci: NADH dehydrogenase subunit 4 (nd4) and cytochrome B (cytb). Primers used to amplify nd4 and cytb are presented in Table 2. Each 25-μL PCR reaction consisted of 12.5 μL of GoTaq Colorless MasterMix (Promega Corporation, Madison, Wisconsin), 1.0 of 10 μM forward primer, 1.0 of 10 μM reverse primer, 7.5 μL of molecular grade water, and 3.0 μL of DNA template. A single fragment of nd4 was amplified, while two different sized fragments of cytb were amplified, as not all samples were successfully amplified with a single primer set. Successful PCR amplification was confirmed by gel electrophoresis and visualization using an Axygen gel documentation system. PCR products were cleaned using ExoSAP-IT (Thermo Fisher Scientific, Waltham, Massachusetts) and sequenced in both directions using BigDye chemistry at Eurofins MWG Operon (Louisville, Kentucky) using PCR primers.
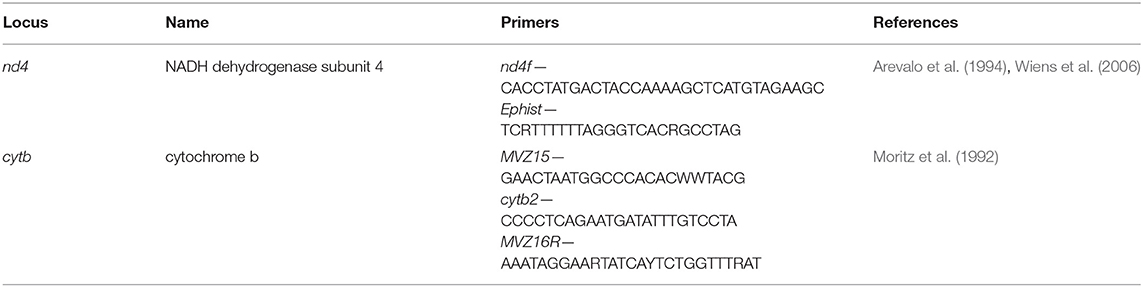
Table 2. Mitochondrial loci and associated PCR primers to infer phylogenetic relationships of Aneides aeneus in the current study.
Phylogenetic Inference
Resulting sequences were edited in Chromas v2.6.6 (Technelysium, South Brisbane, Queensland, Australia). Low quality bases at the ends of each sequence were trimmed and ambiguous base calls verified manually by examining electropherograms. Forward and reverse sequences were assembled into contigs in GeneStudio v.2.2 (Genestudio, Inc., Suwanee, Georgia). All resulting contigs were aligned using MUSCLE (Edgar, 2004) in the program MEGA v.7 (Kumar et al., 2008). Resulting contig length after trimming were 679 bp for nd4 and 364 bp for cytb.
Outgroups included in the mtDNA phylogenetic analysis included the Climbing Salamander (Aneides lugubris), Clouded Salamander (A. ferreus), Wandering Salamander (A. vagrans), Black Salamander (A. flavipunctatus), and Sacramento Mountain Salamander (A. hardii). Sequences for these species as well as additional nd4 and cytb sequences of A. aeneus were obtained from GenBank (Supplemental Table S1). Optimal models of nucleotide substitution for each mitochondrial locus, including first, second, and third codon positions for nd4 and cytb, were determined in jModelTest2 (Darriba et al., 2012) using corrected Akaike's Information Criterion (AICc). Maximum likelihood (ML) analyses were conducted using RAxML-HPC v.8.2.10 (Stamatakis, 2014) under the GTR + Gamma model and rapid bootstrapping algorithm with 1,000 bootstraps. Partitions determined by jModelTest2 were included in the analyses. We acknowledge that the nd4 and cytb mitochondrial loci are linked but chose to analyze the separately as each dataset comprised sequences derived from different individuals and sites. Bayesian analyses were performed using MrBayes v.3.2.7 (Ronquist et al., 2012) using the optimal model of nucleotide substitution determined by jModelTest2. Posterior probabilities were estimated using two independent runs, six Markov chains, and temperature profiles at the default setting of 0.2 for 30 million generations, sampling every 1,000 generations. Random trees were employed at the beginning of each Markov chain, and a molecular clock was not enforced. Stationarity was determined by examining the average standard deviation of split frequencies, assuming stationarity was achieved if the average standard deviation was below 0.01 in Tracer v1.6 (Rambaut et al., 2017). The first 20% of generations of each run were discarded as burn-in, and the remaining trees from the stationary distribution were sampled to generate a 50% majority-rule consensus tree in TreeAnnotator v2.3. RAxML and MrBayes were run on the CIPRES Science Gateway (Miller et al., 2010). Trees were visualized in FigTree v1.4 (Rambaut, 2014).
Mitochondrial Sequence-Based Species Delimitation and Molecular Diversity
We employed two single-locus species delimitation approaches on the mitochondrial nd4 and cytb datasets to define molecular operational taxonomic units (MOTUs): Automatic Barcode Gap Discovery (ABGD; Puillandre et al., 2012) and Multi-rate Poisson Tree Processes (mPTP; Kapli et al., 2017). ABGD partitions sequences into candidate species based on a statistically inferred barcode gap defined as a significant disparity between pair-wise genetic distances, presumably between intraspecific and interspecific distances. This process is applied recursively to newly obtained groupings of sequences to assess the potential of internal division. This method was employed excluding outgroup taxa via the ABGD web server (https://bioinfo.mnhn.fr/abi/public/abgd/abgdweb.html) using the Kimura two-parameter (Kimura, 1980) model with a standard X (relative gap width) = 1.5. The initial development of the multispecies coalescent PTP model assumed one exponential distribution for speciation events and one for all coalescent events (Zhang et al., 2013). The mPTP approach fits speciation events for candidate species to a unique ex-ponential distribution (Kapli et al., 2017) rather than assuming one exponential distribution for speciation events and one for all coalescent events in PTP models (Zhang et al., 2013). The mPTP method was employed using rooted ML trees for each dataset for 10 million generations, with a burn-in discarding the first 20% in mptp (Kapli et al., 2017).
We calculated molecular diversity statistics for delimited lineages (northern and southern; see Results) and overall, including number of haplotypes, number of segregating sites, haplotype diversity, and nucleotide diversity, and tested for departures from neutrality or constant population size using Tajima's D (Tajima, 1989) and R2 (Ramos-Onsins and Rozas, 2002) with the nd4 and cytb datasets in DNaSP v6 (Rozas et al., 2017) in the package pegas v1.0.1 (Paradis, 2010) in R v4.1.0 (R Core Team, 2021). Significant negative values of Tajima's D and small positive values of R2 indicate population growth.
RADseq Analyses
3RAD Library Preparation and Sequencing
We employed the 3RAD library procedure following Patton et al. (2019). Individual extractions were normalized and prepared using a 3RAD library procedure (Adapterama III; Bayona-Vásquez et al., 2019). The three enzymes used during the digestion step were BamHI, MspI, and ClaI. Each sample was quadruple-indexed, limited-cycled in PCR, and cleaned using speed beads (Rohland and Reich, 2012) following the 3RAD procedure. Samples then were pooled together, size selected for 500 bp on a Pippin Prep (Sage Science) and sequenced on an Illumina HiSeq with a PE 150 kit (Illumina Inc.) generating ~5 million reads per sample.
3RAD Data Filtering, Assembly, and Phylogenetic Analysis
The 3RAD sequence data were demultiplexed, quality assessed, clustered, consensus called, and assembled de novo using ipyrad v0.7.28 (Eaton and Overcast, 2016), which generated candidate SNP loci for each sample. Internal indexes were removed, and reads were trimmed to 120 bases. We set the clustering threshold to 85%, minimum depth for statistical base calling to 6, minimum depth for majority-rule base calling to 3, and minimum number of individuals per locus to 10. We allowed up to two alleles per site in consensus sequences and 20 SNPs per read per locus. Parameters for the ipyrad analysis are found in Supplemental Data Sheet S1. The resulting SNP dataset was filtered using the following criteria: minimum and maximum number of alleles per site of 2, minimum mean depth of coverage of 5, minor allele frequency of 0.2 to remove singletons, present in at least 50% of samples. Indels, singletons and putatively linked SNPs were removed. To account for possible linkage, we filtered to one random SNP per locus in ipyrad. This has been implemented in many recent studies (Sherman et al., 2020; Sunde et al., 2020; Maier et al., 2022) and also recommended as a best practice in filtering with RADseq data (Cerca et al., 2021). Finally, individuals with no data (n = 3) or high levels of missing data (n = 3) were excluded from downstream analyses.
We inferred the unrooted, maximum-likelihood phylogeny for the unlinked SNP dataset using automatic model finding in ModelFinder with Ascertainment Bias Correction in IQ-TREE (Nguyen et al., 2015; Kalyaanamoorthy et al., 2017). We obtained branch supports with 1,000 ultrafast bootstrap replicates (Minh et al., 2013; Hoang et al., 2018) implemented in the IQ-TREE software. The best tree and bootstrap nodal support values were visualized in FigTree v1.4 (Rambaut, 2014).
3RAD Data-Based Species Delimitation
We assessed population structure using the k-means clustering algorithm in the program fastStructure (Raj et al., 2014). We executed the structuring algorithm on the full, unlinked dataset and with K (number of populations) set between 1 and 10 using the structure.py script. We used the default convergence criterion (10e-6), simple priors, 100 cross-validation test sets, and a random starting seed. We created a structure plot to visualize the data for the value of K with maximized marginal likelihood using the R package pophelper v. 2.3.1 (Francis, 2017). We estimated Fst among the identified populations in the R package hierfstat v. 0.5-7 (Goudet, 2005).
We also explored population structure using discriminant analysis of principal components (DAPC). DAPC is a multivariate approach that transforms individual genotypes using principal components analysis (PCA) prior to conducting a discriminant analysis that maximizes differentiation between groups while also minimizing variation within groups (Jombart et al., 2010). We used the dapc function in the adegenet v2.1 package in R (Jombart et al., 2018). For the DAPC analysis, we applied an additional filtering step, discarding loci containing more than 60% missing data using the missingno function in the poppr v2.9.3 package. DAPC requires group assignments a priori, we employed a K-means clustering algorithm using the find.clusters function in the adegenet package to identify the optimal number of clusters from K = 1 to K = 10 with 1,000 randomly starting centroids (n.start = 1,000) in each K-means iteration. The various clustering solutions were compared using Bayesian information criterion (BIC). To avoid over-fitting of discriminant functions, we used α-score optimization to evaluate the optimal number of principal components (PCs) to retain in the DAPC.
Results
Mitochondrial DNA Phylogenetic Analyses
We generated novel mtDNA sequence data for 106 individuals (nd4: GenBank accession nos. OM111022–OM111127; cytb: OM110924–OM111021). We also supplemented our novel mtDNA sequence library for both nd4 and cytb with datasets available on GenBank and supplemental data available from Johnson (2002) (AF489614–AF489629) and Patton et al. (2019) (OM678465–OM678536). The nd4 dataset included 42 haplotypes from 122 individuals among 39 sites in Alabama, North Carolina, Tennessee, and West Virginia. The best models of nucleotide substitution for first, second, and third codon positions were Hasegawa-Kishino-Yano + Γ (HKY + G), Hasegawa-Kishino-Yano + invariant sites (HKY + I), and Tamura-Nei + Γ (TrN + G), respectively. Both ML and Bayesian inference identified two major reciprocally monophyletic lineages in Tennessee and northern Alabama (Supplemental Figure S1): a southern lineage comprised of seven haplotypes from 60 individuals and 17 sites in northern Alabama and south-central Tennessee and a northern lineage comprised of 35 haplotypes from 61 individuals and 15 sites in Tennessee, as well as six sites in West Virginia (Johnson, 2002). The southern lineage includes populations from the southern Highland Rim and Cumberland Plateau of northeastern Alabama and south-central Tennessee (Figure 1). The northern lineage includes populations from the Appalachian Plateau of West Virginia and the northern Cumberland Plateau, Eastern Highland Rim, and Valley and Ridge of north-central Tennessee (Figure 1). A contact zone between the northern and southern lineages based on the nd4 dataset occurs along the Cumberland Plateau and Walden Ridge along a line running from south-central Warren and Van Buren counties eastward to central Bledsoe and Rhea counties.
The cytb dataset included 63 haplotypes from 170 individuals and 97 sites in Alabama, Georgia, Kentucky, Ohio, North Carolina, Pennsylvania, South Carolina, Tennessee, Virginia, and West Virginia. The best models of nucleotide substitution for first, second, and third codon positions were Jukes-Cantor + Γ (JC + G), Jukes-Cantor (JC), and Hasegawa-Kishino-Yano (HKY), respectively. Both ML and Bayesian inference again identified two major reciprocally monophyletic lineages in Tennessee and northern Alabama (Figure 2): a southern lineage comprised of 16 haplotypes from 80 individuals and 43 sites, and a northern lineage comprised of 16 haplotypes from 73 individuals and 45 sites. Topologies of the cytb ML and Bayesian genealogies were very similar to those presented in Patton et al. (2019) and the nd4 dataset. The southern lineage includes populations from the southern Highland Rim, Cumberland Plateau, and Valley and Ridge of northeastern Mississippi, northern Alabama, northwestern Georgia, and south-central Tennessee (Figure 1). The northern lineage includes populations from the Appalachian Plateau and Valley and Ridge of Kentucky, Ohio, Pennsylvania, Virginia, and West Virginia southward through the northern Cumberland Plateau, Eastern Highland Rim, and adjacent Valley and Ridge of north-central Tennessee (Figure 1). A contact zone between the northern and southern lineages based on the cytb dataset occurs on the Cumberland Plateau along a line from northern Van Buren and Bledsoe counties into central Rhea County.
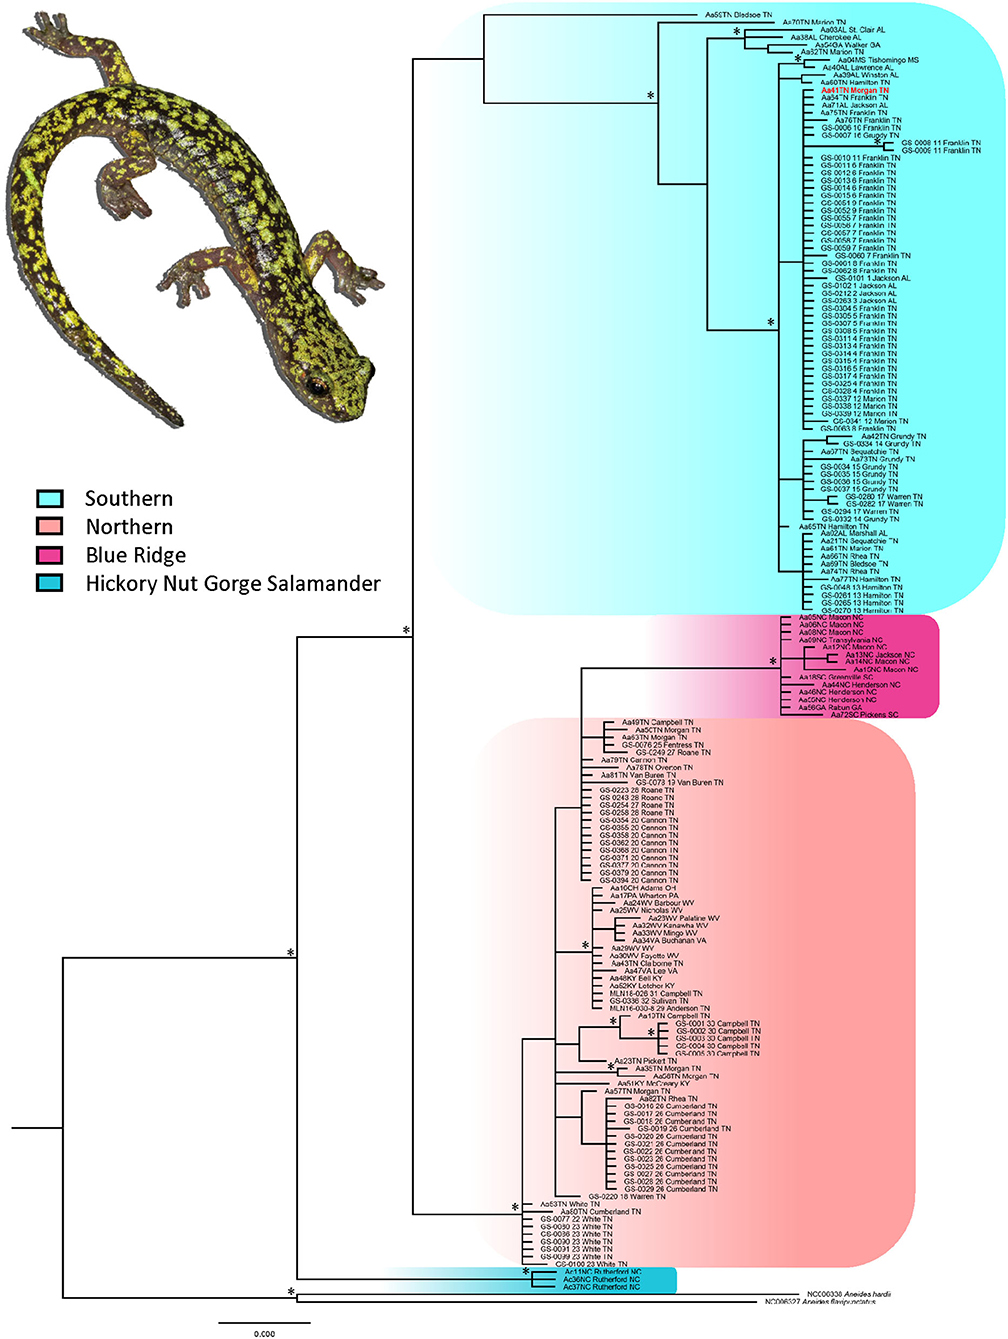
Figure 2. Bayesian phylogram for the mitochondrial cytb dataset including data from Patton et al. (2019). Major lineages are highlighted. Nodes with posterior probabilities >0.95 are indicated with an asterisk. Site labels and GenBank accession numbers correspond to those in Table 1; Supplementary Table S1.
Mitochondrial Sequence-Based Species Delimitation and Genetic Variation
For the nd4 dataset, the ABGD approach recovered three MOTUs with convergence of initial and recursive partitions occurring at prior intraspecific divergence (P) = 0.009 (Supplemental Figure S2). The three MOTUs corresponded to the major lineages in the nd4 phylogeny (Supplemental Figure S1): southern lineage, northern lineage, and Blue Ridge (the single sequence from Henderson Co., North Carolina included). Initial partitions stabilized at P = 0.002, and both initial and recursive partitions remained stable through P = 0.062. The mPTP approach identified four MOTUs: the same three identified by the ABGD approach as well as the population from No Business Branch in Campbell Co., Tennessee (site 30).
For the cytb dataset, the ABGD approach resulted in four MOTUs with convergence of initial and recursive partitions occurring at P = 0.007 (Supplemental Figure S2). The four MOTUs corresponded to the major lineages in the cytb phylogeny (Figure 2) with a few key differences. The southern lineage and A. caryaensis both were delimited as distinct MOTUs, which is consistent with the cytb phylogeny; however, the northern and Blue Ridge lineages were delimited as single MOTU and sample Aa70TN from Marion Co., Tennessee (site 85) was delimited as a distinct MOTU. Sample Aa59TN from Bledsoe Co., Tennessee (site 75) grouped in the northern + Blue Ridge lineage. Initial partitions stabilized at P = 0.003, and both initial and recursive partitions remained stable through P = 0.011. The mPTP approach delimited six MOTUs: the southern lineage and A. caryaensis were delimited as distinct MOTUs and the northern + Blue Ridge lineages were delimited as a single MOTU as in the ABGD analysis. Samples Aa70TN from Marion Co., Tennessee (site 85), Aa76TN from Franklin Co., Tennessee (site 89), and Aa59TN from Bledsoe Co., Tennessee (site 75) each were delimited as distinct MOTUs. The cytb sequence for sample Aa76TN includes a significant amount of missing data, likely influencing its delimitation as a distinct MOTU.
Nearly all measures of genetic diversity were higher for the northern lineage compared to the southern lineage for both mitochondrial loci (Table 3). Tests for population size changes based on summary statistics showed a trend toward population expansion in both the northern and southern lineages (Table 3). Mean pairwise distance (p-distance) between the southern and northern lineages is 8.7 ± 0.9% for nd4 and 8.5 ± 1.2% for cytb. Mean distances (±SE) within the southern lineage for nd4 and cytb were 0.3 ± 0.1% and 1.5 ± 0.3%, respectively, while mean distances (±SE) within the northern lineage for nd4 and cytb were 1.0 ± 0.2%, and 1.7 ± 0.3%, respectively.
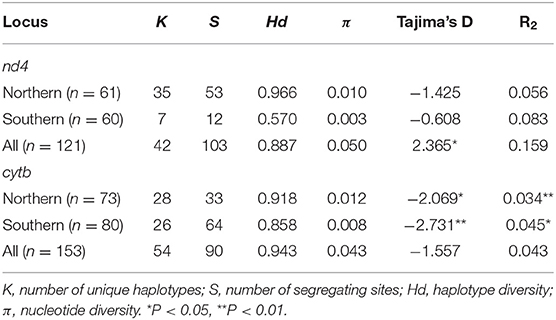
Table 3. Genetic diversity and test statistics for selective neutrality within major lineage of Aneides populations for the mitochondrial nd4 and cytb loci.
3RAD Phylogenetic Analyses and Genetic Variation
A total of 451,117 SNPs were obtained following SNP calling in ipyrad. After filtering, 33,423 unlinked SNPs were included in the final SNP dataset for 83 individuals. We estimated overall Fst at 0.56, indicative of strong population structuring for the entire dataset. This was supported by fastStructure results, which revealed the best fit of K = 2 clusters (Figure 3). Remarkably, there is complete isolation between the two clusters, with all individuals exhibiting probability of assignment nearly equal to 1. We also conducted independent fastStructure runs (K = 1–7) within each cluster. In both cases, the best fit was K = 1, indicating no additional substructure among populations within lineages and substantial gene flow within each of the two clusters, even among geographically distant sites.
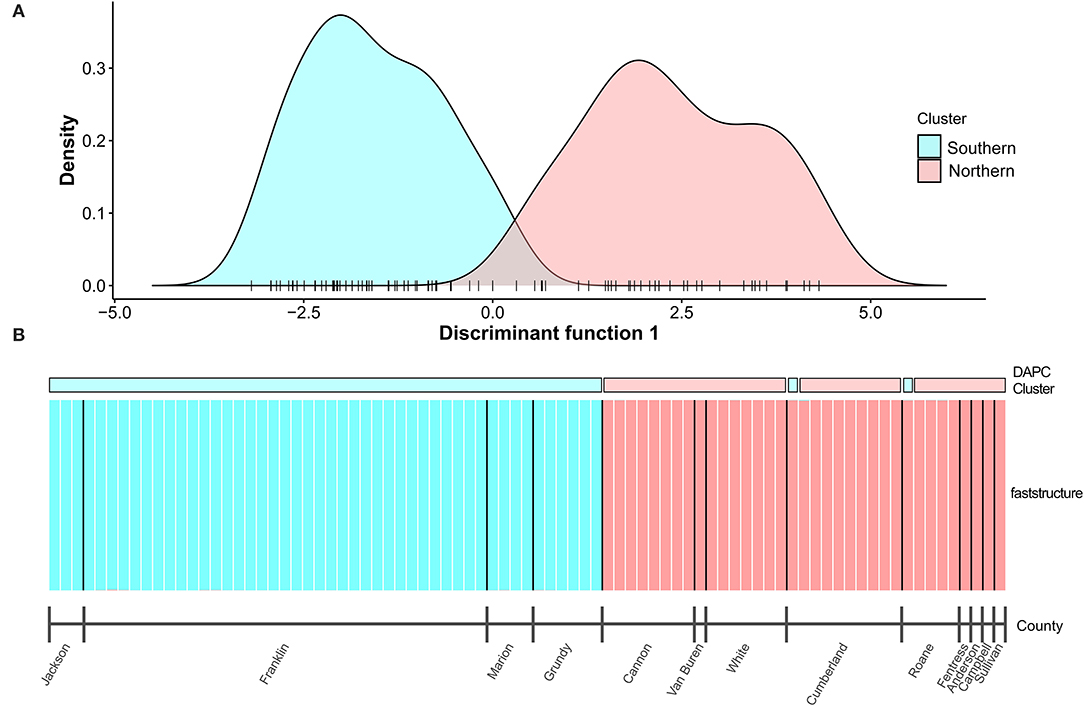
Figure 3. Population assignments of both DAPC (A) and fastStructure (B) analyses for the nuclear SNP dataset supported two distinct genetic clusters (K = 2) with little evidence of introgression. In (B), each bar represents a single individual. Population assignments of two individuals were discordant between DAPC and fastStructure (as well as IQ-TREE; see Figure 4). Major lineages are highlighted.
The DAPC had 113 unlinked SNPs and estimated two clusters (K = 2) based on BIC. The optimal number of PCs retained for the DAPC estimated by the α-score optimization was one. The clusters estimated by the DAPC were consistent with a southern and northern group. Cluster 1 included all samples from the southern sites (Jackson Co. in Alabama and Franklin, Marion, and Grundy counties in Tennessee; sites 1–10, 12, 14–16) except one sample from Ozone Falls SNA in Cumberland County, Tennessee (site 26) and one sample from Catoosa WMA in Roane County (site 28). Both individuals were included in the northern group in other analyses (fastStructure and IQ-TREE). Cluster 2 included the remaining samples from the northern sites in Cannon, Van Buren, White, Cumberland, Roane, Fentress, Anderson, Campbell, and Sullivan counties in Tennessee (sites 19–32; Figure 3).
Two well-supported, reciprocally monophyletic lineages were identified based on the maximum-likelihood IQ-TREE analysis (Figure 4): a southern clade including populations from Jackson County, Alabama as well as populations in Franklin, Marion, and Grundy counties in south-central Tennessee; and a northern clade including populations from the Valley and Ridge, northern Cumberland Plateau, and northern Eastern Highland Rim as far south as Cannon and Van Buren counties in Tennessee (Figure 1). The nuclear SNP phylogeny is similar to the mitochondrial nd4 phylogeny (Supplemental Figure S1), and there was no discordance in population assignment to major lineage (southern or northern) for populations included in both the mitochondrial nd4 and nuclear SNP phylogenetic analyses.
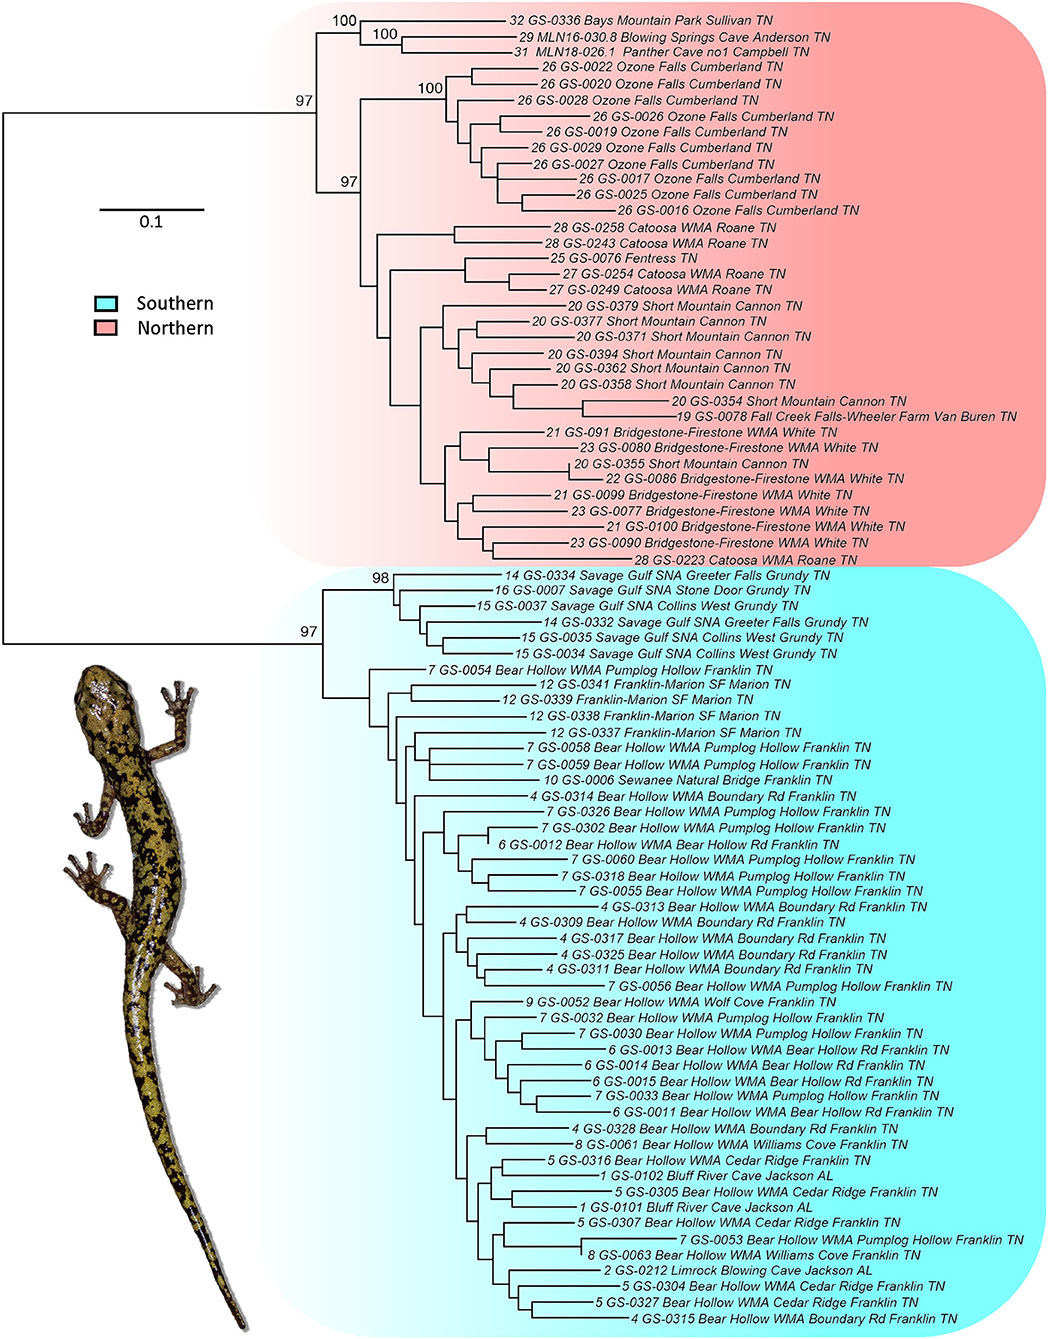
Figure 4. Maximum-likelihood phylogram for the nuclear SNP dataset generated in IQ-TREE. Nodes with >95% support are labeled. Site and sequence labels correspond to those in Table 1; Supplementary Table S1. Major lineages are highlighted.
Discussion
Cryptic Diversity in Castaneides
Previous studies of Aneides species in western North America have discovered considerable cryptic genetic structure and diversity (Reilly et al., 2013, 2015; Reilly and Wake, 2015). Likewise, studies have uncovered potential cryptic diversity within the Castaneides species complex. Sessions and Kezer (1987) examined karyotypic variation in plethodontid salamanders, including the genus Aneides. At least three karyotypes occur in the Castaneides species complex, with two karyotypes reported originally in sympatry at one site “near Chattanooga, Tennessee.” However, the report of sympatry was an error and explained in Patton et al. (2019). Three specimens were collected from Buck Creek Cove in Franklin Co., Tennessee; one of these specimens was examined by Sessions and the other two sent to and examined by Kezer. Kezer reported that the two specimens examined had predominately bi-armed chromosomes (aeneus II karyotype in Sessions and Kezer, 1987). When Sessions double-checked his lab notes, he found that the specimen he examined also had the aeneus II karyotype and was not aeneus I (Sessions, personal communication to David Wake in Patton et al., 2019). The aeneus II karyotype also was found in northern Alabama (Sessions and Kezer, 1987). The aeneus II karyotype may be diagnostic of the southern lineage but additional karyological is needed to confirm this hypothesis. The aeneus I karyotype was identified from specimens collected in southern Pennsylvania, West Virginia, southwestern Virginia, and southern Kentucky (Sessions and Kezer, 1987) and may be diagnostic for the northern lineage. However, this karyotype also was detected in southwestern North Carolina from Hickory Nut Gorge in what is now recognized as A. caryaensis (Patton et al., 2019), which is likely the sister group to the northern lineage. Morescalchi (1975) reported a potential third distinct karyotype (aeneus III in Sessions and Kezer, 1987) from Tennessee. Unfortunately, detailed locality information is lacking (reviewed in Patton et al., 2019) but is suspected to have been collected from “a probable site somewhere in Cumberland County, Tennessee” by an unknown supplier (Sessions and Kezer, 1987). Based on historical occurrences, if this collection indeed was from Cumberland County, it most likely was collected from Ozone Falls (site 26), which grouped within the northern lineage in our analyses.
More recently, Patton et al. (2019) integrated population genetic, genomic, and species delimitation approaches of mitochondrial, nuclear microsatellite, and nuclear SNP loci with morphological analyses and found strong support for recognition of four lineages. In addition to A. caryaensis, which was described concurrently in their study, the three delimited lineages include: (i) a southern lineage from the southern Cumberland Plateau of south-central Tennessee, northeastern Mississippi, northern Alabama, and northwestern Georgia, (ii) a northern lineage from the Cumberland Plateau, Cumberland Mountains, Appalachian Plateau, and Appalachian Valley and Ridge from north-central Tennessee northward into eastern Kentucky, southwestern Virginia, West Virginia, southern Ohio, and southwestern Pennsylvania; and (iii) a lineage from the Blue Ridge Escarpment of western North Carolina, western South Carolina, and northeastern Georgia (Figure 2A in Patton et al., 2019). These lineages are allopatrically distributed, except northern and southern lineages may overlap to some degree on the Cumberland Plateau of Tennessee based on mtDNA analyses. Geographic sampling across the potential distributions of northern and southern lineages was limited (n = 4 in Virginia and n = 2 in Alabama) for population genomic analyses, but results were consistent with mtDNA species delimitations (Patton et al., 2019). The authors refrained from describing these three lineages but recommended they be recognized as ESUs in light of these findings until additional morphological and population genomic studies were conducted.
Results of our phylogenetic, population genomic, and species delimitation approaches of mitochondrial and nuclear loci are consistent with the lineages delimited by Patton et al. (2019). Our mtDNA genetic and species delimitation analyses, which included the cytb dataset of Patton et al. (2019), identified the northern and southern lineages with strong support. These lineages were also strongly supported in our nuclear genomic analyses (i.e., fastStructure and IQ-TREE). The contact zone between the northern and southern lineages based on the nd4 dataset occurs along the Cumberland Plateau and Walden Ridge along a line running from south-central Warren and Van Buren counties eastward to central Bledsoe and Rhea counties in Tennessee. The putative contact zone derived from the cytb dataset, which included sequences from Patton et al. (2019), is similar to that of the nd4 dataset. However, a population from Morgan Co., Tennessee (site 68; Aa41TN in Patton et al., 2019) grouped with the southern lineage. Two additional sequences from Patton et al. (2019)—Aa79TN (site 92) and Aa77TN (site 90)—were discordant with lineage based on geographic proximity. Aa79TN from Cannon Co., Tennessee did not group with other samples we collected nearby at Short Mountain (site 20) within the northern lineage, while Aa77TN from Hamilton Co., Tennessee did not group with samples collected nearby (site 13) that grouped within the southern lineage. When the data from Patton et al. (2019) are excluded, we found no evidence of discordance between geography and lineage. Our nuclear genomic analyses also found little evidence of discordance between geography and lineage. Likewise, there was little discordance in population assignment to lineage for populations included in both the mitochondrial (excluding data from Patton et al., 2019) and nuclear SNP analyses. The exception was two individuals—one from Ozone Falls SNA in Cumberland County (site 26) and the other from Catoosa WMA in Roane County (site 28)—that based on geography, mtDNA, fastStructure, and IQ-TREE analyses grouped within the northern lineage but grouped within the southern lineage in the nuclear DAPC analysis. This discordance may be an artifact of missing data, which was 98% for the individual from Ozone Falls SNA and 62% for the individual from Catoosa WMA.
Phylogeography
Patton et al. (2019) hypothesized that climatic and ecological changes associated with the Appalachian Miocene uplift 20–10 mya (Gallen et al., 2013; Liu, 2014) may have led to the formation of at least two refugia after the Miocene optimum 15 mya: one in the Hickory Nut Gorge area and the other on the southern Cumberland Plateau that later gave rise to the northern, southern, and Blue Ridge lineages. Based on the divergence time analysis of Patton et al. (2019), the southern lineage split from the ancestor of the Blue Ridge and northern lineages ~9 mya, while the Blue Ridge and northern lineages diverged about 5 mya at the onset of the Pliocene. Climatic and ecological shifts during the Pliocene and Pleistocene likely resulted in concurrent range shifts in the northern and southern lineages whereby salamanders retreated to cooler, mesic forested coves along escarpments during warmer, drier periods and expanded during cooler, wetter periods. Demographic analyses support the existence of two refugia since the late Miocene and subsequent episodes of range expansion and contraction leading to the present-day distributions of the northern and southern in the Cumberland Plateau and Appalachian Valley and Ridge.
No obvious barriers to dispersal exist along the escarpments of the Cumberland Plateau and Walden Ridge in Tennessee between the northern and southern lineages. Interestingly, a contact zone in the southern Cumberland Plateau has been documented in some other taxa. In the Mountain Dusky Salamander (Desmognathus ochrophaeus) species complex, the Cumberland Dusky Salamander (D. abditus) occurs, albeit patchily distributed, throughout much of the southern Cumberland Plateau in Tennessee, contacting the Mountain Dusky Salamander (D. ochrophaeus) just south of the Cumberland Mountains section of the Cumberland Plateau in Morgan County (Anderson and Tilley, 2003; Drukker et al., 2018), which is ~50–60 km north of the contact zone between the northern and southern lineages in Aneides. Previous studies have noted the similarities in distribution and habitat between Aneides salamanders and the lampshade spiders of the genus Hypochilus (Catley, 1994; Hedin, 2001; Patton et al., 2019). Hypochilus thorelli ranges along the escarpments of the Cumberland Plateau from northeastern Alabama and northwestern Georgia northward through Tennessee into southeastern Kentucky and southwestern Virginia (Hedin and Wood, 2002; Keith and Hedin, 2012) where it can be found alongside A. aeneus on exposed sandstone and carbonate outcrops in mesic forests (Beatty pers. comm. in Fergusson, 1972). Hedin and Wood (2002) conducted a population genetic study of H. thorelli based on the mitochondrial cytochrome oxidase subunit I (COI) locus across 19 sites finding substantial genetic structure and evidence for very limited female-based dispersal, even among some sites within 5 km. Although spiders were morphologically similar across sites, three mitochondrial clades were identified: (i) a northern clade in the Cumberland Mountains of Lee Co., Virginia and Campbell and Morgan cos., Tennessee; (ii) a central + Kentucky clade from the central Cumberland Plateau in Tennessee from southern Cumberland, Bledsoe, and Van Buren counties but also two sites in Pickett County, Tennessee and Whitley Co., Kentucky; and (iii) a southern clade from the Cumberland Plateau of northeastern Alabama, northwestern Georgia, and southern Tennessee, including Franklin, Grundy, Marion, Hamilton, and Rhea counties. However, divergence times among H. thorelli clades appear to be younger than those of the Castaneides species complex estimated by Patton et al. (2019), with splits occurring within the last two million years (Ciaccio, 2020). Interestingly, the contact zone between the southern and central H. thorelli clades (Hedin and Wood, 2002) is strikingly similar to the contact zone between the northern and southern lineages in Aneides, suggesting similar biogeographical factors, such as historical cycles of climate change during the Pleistocene, have shaped present-day genetic structure and distributions in these co-occurring species.
Conservation Implications
In addition to describing A. caryaensis, Patton et al. (2019) recommended the recognition of the Blue Ridge lineage as an ESU to facilitate its conservation. However, the authors noted that species delimitation methods grouped Blue Ridge populations with the northern lineage, which also was consistent with results of our mtDNA species delimitation. We did not sample Blue Ridge populations in our nuclear SNP dataset and recommend that such analyses be conducted before recognizing Blue Ridge populations as a distinct ESU from the northern lineage. Patton et al. (2019) also noted that mtDNA phylogenetic and species delimitation approaches supported the distinction of the southern lineage, but they refrained from recommending its designation as an ESU until additional investigations were conducted. Our mitochondrial and nuclear SNP analyses unequivocally support the recognition of the southern lineage as an ESU sensu Moritz (1994) genetically distinct from the northern lineage. We found no evidence of admixture between northern and southern lineages including for nuclear loci, which recovered reciprocal monophyly for the southern lineage. The recognition of the southern lineage as an ESU is consistent with several other proposed definitions and criteria including Avise (1994); Vogler and Desalle (1994); USFWS (U.S. Fish Wildlife Service) NMFS (National Marine Fisheries Service) (1996); Fraser and Bernatchez (2001), and Funk et al. (2012). Moreover, we fully expect that the southern lineage will meet other definitions of ESU (e.g., Dizon et al., 1992), likely constituting an undescribed species pending additional morphological study.
Both the southern and northern lineages in the Cumberland Plateau face a plethora of threats that are currently or may in the future impact populations (Niemiller et al., 2020), particularly habitat loss and fragmentation from logging, construction of open corridors (e.g., roads and power line rights-of-way), and past and current mining operations. Other significant threats include water impoundments, over-collection associated with the pet trade, emergent amphibian diseases, and climate change. Life history traits, such as slow maturity and reduced fecundity (Waldron and Pauley, 2007), increase intrinsic vulnerability to threats. Unfortunately, the ecology and life history of populations of both the southern and northern lineages on the Cumberland Plateau are poorly understood (Miller and Reynolds, 2011; Niemiller et al., in press). In particular, very limited historical data is available for most populations to infer population trends. We do not know whether populations on the southern Cumberland Plateau have experienced declines similar to those reported for A. caryaensis and the Blue Ridge Escarpment populations (Snyder, 1983, 1991; Corser, 2001; Patton et al., 2019). Encouragingly, recent surveys in Tennessee and northeastern Alabama confirmed the presence of species at 16 historical sites and discovered 34 new sites (Niemiller et al., 2020, in press).
Conclusions
Genetic and genomic data have revealed additional cryptic diversity in the Green Salamander as currently recognized, suggesting that rather than a monotypic species, it is indeed a species complex. Given the paucity of ecological and life history data on this species complex in general, considerable work is required to understand the species themselves and to inform management interventions to extend their evolutionary trajectories into the future. Specifically, additional surveys and genetic work are needed to better delineate the contact zone between the northern and southern lineages on the Cumberland Plateau and determine whether the two lineages are syntopic at any sites. Most occurrences of both lineages, including sites sampled in this study, occur on public lands, yet ~92% of land in Tennessee, including the Cumberland Plateau and Cumberland Mountains regions, is privately-owned (Tennessee Wildlife Resources Tennessee Wildlife Resources Agency., 2005); thus, future surveys on private lands should be a priority.
Data Availability Statement
Novel mitochondrial DNA sequences generated in this study were accessioned into NCBI GenBank. Accession numbers for all sequences used in this study are included in Supplemental Table S1. Genomic data generated in this study were deposited into NCBI BioSample Database: BioProject ID PRJNA803825 with BioSample accessions SAMN25688800-SAMN25688882.
Ethics Statement
Collection of tissue samples and handling of salamanders was authorized under Tennessee Wildlife Resources Agency scientific collection permit (no. 1385) and Tennessee Department of Environment and Conservation scientific collection permit (no. 2013-026). Vertebrate animal research protocols were approved by the University of Alabama in Huntsville Institutional Animal Care and Use Committee (protocol no. 2018.R001).
Author Contributions
MN conceived the study. MN, KN, KD, DT, DI, and RH collected tissue samples from Tennessee and Alabama. MN and KD conducted DNA extractions and generated mtDNA sequences. MN, KD, and JB conducted mtDNA analyses. JA prepared 3RAD libraries. MN, MT, MD, JA, RC, and JB analyzed the 3RAD dataset. MN, MT, MD, and JA prepared the first draft of the manuscript. KN, DT, DI, and RH aided in interpreting the results and worked on the manuscript. All authors revised the manuscript and approved its final version.
Funding
This study was supported by the U.S. Fish & Wildlife Service (grant no. F17AC00939 to MN and MD).
Conflict of Interest
JA was employed by Tangled Bank Conservation, LLC.
The remaining authors declare that the research was conducted in the absence of any commercial or financial relationships that could be construed as a potential conflict of interest.
Publisher's Note
All claims expressed in this article are solely those of the authors and do not necessarily represent those of their affiliated organizations, or those of the publisher, the editors and the reviewers. Any product that may be evaluated in this article, or claim that may be made by its manufacturer, is not guaranteed or endorsed by the publisher.
Acknowledgments
We thank Chris Argo, Joshua Argo, Taelor Hill, Joe Lamb, Brian T. Miller, Chris Ogle, Bill Sutton, Emily Hall, Mitch LeSage, Gary LeCleir, Bailey Augustino, and Jennifer Nix for assistance with fieldwork. We thank L. Jashen Bailey and Abigail Guillemette for assistance in the laboratory. We thank Jeffrey Hass for providing access and assisting with software installation on the Abe server at the School of Integrative Biology at the University of Illinois Urbana-Champaign and Ken Paige and UIUC Department of Integrative Biology 290 students Ryan Hill, Gracie Jasper, Sydney Koelper, Karlena Livengood, and Bridget Smith for assistance with molecular data analyses.
Supplementary Material
The Supplementary Material for this article can be found online at: https://www.frontiersin.org/articles/10.3389/fcosc.2022.890859/full#supplementary-material
References
Adams, M., Raadik, T. A., Burridge, C. P., and Georges, A. (2014). Global biodiversity assessment and hyper-cryptic species complexes: more than one species of elephant in the room? Syst. Biol. 63, 518–533. doi: 10.1093/sysbio/syu017
Anderson, J. A., and Tilley, S. G. (2003). Systematics of the Desmognathus ochrophaeus complex in the Cumberland Plateau of Tennessee. Herpetol. Monogr. 17, 75–110. doi: 10.1655/0733-1347(2003)017(0075:SOTDOC)2.0.CO;2
Arevalo, E., Davis, S. K., and Sites, Jr., J. W. (1994). Mitochondrial DNA sequence divergence and phylogenetic relationshiops among eight chromosome races of the Sceloporus grammicus complex (Phrynosomatidae) in Central Mexico. Syst. Biol. 43, 387–418. doi: 10.1093/sysbio/43.3.387
Avise, J. C. (1994). Molecular Markers, Natural History, and Evolution. London: Chapman & Hall. doi: 10.1007/978-1-4615-2381-9
Bayona-Vásquez, N. J., Glenn, T. C., Kieran, T. J., Pierson, T. W., Hoffberg, S. L., Scott, P. A., et al. (2019). Adapterama III: quadruple-indexed, double/triple-enzyme RADseq libraries (2RAD/3RAD). PeerJ 7, e7724. doi: 10.7717/peerj.7724
Beheregaray, L. B., and Caccone, A. (2007). Cryptic biodiversity in a changing world. J. Biol. 6, 1–5. doi: 10.1186/jbiol60
Bickford, D., Lohman, D. J., Sodhi, N. S., Ng, P. K. L., Meier, R., Winker, K., et al. (2007). Cryptic species as a window on diversity and conservation. Trends Ecol. Evol. 22, 148–155. doi: 10.1016/j.tree.2006.11.004
Camp, C. D., Tilley, S. G., Austin, R. M. Jr., and Marshall, J. L. (2002). A new species of black-bellied salamander (genus Desmognathus) from the Appalachian mountains of northern Georgia. Herpetologica 58, 471–484. doi: 10.1655/0018-0831(2002)058(0471:ANSOBS)2.0.CO;2
Camp, C. D., and Wooten, J. A. (2016). Hidden in plain sight: cryptic diversity in the Plethodontidae. Copeia 104, 111–117. doi: 10.1643/OT-14-150
Catley, K. M. (1994). Descriptions of new Hypochilus species from New Mexico and California with a cladistic analysis of the Hypochilidae (Araneae). Am. Mus. Nov. 3088, 1–27.
Cerca, J., Maurstad, M. F., Rochette, N. C., Rivera-Colon, A. G., Rayamajhi, N., Catchen, J. M., et al. (2021). Removing the bad apples: a simple bioinformatic method to improve loci-recovery in de novo RADseq data for non-model organisms. Meth. Ecol. Evol. 12, 850–817. doi: 10.1111/2041-210X.13562
Ciaccio, E. (2020). The paleoendemic spider genus Hypochilus (Araneae, Hypochilidae) based on sequence capture of ultraconserved elements (Master's thesis). San Diego State University, San Diego, CA, United States.
Corser, J. D. (2001). Decline of a disjunct green salamander (Aneides aeneus) population in the southern Appalachians. Biol. Conserv. 97, 119–126. doi: 10.1016/S0006-3207(00)00106-3
Crespi, E. J., Browne, R. A., and Rissler, L. J. (2010). Taxonomic revision of Desmognathus wrighti (Caudata: Plethodontidae). Herpetologica 66, 283–295. doi: 10.1655/HERPETOLOGICA-D-09-00002.1
Cupp, P. V. (1991). Aspects of the life history and ecology of the green salamander, Aneides aeneus, in Kentucky. J. Tenn. Acad. Sci. 66, 171–174.
Darriba, D., Taboada, G. L., Doallo, R., and Posada, D. (2012). jModelTest 2: more models, new heuristics and parallel computing. Nat. Methods 9, 772. doi: 10.1038/nmeth.2109
Delić, T., Trontelj, P., Rendo,š, M., and Fiser, C. (2017). The importance of naming cryptic species and the conservation of endemic subterranean amphipods. Sci. Rep. 7, 3391. doi: 10.1038/s41598-017-02938-z
Dizon, A. E., Lockyer, C., Perrin, W. F., Demaster, D. P., and Sisson, J. (1992). Rethinking the stock concept – a phylogeographic approach. Conserv. Biol. 6, 24–36. doi: 10.1046/j.1523-1739.1992.610024.x
Drukker, S. S., Cecala, K. K., Gould, P. R., McKenzie, B. A., and Van de Ven, C. (2018). The ecology and natural history of the Cumberland Dusky Salamander (Desmognathus abditus): distribution and demographics. Herpetol. Conserv. Bio. 13, 33–46. Available online at: http://www.herpconbio.org/Volume_13/Issue_1/Drukker_etal_2018.pdf
Eaton, D. A. R., and Overcast, I. (2016). ipyrad: Interactive Assembly and Analysis of RADseq Data Sets. Available online at: https://ipyrad.readthedocs.io/ (accessed December 1, 2018).
Edgar, R. C. (2004). MUSCLE: multiple sequence alignment with high accuracy and high throughput. Nucleic Acids Res. 32, 1792–1797. doi: 10.1093/nar/gkh340
Espíndola, A., Ruffley, M., Smith, M. L., Carstens, B. C., Tank, D. C., and Sullivan, J. (2016). Identifying cryptic diversity with predictive phylogeography. Proc. Roy. Soc. B: Biol. Sci. 283, 20161529. doi: 10.1098/rspb.2016.1529
Fergusson, I. C. (1972). Natural history of the spider, Hypochilus thorelli Marx (Hypochilidae). Psyche 79, 179–199. doi: 10.1155/1972/39715
Fišer, C., Robinson, C. T., and Malard, F. (2018). Cryptic species as a window into the paradigm shift of the species concept. Mol. Ecol. 27, 613–635. doi: 10.1111/mec.14486
Francis, R. M. (2017). pophelper: an R package and web app to analyse and visualize population structure. Mol. Ecol. Res. 17, 27–32. doi: 10.1111/1755-0998.12509
Fraser, D. J., and Bernatchez, L. (2001). Adaptive evolutionary conservation: towards a unified concept for defining conservation units. Mol. Ecol. 10, 2741–2752. doi: 10.1046/j.1365-294X.2001.t01-1-01411.x
Funk, W. C., McKay, J. K., Hohenlohe, P. A., and Allendorf, F. W. (2012). Harnessing genomics for delineating conservation units. Trends Ecol. Evol. 27, 489–496. doi: 10.1016/j.tree.2012.05.012
Gallen, S. F., Wegmann, K. W., and Bohnenstiehl, D. R. (2013). Miocene rejuvenation of topographic relief in the southern Appalachians. GSA Today 23, 4–10. doi: 10.1130/GSATG163A.1
Gordon, R. E. (1952). A contribution to the life history and ecology of the plethodontid salamander Aneides aeneus (Cope and Packard). Amer. Midl. Nat. 47, 666–701. doi: 10.2307/2422035
Goudet, J. (2005). HIERFSTAT, a package for R to compute and test hierarchical F-statistics. Mol. Ecol. Notes 5, 184–186. doi: 10.1111/j.1471-8286.2004.00828.x
Hammerson, G. (2004). Aneides aeneus. IUCN Red List of Threatened Species. Available online at: www.iucnredlist.org
Hedin, M., and Wood, D. A. (2002). Genealogical exclusivity in geographically proximate populations of Hypochilus thorelli Marx (Araneae, Hypochilidae) on the Cumberland Plateau of North America. Mol. Ecol. 11, 1975–1988. doi: 10.1046/j.1365-294X.2002.01561.x
Hedin, M. C. (2001). Molecular insights into species phylogeny, biogeography, and morphological stasis in the ancient spider genus Hypochilus (Araneae: Hypochilidae). Mol. Phylogenet. Evol. 18, 238–251. doi: 10.1006/mpev.2000.0882
Highton, R. (1989). Biochemical evolution in the slimy salamanders of the Plethodon glutinosus complex in the eastern United States. Part I. Geographic protein variation. Illinois Biol. Monogr. 57, 1–78. doi: 10.5962/bhl.title.49905
Highton, R. (1995). Speciation in eastern North American salamanders of the genus Plethodon. Ann. Rev. Ecol. Syst. 26, 579–600. doi: 10.1146/annurev.es.26.110195.003051
Highton, R. (1997). Geographic protein variation and speciation in the Plethodon dorsalis complex. Herpetologica 53, 345–356.
Highton, R. (1999). Geographic protein variation and speciation in the salamanders of the Plethodon cinereus group with the description of two new species. Herpetologica 55, 43–90.
Highton, R., and Peabody, R. B. (2000). “Geographic protein variation and speciation in salamanders of the Plethodon jordani and Plethodon glutinosus complexes in the southern Appalachian Mountains with the description of four new species” in The Biology of Plethodontid Salamanders, eds R. C. Bruce, R. G. Jaeger, and L. D. Houck (Boston, MA: Springer), 31–93. doi: 10.1007/978-1-4615-4255-1_3
Hoang, D. T., Chernomor, O., von Haeseler, A., Minh, B. Q., and Vinh, L. S. (2018). UFboot2: improving the ultrafast bootstrap approximation. Mol. Biol. Evol. 35, 518–522. doi: 10.1093/molbev/msx281
Johnson, A. N. (2002). Determining the genetic distances between sub-populations of Aneides aeneus in the Westvaco Wildlife and Ecological Forest (Master's thesis). Marshall University, Huntington, West Virginia.
Jombart, T., Devillard, S., and Balloux, F. (2010). Discriminant analysis of principal components: a new method for the analysis of genetically structured populations. BMC Genetics 11, 94. doi: 10.1186/1471-2156-11-94
Jombart, T., Kamvar, Z. N., Collins, C., Lustrik, R., Beugin, M. P., et al (2018). Package ‘Adegenet’. Available online at: https://github.com/thibautjombart/adegenet (accessed July 16, 2021).
Jones, M. T., Voss, S. R., Ptacek, M. B., Weisrock, D. W., and Tonkyn, D. W. (2006). River drainages and phylogeography: an evolutionary significant lineage of shovel-nosed salamander (Desmognathus marmoratus) in the southern Appalachians. Mol. Phylogenet. Evol. 38, 280–287. doi: 10.1016/j.ympev.2005.05.007
Kalyaanamoorthy, S., Minh, B. Q., Wong, T. K. F., von Haeseler, A., and Jermiin, L. S. (2017). ModelFinder: fast model selection for accurate phylogenetic estimates. Nat. Methods 14, 587–591. doi: 10.1038/nmeth.4285
Kapli, P., Lutteropp, S., Zhang, J., Kobert, K., Pavlidis, P., Stamatakis, A., et al. (2017). Multi-rate Poisson tree processes for single-locus species delimitation under maximum likelihood and Markov chain Monte Carlo. Bioinformatics 33, 1630–1638. doi: 10.1093/bioinformatics/btx025
Keith, R., and Hedin, M. (2012). Extreme mitochondrial population subdivision in southern Appalachian paleoendemic spiders (Araneae: Hypochilidae: Hypochilus), with implications for species delimitation. J. Arachnol. 40, 167–181. doi: 10.1636/A11-49.1
Kimura, M. (1980). A simple method for estimating evolutionary rates of base substitutions through comparative studies of nucleotide sequences. J. Mol. Evol. 16, 111–120. doi: 10.1007/BF01731581
Kozak, K. H., Blaine, R. A., and Larson, A. (2006b). Gene lineages and eastern North American paleodrainage basins: phylogeography and speciation in salamanders of the Eurycea bislineata species complex. Mol. Ecol. 15, 191–207. doi: 10.1111/j.1365-294X.2005.02757.x
Kozak, K. H., Weisrock, D. W., and Larson, A. (2006a). Rapid lineage accumulation in a non-adaptive radiation: phylogenetic analysis of diversification rates in eastern North American woodland salamanders (Plethodontidae: Plethodon). Proc Roy. Soc. London B Biol. Sci. 273, 539–546. doi: 10.1098/rspb.2005.3326
Kozak, K. H., and Wiens, J. J. (2006). Does niche conservatism promote speciation? A case study in North American salamanders. Evolution 60, 2604–2621. doi: 10.1111/j.0014-3820.2006.tb01893.x
Kozak, K. H., and Wiens, J. J. (2010). Niche conservatism drives elevational diversity patterns in Appalachian salamanders. Amer. Nat. 176, 40–54. doi: 10.1086/653031
Kuchta, S. R., Brown, A. D., and Highton, R. (2018). Disintegrating over space and time: paraphyly and species delimitation in the Wehrle's Salamander complex. Zoologica Scripta 47, 285–299. doi: 10.1111/zsc.12281
Kumar, S., Nie, M., Dudley, J., and Tamura, K. (2008). MEGA: A biologist-centric software for evolutionary analysis of DNA and protein sequences. Brief. Bioinform. 9, 299–306. doi: 10.1093/bib/bbn017
Liu, L. (2014). Rejuvenation of Appalachian topography caused by subsidence-induced differential erosion. Nat. Geosci. 7, 518–523. doi: 10.1038/ngeo2187
Maier, P. A., Vandergast, A. G., Ostoja, S. M., Aguilar, A., and Bohonak, A. J. (2022). Gene pool boundaries for the Yosemite Toad (Anaxyrus canorus) reveal asymmetrical migration within meadow neighborhoods. Front. Conserv. Sci. 3, 851676. doi: 10.3389/fcosc.2022.851676
Marshall, J. L., and Camp, C. D. (2006). Environmental correlates of species and genetic richness in lungless salamanders (family Plethodontidae). Acta Oecologica 29, 33–44. doi: 10.1016/j.actao.2005.07.008
Milanovich, J. R., Peterman, W. E., Nibbelink, N. P., and Maerz, J. C. (2010). Projected loss of a salamander diversity hotspot as a consequence of projected global climate change. PLoS ONE 5, e12189. doi: 10.1371/journal.pone.0012189
Miller, B. T., and Reynolds, R. G. (2011). “Green salamander, Aneides aeneus” in The Amphibians of Tennessee, eds M. L. Niemiller and R. G. Reynolds (Knoxville, TN: University of Tennessee Press), 102–104.
Miller, M. A., Pfeiffer, W., and Schwartz, T. (2010). “Creating the CIPRES science gateway for inference of large phylogenetic trees” in Proceedings of the Gateway Computing Environments Workshop (GCE) (New Orleans), 1–8. doi: 10.1109/GCE.2010.5676129
Minh, B. Q., Nguyen, M. A. T., and von Haeseler, A. (2013). Ultrafast approximation for phylogenetic bootstrap. Mol. Biol. Evol. 30, 1188–1195. doi: 10.1093/molbev/mst024
Morescalchi, A. (1975). “Chromosome evolution in the caudate amphibia” in Evolutionary Biology, Vol. 8, eds. T. Dobzhansky, M. K. Hect, W. C. Steere (New York, NY: Plenum Press), 339–387.
Moritz, C. (1994). Defining ‘evolutionarily significant units’ for conservation. Trends Ecol. Evol. 9, 373–375. doi: 10.1016/0169-5347(94)90057-4
Moritz, C., Schneider, C. J., and Wake, D. B. (1992). Evolutionary relationships within the Ensatina eschscholtzii complex confirm the ring species interpretation. Syst. Biol. 41, 273–291. doi: 10.1093/sysbio/41.3.273
Myers, N., Mittermeir, R. A., Mittermeier, C. G., da Fonseca, G. A. B., and Kent, J. (2000). Biodiversity hotspots for conservation priorities. Nature 403, 853–858. doi: 10.1038/35002501
NatureServe (2021). NatureServe Explorer. Arlington, VA: NatureServe. Available online at: https://explorer.natureserve.org/ (accessed December 31, 2021).
Nguyen, L.-T., Schmidt, H. A., von Haeseler, A., and Minh, B. Q. (2015). IQ-TREE: a fast and effective stochastic algorithm for estimating maximum likelihood phylogenies. Syst. Biol. 67, 216–235. doi: 10.1093/molbev/msu300
Niemiller, M. L., Graening, G. O., Fenolio, D. B., Godwin, J. C., Cooley, J. R., Pearson, W. D., et al. (2013). Doomed before they are described? The need for conservation assessments of cryptic species complexes using an amblyopsid cavefish (Amblyopsidae: Typhlichthys) as a case study. Biodiv. Conserv. 22, 1799–1820. doi: 10.1007/s10531-013-0514-4
Niemiller, M. L., Hardman, R., Thames, D., Istvanko, D., Davis, M. A., and Ogle, C. (in Press). The distribution and conservation status of the green salamander (Aneides aeneus) in Tennessee, USA. Herpet. Conserv. Biol.
Niemiller, M. L., Hardman, R., Thames, D., Istvanko, D., Ogle, C., Davis, M. A., et al. (2020). Assessment of Geographic Range, Habitat, and Population Genetics of the Green Salamander (Aneides aeneus) in Tennessee. Final Report to Southeastern Association of Fish & Wildlife Agencies, South Carolina. Southeastern Association of Fish & Wildlife Resources, Flora, Mississippi 86.
Paradis, E. (2010). pegas: an R package for population genetics with an integrated–modular approach. Bioinformatics 26, 419–420. doi: 10.1093/bioinformatics/btp696
Patton, A., Apodaca, J. J., Corser, J. D., Wilson, C. R., Williams, L. A., Cameron, A. D., et al. (2019). A new green salamander in the Southern Appalachians: evolutionary history of Aneides aeneus and implications for management and conservation with description of a cryptic microendemic species. Copeia 107, 748–763. doi: 10.1643/CH-18-052
Pérez-Ponce de León, G., and Poulin, R. (2016). Taxonomic distribution of cryptic diversity among metazoans: not so homogeneous after all. Biol. Lett. 12, 20160371. doi: 10.1098/rsbl.2016.0371
Petranka, J. W. (1998). Salamanders of the United States and Canada. Washington, DC: Smithsonian Institution Press.
Pickering, J., Kays, R., Meier, A., and Andrew, S. (2003). “The Appalachians” in Wilderness—Earth's Last Wild Places, eds P. R. Gil, R. A. Mittermeier, C. G. Mittermeier, J. Pilgrim, G. Fonseca, W. R. Konstant, and T. Brooks (Washington, DC: Conservation International), 458–467.
Pierson, T. W., Deitloff, J., Sessions, S. K., Kozak, K. H., and Fitzpatrick, B. M. (2019). Morphological polymorphism associated with alternative reproductive tactics in a plethodontid salamander. Amer. Nat. 193, 608–618. doi: 10.1086/702251
Puillandre, N., Lambert, A., Brouillet, S., and Achaz, G. (2012). ABGD, Automatic Barcode Gap Discovery for primary species delimitation. Mol. Ecol. 21, 1864–1877. doi: 10.1111/j.1365-294X.2011.05239.x
R Core Team (2021). R: A Language and Environment for Statistical Computing. Vienna: R Foundation for Statistical Computing. Available online at: https://www.R-project.org/ (accessed July 16, 2021).
Raj, A., Stephens, M., and Pritchard, J. K. (2014). fastStructure: variational inference of population structure in large SNP data sets. Genetics 197, 573–598. doi: 10.1534/genetics.114.164350
Rambaut, A. M. (2014). FigTree v1.4. Available online at: http://tree.bio.ed.ac.uk/software/figtree/ (accessed February 10, 2019).
Rambaut, A., Suchard, M. A., and Drummond, A. (2017). Tracer v1.6. Available online at: http://beast.bio.ed.ac.uk/Tracer (accessed February 10, 2019).
Ramos-Onsins, S., and Rozas, J. (2002). Statistical properties of new neutrality tests against population growth. Mol. Biol. Evol. 19, 209–2100. doi: 10.1093/oxfordjournals.molbev.a004034
Reilly, S. B., Corl, A., and Wake, D. B. (2015). An integrative approach to phylogeography: investigating the effects of ancient seaways, climate, and historical geology on multi-locus phylogeographic boundaries of the Arboreal Salamander (Aneides lugubris). BMC Evol. Biol. 15, 241. doi: 10.1186/s12862-015-0524-9
Reilly, S. B., Mulks, M. F., Reilly, J. M., Jennings, W. B., and Wake, D. B. (2013). Genetic diversity of Black Salamanders (Aneides flavipunctatus) across watersheds in the Klamath Mountains. Diversity 5, 657–679. doi: 10.3390/d5030657
Reilly, S. B., and Wake, D. B. (2015). Cryptic diversity and biogeographical patterns within the Black Salamander (Aneides flavipunctatus) complex. J. Biogeogr. 42, 280–291. doi: 10.1111/jbi.12413
Rissler, L., and Smith, W. H. (2010). Mapping amphibian contact zones and phylogeographic break hotspots across the United States. Mol. Ecol. 19, 5404–5416. doi: 10.1111/j.1365-294X.2010.04879.x
Rohland, N., and Reich, D. (2012). Cost-effective, high-throughput DNA sequencing libraries for multiplexed target capture. Genome Res. 22, 939–946. doi: 10.1101/gr.128124.111
Ronquist, F., Teslenko, M., Van Der Mark, P., Ayres, D. L., Darling, A., Höhna, S., et al. (2012). MrBayes 3.2: efficient Bayesian phylogenetic infer-ence and model choice across a large model space. Syst. Biol. 61, 539–542. doi: 10.1093/sysbio/sys029
Rozas, J., Ferrer-Mata, A., Sánchez-DelBarrio, J. C., Guirao-Rico, S., Librado, P., Ramos-Onsins, S. E., et al. (2017). DnaSP 6: DNA sequence polymorphism analysis of large data sets. Mol. Biol. Evol. 34, 3299–3302. doi: 10.1093/molbev/msx248
Rundell, R. J., and Price, T. D. (2009). Adaptive radiation, nonadaptive radiation, ecological speciation and nonecological speciation. Trends Ecol. Evol. 24, 394–399. doi: 10.1016/j.tree.2009.02.007
Sessions, S. K., and Kezer, J. (1987). Cytogenetic evolution in the plethodontid salamander genus Aneides. Chromosoma 95, 17–30. doi: 10.1007/BF00293837
Sherman, K. D., Paris, J. R., King, R. A., Moore, K. A., Dahlgren, C. P., Knowles, L. C., et al. (2020). RAD-Seq analysis and in situ monitoring of Nassau grouper reveal fine-scale population structure and origins of aggregating fish. Front. Mar. Sci. 7, 157. doi: 10.3389/fmars.2020.00157
Snyder, D. H. (1983). The apparent crash and possible extinction of the green salamander, Aneides aeneus, in the Carolinas. Assoc. Southeastern Biol. Bul. 30, 82.
Snyder, D. H. (1991). The green salamander (Aneides aeneus) in Tennessee and Kentucky with comments on the Carolinas' Blue Ridge populations. J. Tenn. Acad. Sci. 66, 165–169.
Stamatakis, A. (2014). RAxML version 8: a tool for phylogenetic analysis and post-analysis of large phylogenies. Bioinformatics 30, 1312–1313. doi: 10.1093/bioinformatics/btu033
Struck, T. H., Feder, J. L., Bendiksby, M., Birkeland, S., Cerca, J., Gusarov, V. I., et al. (2018). Finding evolutionary processes hidden in cryptic species. Trends Ecol. Evol. 33, 153–163. doi: 10.1016/j.tree.2017.11.007
Sunde, J., Yildirim, Y., Tibblin, P., and Forsman, A. (2020). Comparing the performance of microsatellites and RADseq in population genetic studies: analysis of data for pike (Esox lucius) and a synthesis of previous studies. Front. Genet. 11, 218. doi: 10.3389/fgene.2020.00218
Tajima, F. (1989). Statistical method for testing the neutral mutation hypothesis by DNA polymorphism. Genetics 123, 585–595. doi: 10.1093/genetics/123.3.585
Tennessee Wildlife Resources Agency. (2005). Tennessee's Comprehensive Wildlife Conservation Strategy. Nashville, TN: Tennessee Wildlife Resources Agency.
Theodoridis, S., Nogues-Bravo, D., and Conti, E. (2019). The role of cryptic diversity and its environmental correlates in global conservation status assessments: insights from the threatened bird's-eye primrose (Primula farinose L.). Divers. Dist. 25, 1457–1471. doi: 10.1111/ddi.12953
Tilley, S. G., and Mahoney, M. J. (1996). Patterns of genetic differentiation in salamanders of the Desmognathus ochrophaeus complex (Amphibia: Plethodontidae). Herpetol. Monogr. 10, 1–42. doi: 10.2307/1466979
USFWS (U.S. Fish Wildlife Service) and NMFS (National Marine Fisheries Service). (1996). Policy regarding the recognition of distinct vertebrate population segments under the Endangered Species Act. Fed. Regist. 61, 4721–4725.
Vogler, A. P., and Desalle, R. (1994). Diagnosing units of conservation management. Conserv. Biol. 8, 354–363. doi: 10.1046/j.1523-1739.1994.08020354.x
Waldron, J. L., and Pauley, T. K. (2007). Green salamander (Aneides aeneus) growth and age at reproductive maturity. J. Herpetol. 41, 638–644. doi: 10.1670/06-216.1
Whittaker, R. J., Araújo, M. B., Jepson, P., Ladle, R. J., Watson, J. E., and Willis, K. J. (2005). Conservation biogeography: assessment and prospect. Divers. Dist., 11, 3–23. doi: 10.1111/j.1366-9516.2005.00143.x
Wiens, J. J., Engstrom, T. N., and Chippindale, P. T. (2006). Rapid diversification, incomplete speciation, and the “speciation clock” in North American salamander (genus Plethodon): testing the hybrid swarm hypothesis of rapid radiation. Evolution 60, 2583–2603. doi: 10.1111/j.0014-3820.2006.tb01892.x
Keywords: 3RAD, RADseq, Aneides aeneus, species delimitation, Tennessee, United States
Citation: Niemiller ML, Davis MA, Tan M, Apodaca JJ, Dooley KE, Cucalón RV, Benito JB, Niemiller KDK, Hardman RH, Istvanko D and Thames D (2022) Mitochondrial DNA and Population Genomics Reveal Additional Cryptic Diversity in the Green Salamander (Subgenus Castaneides) Species Complex. Front. Conserv. Sci. 3:890859. doi: 10.3389/fcosc.2022.890859
Received: 06 March 2022; Accepted: 11 April 2022;
Published: 25 May 2022.
Edited by:
Hua Wu, Central China Normal University, ChinaReviewed by:
Jinzhong Fu, University of Guelph, CanadaSean Reilly, University of California, Santa Cruz, United States
Copyright © 2022 Niemiller, Davis, Tan, Apodaca, Dooley, Cucalón, Benito, Niemiller, Hardman, Istvanko and Thames. This is an open-access article distributed under the terms of the Creative Commons Attribution License (CC BY). The use, distribution or reproduction in other forums is permitted, provided the original author(s) and the copyright owner(s) are credited and that the original publication in this journal is cited, in accordance with accepted academic practice. No use, distribution or reproduction is permitted which does not comply with these terms.
*Correspondence: Matthew L. Niemiller, matthew.niemiller@uah.edu