Models for linking hunter retention and recruitment to regulations and game populations
 C. P. McGowan
 J. L. Price Tack
 A. L. Silvano3
 - 1U.S. Geological Survey, Florida Cooperative Fish and Wildlife Research Unit, Department of Wildlife Ecology and Conservation, University of Florida, Gainesville, FL, United States
- 2Office of Applied Science, Wisconsin Department of Natural Resources, Rhinelander, WI, United States
- 3Division of Wildlife and Freshwater Fisheries, Alabama Department of Conservation and Natural Resources, Montgomery, AL, United States
- 4U.S. Geological Survey, Cooperative Research Units, Reston, VA, United States
Introduction: Declining hunter populations across North America present wildlife management agencies with the prospect of declining revenues for wildlife conservation and management and the need for new tools to evaluate management strategies and predict future status of game species and hunters.
Methods: Here we present a modeling framework and potential decision support tool for managers to link future hunter population dynamics to regulatory restrictiveness, prey abundance, and harvest success. Our hunter model is parameterized based on the authors’ judgment and can be used for demonstration purposes. We simulated three scenarios of restricted harvest, moderate harvest and liberal harvest.
Results: Our simulations show that even though liberal harvest predicts higher cumulative license sales revenue, it corresponds with a slight decline in buck abundance over 10 years. In contrast, highly restrictive harvest corresponds with deer population growth, but a near collapse of hunter populations. Our model demonstrates that managers might face tradeoffs between managing for deer population abundance and hunting revenue and clarifies how these factors might affect decision making.
Discussion: The utility of our tool would be dependent on accessing data on hunter retention and recruitment, however, the strength of our paper is in highlighting a new way of thinking about and potentially addressing these potential tradeoffs. Further, these simulations demonstrate that these tools could be used to evaluate management strategies but also highlight uncertainties, establish research priorities, and potentially design an adaptive management framework.
Introduction
Many state wildlife management agencies in the United States rely on hunter license sales and taxes levied under the Federal Aid in Wildlife Restoration Act of 1937 (16 U.S.C. 669-669i; 50 Stat. 917; commonly referred to as the Pittman-Robertson Act) to fund wildlife management and conservation activities under the North American Model of wildlife management (Heffelfinger et al., 2013). This creates a complex mix of competing objectives for state agencies that have to manage wildlife game species to benefit the health and sustainability of the game populations, meet hunter expectations and desires, while also meeting federal and international mandates for species and wildlife management (e.g., International Migratory Bird Treaty). Underlying these demands is the need to raise money for both short- and long-term agency planning and operations through maintaining or growing hunter license sales.
Widespread declines in hunter abundance are a source of growing concern among wildlife management agencies (USFWS, 2016). In part due to concerns about the future of hunting as a viable means to support state agency activities, government and non-governmental entities have developed programs to influence the recruitment, retention, and reactivation of hunters (USFWS, 2016). These programs, referred to as R3 programs, often provide educational materials and opportunities to engage targeted audiences in hunting experiences, e.g. youth hunts, mentorship programs, adult “learn to hunt” workshops (Responsive Management/National Shooting Sports Foundation, 2017; Stayton, 2017). However, the effectiveness of these programs at increasing the number of hunters is highly variable (Ryan and Shaw, 2011; Ringelman et al., 2020), and agencies need methods to evaluate options for influencing the future status of hunter populations (Price Tack et al., 2018). The retention of existing hunters, reactivation of lapsed hunters, and recruitment of new hunters is, at least partly, a function of the hunters’ satisfaction with the hunting experience (Schummer et al., 2020). Satisfaction is more than just hunting success (Winkler and Warnke, 2013; Larson et al., 2014; Schummer et al., 2020); for example, if game is sparse and hunting is difficult, regulations are too cumbersome, hunters experience interference from other hunters, or hunting locations are inaccessible, hunters may become dissatisfied with the experience and choose not to renew their license in the next year (Winkler and Warnke, 2013, Larson et al., 2014; Gruntorad et al., 2020). Thus, state agencies have some capacity to influence R3 rates via harvest regulations aimed at increasing opportunity and experience by opening new areas to hunting, increasing season lengths, and adjusting bag limits. Notably, increased bag limits may also reduce hunter experience if the bag limits highlight a potential tradeoff between increasing opportunity and experience. Since hunter license sales are a key source of revenue for many state wildlife management agencies in the United States, it may be prudent for managers to consider hunter population trajectories as an objective in their harvest decision-making processes (Price Tack et al., 2018).
One avenue to integrating R3 and game management would be building models to predict the effects of harvest actions on the future state of the game species population as well as the effects of management actions on hunters (Larson et al., 2014, Price Tack et al., 2018). These models could explicitly link hunter population dynamics to game species dynamics, to hunting success and regulatory burden, or to other factors that contribute to hunter recruitment, retention, and reactivation in that state (Winkler and Warnke, 2013, Larson et al., 2014). Price Tack et al. (2018) demonstrated that hunters could be modeled as a population, and management actions, such as outreach programs, could be incorporated into models to predict future trajectories and license sales. Combining approaches for modeling game and hunters into linked models provides opportunities for better understanding how actions affecting either population may indirectly affect the other, enabling agencies to better anticipate how game management will affect state license revenue. This framework has similarities to ecological predator-prey models, where the prey species abundance affects the predator and vice versa (e.g., Wangersky, 1978), except in this model “predator” (i.e., the hunters) population dynamics are affected by many additional factors, such as regulatory burden and hunting success. which have been shown or hypothesized to affect hunter retention and recruitment.
In this paper, we exemplify a modeling framework that may serve as a decision support tool for harvest managers and decision makers that links future hunter abundance (and, therefore, predicted license sales) to deer population abundance (especially older males), harvest success, and regulatory restrictiveness (Schorr et al., 2014; Black et al., 2018). While this model is built for deer, the concepts and framework are applicable to any harvested species with regulated take. Our purpose is to demonstrate the utility of decision support tools with population projection models and to show the value in considering game and hunters as linked populations in a multi-objective problem. With these types of decision support tools and models, managers can evaluate trades-offs between managing for deer population size or density targets, maximizing long-term harvest returns, and maintaining hunter populations and therefore hunting revenues. They could also help managers set population objectives for hunters and prey species and then evaluate management actions with respect to achieving those objectives. Further, we hope that this type of model can help managers anticipate and address some of the ongoing changes in hunter population dynamics and challenges faced by the North American model of wildlife management (Jacobson et al., 2010, Price Tack et al., 2018).
Methods
We applied our deer-hunter modeling approach to the harvest framework used in Alabama by the Alabama Department of Conservation and Natural Resources (ADCNR). As of the 2019 hunting season, Alabama allowed for one unantlered deer (any deer without one or more antlers visible above the natural hairline) to be taken per day in addition to one antlered deer per day, with a limit of 3 antlered deer per year. Season length, dates, and other harvest regulations vary by harvest zone and public versus private land, but archery season generally lasts from mid-October to mid-February and gun season totals several weeks between mid-November and February (https://www.outdooralabama.com/seasons-and-bag-limits/deer-season, accessed May 4, 2022). Season lengths, season timing, and bag limits can be adjusted by ADCNR to influence hunter take rates and deer populations, but these also affect hunter retention and recruitment, therefore our model development focused on incorporating these actions into the system dynamics model.
At the core of our decision-support tool was a two-sex stage structured population matrix model for white-tailed deer (Jensen, 2000; Gerber and White, 2014). Our model of white-tailed deer population dynamics was similar to previous modeling efforts (Xie et al., 1999; Jensen, 2000; Chitwood et al., 2015). In our model, males are separated into three age classes, young of the year, juveniles, and adults, and females are separated into two classes, young of the year and breeding adults (Jensen, 2000). Males had more life stages because they can be distinguished by antler size and harvest regulations can impose different harvest pressure on juvenile versus older males. For a post-breeding census model, when harvest actions are implemented, this results in a five by five matrix, as follows:
where S represents the annual survival rate for young of the year (Y), juveniles (J), or adults (A) males (m) and females (f), and F represents the annual productivity, offspring per breeding adult female and is multiplied by 0.5 to assign equal sex ratio at birth. In the matrix, the t subscript indicates a stochastic parameter that varies by year (Caswell, 2000). Survival rates were modeled as beta-distributed random variables and productivity rates were modeled as log-normally distributed random variables (Morris and Doak, 2002).
In the simulation model, we drew a single value for mean productivity each year and then attributed the offspring to male and female young of the year using a 50:50 sex ratio at birth. Productivity was limited using a fertility function that limited reproductive output to 0 when female to male sex ratio exceeded 10:1 (Caswell, 2000; Newbolt et al., 2017). Previous research on deer populations indicates that even under highly skewed sex ratios (>10:1 F:M) full fertility is possible (White et al., 2001; Newbolt et al., 2017). Modeling male contributions to productivity this way, enabled us to simplify the matrix and not include male fecundity terms in the model (Gerber and White, 2014). We acknowledge that a 10:1 female to male sex ratio may be low for limiting pregnancy rates in white-tailed deer in some geographies, but our simulations did not result in any sex ratios > 2:1 so this simple function was sufficient for our purposes.
For survival parameters, we incorporated the parametric uncertainty function as recommended by McGowan et al. (2011), whereby we drew values for each replicate and used those values as the mean from which to generate a beta distribution for annual variation in each replicate. That is, each replicate had a different distribution for drawing annual values of adult, juvenile and young of the year survival for males and females (McGowan et al., 2011). Each scenario (see below) was embedded within the “for loop” function in Program R with 1,000 replicates each, projected for 10 years into the future (R Core Team, 2020; Supplement 1). Mean survival and productivity parameters were set so that, in the absence of harvest and in a stable age distribution, the population growth rate was 1.0 using the “lambda” function in the “PopBio” package in R (Stubben and Milligan, 2007; R Core Team, 2020). Mean adult female survival was 0.85 (S.D. = 0.09), mean adult male survival was 0.80 (S.D. = 0.09), mean second year male survival was 0.75 (S.D. = 0.09), mean young of the year male and female survival was 0.30 (S.D. = 0.1), mean adult female fecundity was 1.2 offspring per female and sex ratio at birth was set to 0.5.
We constructed a population abundance vector, N, with each of the 5 age and sex classes and multiplied the Nt vector by the population demographic matrix to get the predicted abundance at t+1. Harvest was incorporated into the model as a harvest vector (H) that subtracted the animals harvested in each age class rather than as a harvest matrix that estimates harvest mortality or as adjustments to the survival rates in the population projection matrix (Caswell, 2000; Williams et al., 2002) as follows:
We used this approach because it simplified how the harvest management actions affected the population, and it allowed us to more transparently link harvest regulations, hunter abundance and hunter success to harvest rates and therefore deer populations.
Our model had four different actions that decision makers can adjust, mimicking the management options that Alabama Department of Conservation and Natural Resources could use: hunting season length (i.e., number of days hunting is permitted), daily bag limit for does, season bag limit for bucks, timing of the season with respect to rut, the period of peak male activity during the breeding season. The harvest amount in each age class was a function of the harvest regulations, number of hunters, hunter effort, and hunter success rate. We modeled number of hunters annually as a survival (retention) and recruitment growth model, where each year the survival and recruitment rates varied stochastically as a function of “hunter satisfaction” (see below). We first calculated the number of weekend days in the season because that is when the vast majority of hunters are active, and then multiplied the number of weekend days by the average proportion of weekend days that hunters would hunt to calculate the mean number of days that each hunter hunts. Here we input 0.20 (i.e., 20%) as the average proportion of weekend days that a hunter hunts, but this number could be directly estimated through hunter surveys. With the average number of days hunted, we used a Poisson random number generator to derive the number of days that each hunter hunted in the season and summed the number of hunter days for a season:
where N is the population size of hunters (H). In other words, we used a Poisson distribution to randomly generate the number of days each hunter hunted, with the number of weekend days times 0.2 as the mean and variance of the distribution. We then multiplied the number of hunt days by the daily probability of a hunter’s successful harvest of each age and sex class. We calculated daily harvest success rates by dividing the reported sex and age specific seasonal success rate by the number of days hunted. For example, 25% of hunters reported successfully harvesting a doe in a year, while 10% reported successfully harvesting an older buck (Responsive Management, 2021).
For the purposes of this model description paper, specific harvest rates were unimportant, but the method for linking the number of hunters to the deer population through hunting effort and success rate is vital. Harvest success rates in our simulations were derived from hunter survey data from the state of Alabama (Responsive Management, 2021), but these rates could be researched to be state or region specific. The total harvest of each age and sex class was daily success rate times the number of hunter days, which is different than most harvest models that typically partition the mortality in a year into harvest and non-harvest sources. Overall harvest success was also a function of whether the hunting season matched the rut or mismatched the rut, whereby each element in the harvest vector was multiplied by 1 if the season matched the rut and by 0.8 if the season did not match the rut to mimic the differences in hunting success related to the rut. Our model simulates hunter population dynamics and hunting success rates, then subtracts that successful hunting (i.e., harvest) from the deer population vector.
We modeled the hunter population to change annually using a retention-, and recruitment-based population model wherein both parameters increased as hunter satisfaction increased. Research suggests that hunter satisfaction is affected by a myriad of factors, including expectations, outcomes, and activity-specific experience (Hautaluoma and Brown, 1978; Heberlein and Kuentzel, 2002; Brunke and Hunt, 2008; Gruntorad et al., 2020), demonstrating that efforts to influence satisfaction are far more complicated than simply maximizing long-term harvest or deer abundance. In our model, hunter annual retention was akin to survival in a wildlife population model and recruitment was akin to productivity or recruitment in a wildlife model as follows:
where NH is the number of hunters in the population SH is the hunter survival (retention) rate and RH is the per-existing hunter recruitment rate, modeled similarly to Price Tack et al. (2018). In the model, RH and SH were curvilinear functions of deer population metrics, deer harvest metrics, and harvest regulations. Broadly, we expect that retention and recruitment will increase as deer populations increase, harvest amounts increase, and regulatory restrictiveness decreases. These patterns may not be universal across regions or harvested species, however data from Alabama indicate that as the ratio of deer harvested per hunter increases, deer hunter population growth rate increases and that deer hunters prefer fewer restrictions (Responsive Management, 2017; Responsive Management, 2021). We do not yet have sufficient data to empirically parameterize these relationships so here we used hypothesized yet uncertain values and statistical distributions. Specifically, RH was modeled as a function of older buck abundance (), older buck harvest total (), and the inverse of buck bag limits ():
where is the intercept term for the linear relationship and was modeled as a beta-distributed random variable with the median value equal to 0.17, b indicate a slope coefficient for buck abundance (bR,N,m), buck harvest (bR,H,m) and buck bag limits (bR,b,m). The slope coefficients in our simulations were deterministic (i.e. bN= 1.0 x 10⁻⁵, bH = 2.0 x 10⁻⁵, and bb = 1.0 x 10⁻⁶) and not allowed to vary across replicates or over time, but could be modeled as stochastic variables.
We modeled the retention parameter as a curvilinear function of buck harvest as follows:
where was the maximum value that S can be (i.e., 1.0), and are regression parameters that were themselves modeled as function of the deer population, harvest success, and harvest regulations. We made α a linear function of adult male abundance and female harvest total:
where was a stochastic variable drawn from a beta distribution variable with shape parameters set to 67 and 33, was deterministic and set to 0.001, and was deterministic and set to 0.002. The β parameter was modeled as a linear function of adult male bag limits, adult female bag limits and the season length (D) as follows:
where was a beta-distributed random variable with shape parameters set to 0.08 and 99.92, was deterministic and set 3.0 x 10⁻⁴, was deterministic and set 2.0 x 10⁻⁴, and was deterministic and set 2.0 x 10⁻⁵. The structure of these equations and the parameters therein were created for our simulations to represent our prior beliefs on the relative importance of each factor for hunter satisfaction and to create a model where hunter population response to management was reasonable. However, more direct empirical derivation on a state or regional basis is warranted for application of this model to management decision making by local, state or regional management authorities. Alternatively, an expected value of information analysis could be conducted to see how important further research would be to empirically estimate the relationship between hunter retention and recruitment and deer population, harvest success and regulatory restrictions.
We used the model to simulate a variety of alternate scenarios to demonstrate how changes in harvest regulations affect both the deer and hunter populations. In the model, harvest regulations were four different mechanisms: doe bag limits each day, buck (antlered) bag limit per season, season length (i.e., number of days), and timing of the season (e.g., timing of the season with respect to the rut). We implemented a moderate harvest regulations scenario (70-day season, matches the rut, 5 bucks per season, and 2 does per day) as a baseline scenario (Figure 1). This baseline scenario was similar to Alabama regulations at the time of model development, though Alabama regulations changed in recent years (Responsive Management, 2021). We also implemented a scenario of heavily restricted harvest (40-day season, mismatches the rut, 2 bucks per season, and 2 does per day; Figure 2) and a scenario of very liberal harvests (125-day season, matches the rut, 15 bucks per season, and 3 does per day; Figure 3). The only differences in the three scenarios were the management action inputs; the demographic parameters were modeled as described above. We added a function to calculate the total amount of license sales revenues if hunting licenses cost $10.00 per hunter per year each over the 10-year simulation. We set the initial population abundance arbitrarily, but set the age classes to be approximately in a stable age and sex distribution for deer and hunters. All simulation models were developed and run in Program R (Supplement 1; R core development Team, 2020) and we used a set seed of 42 (Adams, 1979) for randomization to ensure repeatability of results.
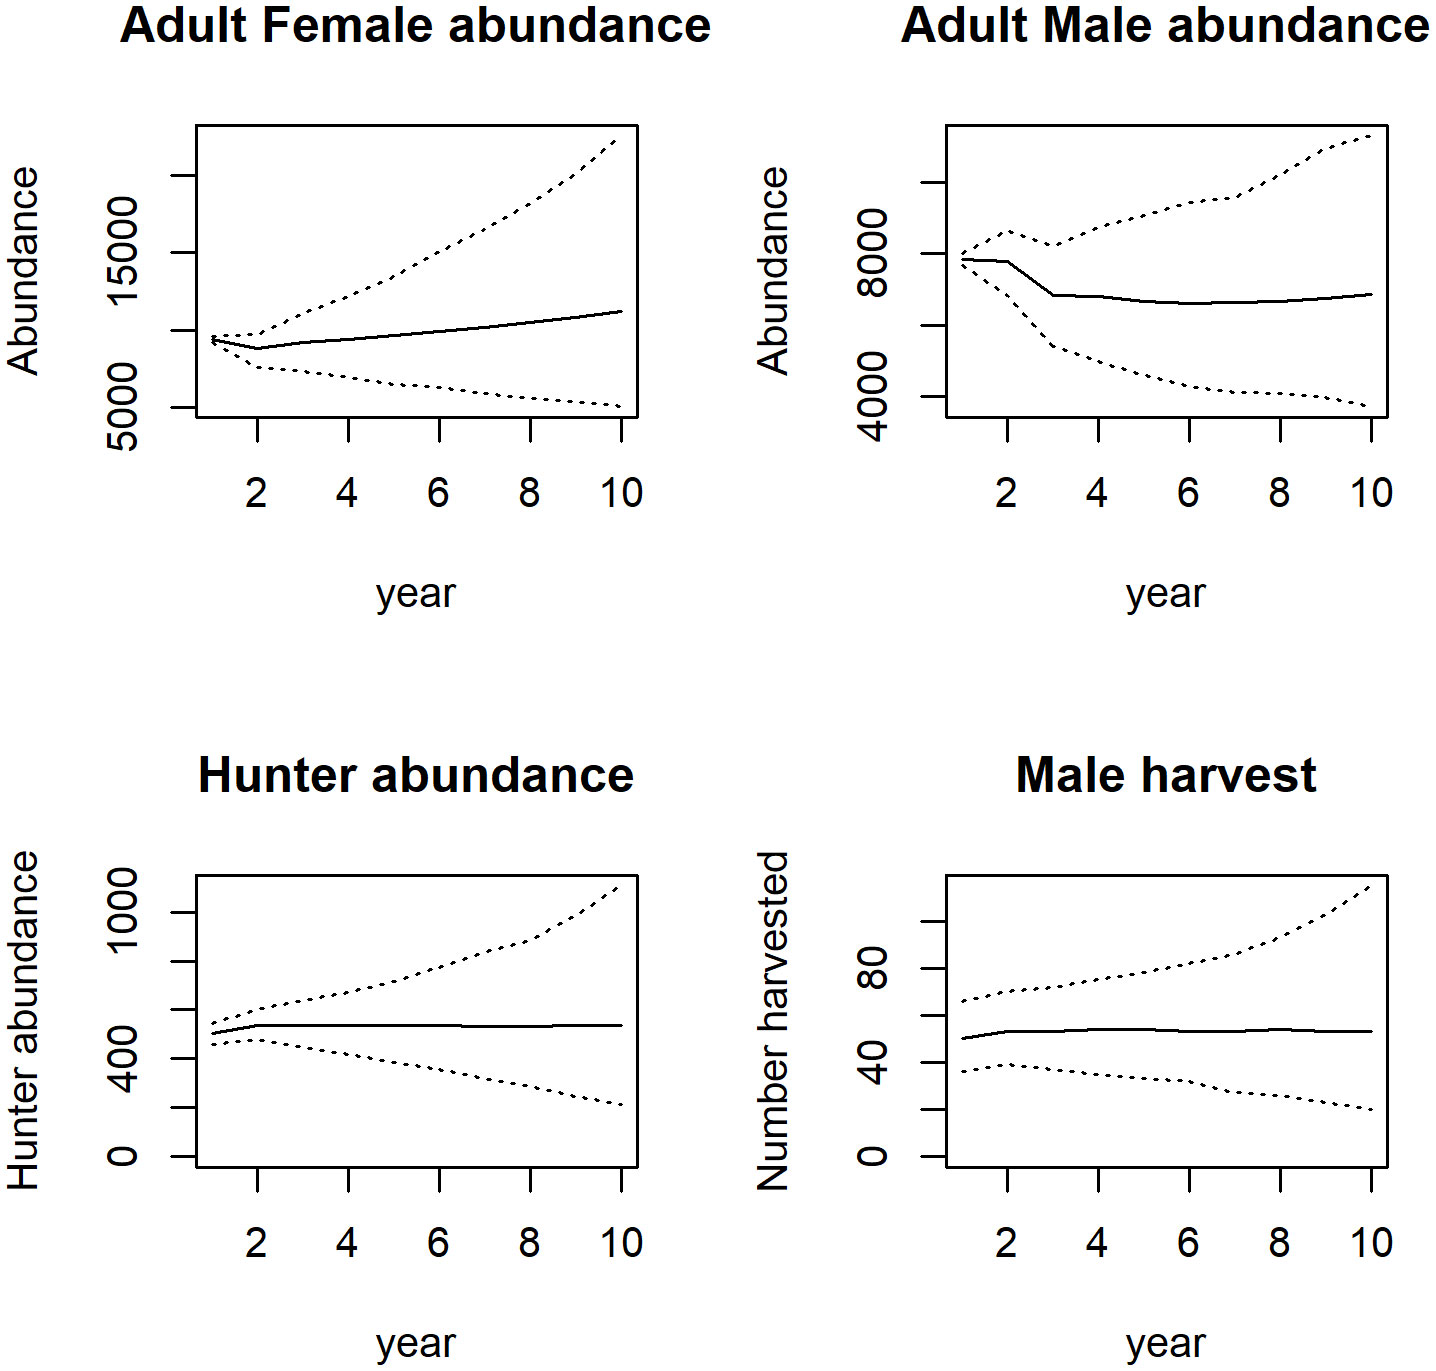
Figure 1 Outputs for a model linking hunter retention and recruitment to regulations and game populations. Model outputs (adult female deer, adult male deer, and hunter abundance and number of male deer harvested) simulated over a 10 year period for the approximate status quo (moderate) scenario. The dotted lines are the 2.5 and 97.5 percentiles.
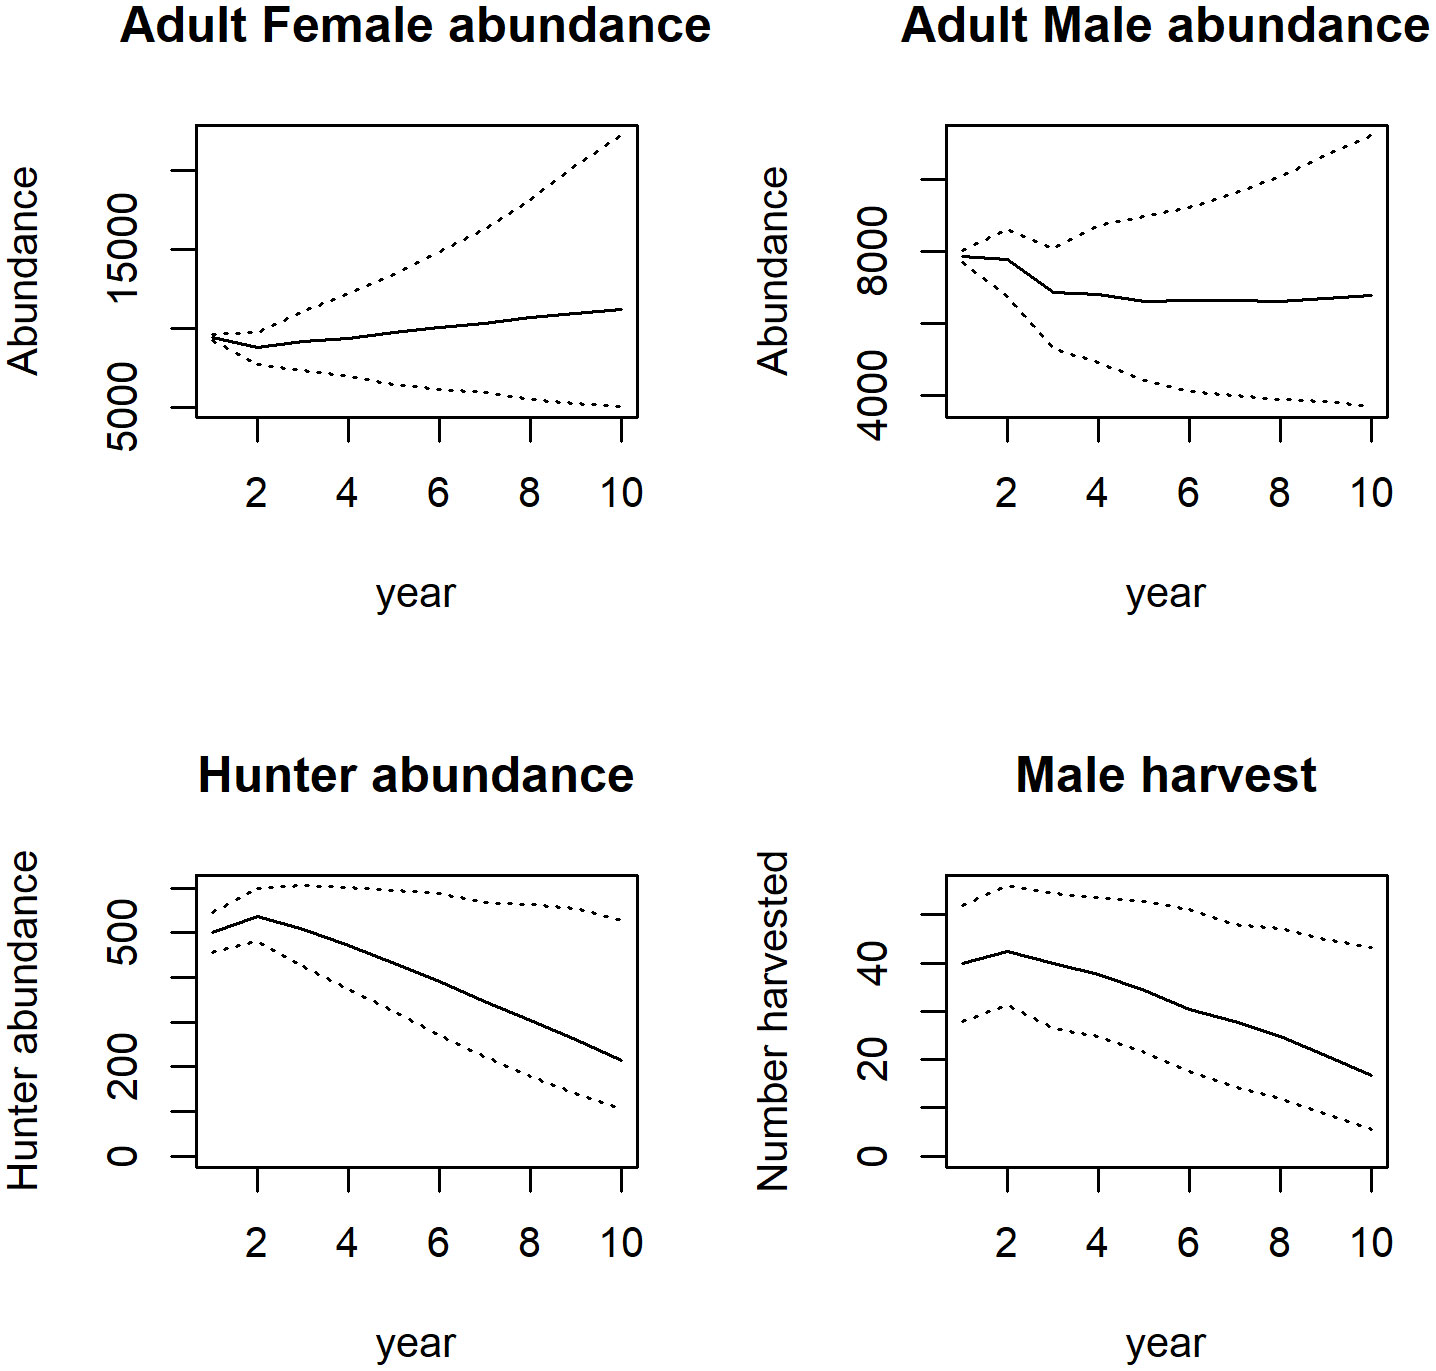
Figure 2 Outputs for a model linking hunter retention and recruitment to regulations and game populations. Model outputs (adult female deer, adult male deer, and hunter abundance and number of male deer harvested) simulated over a 10 year period for the restricted harvest scenario. The dotted lines are the 2.5 and 97.5 percentiles.
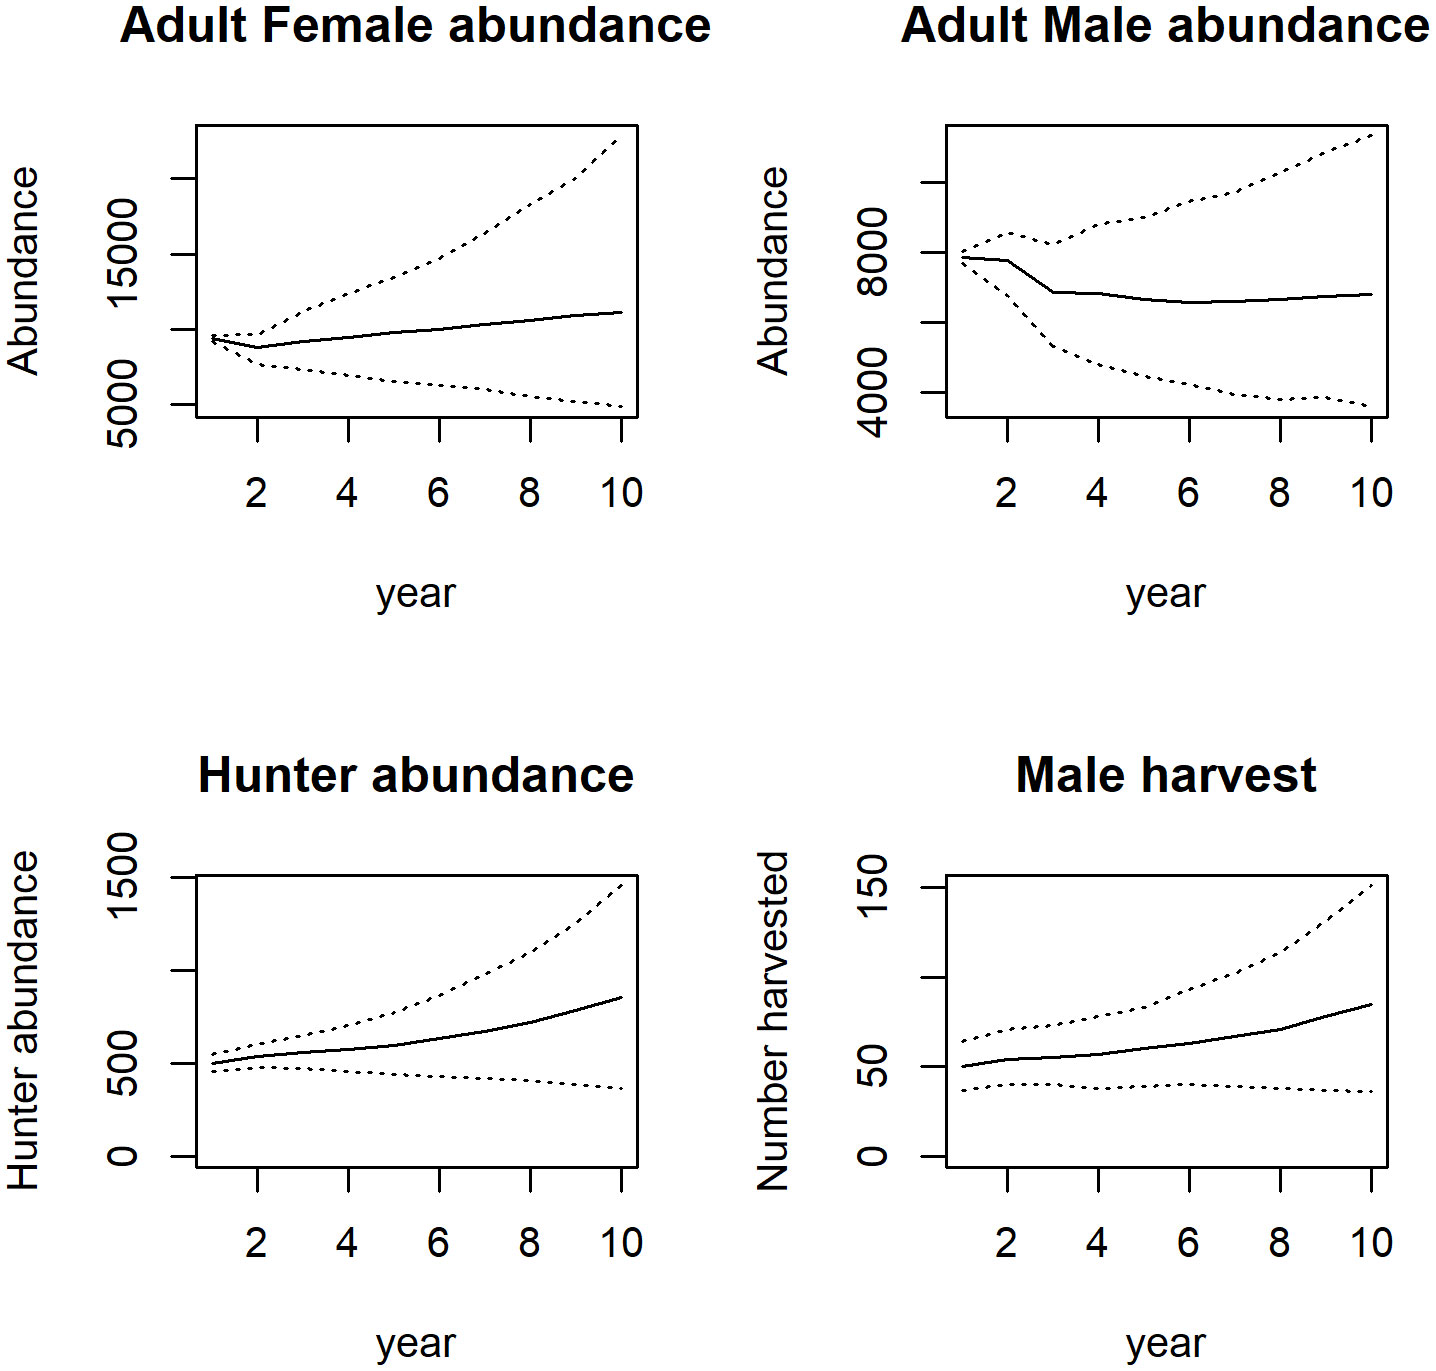
Figure 3 Outputs for a model linking hunter retention and recruitment to regulations and game populations. Model outputs (adult female deer, adult male deer, and hunter abundance and number of male deer harvested) simulated over a 10 year period for the liberal harvest scenario. The dotted lines are the 2.5 and 97.5 percentiles.
Results
Under scenario 1 (moderate harvest), cumulative license sales were ~$54,420 after 10 years (Table 1) along with a slight increase in hunter abundance, an increase in doe abundance, and a decrease in buck abundance (Table 1; Figure 1). The hunter population increased by 37 individuals. Under scenario 2 (restricted harvest), cumulative license sales revenue was ~$40,590 after 10 years, a >25% decline below the revenues for scenario 1. Further, doe and buck abundance predictions for scenario 2 were effectively the same as the scenario 1 predictions (Table 1; Figure 2). In this restrictive harvest scenario, hunter populations declined by approximately 60% from the starting abundance (Figure 2). Under scenario 3 (liberal harvest), hunter abundance increased substantially over time and compared to the other scenarios, and cumulative revenues from license sales were over $63,501, which is 16% greater than revenues in scenario 1 (Table 1). With the liberal bag limits, and long hunting season, doe abundance for scenario 3 was approximately the same as that for scenario 1, although buck abundance declined by ~120 individuals (Table 1; Figure 3).
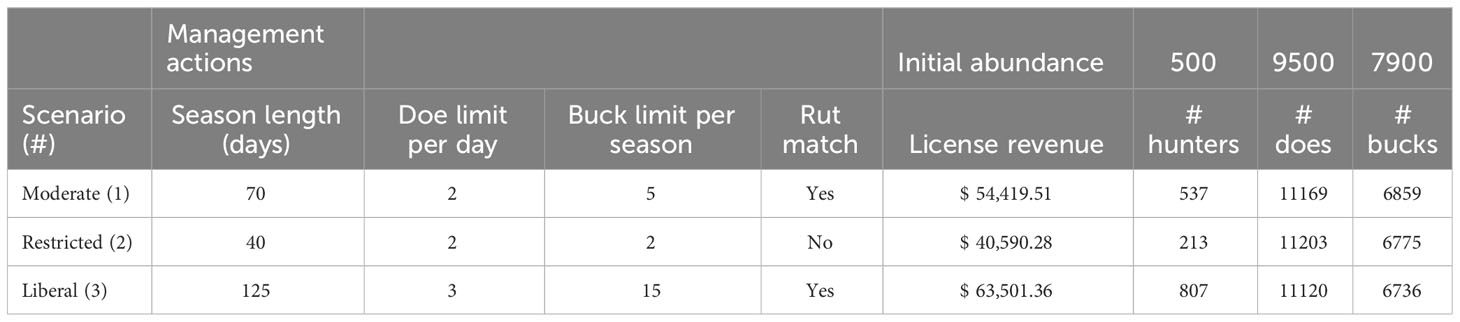
Table 1 Simulation scenarios run for a 10 year period to mimic moderate, restrictive, and liberal harvest of deer with corresponding predicted future abundance for hunters, does, and bucks and expected cumulative hunter license revenue.
Discussion
Our model demonstrates how co-modeling populations of game species and hunters might affect the decision processes for wildlife population managers. For example, the liberal harvest scenario led to a predicted increase in license sales and increased future hunter abundance compared to the moderate or restricted harvest scenarios, but also led to a slight decline in future buck abundance. Further, the increase in license sales in the liberal harvest scenario was cumulatively nearly $12,000 over 10 years compared to the moderate scenario. Managers may decide that the increased risk to deer populations and declines in abundance may not be worth $12,000 in license sales over 10 years, depending on the management objectives and the relative importance of the competing goals. The results of our simulations should not be taken as specific predictions of hunter or deer population trajectories in any specific geographies because the parameters are heuristic and not empirically estimated. The values we used in our simulation model reflect expert opinion and preliminary data in Alabama but were not based empirical estimates. They were chosen to demonstrate how the model functions and to demonstrate the potential value of this tool. Developing parameter estimates based on empirical data of hunter population or license sale changes over time would make the model useful and realistic for a specific state management agency. Our model, presented here, demonstrates the potential value of predictive modeling tools to decision makers in this system with complicated interactions and management responses. The output of our model, or a similar decision-support tool, could be used in a formal tradeoff analysis or as inputs into a multi-attribute value function (Keeney, 1996, McGowan et al., 2015). Each component of the output (license sales, deer abundance, etc.) could be weighted according to the relative importance of each factor and then combined to choose the management strategy that gives the most value after 10 years (Keeney, 1996; Runge et al., 2020).
The precision and accuracy of parameters in models are important for identifying the best management strategy. Management agencies may have data available to measure change in hunter retention and recruitment and estimate if and how those parameters covary with variables like deer population metrics, harvest restrictiveness, or hunter success rates. Agencies could also consider directly surveying hunters to estimate the relationships between retention and recruitment or population change more directly with deer populations or hunter satisfaction (Filion, 1981; Lukacs, 2007). Hunter satisfaction itself is a complex metric that may have multiple factors that vary geographically (Decker et al., 1980; Frey et al., 2003). Our modeling framework attempted to consider multiple factors that affect hunter satisfaction and therefore retention and recruitment, but we did not explicitly model the third “R,” reactivation. This parameter could be added by converting the hunter model to a three-stage model similar to Price Tack et al. (2018). Further, the model could be expanded to include management actions directly on hunter populations that affect retention, recruitment and reactivation, such as hunter education classes and youth engagement, that then have implications for deer populations (Price Tack et al., 2018).
Our deer-hunter model could provide further insights for state agencies using tools commonplace in decision science. Specifically, the use of expected value of information analyses (e.g., Moore and Runge, 2012; Canessa et al., 2015; Bolam et al., 2019) and model sensitivity analyses (e.g., McCarthy et al., 1995) to help managers set research priorities for effectively parameterizing the linked model to improve decision making in the future. For example, managers may find that key model output metrics are more sensitive to the parameters that govern hunter recruitment response to management and deer population status, than to parameters that govern deer population dynamics, thus suggesting human dimensions research is more valuable to decision makers than deer population dynamics. In our example parameterization, the timing of the harvest with respect to the rut had major effects on hunter abundance trajectories under the restricted harvest scenario, so a manager using our model might conclude that precise estimates of the timing of the annual cycle is imperative.
The effects of the prey species abundance and past harvest success on hunter population dynamics (retention and recruitment) are uncertain. While we found some supporting evidence that past harvest success correlates positively with future hunter abundance in Alabama, other research has found no relationship between deer or game abundance and hunter dynamics (e.g., Diefenbach et al., 2021). That relationship is a central factor in our modeling framework and would be a key uncertainty for management decision making. However, our modeling framework could also serve as a tool for researching these relationships by using a hindcasting Bayesian model weight updating analysis (e.g., Robinson et al., 2017). Simulated time series from alternative parameterizations of the relationships herein could be compared to license sales, harvest, and prey abundance data to identify which hypothetical relationship best represents the observed dynamics. Further, the modeling framework could be used in an adaptive management program to assist with management decision making even with persistent uncertainty (e.g., Nichols et al., 1995; Nichols et al., 2007; Johnson et al., 2015). Such a program would require articulating measurable objectives for deer and hunter populations, explicit articulation of alternative parameterizations of the system models, and monitoring programs to assess how the system responds to management and which version of the system model makes the best predictions (Williams et al., 2009).
Our paper is the first to present a framework for co-modeling game and hunter populations and the effects of management actions on both. With this type of tool managers can simultaneously predict the effects of harvest restrictions on the game species, hunter populations, and license revenue, allowing them to evaluate the tradeoffs among regulatory strategies. Our co-projection model is not restricted to deer applications but, if parameterized appropriately, would be equally informative for co-management of, among others, trappers-furbearers and anglers-fish species; both additional sources of state agency funding. Co-modeling of hunters and game species may be vitally important when novel disease dynamics are introduced to the system, such as chronic wasting disease or COVID-19, that have the potential to affect both game and hunter populations (Belsare et al., 2021; Chandler et al., 2021). We hope that our approach to modelling game and hunter populations together will help managers and state agencies adapt consumptive user management strategies to the fluctuating dynamics of hunter retention, reactivation, and recruitment under uncertainty.
Data availability statement
The original contributions presented in the study are included in the article/Supplementary Material. The simulation model code is accessible via: https://doi.org/10.5066/P9AN8YCK. Further inquiries can be directed to the corresponding author.
Author contributions
CM: Conceptualization, Formal Analysis, Investigation, Methodology, Software, Writing – original draft, Writing – review & editing. JP: Conceptualization, Methodology, Software, Writing – review & editing. AS: Conceptualization, Methodology, Writing – review & editing. JG: Conceptualization, Software, Writing – review & editing.
Funding
The authors declare that no financial support was received for the research, authorship, and/or publication of this article.
Acknowledgments
We thank C. Cook, B. Gray, K. Gauldin, and ADCNR Division of Wildlife and Freshwater Fisheries for their input and support of this research effort. This work was completed under cooperative agreements between the U.S. Geological Survey and Alabama DCNR and there was no specific funding or contract associated with this effort. We thank the journal editors, the reviewers, B. Folt, and A Carlson for their review of this manuscript. Any use of trade, firm, or product names is for descriptive purposes only and does not imply endorsement by the U.S. Government.
Conflict of interest
The authors declare that the research was conducted in the absence of any commercial or financial relationships that could be construed as a potential conflict of interest.
Publisher’s note
All claims expressed in this article are solely those of the authors and do not necessarily represent those of their affiliated organizations, or those of the publisher, the editors and the reviewers. Any product that may be evaluated in this article, or claim that may be made by its manufacturer, is not guaranteed or endorsed by the publisher.
Supplementary material
The Supplementary Material for this article can be found online at: https://www.frontiersin.org/articles/10.3389/fcosc.2023.1265806/full#supplementary-material
References
Belsare A. V., Millspaugh J. J., Mason J. R., Sumners J., Viljugrein H., Mysterud A. (2021). Getting in front of chronic wasting disease: model-informed proactive approach for managing an emerging wildlife disease. Front. Veterinary Sci. 7, 1154. doi: 10.3389/fvets.2020.608235
Black K. E., Jensen W. F., Newman R., Boulanger J. (2018). Motivations and satisfaction of North Dakota deer hunters during a temporal decline in deer populations. Human-Wildlife Interact. 12 (3), 427–443. doi: 10.26077/zb6s-4m87
Bolam F. C., Grainger M. J., Mengersen K. L., Stewart G. B., Sutherland W. J., Runge M. C., et al. (2019). Using the Value of Information to improve conservation decision making. Biol. Rev. 94 (2), 629–647. doi: 10.1111/brv.12471
Brunke K. D., Hunt K. M. (2008). Mississippi waterfowl hunter expectations, satisfaction, and intentions to hunt in the future. Hum. Dimens. Wild. 13 (5), 317–328. doi: 10.1080/10871200802227422
Canessa S., Guillera-Arroita G., Lahoz-Monfort J. J., Southwell D. M., Armstrong D. P., Chadès I., et al. (2015). When do we need more data? A primer on calculating the value of information for applied ecologists. Methods Ecol. Evol. 6 (10), 1219–1228. doi: 10.1111/2041-210X.12423
Chandler J. C., Bevins S. N., Ellis J. W., Linder T. J., Tell R. M., Jenkins-Moore M., et al. (2021). SARS-CoV-2 exposure in wild white-tailed deer (Odocoileus virginianus). Proc. Natl. Acad. Sci. 118 (47), e2114828118. doi: 10.1073/pnas.2114828118
Chitwood M. C., Lashley M. A., Kilgo J. C., Moorman C. E., Deperno C. S. (2015). White-tailed deer population dynamics and adult female survival in the presence of a novel predator. J. Wild. Manage. 79 (2), 211–219. doi: 10.1002/jwmg.835
Decker D. J., Brown T. L., Gutierrez R. J. (1980). Further insights into the multiple-satisfactions approach for hunter management. Wildlife Soc. Bulletin 1, 323–331.
Diefenbach D. R., Knox W. M., Rosenberry C. S. (2021). “The Future of Managing Ungulate Species: White-tailed Deer as a Case Study,” in Harvest of fish and wildlife: new paradigms for sustainable management. Eds. Pope K., Powell L. (Boca Raton, Florida, USA: CRC Press), 327–340. Available at: https://usgs-cru-individual-data.s3.amazonaws.com/drd11/intellcont/Diefenbach%20et%20al%20-The%20Future%20of%20Managing%20Ungulate%20Species-1.pdf.
Filion F. L. (1981). Importance of question wording and response burden in hunter surveys. J. Wild. Manage. 45 (4), 873–882. doi: 10.2307/3808096
Frey S., Conover M., Borgo J., Messmer T. (2003). Factors influencing pheasant hunter harvest and satisfaction. Hum. Dimens. Wild. 8 (4), 277–286. doi: 10.1080/716100422
Gerber L. R., White E. R. (2014). Two-sex matrix models in assessing population viability: when do male dynamics matter? J. Appl. Ecol. 51 (1), 270–278. doi: 10.1111/1365-2664.12177
Gruntorad M. P., Lusk J. J., Vrtiska M. P., Chizinski C. J. (2020). Identifying factors influencing hunter satisfaction across hunting activities in Nebraska. Hum. Dimens. Wild. 25 (3), 215–231. doi: 10.1080/10871209.2020.1722866
Hautaluoma J., Brown P. J. (1978). Attributes of the deer hunting experience: A cluster-analytic study. J. Leisure Res. 10 (4), 271–287. doi: 10.1080/00222216.1978.11969367
Heberlein T. A., Kuentzel W. F. (2002). Too many hunters or not enough deer? Human and biological determinants of hunter satisfaction and quality. Hum. Dimens. Wild. 7 (4), 229–250. doi: 10.1080/10871200214753
Heffelfinger J. R., Geist V., Wishart W. (2013). The role of hunting in North American wildlife conservation. Int. J. Environ. Stud. 70 (3), 399–413. doi: 10.1080/00207233.2013.800383
Jacobson C. A., Organ J. F., Decker D. J., Batcheller G. R., Carpenter L. (2010). A conservation institution for the 21st century: implications for state wildlife agencies. J. Wild. Manage. 74 (2), 203–209. doi: 10.2193/2008-485
Jensen A. L. (2000). Sex and age structured matrix model applied to harvesting a white tailed deer population. Ecol. Model. 128 (2-3), 245–249. doi: 10.1016/S0304-3800(00)00198-8
Johnson F. A., Boomer G. S., Williams B. K., Nichols J. D., Case D. J. (2015). Multilevel learning in the adaptive management of waterfowl harvests: 20 years and counting. Wild. Soc. Bulletin 39 (1), 9–19. doi: 10.1002/wsb.518
Keeney R. L. (1996). Value-focused thinking: A path to creative decision making (Cambridge, MA, United States: Harvard University Press).
Larson L. R., Stedman R. C., Decker D. J., Siemer W. F., Baumer M. S. (2014). Exploring the social habitat for hunting: Toward a comprehensive framework for understanding hunter recruitment and retention. Hum. Dimens. Wild. 19 (2), 105–122. doi: 10.1080/10871209.2014.850126
Lukacs P. M. (2007). Development and analysis of joint internet–telephone hunter surveys. Hum. Dimensions Wild. 12 (4), 263–273. doi: 10.1080/10871200701442858
McCarthy M. A., Burgman M. A., Ferson S. (1995). Sensitivity analysis for models of population viability. Biol. Conserv. 73 (2), 93–100. doi: 10.1016/0006-3207(95)90029-2
McGowan C. P., Lyons J. E., Smith D. R. (2015). Developing objectives with multiple stakeholders: adaptive management of horseshoe crabs and red knots in the Delaware Bay. Environ. Manage. 55 (4), 972–982. doi: 10.1007/s00267-014-0422-8
McGowan C. P., Runge M. C., Larson M. A. (2011). Incorporating parametric uncertainty into population viability analysis models. Biol. Conserv. 144 (5), 1400–1408. doi: 10.1016/j.biocon.2011.01.005
Moore J. L., Runge M. C. (2012). Combining structured decision making and value-of-information analyses to identify robust management strategies. Conserv. Biol. 26 (5), 810–820. doi: 10.1111/j.1523-1739.2012.01907.x
Morris W. F., Doak D. F. (2002). Quantitative conservation biology (Massachusetts, USA: Sinauer, Sunderland).
Newbolt C. H., Acker P. K., Neuman T. J., Hoffman S. I., Ditchkoff S. S., Steury T. D. (2017). Factors influencing reproductive success in male white-tailed deer. J. Wild. Manage. 81 (2), 206–217. doi: 10.1002/jwmg.21191
Nichols J. D., Johnson F. A., Williams B. K. (1995). Managing North American Water Fowl in the face of uncertainty. Annu. Rev. Ecol. Systematics 26, 177–199. doi: 10.1146/annurev.es.26.110195.001141
Nichols J. D., Runge M. C., Johnson F. A., Williams B. K. (2007). Adaptive harvest management of North American waterfowl populations: a brief history and future prospects. J. Ornithol. 148, 343–349. doi: 10.1007/s10336-007-0256-8
Price Tack J. L., McGowan C. P., Ditchkoff S. S., Morse W. C., Robinson O. J. (2018). Managing the vanishing North American hunter: a novel framework to address declines in hunters and hunter-generated conservation funds. Hum. Dimens. Wild. 23 (6), 515–532. doi: 10.1080/10871209.2018.1499155
R Core Team. (2020). R: A language and environment for statistical computing (Vienna, Austria: R Foundation for Statistical Computing). Available at: https://www.R-project.org/.
Responsive Management. (2021). Alabama hunter harvest annual report 2020-2021 (Harrisonburg, Virginia, USA: Responsive management). Available at: https://www.outdooralabama.com/sites/default/files/Hunting/Surveys-Reports/2020-2021%20Alabama%20Hunter%20Harvest%20Survey%20Report%20-%20Final.pdf (Accessed 12/12/2021).
Responsive Management/National Shooting Sports Foundation. (2017). Hunting, fishing, sport shooting, and archery Recruitment, Retention, and Reactivation: a practitioner's guide (Harrisonburg, Virginia, USA: Responsive Management/National Shooting Sports Foundation).
Ringelman K. M., Collier B. A., Laborde L. P. Jr., Rohwer F. C., Reynolds L. A., Messerli J., et al. (2020). Successes and challenges of university first hunt programs. J. Wild. Manage. 84 (6), 1032–1037. doi: 10.1002/jwmg.21878
Robinson O. J., McGowan C. P., Devers P. K. (2017). Disentangling density-dependent dynamics using full annual cycle models and Bayesian model weight updating. J. Appl. Ecol. 54 (2), 670–678. doi: 10.1111/1365-2664.12761
Runge M.C., Converse S.J., Lyons J.E., Smith D.R. (2020). Structured decision making: Case studies in natural resource management. (Johns Hopkins University Press).
Ryan E. L., Shaw B. (2011). Improving hunter recruitment and retention. Hum. Dimens. Wild. 16 (5), 311–317. doi: 10.1080/10871209.2011.559530
Schorr R. A., Lukacs P. M., Gude J. A. (2014). The Montana deer and elk hunting population: the importance of cohort group, license price, and population demographics on hunter retention, recruitment, and population change. J. Wildl. Manage. 78 (5), 944–952. doi: 10.1002/jwmg.732
Schummer M. L., Simpson J., Davis J. B., Shirkey B., Wallen K. E. (2020). Balancing waterfowl hunting opportunity and quality to recruit, retain, and reactivate. Wildlife Soc. Bulletin 44 (2), 391–395. doi: 10.1002/wsb.1084
Stayton B. (2017). Colleges and Universities: Prime Habitat for Hunter Recruitment and Retention (Clemson, SC, USA: Clemson University).
Stubben C., Milligan B. (2007). Estimating and analyzing demographic models using the popbio package in R. J. Stat. Software 22 (11), 1–23. doi: 10.18637/jss.v022.i11
United States Fish and Wildlife Service. (2016). Historical license data. Available at: https://wsfrprograms.fws.gov/subpages/licenseinfo/Hunting.htm.
Wangersky P. J. (1978). Lotka-Volterra population models. Annu. Rev. Ecol. Systematics 9 (1), 189–218. doi: 10.1146/annurev.es.09.110178.001201
White G. C., Freddy D. J., Gill R. B., Ellenberger J. H. (2001). Effect of adult sex ratio on mule deer and elk productivity in Colorado. J. Wild. Manage. 65 (3), 543–551. doi: 10.2307/3803107
Williams B. K., Nichols J. D., Conroy M. J. (2002). Analysis and management of animal populations (New York, NY, United States: Academic press).
Williams B. K., Szaro R. C., Shapiro C. D. (2009). Adaptive Management: The U.S. Department of the Interior Technical Guide (Washington, DC: Adaptive Management Working Group, U.S. Department of the Interior).
Winkler R., Warnke K. (2013). The future of hunting: an age-period-cohort analysis of deer hunter decline. Population Environ. 34 (4), 460–480. doi: 10.1007/s11111-012-0172-6
Keywords: decision support modeling, human dimensions of harvest management, hunter license revenue, North American model, hunter retention and recruitment
Citation: McGowan CP, Price Tack JL, Silvano AL and Grand JB (2023) Models for linking hunter retention and recruitment to regulations and game populations. Front. Conserv. Sci. 4:1265806. doi: 10.3389/fcosc.2023.1265806
Received: 23 July 2023; Accepted: 29 August 2023;
Published: 22 September 2023.
Edited by:
David R. Breininger, University of Central Florida, United StatesReviewed by:
Matthew Grainger, Norwegian Institute for Nature Research (NINA), NorwayDuane Diefenbach, Cooperative Fish and Wildlife Research Unit, United States
Copyright © 2023 McGowan, Price Tack, Silvano and Grand. This is an open-access article distributed under the terms of the Creative Commons Attribution License (CC BY). The use, distribution or reproduction in other forums is permitted, provided the original author(s) and the copyright owner(s) are credited and that the original publication in this journal is cited, in accordance with accepted academic practice. No use, distribution or reproduction is permitted which does not comply with these terms.
*Correspondence: C. P. McGowan, conor.mcgowan@ufl.edu