 J. K. Olson
 S. E. Larson
 F. C. Robertson4
 S. Berta
 J. Calambokidis
- 1Ocean Research College Academy, Everett Community College, Everett, WA, United States
- 2Research Department, The Whale Museum, Friday Harbor, WA, United States
- 3Conservation Programs and Partnerships, Seattle Aquarium, Seattle, WA, United States
- 4Department of Environmental Stewardship, San Juan County, Friday Harbor, WA, United States
- 5Protected Resources Division, West Coast Region, National Marine Fisheries Service, Seattle, WA, United States
- 6Whale Sighting Network, Orca Network, Freeland, WA, United States
- 7Cascadia Research Collective, Olympia, WA, United States
The Salish Sea supports several baleen whale species, including humpback (Megaptera novaeangliae), gray (Eschrichtius robustus) and minke whales (Balaenoptera acutorostrata). With the exception of minke whales, these species were decimated by commercial whaling in the 1900s. Because recovery of these populations is monitored on broad spatial scales determined by stocks or populations, their use of the Salish Sea ecosystem is not well documented or understood. We collated 17,436 opportunistic sighting reports to assess patterns in mysticete presence and distribution in the Salish Sea (1976–2019). We used the proportion of sightings for each species and spatial models targeting comparisons between species to limit the influence of spatio-temporal variation in reporting efforts. Humpback whale sightings have increased dramatically since the late 2000s, mirroring population-wide increases and suggesting a renewed use of historically important feeding areas. Gray whale sightings increased most notably at two distinct times (1989, 2017), both of which align with periods of high mortality experienced by the delisted Eastern North Pacific stock of gray whales and may reflect individuals straying from their migration routes. Sightings of minke whales remained relatively stable over this study period and were likely driven by a group of 30–40 individuals that forage off shallow banks and bathymetrically complex habitats around the San Juan Archipelago. Though it can be difficult to separate the bias that accompanies public sightings databases, citizen science efforts are invaluable for monitoring the recovery of rebounding populations and can illuminate longitudinal patterns that would otherwise go unnoticed.
1 Introduction
The Salish Sea, the inland fjord waters of Washington State USA and British Columbia (BC) Canada, includes the Strait of Juan de Fuca (SJF), Puget Sound and the Georgia Strait and is home to a variety of marine fish, invertebrates, marine mammals and seabirds (Brown and Gaydos, 2007). Marine mammals that are frequently encountered in the Salish Sea include two species of porpoise, two delphinid species, including killer whales (Orcinus orca), three baleen whale (mysticetes) species, and four pinniped species [seals (phocids) and sea lions (otariids)] (Gaydos and Pearson, 2011). The most well-known marine mammals of the Salish Sea are the resident killer whales or orcas (Orcinas orca). Scientists and the public alike track Southern Resident killer whale presence both spatially and temporally documenting their location, movements and population trends (Olson et al., 2018). These whales are arguably one of the most well studied marine mammals in the world (Krahn et al., 2004).
Studies on baleen whales in the region, on the other hand, are less ubiquitous. The baleen whale species known to occur in the Salish Sea include humpback (Megaptera novaeangliae), gray (Eschrichtius robustus) and minke whales (Balaenoptera acutorostrata). Indigenous communities along the outer coasts of Washington and British Columbia traditionally harvested baleen whales, particularly migrating gray whales and humpback whales, for subsistence and cultural practices. While this practice is not thought to have occurred in the inland waters of the Salish Sea (Losey and Yang, 2007; McMillan, 2015), the widespread international commercial whaling of the 19th and 20th centuries led to dramatic population reductions of primarily gray and humpback whales in the region. They were eventually afforded protection from harvest via international law (International whaling convention of 1946) and are also protected by several laws in the US and Canada passed in the 1970s.
Gray whales reach average lengths of about 12 m, weigh up to 40,000 kg and live to be between 40–80 years old (Ford, 2014). They are primarily bottom feeders that consume a wide range of benthic and epibenthic invertebrates (Pike, 1962). Eastern North Pacific gray whales primarily migrate between their breeding grounds in central Baja Mexico to feeding grounds along the nearshore waters from Oregon to Alaska (Pike, 1962). Populations in the eastern North Pacific were declared endangered under the Endangered Species Act (ESA) in 1973 when the act was established. They have since recovered and were delisted in 19941, though have experienced large fluctuations in population and mortality events along their entire range (59 FR 31094; Stewart et al., 2023a). Gray whales in the Salish Sea represent a small portion of this overall population that stops to feed during their northbound migration. In recent decades, a small group of gray whales termed “the Sounders” has been documented returning annually each spring to North Puget Sound waters to feed on ghost shrimp (Callianassa californiensis; Weitkamp et al., 1992; Calambokidis et al., 2015).
Humpback whales can reach lengths up to 17 m, weigh up to 40,000 kg and live up to 80–90 years (Ford, 2014). They are mid-water feeders that eat small crustaceans and forage fish using a variety of methods such as bubbles, sounds and barriers to herd large schools of their prey and enhance their feeding efficiency (Clapham, 2000). They were declared endangered worldwide by the ESA in 1973 (35 FR 18319). Based on genetics and movement data, the species was broken into 14 distinct population segments (DPSs), with only four currently listed under the ESA (Calambokidis et al., 2008; Baker et al., 2013; Bettridge et al., 2015). Humpback whales in the Salish Sea come from multiple winter breeding areas and represent the ESA threatened Mexico DPS, ESA endangered Central America DPS, and the non-ESA listed Hawaii DPS (Bettridge et al., 2015; Calambokidis et al., 2017; Wade, 2017; Carretta et al., 2023).
Minke whales are small whales, thought to grow to only around 8 m in the Northeast Pacific, and weigh up to 10,000 kg. Commercial whaling data suggests they have a life span of ~50 years (Ford, 2014). Unlike gray and humpback whales, minke whales have never been commercially harvested in the Northeast Pacific nor were they regularly targeted in historical subsistence hunts (Scammon, 1874; Scheffer and Slipp, 1948; Carretta et al., 2023). This is supported by their absence in middens (McMillan, 2015; Robertson and Trites, 2018) suggesting that minke whales may be naturally rare in the Northeast Pacific. As a result, they are not listed under the ESA. Minke whales are regularly encountered in the Salish Sea from early spring through fall, especially around the San Juan Islands and in the eastern SJF (Dorsey, 1983; Dorsey et al., 1990). Sightings from winter months are rare, raising questions about where minke whales over-winter and breed, though Scammon (1874) suggested that minke whales could be seen year-round in the SJF. Low sighting rates during winter months may be an artifact of sea conditions and low search effort (Dorsey et al., 1990). There are similar knowledge gaps surrounding the population composition of minke whales in the Salish Sea. In the North Atlantic, pronounced sexual segregation occurs on higher latitude feeding grounds with females occurring further north than males (Risch et al., 2019). While this has not been shown in the Salish Sea, the stranding record is almost entirely of female whales (Scheffer and Slipp, 1948; Nikolich and Towers, 2018).
One method that researchers have used to non-invasively document cetacean abundance and presence is through opportunistically collected sightings. These ‘presence-only’ data from wildlife sightings databases may be useful for monitoring species distribution, movement patterns and critical habitat or hot spots (Olson et al., 2018). For aquatic species like cetaceans that are challenging to monitor consistently, public sightings records significantly increase the scope and geographic range of data available. Databases populated by citizen science reporting are inherently biased by both number and location of observers as well as environmental conditions such as time of day and sea state. Nevertheless, many studies have shown spatial similarities between robust citizen science datasets and systematic surveys, and techniques for effort correction can greatly improve the reliability of the datasets (Hauser, 2006; Embling et al., 2015; Harvey et al., 2018; Olson et al., 2018; Ettinger et al., 2022). Longitudinal databases like the ones used in this study can identify reliable patterns if the potential for error and bias is taken into consideration, and they are invaluable tools for illuminating long-term spatio-temporal patterns (Harvey et al., 2018; Olson et al., 2018).
The recovery and status of baleen whale populations is monitored by the National Oceanic and Atmospheric Association (NOAA) at broad spatial scales determined by populations and stocks. However, the baleen whales’ habitat use in the Salish Sea ecosystem and their potential impact on local food webs is not well documented or understood. Here, we report opportunistic sightings records from multiple databases throughout the region to assess patterns in mysticete presence in the Salish Sea from 1976–2019. Our questions were twofold: 1) How have sighting rates of these three baleen whale species changed over time? And 2) How has the spatial distribution and use of the Salish Sea varied between these three species?
2 Methods
2.1 Data sources & characterization
Data were collated from two, long-term marine mammal sightings databases in the Salish Sea region curated by The Whale Museum (TWM) & Cascadia Research Collective (CRC) from 1976–2019. These databases include opportunistically reported sightings by a wide array of sources including non-profit sighting networks (e.g., Orca Network and The Whale Museum Reporting Hotline), research scientists, commercial whale watch operators, trained naturalists, and untrained public citizens. In order to fully leverage the available data, we used all sightings of minke, humpback, and gray whales, regardless of the qualification of the reporting party; however, we removed any sightings of unidentified or unconfirmed baleen whales. When possible, species identifications from non-experts were confirmed through photos, descriptions, other reports (e.g., captain logs, other scientists, etc.), and acoustic data; nevertheless, due to observation bias, weather conditions, and other limitations of opportunistic volunteer reporting there are likely a small portion of sightings that were misidentified (Olson et al., 2018).
We assigned all sightings reports to a 4.6 x 4.6 km quadrant within the study area, a system used by TWM since the onset of their database (Olson et al., 2018). We also assigned sightings to one of seven regions representing divisions by major bodies of water (Figure 1). We removed all sightings that lacked sufficient geospatial information required to assign a quadrant (i.e., either GPS coordinates or anecdotal descriptions) and any sightings that fell outside of the described study area. Only one sighting per day per quadrant was selected in order to reduce duplicate sightings. Furthermore, we assume that the biases in these data are roughly equivalent for all three species studied and aim to tease apart real spatio-temporal trends from reporting bias by using techniques that focus on the differences between species.
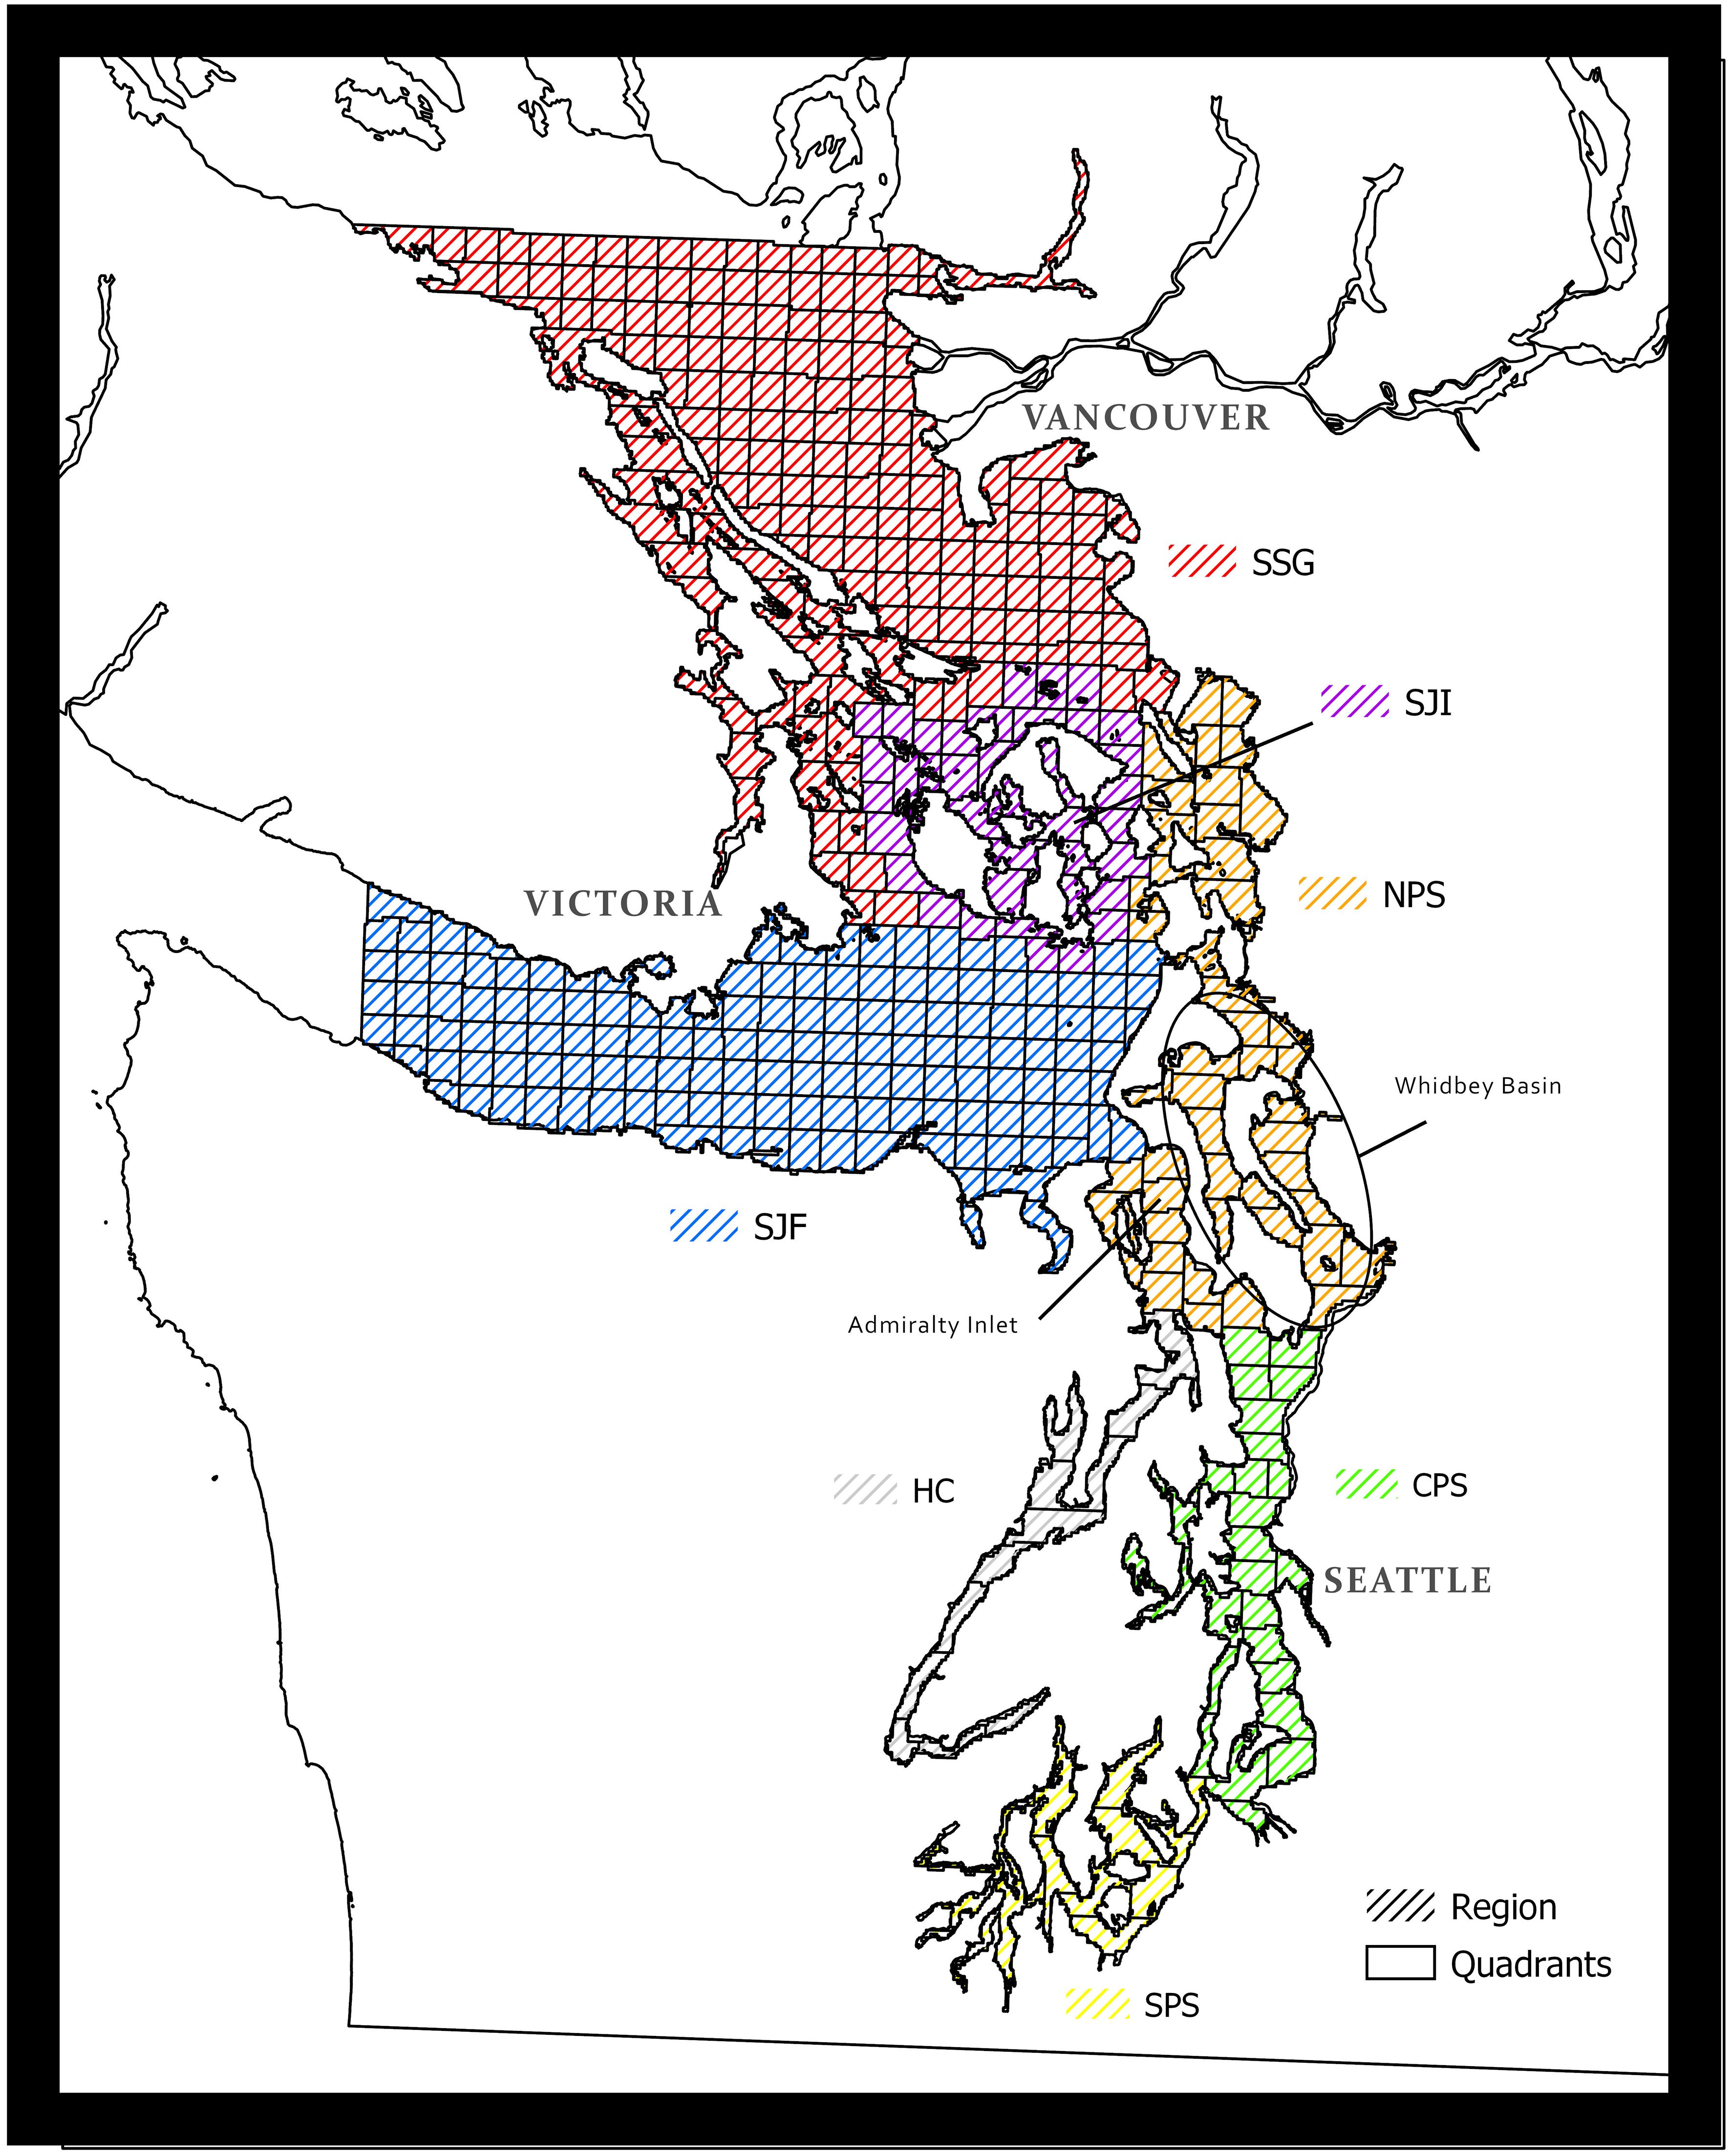
Figure 1 The Central Salish Sea study area highlighting the customized quadrant system for quantifying mysticete sightings. Regions include Southern Strait of Georgia (SSG), San Juan Islands (SJI), Strait of Juan de Fuca (SJF), Northern Puget Sound (NPS), Central Puget Sound (CPS), Hood Canal (HC), and Southern Puget Sound (SPS).
2.2 Temporal analyses
We used raw sightings with duplicates removed (henceforth referred to simply as ‘sightings’) to assess for changes over time. We also used the yearly proportion of the sightings for one species compared to all three species to look for changes over time independent of observer coverage. We conducted a non-parametric change-point analyses to identify the most significant temporal shifts in sightings for each species (‘cpt.np’ function in the changepoint.np R package; Haynes et al., 2022). This method applies a non-parametric cost function and uses the pruned exact linear time algorithm (PELT) to search for optimal segmentations (Killick et al., 2012). In this method, all change points are automatically selected. We used the modified Bayes information criterion penalty term (MBIC) as a penalty function for cost minimization (Zhang and Siegmund, 2007). To further assess the significance of these results, we used a non-parametric Kruskal-Wallace test and pairwise Wilcox tests to compare mean sightings from the distinct time periods as designated by the changepoint segmentations for each species.
2.3 Spatial analyses
We explored spatial trends at the regional level using a heatmap and on a finer scale by creating density plots of sightings using the coordinates for the centroids of each quadrant. We also used SaTScan software (v. 10.1; available at http://www.satscan.org, accessed February 19, 2023) to identify significant space-time clusters for each species. Originally designed for monitoring the spread of diseases, SaTScan is an effective tool for cluster detection and has been widely used in many fields including ecology and environmental monitoring (Kulldorff, 1997; Norman et al., 2012; Adams and Fenton, 2017; Olson et al., 2021). We used the Bernoulli space-time model which pinpoints clusters within a specific geographic region if, at certain time intervals, there was a notable increase in events compared to the surrounding areas.
The Bernoulli model allows designation of both cases and non-cases (i.e., controls). In this study, we applied the approach of cases vs controls as a way to correct for spatial reporting bias in our dataset. Sightings of one focal species were used as “cases,” while sightings of the two non-focal species were used as “controls.” For example, when looking for gray whale clusters, gray whale sightings were used as “cases” and sightings of both humpback and minke whales were used as “controls.” A cluster of gray whale sightings thus represents an area/time with increased gray whale sightings relative to the other two species.
As part of the SaTScan output, we also assessed “relative risk.” For the sake of our study, this equates to a measure of how much more common a sighting of a single species is (e.g., gray whale) within a specified space-time cluster, compared to a baseline of sightings for other baleen species (e.g., humpback and minke whales). It is calculated as the observed sightings divided by the expected sightings within a cluster divided by the observed divided by the expected outside the cluster. Any value greater than 1 indicates an increased likelihood hood of that species.
3 Results
We compiled 17,436 baleen whale sightings from 1976–2019. Of the total sightings, 8,008 (45.9%) were of gray whales, 6,235 (35.8%) were of humpback whales, and 3,193 (18.3%) were of minke whales. Sightings spanned all regions, however, less than 2% of combined sightings were reported in Hood Canal (see HC Figure 1).
3.1 Temporal analyses
Annual time series patterns differed by species. Sightings of minke whales were fairly consistent over time with a mild drop-off in late 1990s early 2000s (Figure 2A). Proportionally, sightings of minke whales dominated early in the study period making up 35–82% of yearly sightings from 1976–1989 (Figure 2B). In contrast to the relative consistency observed in minkes, sightings of both grays and humpbacks increased notably over time (Figure 2A). Increases in gray whale sightings took place periodically with substantial stepwise growth initially occurring in the early 1990s and again in the late 2000s. Gray whales dominated the records proportionally from ~1990–2010 making up 47–97% of yearly sightings. Sightings of humpbacks, on the other hand, increased steadily over time with a sharp, exponential increase in recent decades. Since 2011, humpbacks have represented 42–76% of yearly sightings (Figure 2B).
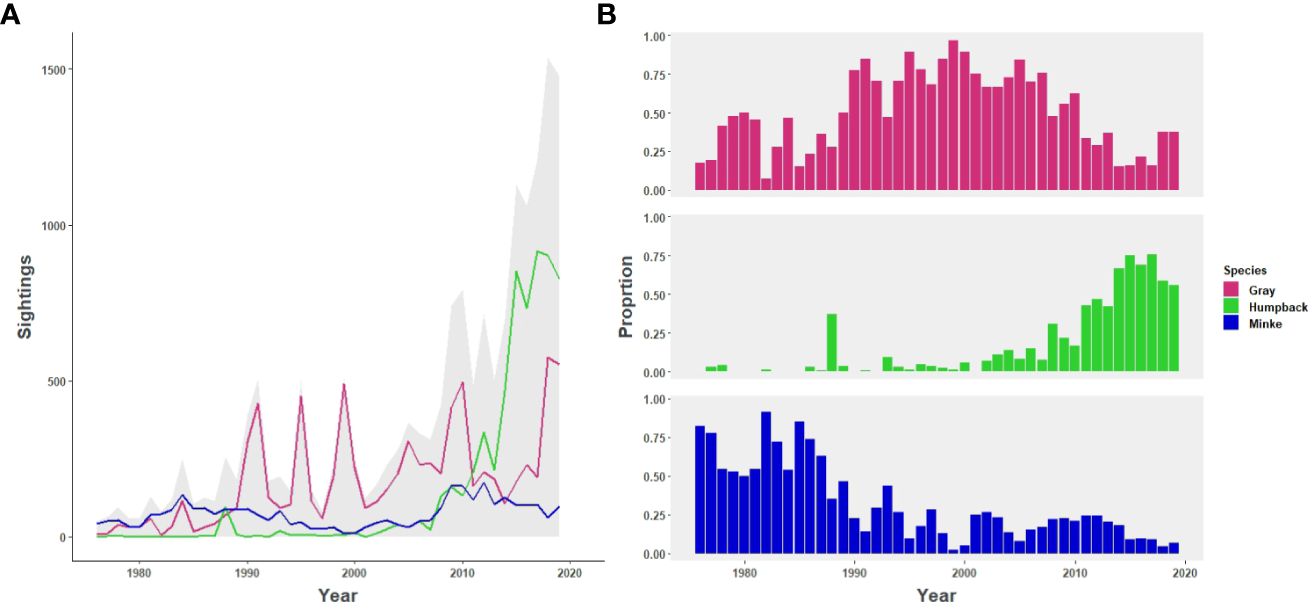
Figure 2 Sightings (A) and proportion of sightings across the three focal species (B) by species in the Salish Sea study area from 1976 - 2019. Total sightings are represented by gray shading and sightings by species are represented by color: gray whales (pink), humpback whales (green) and minke whales (blue).
Key change points were identified for gray whales with increases in 1989 and 2017 (Supplementary Figure 1), with mean sightings for those time periods differing significantly from each other (W = 27.948, df = 2, p-value = 8.533e-07; Supplementary Figure 2; p<0.05 for all pairwise comparisons). Change points for humpback whales included increases in the years 2002 and 2013, with means for those time periods differing significantly from each other (W= 31.557, df = 2, p-value = 1.404e-07; p<0.001 for all pairwise comparisons). Changepoints for minke whales included an increase in 1980, a decrease in 1993, and another increase in 2007 with means for those time periods differing significantly from each other (W=34.765, df = 3, p-value = 1.366e-07); however, pairwise comparisons indicated that mean sightings from 1976–1980 did not differ significantly from the 1994–2007 time period (p=0.404).
3.2 Spatial analyses
Sightings of gray whales were reported in all regions throughout the entire study period and were most commonly observed close to shore (Figures 3A, 4). The majority of sightings were concentrated in Northern Puget Sound (NPS) and Central Puget Sound (CPS) regions, with the highest concentration of sightings located within the Whidbey Basin of NPS (Figure 3A). There was a notable increase in gray whale sightings in the NPS region starting in the early 1990s (Figure 4), with the most significant space-time cluster identified by SaTScan located in the Whidbey Basin from 1998–2019 (Figure 3D). Sightings of gray whales in this area and time period were 2.86 times more likely than sightings of minkes of humpbacks (Supplementary Table 1). We also identified two, larger space-time clusters for gray whales in CPS and NPS from 1990 – 2010/2011 and a less significant cluster of 195 sightings near the mouth of SJF from 1986–2007 (Figure 3D; Supplementary Table 1).
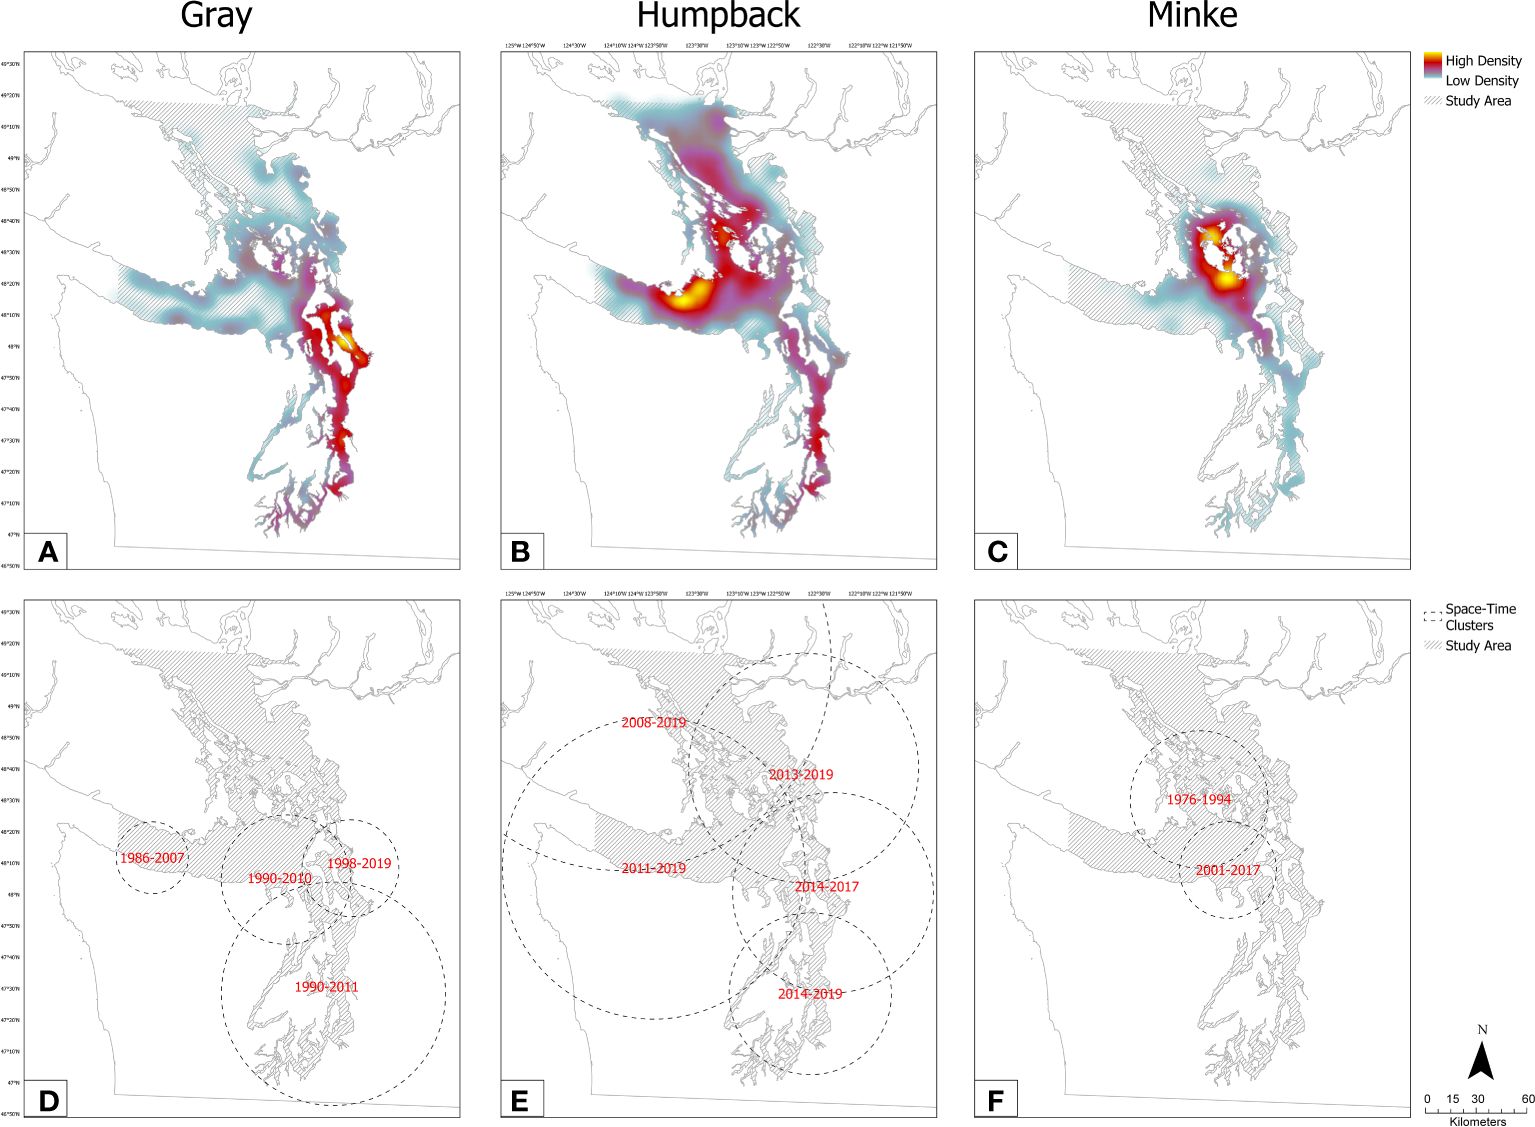
Figure 3 Relative sighting density in the Salish Sea study area from 1976−2019 (A–C). Significant clusters identified by Bernoulli space-time model (D–F). Detailed results of SatScan cluster analysis can be found in Supplementary Table 1.
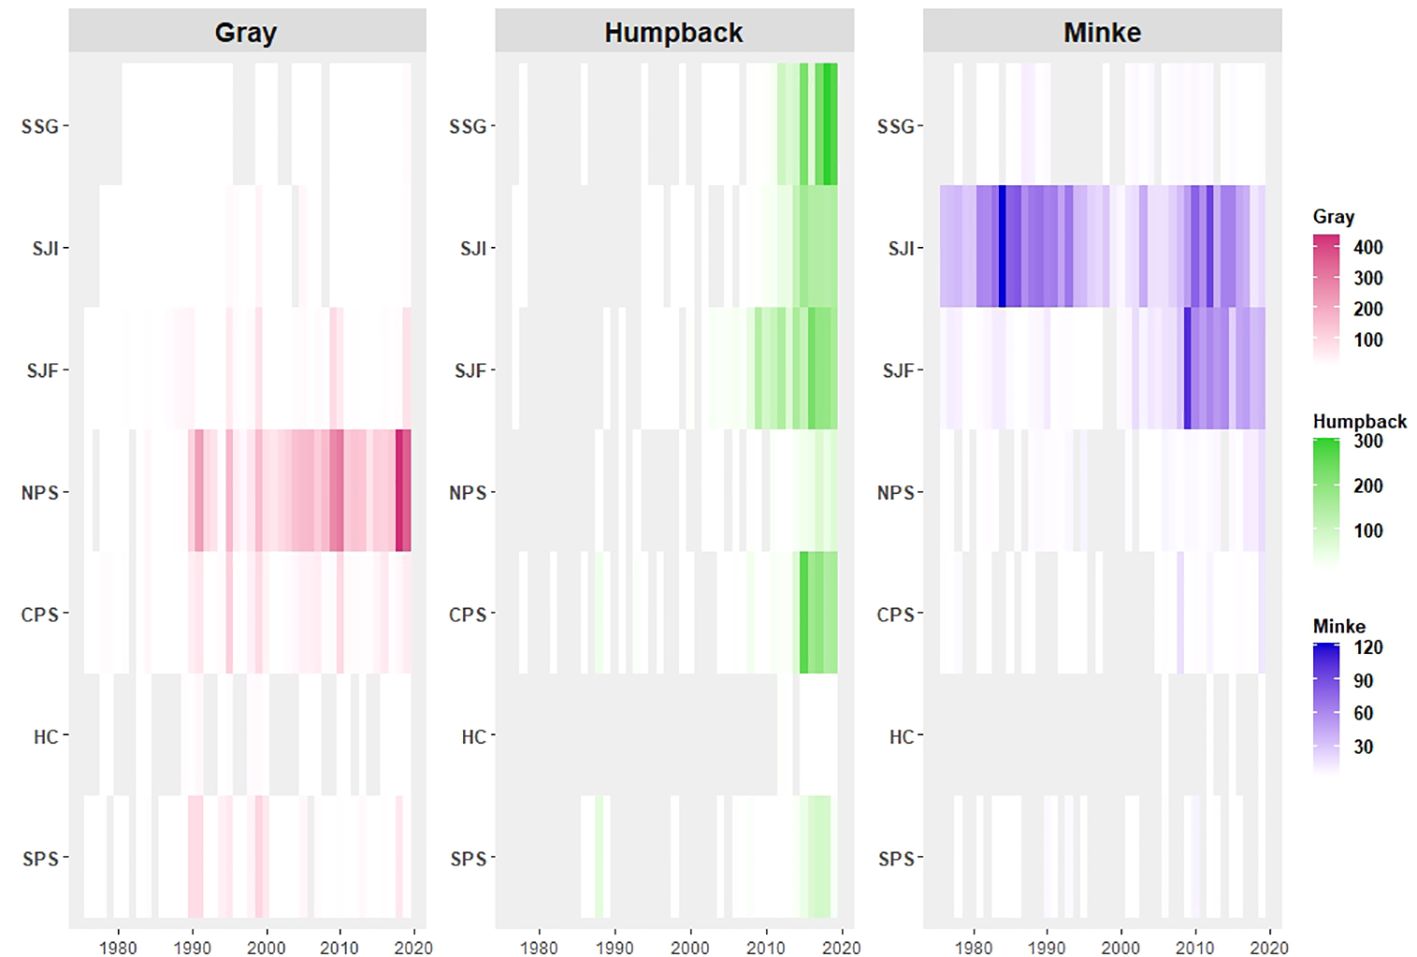
Figure 4 Heat map of sightings in the Salish Sea study area (1976–2019) by region and species. Gray shaded areas represent zero reported sightings.
Sightings of humpbacks were largely absent in the early years of the study period, but showed sharp increases in all regions after 2010, with the most dramatic increases occurring in the BC, SJF, and CPS regions (Figures 3B, 4). The greatest density of sightings overall occurred off the south end of Vancouver Island in SJF (Figure 3B). We identified five space-time clusters for humpbacks in recent years, beginning primarily in SJF, BC and SJI (2008/2011- 2019) and spreading to other areas of Salish Sea and CPS in later years (2013/2014–2019). The most significant cluster indicated humpback sightings were over 4 times as likely as the other species in the northern and western most regions of the Salish Sea from 2008–2019 (Figure 3E; Supplementary Table 1).
Compared to the larger species, sightings for minkes were spread over a smaller geographical area and were primarily concentrated in the San Juan Islands (SJI) and eastern SJF with a mild density spreading into Admiralty Inlet (Figure 3C). Minke sightings were initially concentrated in both SJI and BC and were 8.69 times more likely than other species in these two regions from 1976–1994 (Figures 3E, 4; Supplementary Table 1). In the early 1990s through the early 2000s, we observed a slight drop-off in sightings for in the SJC and BC regions that coincided with an increase in sightings in SJF (Figure 4). Significant space-time clusters support this spatio-temporal shift of minke sightings towards the eastern SJF south of SJI and the entrance to NPS from 2001–2017 (Figure 3E; Supplementary Table 1).
4 Discussion
From 1976–2019, we observed a notable increase in sightings for both gray whales and humpback whales and, in contrast, comparatively stable trends in minke whale sightings. Several distinctions in the spatio-temporal patterns of sightings data highlights the varied use of this Central Salish Sea study area by baleen whales.
4.1 Gray whales
The high concentration of gray whale sightings in NPS since 1990 reflects the seasonally resident ‘Sounders’ within the Whidbey Basin which were first documented in 1990 (Weitkamp et al., 1992; Calambokidis et al., 2002, 2015; Clayton et al., 2023; Calambokidis et al., 2024). Increases in gray whale sightings after the 1989 and 2017 change point align well with both the discovery and recruitment of new individuals to this seasonally resident group, which nearly doubled in size in 2018–2019 (Cascadia Research Collective, unpublished data). The change points also align well with periods of high mortality experienced by the Eastern North Pacific gray whale stock (Le Boeuf and Mate, 2000; Christiansen et al., 2021; Stewart et al., 2023a). These seemingly contrasting trends may be a reflection of gray whales straying from migration routes during times of nutritional stress, a small portion of whom are able to establish themselves with the resident foraging group. While a change point was not identified associated with the 1999–2000 gray whale Unusual Mortality Event (Le Boeuf and Mate, 2000), the sightings in NPS did increase during that period.
The benthic foraging behavior of gray whales likely influenced the abundance of nearshore sightings for this species. The significant cluster of sightings from 1989–2007 near the SJF mouth represents a low-use area for both recreational boaters and whale watch operators, particularly in the earlier years of our study period, thus the primary sighting reports are from shore-based observers. This particular cluster appears to be driven by individual gray whales feeding close to shore, with some documented in the area for weeks or months at a time.
4.2 Humpback whales
Though humpback whales were once common in the Salish Sea (Scheffer and Slipp, 1948), sightings of humpback whales were essentially absent for the first 30 years of our study. The dramatic increase in sightings observed since the late 2000s mirrors the rapid population growth rates documented for this species on a larger scale throughout the Pacific (Zerbini et al., 2010; Calambokidis et al., 2017). It also corresponds to a period when the overall abundance of humpback whales along the US West Coast up into BC has been increasing (Calambokidis and Barlow, 2004, 2020; Miller, 2020).
Humpback sightings were spread throughout the study area but were particularly prevalent in SJF starting in about 2008. While this does represent an area of high whale watch activity, it is also an area where large groups of humpbacks are documented. Furthermore, researchers have documented the foraging behaviors of humpback whales in this high use area, which may be influenced by connections to the productive waters off the continental shelf (Reidy et al., 2023). An expansion of humpback sightings into additional areas of the Central Salish Sea (e.g. SJI and SSG, see Figure 1) and Puget Sound beginning in 2013 coincided with the increase in overall sightings at this same time. In addition to sighting records, photo identification studies in the area have matched whales in the Salish Sea to individuals previously observed in offshore waters (Cascadia Research Collective, unpublished data). All of these results highlight the renewed use of historical feeding grounds in the Salish Sea as the population recovers to pre-whaling numbers.
4.3 Minke whales
Sightings of minke whales exhibited more subtle magnitudes of change relative to that of gray and humpback whales, which is not surprising given the lack of commercial or indigenous harvest of the species in the region (Scammon, 1874; Scheffer and Slipp, 1948). Considered rare in this region, photo identification studies suggest that the population in the SJI region is likely driven by a group of approximately 30–40 individuals that comes to forage in the bathymetrically complex habitats (Hoelzel et al., 1989; Dorsey et al., 1990; Salish Sea minke whale project, unpublished data).
Despite the seemingly stable numbers of individuals documented, we did observe a notable decrease in sightings in the early 1990s. Concurrent with this decrease, significant spatial clusters of minkes shifted from a large (40 km radius) cluster encompassing the SJI region (1978–1994) to a smaller (29 km radius) cluster concentrated in eastern SJF, south of SJI (2001–2017). This shift in habitat use is consistent with photo identification studies that documented a decline in the use of two historically preferred foraging areas in the SJI region, including San Juan Channel and the waters off of Waldron Island (Dorsey et al., 1990). Though minkes are known for having small-scale site fidelity in the Salish Sea, some of the individuals who previously specialized at these sites were observed using sites further south after a presumed lack of prey availability in their usual feeding range or were never seen in the area again (Dorsey et al., 1990). This shift in habitat use continued to be evident during focal follow foraging studies conducted during 2005–2011 (Salish Sea minke whale project, unpublished data).
With no evidence of an increasing population size from photo identification studies, the increase in sightings observed after 2007 may be representative of increased search efforts. The onset of both social-media based sightings platforms and the establishment of shore-based whale watching education programs in the Salish Sea in 2008 may have been a contributing factor. Furthermore, as Southern Resident killer whales spent less time in the inland waters during this time period (Stewart et al., 2023b), commercial whale watch operators may have conducted more dedicated search efforts in the shallow banks south of the San Juans where there can be a degree of predictability around minke whale presence if active bait balls and associated feeding seabirds are observed.
4.4 Limitations
Though it can be difficult to separate the inherent bias that accompanies public sightings databases, citizen science efforts are invaluable for monitoring the recovery of rebounding populations and fostering environmental stewardship (Embling et al., 2015). We recognize that the technological advancements and outreach initiatives of sightings networks, which have contributed to the datasets presented here, are known to have increased over time (Olson et al., 2018). Geographical biases also exist, such as population density and proximity to the home ports of whale watch operators. Furthermore, the feeding ecology of some species (e.g., gray whales) may expose them to high reporting areas more often.
In this study, the ability to examine changes in the yearly proportion of sightings for different species helps to adjust for some of the temporal bias due to changes in reporting effort. Furthermore, the lack of similar change points across species suggests the temporal shifts are not purely due to reporting effort. The application of the Bernoulli space-time model also allows us to identify species specific space-time clusters that are less likely to be driven by reporting bias (e.g., heavily populated or frequently observed areas). While this approach is advantageous for comparison between species, it may have the potential to under-report areas that were heavily used by two or more species. Finally, cross-referencing results with smaller systematic datasets and insights from the literature is an important step to discern real patterns from the background noise.
4.5 Conclusions
We analyzed differences between three baleen whale species to highlight long-term patterns of presence and use in the Central Salish Sea and have identified locations for targeted data collection, monitoring and mitigation efforts. Whidbey Basin, the Strait of Juan de Fuca, and the shallow banks south of the San Juan Islands may be important habitats for gray, humpback, and minke whales, respectively. The results presented here are not meant to represent true population or density estimates, but rather to highlight regional trends that may be overlooked when limited by the availability and financial constraints of systematic population survey efforts. Our findings support larger population recovery trends documented for humpback and gray whales. Furthermore, consistencies with regional studies for all three species highlight the value of these opportunistic sightings as a tool for monitoring large whale species in this area. As the Salish Sea region continues to see development and population growth with the associated increases in demand for international maritime freight (Sobocinski, 2021), all three species of baleen whale are at risk, especially as humpback and gray whale populations rebound and expand their use of the Salish Sea. Continued monitoring of these species through opportunistic public reporting efforts is essential for their continued conservation.
Data availability statement
The data analyzed in this study is subject to the following licenses/restrictions: Sightings data can be requested by The Whale Museum. Requests to access these datasets should be directed to c2lnaHRpbmdzQHdoYWxlbXVzZXVtLm9yZw==.
Author contributions
JO: Conceptualization, Data curation, Formal analysis, Methodology, Visualization, Writing – original draft, Writing – review & editing. SL: Conceptualization, Methodology, Writing – original draft, Writing – review & editing. FR: Conceptualization, Writing – original draft, Writing – review & editing. HM: Conceptualization, Writing – review & editing. AM: Data curation, Writing – review & editing. SB: Data curation, Writing – review & editing. JC: Conceptualization, Data curation, Writing – review & editing.
Funding
The author(s) declare financial support was received for the research, authorship, and/or publication of this article. We would like to thank our partners at NOAA for understanding the importance of longitudinal datasets to the continued understanding of marine mammal trends within the Salish Sea.
Acknowledgments
Thank you to The Whale Museum, Orca Network & Cascadia Research Collective for acting as stewards of such important data. Thank you to Salma Abdel-Raheem, Nathan Harrison and Andrew Frederickson for their contributions to this project. And most importantly, we would like to thank the countless individuals & organizations who have made contributions to these datasets over the decades and continue through today. Without you, this research would not be possible.
Conflict of interest
The authors declare that the research was conducted in the absence of any commercial or financial relationships that could be construed as a potential conflict of interest.
Publisher’s note
All claims expressed in this article are solely those of the authors and do not necessarily represent those of their affiliated organizations, or those of the publisher, the editors and the reviewers. Any product that may be evaluated in this article, or claim that may be made by its manufacturer, is not guaranteed or endorsed by the publisher.
Supplementary material
The Supplementary Material for this article can be found online at: https://www.frontiersin.org/articles/10.3389/fcosc.2024.1401838/full#supplementary-material
Footnotes
References
Adams A. M., Fenton M. B. (2017). Identifying peaks in bat activity: a new application of SaTScan’s space–time scan statistic. Wildl Res. 44, 392–399. doi: 10.1071/WR16194
Baker C. S., Steel D., Calambokidis J., Falcone E., González-Peral U., Barlow J., et al. (2013). Strong maternal fidelity and natal philopatry shape genetic structure in North Pacific humpback whales. Mar. Ecol. Prog. Ser. 494, 291–306. doi: 10.3354/meps10508
Bettridge S., Baker C. S., Barlow J., Clapham P. J., Ford M., Gouveia D., et al. (2015). Status Review of the Humpback Whale (Megaptera novaeangliae) Under the Endangered Species Act. NOAA technical memorandum NMFS NOAA-TM-NMFS-SWFSC-540. Washington, DC: U.S. Department of Commerce, National Oceanic and Atmospheric Administration, National Marine Fisheries Service.
Brown N. A., Gaydos J. K. (2007). “Species of concern within the Georgia Basin Puget Sound marine ecosystem: changes from 2002 to 2006,” in Proceedings of the 2007 Georgia Basin Puget Sound Research Conference. Vancouver, BC, Canada: Environment Canada and the Puget Sound Action Team.
Calambokidis J., Barlow J. (2004). Abundance of blue and humpback whales in the eastern North Pacific estimated by capture-recapture and line-transect methods. Mar. Mamm Sci. 20, 63–85. doi: 10.1111/j.1748-7692.2004.tb01141.x
Calambokidis J., Barlow J. (2020). Updated Abundance Estimates for Blue and Humpback Whales Along the U.S. West Coast using Data Through 2018. U.S. Department of Commerce, NOAA Technical Memorandum NMFS-SWFSC-634. Washington, DC: National Oceanic and Atmospheric Administration.
Calambokidis J., Barlow J., Flynn K., Dobson E., Steiger G. H. (2017). Update on abundance, trends, and migrations of humpback whales along the US West Coast. Seattle WA: IWC Report SC/A17/NP/13 for the Workshop on the Comprehensive Assessment of North Pacific Humpback Whales.
Calambokidis J., Darling J. D., Deecke V., Gearin P., Gosho M., Megill W., et al. (2002). Abundance, range and movements of a feeding aggregation of gray whales (Eschrichtius robustus) from California to southeastern Alaska in 1998. J. Cetacean Res. Manage 4, 267–276. doi: 10.47536/jcrm.v4i3
Calambokidis J., Falcone E. A., Quinn T. J., Burdin A. M., Clapham P. J., Ford J. K. B., et al. (2008). PLASH: Structure of Populations, Levels of Abundance and Status of Humpback Whales in the North Pacific (Seattle, Washington, USA: Final report for Contract AB133F-03-RP-00078 prepared by Cascadia Research for U.S. Department of Commerce). Available at: http://www.cascadiaresearch.org/SPLASH/SPLASHcontract-Report-May08.pdf.
Calambokidis J., Steiger G., Curtice C., Harrison J., Ferguson M., Becker E., et al. (2015). Biologically important areas for selected cetaceans within U.S. waters – West coast region. Aquat. Mammals 41, 39–53. doi: 10.1578/AM.41.1.2015.39
Calambokidis J., Kratofil M. A., Palacios D. M., Lagerquist B. A., Schorr G. S., Hanson M. B., et al. (2024). Biologically important areas II for cetaceans within US and adjacent waters-West Coast Region. Front. Mar. Sci. 11, 1283231. doi: 10.3389/fmars.2024.1283231
Carretta J. V., Oleson E. M., Forney K. A., Weller D. W., Lang A. R., Baker J., et al. (2023). U.S. Pacific Marine Mammal Stock Assessments: 2022 (Washington, D. C.: U.S. Department of Commerce). doi: 10.25923/5ysf-gt95
Christiansen F., Rodríguez-González F., Martínez-Aguilar S., Urbán J., Swartz S., Warick H., et al. (2021). Poor body condition associated with an unusual mortality event in gray whales. Mar. Ecol. Prog. Ser. 58, 237–252. doi: 10.3354/meps13585
Clapham P. J. (2000). “The humpback whale,” in Cetacean Societies, Field Studies of Dolphins and Whales (The University of Chicago, Chicago), 173–196.
Clayton H., Cade D. E., Burnham R., Calambokidis J., Goldbogen J. (2023). Acoustic behavior of gray whales tagged with biologging devices on foraging grounds. Front. Mar. Sci. 10. doi: 10.3389/fmars.2023.1111666
Dorsey E. M. (1983). Exclusive adjoining ranges in individually identified minke whales (Balaenoptera acutorostrata) in Washington state. Can. J. Zool 61, 174—81. doi: 10.1139/z83-022
Dorsey E. M., Stern S. J., Hoelzel A. R., Jacobsen J. (1990). Minke whales (Balaenoptera acutorostrata) from the west coast of North America: individual recognition and small-scale site fidelity. Rept. Int. Whal. Commn. Special 12), 357–368.
Embling C. B., Walters A. E. M., Dolman S. J. (2015). How much effort is enough? The power of citizen science to monitor trends in coastal cetacean species. Global Ecol. Cons 3, 867–877. doi: 10.1016/j.gecco.2015.04.003
Ettinger A. K., Harvey C. J., Emmons C., Hanson M. B., Ward E. J., Olson J. K., et al. (2022). Shifting phenology of an endangered apex predator mirrors changes in its favored prey. Endanger Species Res. 48, 211–223. doi: 10.3354/esr01192
Ford J. K. (2014). Marine Mammals of British Columbia Vol. 6 (Victoria, British Columbia: Royal BC Museum), 460.
Gaydos J. K., Pearson S. F. (2011). Birds and mammals that depend on the Salish Sea: a compilation. Northwestern Nat. 92, 79–94. doi: 10.1898/10-04.1
Harvey G. K., Nelson T. A., Paquet P. C., Ferster C. J., Fox C. H. (2018). Comparing citizen science reports and systematic surveys of marine mammal distributions and densities. Biol. Conserv. 226, 92–100. doi: 10.1016/j.biocon.2018.07.024
Hauser D. D. (2006). Summer Space use of Southern Resident Killer Whales (Orcinus orca) within Washington and British Columbia Inshore Waters (Seattle (WA: University of Washington).
Haynes K., Killick R., Fearnhead P., Eckley I., Grose D. (2022). Changepoint. np: Methods for Nonparametric Changepoint Detection. R package version 1.0.5.
Hoelzel A. R., Dorsey E. M., Stern S. J. (1989). The foraging specializations of individual minke whales. Anim. Behav. 38, 786–794. doi: 10.1016/S0003-3472(89)80111-3
Killick R., Fearnhead P., Eckley I. A. (2012). Optimal detection of changepoints with a linear computational cost. J. Am. Stat. Assoc. 107, 1590–1598. doi: 10.1080/01621459.2012.737745
Krahn M. M., Wade P. R., Kalinowski S. T., Dahlheim M. E., Taylor B. L., Hanson M. B., et al. (2004). Status review of Southern Resident killer whales (Orcinus orca) under the Endangered Species Act. U.S. Seattle, WA: Northwest Fisheries Science Center, National Oceanic and Atmospheric Administration.
Kulldorff M. (1997). A spatial scan statistic. Commun. Stat-Theor M 26, 1481–1496. doi: 10.1080/03610929708831995
Le Boeuf B. J., Mate B. R. (2000). High gray whale mortality and low recruitment in 1999: potential causes and implications. J. Cetacean Res. Manage 2, 85–99. doi: 10.47536/jcrm.v2i2
Losey R. J., Yang D. Y. (2007). Opportunistic whale hunting on the southern northwest coast: ancient DNA, artifact, and ethnographic evidence. Am. Antiquity 72, 657–676. doi: 10.2307/25470439
Miller H. (2020). Relating the Distribution of Humpback Whales to Environmental Variables and Risk Exposure (Seattle (WA: University of Washington).
Nikolich K., Towers J. R. (2018). Vocalizations of common minke whales (Balaenoptera acutorostrata) in an eastern North Pacific feeding ground. Bioacoustics 1–12, 1952. doi: 10.1080/09524622.2018.1555716
Norman S. A., Huggins J., Carpenter T. E., Case J. T., Lambourn D. M., Rice J., et al. (2012). The application of GIS and spatiotemporal analyses to investigations of unusual marine mammal strandings and mortality events. Mar. Mammal Sci. 28, E251–E266. doi: 10.1111/j.1748-7692.2011.00507.x
Olson J. K., Wood J., Osborne R. W., Barrett-Lennard L., & Larson S. (2018). Sightings of southern resident killer whales in the Salish Sea 1976–2014: the importance of a long-term opportunistic dataset. Endanger Species Res. 37, 105–118. doi: 10.3354/esr00918
Olson J. K., Lambourn D. M., Huggins J. L., Raverty S., Scott A. A., Gaydos J. K., et al (2018). Trends in propeller strike-induced mortality in harbor seals (Phoca vitulina) of the Salish Sea. J. Wild. Dis. 57 (3), 689–693.
Pike G. C. (1962). Migration and feeding of the gray whale (Eschrichtius gibbosus). J. Fish. Res. Board Can. 19, 815–838. doi: 10.1139/f62-051
Reidy R., Gauthier S., Doniol-Valcroze T., Lemay M. A., Clemente-Carvalho R. B., Cowen L. L., et al. (2023). Integrating technologies provides insight into the subsurface foraging behaviour of a humpback whale (Megaptera novaeangliae) feeding on walleye pollock (Gadus chalcogrammus) in Juan de Fuca Strait, Canada. PloS One 18, e0282651. doi: 10.1371/journal.pone.0282651
Risch D., Norris T., Curnock M., Friedlaender A. (2019). Common and Antarctic minke whales: Conservation status and future research directions. Front. Mar. Sci. 6. doi: 10.3389/fmars.2019.00247
Robertson F. C., Trites A. W. (2018). Ecology, archaeology, and historical accounts demonstrate the whaling practices of the quileute tribe in washington state. SAA Archaeological Rec. 18, 23–30.
Scammon C. M. (1874). The Marine Mammals of the North Western Coast of North America, described and illustrated together with an Account of the American Whale-Fishery (San Francisco: J. H. Carmany).
Scheffer V. B., Slipp J. W. (1948). The whales and dolphins of Washington state with a key to the cetaceans of the west coast of North America. Am. Midland Nat. 39, 257–337. doi: 10.2307/2421587
Sobocinski K. L. (2021). State of the Salish Sea. Eds. Broadhurst G., Baloy N. J. K. (Bellingham, WA: Salish Sea Institute, Western Washington University). doi: 10.25710/vfhb-3a69
Stewart J. D., Joyce T. W., Durban J. W., Calambokidis J., Fauquier D., Fearnbach H., et al. (2023a). Boom-bust cycles in gray whales associated with dynamic and changing arctic conditions. Science 382, 207–211. doi: 10.1126/science.adi1847
Stewart J. D., Cogan J., Durban J. W., Fearnbach H., Ellifrit D. K., Malleson M., et al. (2023b). Traditional summer habitat use by Southern Resident killer whales in the Salish Sea is linked to Fraser River Chinook salmon returns. Mar. Mam Sci. 39, 858–875. doi: 10.1111/mms.13012
Wade P. R. (2017). Estimates of abundance and migratory destination for North Pacific humpback whales in both summer feeding areas and winter mating and calving areas – revision of estimates in SC/66. Paper SC/68C/IA/03 presented to the International Whaling Commission Scientific Committee.
Weitkamp L. A., Wissmar R. C., Simenstad C. A., Fresh K. L., Odell J. G. (1992). Gray whale foraging on ghost shrimp (Callianassa californiensis) in littoral sand flats of Puget Sound, USA. Can. J. Zool 70, 2275–2280. doi: 10.1139/z92-304
Zerbini A. N., Clapham P. J., Wade P. R. (2010). Assessing plausible rates of population growth in humpback whales from life-history data. Mar. Biol. 157, 1225–1236. doi: 10.1007/s00227-010-1403-y
Keywords: Salish Sea, citizen science, baleen whales, population recovery, sightings
Citation: Olson JK, Larson SE, Robertson FC, Miller H, Morrigan A, Berta S and Calambokidis J (2024) Utilizing long-term opportunistic sightings records to document spatio-temporal shifts in mysticete presence and use in the Central Salish Sea. Front. Conserv. Sci. 5:1401838. doi: 10.3389/fcosc.2024.1401838
Received: 16 March 2024; Accepted: 10 May 2024;
Published: 24 March 2024.
Edited by:
Kristina Cammen, University of Maine, United StatesReviewed by:
Cindy R. Elliser, Pacific Mammal Research (PacMam), United StatesLadd M. Irvine, Oregon State University, United States
Copyright © 2024 Olson, Larson, Robertson, Miller, Morrigan, Berta and Calambokidis. This is an open-access article distributed under the terms of the Creative Commons Attribution License (CC BY). The use, distribution or reproduction in other forums is permitted, provided the original author(s) and the copyright owner(s) are credited and that the original publication in this journal is cited, in accordance with accepted academic practice. No use, distribution or reproduction is permitted which does not comply with these terms.
*Correspondence: J. K. Olson, amVub2xzb25AZXZlcmV0dGNjLmVkdQ==