Heart Rate Dynamics Identification and Control in Cycle Ergometer Exercise: Comparison of First- and Second-Order Performance
 Alexander H. Spörri
 Hanjie Wang
 Kenneth J. Hunt
- Institute for Rehabilitation and Performance Technology, Division of Mechanical Engineering, Department of Engineering and Information Technology, Bern University of Applied Sciences, Burgdorf, Switzerland
Background: Accurate and robust feedback control of human heart rate is important for exercise testing and prescription. Feedback controllers can be designed using first-order, linear, time-invariant models of heart rate dynamics, but it remains to investigate whether second-order models lead to better identification and control performance. The distinguishing contribution of this research is the direct employment of established physiological principles to determine model structure, and to focus the feedback-design goals: cardiac physiology proposes a two-phase second-order response, delineated into fast and slow components; the natural phenomenon of broad-spectrum heart-rate variability motivates a novel feedback design approach that appropriately shapes the input-sensitivity function.
Aim: The aim of this work was to compare the fidelity of first- and second-order models of heart rate response during cycle-ergometer exercise, and to compare the accuracy and dynamics of feedback controllers that were designed using the two model structures.
Methods: Twenty-seven participants each took part in two identification tests to generate separate estimation and validation data sets, where ergometer work rate was a pseudo-random binary sequence and in two feedback tests where controllers were designed using the first- or second-order models.
Results: Second-order models gave substantially and significantly higher model fit (51.9% vs. 47.9%, p < 0.0001; second order vs. first order) and lower root-mean-square model error (2.93 bpm vs. 3.21 bpm, p < 0.0001). There was modest improvement in tracking accuracy with controllers based on second-order models, where mean root-mean-square tracking errors were 2.62 bpm (second order) and 2.77 bpm (first order), with p = 0.052. Controllers based on second-order models were found to be substantially and significantly more dynamic: mean values of average control signal power were 9.61 W2 and 7.56 W2, p < 0.0001.
Conclusion: The results of this study confirm the hypotheses that second-order models of heart-rate dynamics give better fidelity than first-order models, and that feedback compensator designs that use the additional dynamic mode give more accurate and more dynamic closed-loop control performance.
1 Introduction
Accurate and robust feedback control of human heart rate can be achieved using first-order, linear, time-invariant models of heart rate dynamics (Hunt and Fankhauser, 2016; Hunt et al., 2019a; Hunt and Hurni, 2019), but data from physiological studies suggest that at least two dynamic modes contribute to the overall response (Whipp et al., 1982; Bearden and Moffat, 2001). It is therefore of importance to investigate whether second-order models give better fidelity and whether feedback compensator designs that use the additional dynamic mode give more accurate and/or more dynamic closed-loop control performance.
It has been observed that heart rate response to step changes in work load consists of two principal components: a very fast, short-duration increase, called Phase I, attributed to the immediate cardiodynamic response; and a slower Phase II component that gives the major increase in heart rate; these two components have quite often been combined into a single exponential with a time constant that is termed the mean response time (Wasserman et al., 2011).
For work rates above the anaerobic threshold, there may in addition be a very slow but continuously increasing Phase III response, implying that a third-order model may be appropriate. When the dynamic model is to be used for feedback control of heart rate, however, any Phase III component can be neglected since integral action in the controller will eliminate these very slow disturbances (see also (Wang and Hunt, 2021a)). For this reason, and to deal with potential slow drift of heart rate response during system identification experiments, the data were detrended prior to parameter estimation (Section 2.1).
Most previous studies of heart rate control have been model-based, employing either linear (Su et al., 2010; Hunt et al., 2019b) or non-linear (Cheng et al., 2008) models. To date, there is a lack of evidence that non-linear controllers bring performance benefits, while the following limitations can be identified: the stability is conditional (Asheghan and Míguez, 2016; Verrelli et al., 2021); the non-linearity is reduced to derive a robust controller (Argha et al., 2016); and the performance validation was only applied in simulation (Mazenc et al., 2011) or in experiments with small sample sizes (Paradiso et al., 2013). Furthermore, a systematic, direct comparison of linear and non-linear controllers in 16 participants found no difference in performance and that the non-linear approach could be over-sensitive at low exercise intensity (Hunt and Maurer, 2016).
In contrast, several cycle ergometer heart rate control studies based on linear time-invariant models were validated using large sample sizes and demonstrated highly accurate and robust performance. Kawada et al. tested 67 participants in three groups and found good tracking accuracy in terms of root-mean-square tracking error (RMSE): 55 healthy participants had a mean RMSE of 2.5 bpm (beats per minute) at an intensity of 60% of maximal heart rate (HRmax); these same 55 participants achieved a mean RMSE of 3.8 bpm at 70% of HRmax; and 12 cardiac patients had mean RMSE of 3.0 bpm at a heart rate intensity of 20 bpm above their resting level (Kawada et al., 1999). Hunt et al. developed a robust input-sensitivity-shaping method based on a first-order linear model and tested 49 healthy participants in three cohorts grouped according to the shape of target HR profile and cadence: the mean RMSE values were 3.1 bpm (n = 25 participants, square-wave target HR and constant cadence), 2.5 bpm (n = 24, constant target HR and constant cadence), and 2.6 bpm (n = 24, constant target HR, self-selected cadence) (Hunt and Hurni, 2019).
It is also possible to control heart rate on a cycle ergometer without an explicit dynamic model: Argha et al. developed and tested a novel method based on auditory biofeedback commands that instructed participants to change their cycling cadence (Argha et al., 2017); the choice of cadence as the manipulated variable is also unique, as most studies use work rate as the control signal. That work demonstrated good control accuracy in a total of 24 participants who were randomly divided into two separate groups: mean RMSE was 3.9 bpm (first group, n = 12) and 3.7 bpm (second group, n = 12). (Two groups were created in order to test controller robustness: a controller tuned for the first group was tested on the second group, and vice versa; no significant difference in mean RMSE between the groups was found.)
The mean response time model of heart rate response has motivated studies that used linear first-order models for identification and control design, e.g. (Hunt and Hurni, 2019), but the question arises of whether delineation of Phase I and II components, that is to say, the employment of second order models, will lead to better representation of heart rate dynamics and, in turn, to more accurate and dynamic feedback control: these are the hypotheses of the present study.
For treadmill exercise, it was previously demonstrated that goodness-of-fit of empirically identified second-order models was significantly higher than first-order models (Wang and Hunt, 2021a); but an associated feedback control study, while showing significantly more dynamic control signal activity, did not determine any difference in tracking and regulation accuracy (Wang and Hunt, 2021b); a limitation of the latter work was that a low sample size was employed (n = 10). For the cycle ergometer mode of exercise, on the other hand, no comparative study of first- and second-order identification and control performance has yet been conducted.
The aim of this work was to compare the fidelity of first- and second-order models of heart rate response during cycle-ergometer exercise, and to compare the accuracy and dynamics of feedback controllers that were designed using the two model structures.
2 Methods
2.1 Plant Model and Feedback Design
The open-loop plant Po was modelled as the general linear, time-invariant transfer function
with control signal u (physically, target work rate) and controlled variable y (heart rate); heart rate variability and other uncertainties are represented by a disturbance term d (Figure 1); A and B are polynomials in the complex variable s.
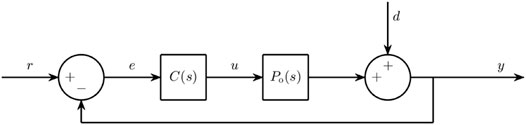
FIGURE 1. Block diagram of control structure for this study. Po(s) is the plant model and C(s) is the feedback compensator. The controlled variable y is heart rate, u is the control signal (cycle ergometer work-rate target), and d is a disturbance term that mainly comprises heart rate variability. r is the reference/target heart rate.
The first- and second-order instances of the plant are, respectively,
and
where the k are steady-state gains and τ time constants.
As discussed in the Introduction, raw data obtained from identification experiments were detrended prior to parameter estimation in order to eliminate any potential Phase III component. The gains and time constants of the first- and second-order models were estimated using a least-squares optimisation procedure (Matlab System Identification Toolbox; The Mathworks, Inc., United States).
A feedback control system for heart rate was employed (Figure 1) that used a strictly-proper, linear, time-invariant compensator transfer function C,
where e = r − y is the tracking error. Integral action was implemented by constraining the compensator denominator as H(s) = sH′(s).
Synthesis of the feedback compensator C used a frequency-domain design approach, see (Hunt and Fankhauser, 2016), that shapes the input sensitivity function Uo to be well behaved (no peaking) and to satisfy a closed-loop bandwidth requirement. Uo describes the closed-loop transfer function linking the disturbance term d (and the reference r) with the control signal u. The overall idea behind this design concept is therefore to make the control signal u well behaved in the face of disturbances d arising from heart-rate variability, but with the option of freely selecting the response bandwidth. Uo is defined in general as
The design goal for input-sensitivity shaping algebraically constrains the compensator C in such a way that Uo is first order, and hence is devoid of peaking, and has a specified bandwidth p, which is the feedback design/tuning parameter. For both the first- and second-order cases, Uo then reduces to
where k = k1 (first-order plant Eq. 2) or k = k2 (second-order plant Eq. 3).
Derivation of the compensator solutions that achieve this form for Uo is described in detail elsewhere (Hunt and Fankhauser, 2016; Wang and Hunt, 2021b), and merely summarised here: in the first-order case, the compensator is (see (Hunt and Fankhauser, 2016))
and for the second-order case it is (Wang and Hunt, 2021b)
Thus, the compensators depend simply on the chosen design parameter p (bandwidth of Uo) and the plant parameters k1, τ1 (first-order case) or k2, τ21, τ22 (second-order case).
2.2 Equipment
All identification and feedback control experiments were performed using a computer-controlled cycle ergometer (model LC7, Monark Exercise AB, Sweden). The ergometer was connected using a USB serial link to a PC running Simulink Desktop Real-Time (The MathWorks, Inc., United States). Heart rate was monitored using a chest belt sensor (H10, Polar Electro Oy, Finland) and a receiver module (Heart Rate Monitor Interface, Sparkfun Electronics, United States) connected via USB to the PC and Simulink models. A sample period of 5 s was used for identification and control.
2.3 Experimental Procedures
In accordance with an a priori statistical power and sample size estimate (Section 2.5), 27 participants were recruited: 20 males and 7 females; mean age 31 years; mean height 1.79 m; mean body mass 76 kg.
Each participant took part in two identification tests—to generate separate estimation and validation data sets—and two feedback control tests—to compare compensators C1 and C2—with each test separated by 24 h.
For system identification, cycle-ergometer work rate was varied using one complete period of a pseudo-random binary sequence (PRBS) with a mean level of Pmid and an amplitude of 20 W (i.e. P = Pmid ± 20 W). The overall identification test protocol (Figure 2) included a 15-min warm up which also served to determine the mid-level work rate Pmid, as follows. During the warm up, heart rate was controlled using an existing feedback compensator to reach a constant level HRmid corresponding to the border between moderate and vigorous intensities, viz. HRmid = 0.765 × (220 − age) − 20, (Riebe et al., 2018; Hunt and Hurni, 2019). Pmid was calculated as the mean work rate of the final 2 minutes of the warm up and used in the subsequent open-loop identification phase. For each participant, the first data set was used to estimate first- and second-order models P1 and P2 and the second data set to compute the validation outcomes, namely fit, Eq. 9, and RMSEI, Eq. 10. The procedure was then reversed by using the second data set for estimation and the first data set for model validation. Thus, with a cohort of 27 participants, a total of 54 pairs of first- and second-order models were available for comparison.
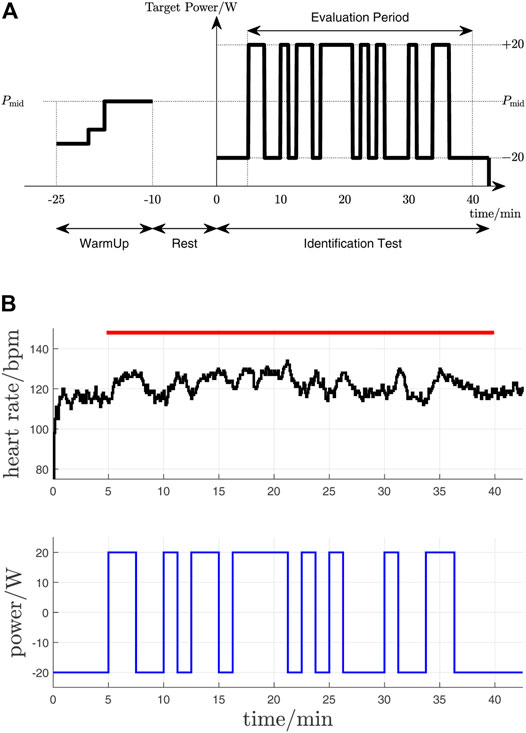
FIGURE 2. Identification test protocol. (A) Test phases and cycle ergometer work rate (PRBS around the mid-level Pmid). (B) Original data record from one participant (P01). Upper plot - heart rate measurement; lower plot - target work rate (PRBS signal with Pmid subtracted); the evaluation period is depicted by the red horizontal bar.
For feedback control, a square-wave target heart rate profile was applied with mean level HRmid and amplitude 10 bpm, i.e. HR* = HRmid ± 10. The overall feedback control test protocol (Figure 3) incorporated a 10-min warm up that was feedback-controlled to a constant target heart rate of HRmid. Each participant was tested with their individual C1 and C2 compensators: the C1 were calculated according to Eq. 7 using the best of the participant’s two identified P1 models, and C2 were calculated using Eq. 8 and the best of the two individual P2 models. To avoid possibly confounding order-of-presentation effects, the order of testing with C1 or C2 (i.e. C1 then C2 vs. C2 then C1) was changed sequentially according to participant number. Control data from one participant had to be excluded for reasons of data quality; 26 pairs of outcomes were therefore available for the C1 vs. C2 comparative analysis.
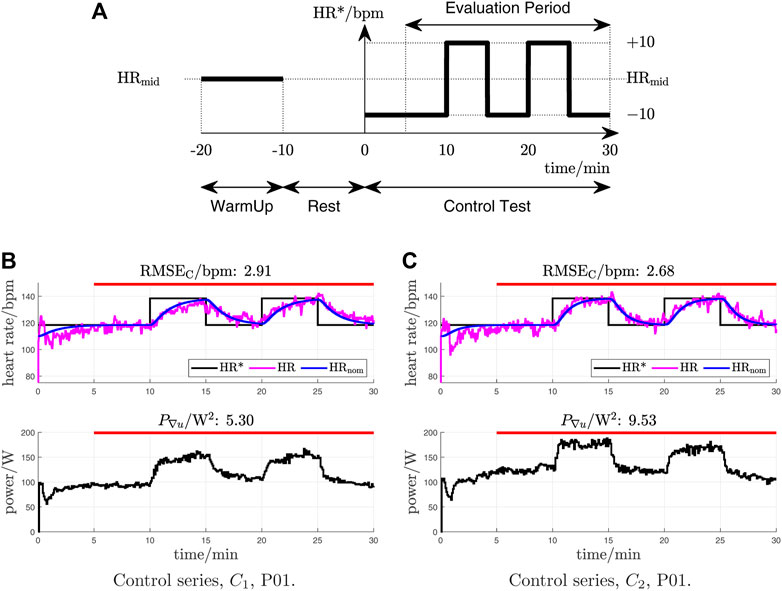
FIGURE 3. (A) Control test protocol with HR-reference profile (HR*). (B) and (C): Exemplary measurements with RMSEC closest to the mean in the two test series for the two compensator types (participant P01). For each figure, the upper plot shows the reference heart rate signal (HR*, black), the measured heart rate (HR, magenta) and the nominal (simulated) heart rate response (HRnom, blue); the lower plots show the control signal, i.e., the cycle ergometer work-rate target. The evaluation period for each measurement is denoted by a red horizontal bar.
2.4 Outcome Measures
Identification outcomes: fidelity of the estimated models was quantified on the validation data sets using a normalised root-mean-square model error (NRMSE), also called “fit”, and the absolute RMS model error (RMSEI);
where HR is the measured heart rate and HRsim is simulated using the estimated models.
Feedback control outcomes: accuracy of heart rate tracking was quantified using root-mean-square tracking error (RMSEC),
where HRnom is the nominal (simulated) closed-loop heart rate response, while intensity of the manipulated variable was quantified by the average power in changes in the control signal (P∇u), viz.
2.5 Hypotheses, Statistics and Sample Size Estimate
The hypotheses of this study were (cf. Section 1): 1) that second-order models of open-loop heart-rate response would give better fidelity (i.e. higher fit and lower RMSEI) than first-order models, and 2) that feedback compensators based on second-order models would give more accurate (lower RMSEC) and more dynamic (higher P∇u) control of heart rate.
Hypothesis testing—comparison of sample mean differences for the outcomes defined above—was done using paired, one-sided t-tests with a significance level of 5% (α = 0.05). Normality of sample differences was confirmed using the Kolmogorov-Smirnov test with Lilliefors correction.
The sample size of n = 27 participants was estimated a priori by a statistical power calculation that used estimates of expected effect sizes and sample standard deviations obtained from previous studies in this lab, with the significance level of 5% and a statistical power of 80% (1 − β = 0.8).
3 Results
3.1 Identification
To aid understanding of the overall identification test analysis, the results for a single participant (P01) are first illustrated (Figure 4). In this example, the second-order model provides higher fidelity than the first-order model: the respective RMSEI values were 2.94 bpm and 3.16 bpm (P2 vs. P1), while the fit values were 51.4% and 47.7% (P2 vs. P1).
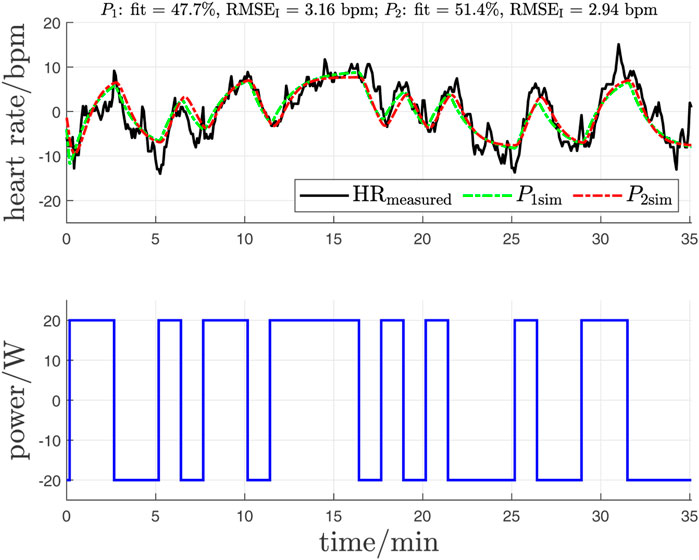
FIGURE 4. Identification data preprocessing and model validation: exemplary data for participant P01 (the raw data for this test are shown in Figure 2B). Upper plot: HR measurement from validation data set after de-trending (solid black line), simulated HR response of first-order model (P1sim, green dashed line), and simulated HR response of second-order model (P2sim, red dashed line). Lower plot: Cycle ergometer work rate after mean removal.
Of the 54 identification tests completed, 48 (89%) of the P2 models returned a lower RMSEI and higher fit than the corresponding P1 models; overall, RMSEI was significantly lower and fit significantly higher for P2 than for P1:
• RMSEI was 2.93 bpm ± 0.59 bpm (mean ± standard deviation) vs. 3.21 bpm ± 0.70 bpm (P2 vs. P1) with p = 2.0 × 10⁻¹¹ (Table 1; Figure 5A),
• Fit values were 51.9% ± 8.0% vs. 47.9% ± 7.0% (P2 vs. P1) with p = 7.1 × 10⁻¹⁴ (Table 1; Figure 5B).
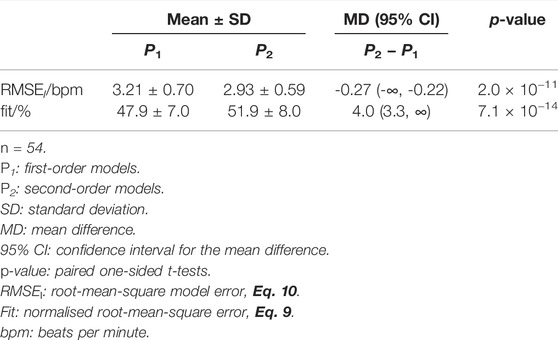
TABLE 1. Overall outcomes for P1 and P2 from the model identification test series and comparison of outcome differences (see also Figure 5).
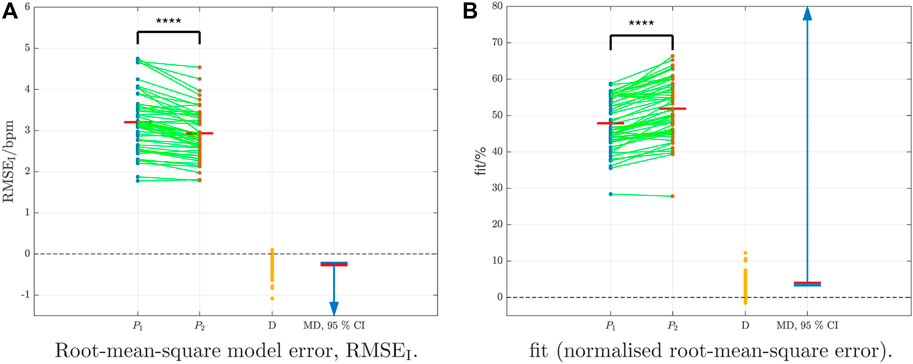
FIGURE 5. Identification outcomes: data samples and differences for RMSEI and fit between 54 first-order models, P1, and 54 second-order models, P2 (see also Table 1). Sample pairs for each participant are connected by green lines; mean values are shown as red horizontal bars (with numerical values given in Table 1). Sample-pair differences are shown as D (P2 - P1). The mean difference (MD) is depicted as a red bar and the blue arrow is the corresponding 95% confidence interval (CI). For both RMSEI and fit, the 95% CI does not contain the value 0, thus showing a significant improvement for P2 vs. P1 (p < 0.05, Table 1; the notation **** denotes p < 0.0001). (A) Root-mean-square model error, RMSEI. (B) fit (normalised root-mean-square error).
Graphical illustration of the individually estimated gains and time constants (Figure 6) shows wide dispersions but quite narrow bounds on the 95% confidence intervals for mean estimates. The overall first-order model had gain k1 = 0.46 bpm/W ± 0.14 bpm/W (mean ± standard deviation) and time constant τ1 = 68.8 s ± 22.0 s. The overall second-order model gain was k2 = 0.40 bpm/W ± 0.12 bpm/W and the time constants were τ21 = 35.7 s ± 21.7 s and τ22 = 20.4 s ± 9.6 s. This gives average first- and second-order model transfer functions as follows:
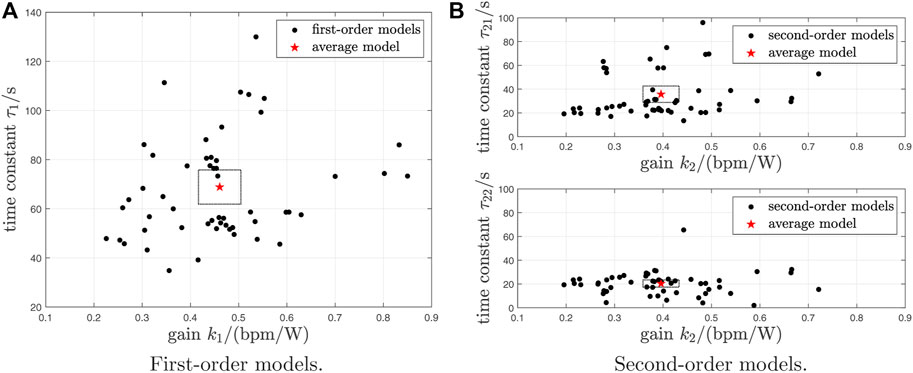
FIGURE 6. Dispersion of estimated model parameters for 54 first- and 54 second-order models. The stars depict the average models. The 95% confidence intervals for the mean gains and time constants are shown as dotted rectangular boxes. (A) First-order models. (B) Second-order models.
3.2 Control
As an example, the C1 and C2 test results of a single participant (P01) are first shown (Figure 3). In this illustrative data set, C2 was found to be more accurate (lower RMSEC) and more dynamic (higher P∇u) than C1: the respective RMSEC values were 2.68 bpm vs. 2.91 bpm (C2 vs. C1), and the average control signal power (P∇u) values were 9.53 W2 vs. 5.30 W2 (C2 vs. C1).
From the 26 pairs of feedback control tests, 17 C2 controllers (65%) were more accurate than C1 while 22 C2 controllers (85%) were more dynamic than C1. In the overall statistical analysis, there was moderate evidence that C2 was more accurate than C1 and strong evidence that C2 was more dynamic than C1:
• RMSEC was 2.62 bpm ± 0.45 bpm (mean ± standard deviation) vs. 2.77 bpm ± 0.61 bpm (C2 vs. C1) with p = 0.052 (Table 2, Figure 7A),
• Average control signal power, P∇u, was 9.61 W2 ± 5.82 W2 vs. 7.56 W2 ± 4.26 W2 (C2 vs. C1) with p = 2.3 × 10⁻⁵ (Table 2, Figure 7B).
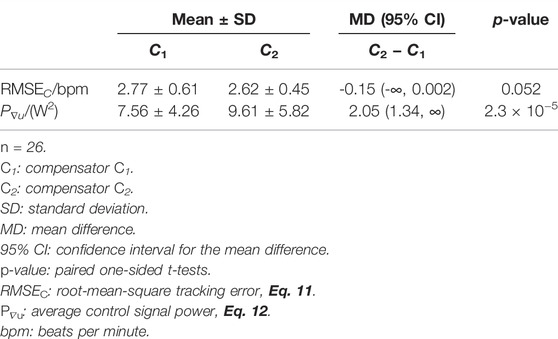
TABLE 2. Overall outcomes for C1 and C2 from the feedback control test series and comparison of outcome differences (see also Figure 7).
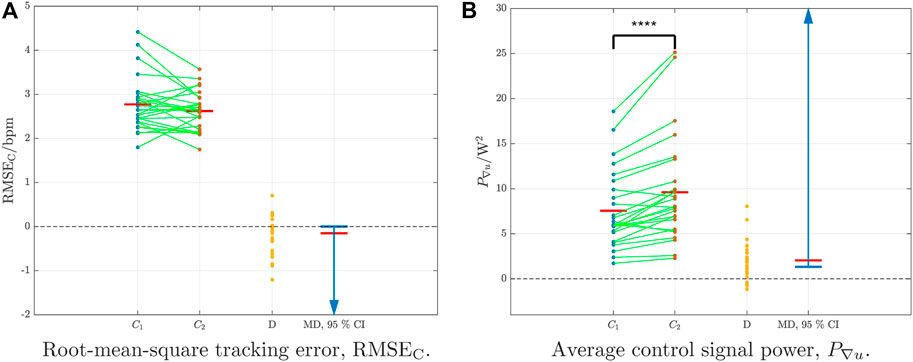
FIGURE 7. Feedback control outcomes: dispersion of samples for RMSEC and P∇u from the control test series, with 26 sample pairs. In each figure, blue and red dots are the individual outcomes with compensators C1 and C2, respectively, green lines connect sample pairs for each participant, and red bars mark the sample means (given numerically in Table 2). D denotes the difference between paired samples (C2 - C1) and MD (red horizontal bar) is the mean difference. The 95% confidence intervals (CIs) are marked as blue arrows. For RMSEC, the value 0 is inside the 95% CI, indicating that the mean value for C2 is not significantly lower than for C1 (p > 0.05). For P∇u, the value 0 is outwith the 95% CI, indicating a significantly higher value for C2 vs. C1 (p < 0.05, Table 2; **** denotes p < 0.0001). (A) Root-mean-square tracking error, RMSEC. (B) Average control signal power, P∇u.
4 Discussion
The aim of this work was to compare the fidelity of first- and second-order models of heart rate response during cycle-ergometer exercise, and to compare the accuracy and dynamics of feedback controllers that were designed using the two model structures. This aim was motivated by observations from the physiological literature that heart rate response is dominated by two components with distinct time constants—a fast Phase I response, and a dominant but slower Phase II response—in concord with the underlying mechanisms thought to be at work in neural regulation of heart rate. These considerations led to the hypotheses of this study, namely that second-order models of open-loop heart-rate response would give better fidelity than first-order models, and that feedback compensators based on second-order models would give more accurate and more dynamic control of heart rate.
It was found that second-order models gave substantially and significantly better representation of the dynamic heart rate response to changes in exercise work rate, with mean fit values of 51.9% and 47.9% (p < 0.0001), respectively, and mean root-mean-square model error of 2.93 bpm vs. 3.21 bpm (p < 0.0001). This finding supports the concept of two principal dynamic modes contributing to the overall heart rate response. The mean time constants for the second-order models, viz. τ22 = 20.4 s and τ21 = 35.7 s, can be interpreted physiologically as the faster Phase I and slower Phase II components, respectively.
In the feedback control comparison, there was modest improvement in tracking accuracy with controllers based on second-order models, where mean root-mean-square tracking errors were 2.62 bpm (second order) and 2.77 bpm (first order), with p = 0.052 being close to the statistical significance threshold. But controllers based on second-order models were found to be substantially and significantly more dynamic: mean values of average control signal power were 9.61 W2 and 7.56 W2, C2 vs. C1, and p < 0.0001. The finding that improvements in closed-loop control accuracy were less clear than open-loop model fidelity is likely due to the basic characteristic of feedback systems that plant uncertainty is reduced, at least in frequency ranges where the closed-loop sensitivity function takes on values less than one (Åström and Murray, 2008); thus, a given difference in model fidelity will effectively be “attenuated” when the respective models are used for feedback design, thus making it more difficult to experimentally detect improvements in control accuracy.
5 Conclusion
The results of this study confirm the hypotheses that second-order models of heart-rate dynamics give better fidelity than first-order models, and that feedback compensator designs that use the additional dynamic mode give more accurate and more dynamic closed-loop control performance.
Data Availability Statement
The raw data supporting the conclusions of this article will be made available by the authors, without undue reservation.
Ethics Statement
The studies involving human participants were reviewed and approved by Ethics Committee of the Swiss Canton of Bern. The patients/participants provided their written informed consent to participate in this study.
Author Contributions
KH and HW designed the study. AS did the data acquisition. AS, KH and HW contributed to the analysis and interpretation of the data. AS and KH wrote the manuscript and HW revised it critically for important intellectual content. All authors read and approved the final manuscript.
Funding
This work was supported by the Swiss National Science Foundation (Grant Ref. 320030-185351).
Conflict of Interest
The authors declare that the research was conducted in the absence of any commercial or financial relationships that could be construed as a potential conflict of interest.
Publisher’s Note
All claims expressed in this article are solely those of the authors and do not necessarily represent those of their affiliated organizations, or those of the publisher, the editors and the reviewers. Any product that may be evaluated in this article, or claim that may be made by its manufacturer, is not guaranteed or endorsed by the publisher.
References
Argha, A., Su, S. W., and Celler, B. G. (2017). Heart Rate Regulation during Cycle-Ergometer Exercise via Event-Driven Biofeedback. Med. Biol. Eng. Comput. 55 (3), 483–492. doi:10.1007/s11517-016-1530-9
Argha, A., Ye, L., Su, S. W., Nguyen, H., and Celler, B. G. (2016). “Heart Rate Regulation during Cycle-Ergometer Exercise Using Damped Parameter Estimation Method,” in Proceeding of the 38th Annual International Conference of the IEEE Engineering in Medicine and Biology Society (EMBC), Orlando, FL, USA, Aug. 2016 (IEEE), 2676–2679. doi:10.1109/EMBC.2016.7591281
Asheghan, M. M., and Míguez, J. (2016). Stability Analysis and Robust Control of Heart Beat Rate during Treadmill Exercise. Automatica 63, 311–320. doi:10.1016/j.automatica.2015.10.027
Åström, K. J., and Murray, R. M. (2008). Feedback Systems. Princeton (USA) and Oxford (UK): Princeton University Press.
Bearden, S. E., and Moffat, R. J. (2001). VO2 and Heart Rate Kinetics in Cycling: Transitions from an Elevated Baseline. J. Appl. Physiol. 90 (6), 2081–2087. doi:10.1152/jappl.2001.90.6.2081
Cheng, T. M., Savkin, A. V., Celler, B. G., Su, S. W., and Wang, L. (2008). Nonlinear Modeling and Control of Human Heart Rate Response during Exercise with Various Work Load Intensities. IEEE Trans. Biomed. Eng. 55 (11), 2499–2508. doi:10.1109/tbme.2008.2001131
Hunt, K. J., and Fankhauser, S. E. (2016). Heart Rate Control during Treadmill Exercise Using Input-Sensitivity Shaping for Disturbance Rejection of Very-Low-Frequency Heart Rate Variability. Biomed. Signal Process. Control 30, 31–42. doi:10.1016/j.bspc.2016.06.005
Hunt, K. J., and Hurni, C. (2019). Robust Control of Heart Rate for Cycle Ergometer Exercise. Med. Biol. Eng. Comput. 57 (11), 2471–2482. doi:10.1007/s11517-019-02034-6
Hunt, K. J., and Maurer, R. R. (2016). Comparison of Linear and Nonlinear Feedback Control of Heart Rate for Treadmill Running. Syst. Sci. Control Eng. 4 (1), 87–98. doi:10.1080/21642583.2016.1179139
Hunt, K. J., Zahnd, A., and Grunder, R. (2019). A Unified Heart Rate Control Approach for Cycle Ergometer and Treadmill Exercise. Biomed. Signal Process. Control 54. doi:10.1016/j.bspc.2019.101601
Hunt, K. J., Grunder, R., and Zahnd, A. (2019). Identification and Comparison of Heart-Rate Dynamics during Cycle Ergometer and Treadmill Exercise. PloS ONE 14 (8), e0220826. doi:10.1371/journal.pone.0220826
Kawada, T., Ikeda, Y., Takaki, H., Sugimachi, M., Kawaguchi, O., Shishido, T., et al. (1999). Development of a Servo-Controller of Heart Rate Using a Cycle Ergometer. Heart Vessels 14 (4), 177–184. doi:10.1007/bf02482304
Mazenc, F., Malisoff, M., and De Querioz, M. (2011). Tracking Control and Robustness Analysis for a Nonlinear Model of Human Heart Rate during Exercise. Automatica 47 (5), 968–974. doi:10.1016/j.automatica.2011.01.079
Paradiso, M., Pietrosanti, S., Scalzi, S., Tomei, P., and Verrelli, C. M. (2013). Experimental Heart Rate Regulation in Cycle-Ergometer Exercises. IEEE Trans. Biomed. Eng. 60 (1), 135–139. doi:10.1109/tbme.2012.2225061
Riebe, D., Ehrman, J. K., Liguori, G., and Magal, M. (Editors) (2018). ACSM’s Guidelines for Exercise Testing and Prescription. 10th ed. (Philadelphia, USA: Wolters Kluwer).
Su, S. W., Chen, W., Liu, D., Fang, Y., Kuang, W., Yu, X., et al. (2010). Dynamic Modelling of Heart Rate Response under Different Exercise Intensity. Open Med. Inf. J. 4, 81–85. doi:10.2174/1874431101004020081
Verrelli, C. M., Tomei, P., Caminiti, G., Iellamo, F., and Volterrani, M. (2021). Nonlinear Heart Rate Control in Treadmill/cycle-Ergometer Exercises under the Instability Constraint. Automatica 127, 109492. doi:10.1016/j.automatica.2021.109492
Wang, H., and Hunt, K. J. (2021). Identification of Heart Rate Dynamics during Treadmill Exercise: Comparison of First- and Second-Order Models. Biomed. Eng. OnLine 20 (37), 1–10. doi:10.1186/s12938-021-00875-7
Wang, H., and Hunt, K. J. (2021). Heart Rate Control Using First- and Second-Order Models during Treadmill Exercise. Syst. Sci. Control Eng. 9 (1), 651–662. doi:10.1080/21642583.2021.1976304
Wasserman, K., Hansen, J. E., Sue, D. Y., Stringer, W. W., Sietsema, K. E., Sun, X.-G., et al. (2011). Principles of Exercise Testing and Interpretation. 5th ed. Philadelphia, USA: Lippincott, Williams and Wilkins.
Keywords: heart rate dynamics, system identification, feedback control, cycle ergometer, exercise
Citation: Spörri AH, Wang H and Hunt KJ (2022) Heart Rate Dynamics Identification and Control in Cycle Ergometer Exercise: Comparison of First- and Second-Order Performance. Front. Control. Eng. 3:894180. doi: 10.3389/fcteg.2022.894180
Received: 11 March 2022; Accepted: 15 April 2022;
Published: 05 May 2022.
Edited by:
Takao Sato, University of Hyogo, JapanReviewed by:
Thomas Beltrame, University of Waterloo, CanadaYoshihito Sawaguchi, National Institute of Technology, Kisarazu College, Japan
Copyright © 2022 Spörri, Wang and Hunt. This is an open-access article distributed under the terms of the Creative Commons Attribution License (CC BY). The use, distribution or reproduction in other forums is permitted, provided the original author(s) and the copyright owner(s) are credited and that the original publication in this journal is cited, in accordance with accepted academic practice. No use, distribution or reproduction is permitted which does not comply with these terms.
*Correspondence: Kenneth J. Hunt, kenneth.hunt@bfh.ch