 Hanjie Wang
 Diana Guimaraes2
 Kenneth J. Hunt
- 1Division of Mechatronics and Systems Engineering, rehaLab—The Laboratory for Rehabilitation Engineering, Institute for Human Centred Engineering HuCE, School of Engineering and Computer Science, Bern University of Applied Sciences, Biel, Switzerland
- 2Department of Electrical Engineering, Faculdade de Engenharia, Universidade do Porto, Porto, Portugal
- 3Gerontechnology and Rehabilitation Research Group, ARTORG Center for Biomedical Engineering Research, University of Bern, Bern, Switzerland
Introduction: A self-paced (SP) heart rate (HR) control system proposed in a previous study was found to be feasible for healthy participants. The aims of this work were to investigate whether the SP HR control system is feasible to achieve accurate HR control in a participant with gait impairments, and to assess its interaction with an existing motor-driven body weight support (BWS) system.
Methods: One participant with cerebral palsy was recruited in this case study. Three preliminary tests were completed to determine the appropriate mean value and amplitude of the target heart rate curve, and to identify a customised heart rate response model. Two series of formal self-paced heart rate control tests were then conducted to investigate the influence of different heart rate compensators and the presence of the BWS system.
Results: The customised heart rate controller achieved improved accuracy in heart rate control and reduced oscillation in the treadmill target speed: the root-mean-square heart rate tracking error (RMSE) was 2.38 beats per minute (bpm) vs. 3.91 bpm (customised controller vs. nominal controller), and the average power of changes in the treadmill target speed was 0.4 × 10⁻⁴ m2/s2 vs. 8.4 × 10⁻⁴ m2/s2. The BWS system resulted in improved HR tracking accuracy: RMSE on heart rate tracking was 3.02 bpm vs. 3.50 bpm (with BWS vs. without BWS). The BWS system had no influence on the automatic position control accuracy: RMSE on distance tracking was 0.0159 m vs. 0.0164 m.
Conclusion: After customising the heart rate compensator, the self-paced heart rate control system is feasible to achieve accurate heart rate control in an individual with gait impairments, and it can correctly interact with the BWS system.
1 Introduction
Interval-intensity training shows benefits in the rehabilitation of patients with various neurological impairments (Luo et al., 2020; Mah et al., 2022; Plawecki et al., 2024). As heart rate (HR) is commonly used to set exercise intensity (Liguori et al., 2022), this has inspired research into HR control systems. In conventional HR control systems using treadmills (TM) (Verrelli et al., 2021; Wang et al., 2021; Abbasi et al., 2022; Wang and Hunt, 2023a), the TM speed is solely determined by the controller. However, this constraint increases safety risks for neurologically impaired patients and may cause unwanted interruptions during testing.
To handle this drawback, our previous study (Wang and Hunt, 2023b) designed a self-paced (SP) HR control system consisting of a distance control loop and a HR control loop. The distance controller adjusts the speed of the TM to maintain the participant’s relative position on the TM. Simultaneously, the HR controller calculates the reference TM speed to ensure that the measured HR of the participant follows a target curve. Tests involving four healthy participants validated the feasibility, safety, and comparable performance of this novel SP system in achieving HR control when compared to a conventional, machine-determined HR control system. These findings are consistent with other studies in healthy participants, which demonstrate that exercise on the SP TM exhibits similar kinetic and kinematic characteristics (Sloot et al., 2014; Plotnik et al., 2015; Wiens et al., 2019), muscle activity (Ibala et al., 2019), and energy cost (Theunissen et al., 2022) compared to a fixed-speed TM.
Applying the SP HR control system to neurologically impaired individuals requires further investigation in two aspects. Firstly, the HR response model used for the HR compensator design in previous HR control studies (Wang and Hunt, 2021a; Wang and Hunt, 2023a; Wang and Hunt, 2023b) was identified from healthy participants engaged in moderate to vigorous activities, such as running (Wang and Hunt, 2021b). Whereas, for neurologically impaired individuals, exercises are typically performed at lower intensity, often at a “comfortable speed,” such as walking. These differences in exercise modalities and intensities can cause substantial modelling errors, even among healthy participants (Cheng et al., 2008). Furthermore, individuals with gait impairments may face additional cardiovascular and muscular demands to maintain balance and to compensate for the less efficient gait patterns during exercise. Consequently, the HR response model for those with gait impairments may contain considerable differences compared to the model used in previous studies involving healthy participants, potentially affecting the HR control performance. Given that precise HR control is the primary objective of the feedback system, the first aim of this study was to investigate the feasibility of the SP HR control system in achieving accurate HR control in individuals with gait impairments.
Secondly, for people with gait impairments, the body weight support (BWS) system plays an essential role in evaluating and enhancing their walking abilities (Visintin et al., 1998; Combs et al., 2012; Morawietz and Moffat, 2013; Meyns et al., 2014). Studies have shown that applying 20%–40% BWS and low-speed range exercise (Meyns et al., 2014; Kraft et al., 2023) can provide greater rehabilitation benefits. Recent studies have proposed various designs for BWS systems, including those driven by motors or springs and connected to participants through an overhead harness (Visintin et al., 1998; Sousa et al., 2009; MacLean and Ferris, 2020), those implemented through antigravity treadmills (Liebenberg et al., 2011; Vincent et al., 2022), or realized through a wearable exoskeleton (Ikeuchi et al., 2009). However, it is worth noting that the use of BWS systems can impact participants’ movement. For instance, the harness may limit the hip movement, especially under high support conditions. Additionally, an overhead BWS system could affect lateral and horizontal movements on the TM (Dragunas and Gordon, 2016), or even worsen the walking performance (Sousa et al., 2009). Thus, the second aim of this study was to examine the interaction between the SP HR control system and a self-developed motor-driven BWS system.
In summary, the present study aimed to: investigate whether a previously designed SP HR control system (Wang and Hunt, 2023b) is feasible to achieve accurate HR control in a participant with gait impairments, and to assess its interaction with an existing motor-driven BWS system.
2 Methods
2.1 Controller design
The SP HR control system employed in this study aligns with previous work (Wang and Hunt, 2023b). As illustrated in Figure 1, this HR control system comprises two feedback control loops. In the heart rate feedback loop, the HR compensator, Ch(s), calculates the reference runner speed, denoted
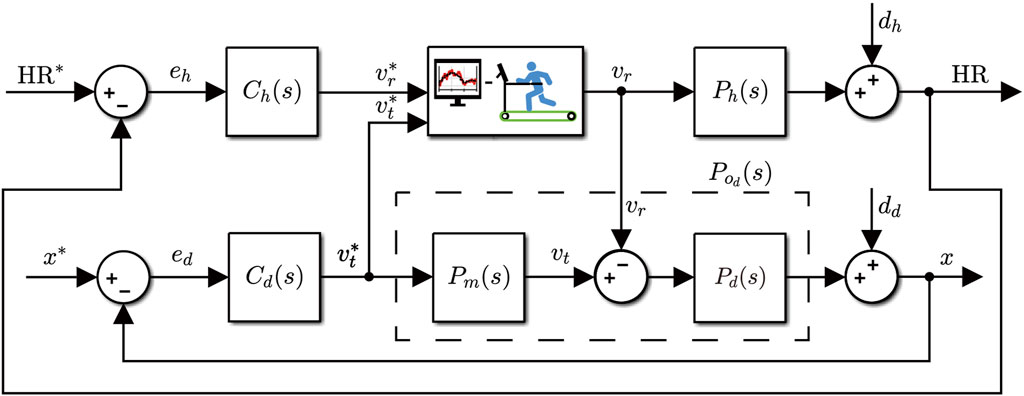
Figure 1. Structure of the self-paced heart rate control system.
The actual running/walking speed of the participant relative to the treadmill track, denoted vr, is determined by the participants themselves. The distance feedback loop ensures zero steady-state error, viz.
Concordant with previous work (Wang and Hunt, 2023b), the derivation of Ch(s) and Cd(s) in this study also applies an input-sensitivity-shaping method. The input sensitivity function, Eq. (1), represents the transfer function from the reference signal and disturbance to the controlled variable:
where C(s) is a generic form of Ch(s) and Cd(s), meanwhile Po(s) stands for Ph(s) and Pd(s).
2.1.1 Heart rate controller design
The HR response model, Ph(s), is described by a first-order transfer function consisting of the gain, k, and the time constant, τ, as follows
The HR compensator, Ch(s), is designed to constrain its input sensitivity function, denoted
As detailed in the previous study (Hunt and Fankhauser, 2016), the resulting Ch(s) can be expressed as
The parameters of the nominal HR response model, denoted Phn(s), were averaged from 11 healthy participants, as detailed in the previous study (Wang and Hunt, 2021b). Specifically, k = 28.57 bpm/(m/s) and τ = 70.56 s. Substituting these values into Eq. 2, the transfer function of Phn(s) is
By employing a bandwidth of 0.01 Hz for the input sensitivity function, i.e., p = 0.0628 rad/s, and substituting parameters of the nominal HR response model into Eq. 4, the corresponding nominal HR compensator is then, Eq. (6),
2.1.2 Distance controller design
The nominal plant of the distance feedback loop is an integrating part, viz.
where g1, g0 and h0 are coefficients to be determined, the response of corresponding input sensitivity function can be optimized to resemble the response of a target bandpass filter. Applying the least-squares method, the optimized coefficients can be solved as: g1 = 11.84, g0 = 3.14 and h0 = 11.70. The transfer function of Cd(s), Eq. (8), is then
2.2 Experimental design
All tests were carried out with a participant with cerebral palsy (CP). The participant is female, 33 years old, weighs 49 kg and has a height of 164 cm. The participant can walk independently with the assistance of handrails on the treadmill (Figure 2A).
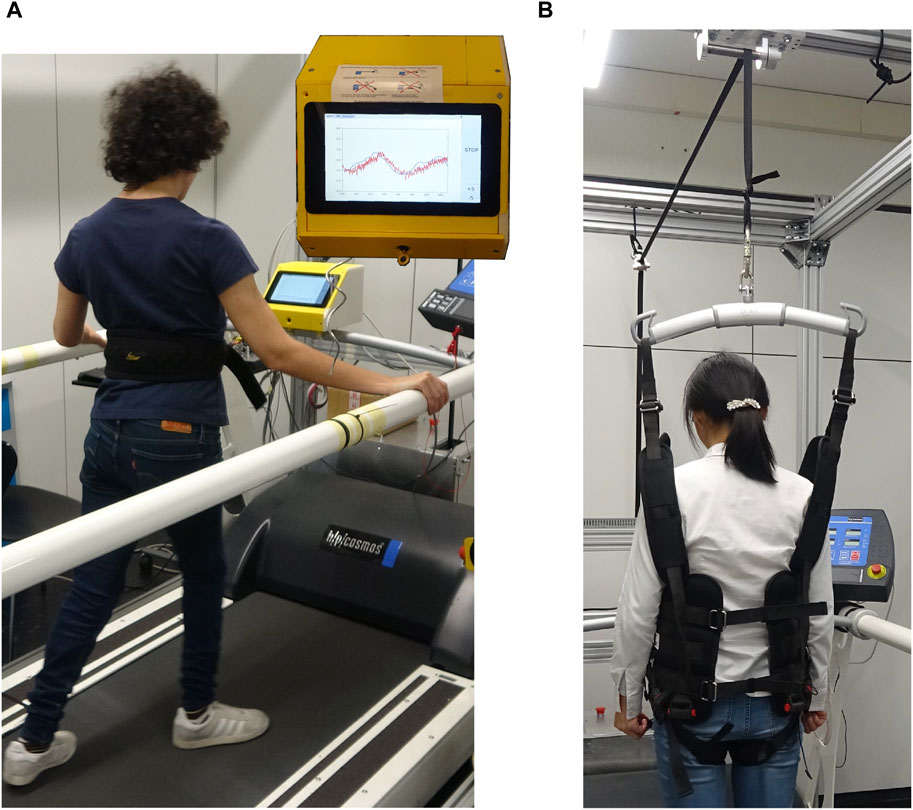
Figure 2. Device setup of this study. (A) The participant walks on the treadmill guided by speeds shown on the screen of the control unit. Inset: the screen showing the control unit. (B) The BWS system applied in this study, showing the harness worn by the participant when BWS was employed.
To ensure the establishment of an appropriate target intensity curve, provide fundamental information for our participant, and address safety concerns, we conducted three preliminary tests before the formal evaluation: the intensity evaluation test, the plant model identification test, and the amplitude evaluation test. The participant was familiarised with the treadmill walking routine prior to the preliminary tests.
2.2.1 Intensity evaluation test
The first preliminary test aimed to assess the appropriate target HR value for all subsequent tests. To achieve this, the intensity evaluation test was implemented by the SP HR control system with nominal HR compensator Chn. The target HR was initially set to 130 bpm, then manually adjusted during the test until our participant could maintain the corresponding intensity relatively easily.
2.2.2 Plant model identification test
As introduced previously in Section 1, differences in exercise modality and energy consumption between neurologically impaired participants and healthy participants may cause substantial differences in HR response models. To investigate and mitigate the impact of these modelling errors, we conducted a model identification test to estimate the customised HR response model for our participant, depicted Phc. Subsequently, the corresponding transfer function of the customised HR controller, denoted Chc, could be derived.
The model identification test consisted of three phases: a 1-minute warm up, a 1-minute rest and a 15-minute formal measurement phase (Figure 3). Based on the results of the intensity evaluation test, the treadmill speed curve applied a square-wave signal with a 6-minute period and a 0.05 m/s amplitude. The data recording rate was set at 0.2 Hz, and measurements from 160 s to 900 s were selected as the estimation dataset for calculating the model parameters. The estimation dataset was then detrended and modelled using a least-squares optimization tool (“procest” function from the Matlab System Identification Toolbox; The Mathworks, Inc., USA) using the first-order structure defined in Eq. 2. Further details about this model identification method can be found in (Wang and Hunt, 2021b).
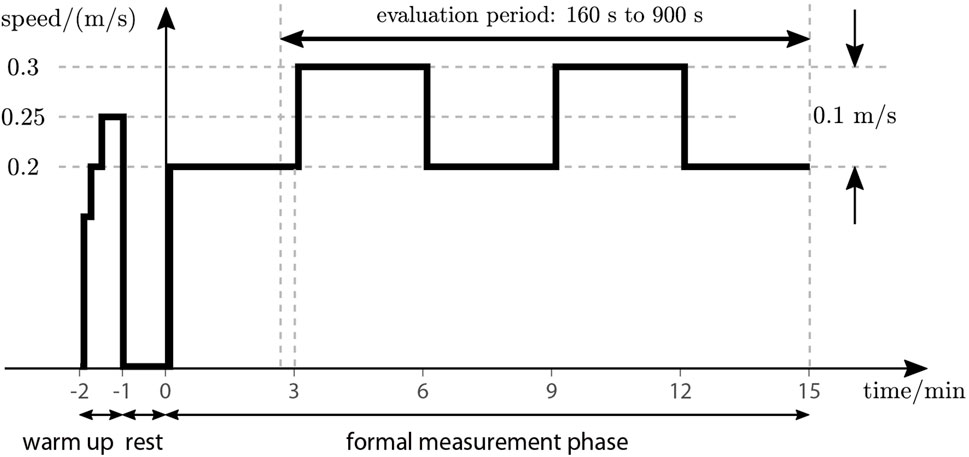
Figure 3. Test phases and treadmill speed for identification test. The evaluation period is marked by the double arrow.
2.2.3 Amplitude evaluation test
To design an appropriate square wave signal as the target HR curve for the formal tests, the mean value and the amplitude needed to be specified. Since the mean value could be determined by the intensity evaluation test, an amplitude evaluation test was carried out to determine the optimal amplitude. This test was performed using the SP HR control system with the customised HR controller, Chc, as achieved in the previous model identification test. The target HR curve applied a square wave signal with a mean HR of 120 bpm and an initial amplitude of 10 bpm, which could be manually adjusted during the test.
2.2.4 Formal tests
The formal tests can be divided into two test series:
1. The first series focused on investigating the influence of modelling errors on control performance. It involved an HR reference with a constant value (Figure 4A) and consisted of two tests. The first test applied the nominal HR controller, Chn, while the second test utilized the customised HR controller, Chc.
2. The second series aimed to test the control accuracy of the SP HR control system and evaluate its interaction with a self-developed, motor-driven BWS system. In this series, both tests employed the customised HR controller, Chc, and a square wave target HR with a 6-min period and 5 bpm amplitude (Figure 4B). The first test incorporated 13.01 kg BWS (26.6% of total body mass), while in the second test, the BWS system was removed.
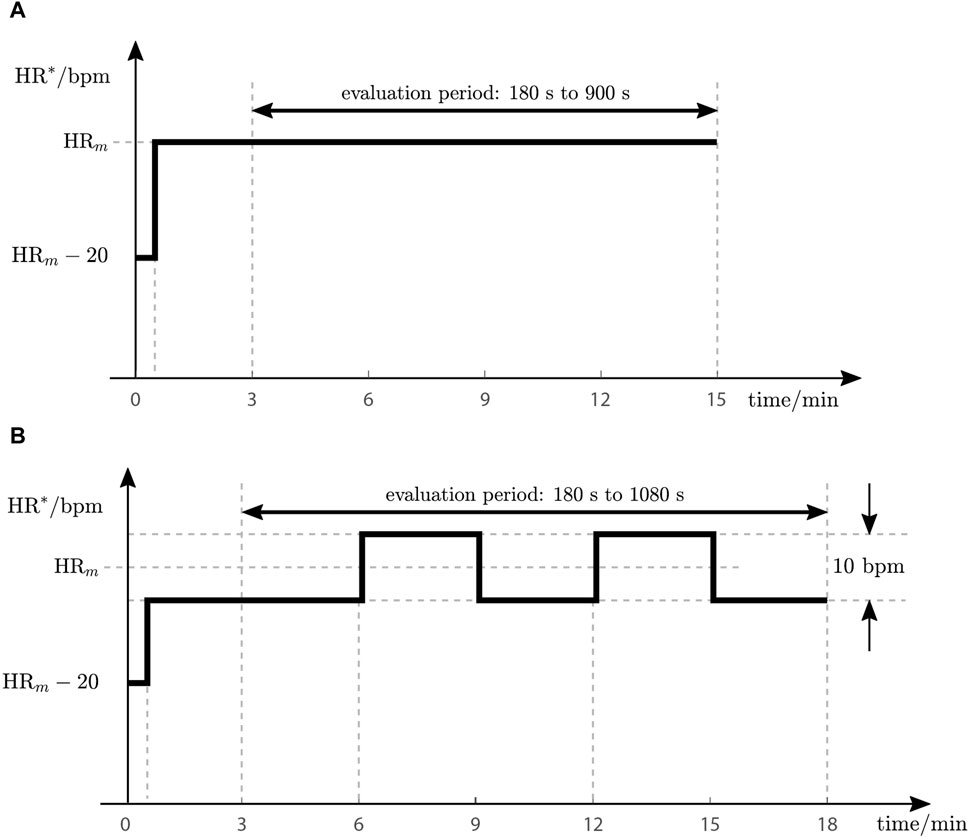
Figure 4. Reference heart rate profiles (HR*) for two formal test series. (A) Test protocol for the first test series. (B) Test protocol for the second test series.
The mean value, depicted HRm, and the amplitude of the target HR signal (Figure 4), were determined by comprehensively considering the results of the two preliminary evaluation tests and feedback from the participant. The reduction of HR* in the first 30 s for both series was to soften the speed impact on our participant.
It should be noted that the two series applied different durations and evaluation periods. For the first series, measurements from 180 s to 900 s (3 min–15 min) were used for outcome evaluation. Meanwhile, for the second series, the evaluation period was extended to 180 s–1,080 s (3 min–18 min).
2.2.5 Equipment
All tests were carried out using a treadmill (model Venus, h/p/cosmos Sports & Medical GmbH, Germany). The control algorithms were implemented in an embedded control unit mounted at the front of the treadmill. Powered by a Raspberry Pi 4 (Raspberry Pi Foundation, England), the control unit has access to a heart rate sensor (H10, Polar Electro Oy, Finland) wirelessly via Bluetooth, and features a built-in wire-draw encoder (Ecoline BCG08-L1KM03PP, Sick AG, Germany) for accurate distance measurement. The analogue output of the encoder was sampled at 10 Hz, identical with the control frequency of the distance compensator Cd. The sample rate of HR measurement was 1 Hz and the control interval of the HR compensator Ch was 5 s. As a result, the HR measurements were averaged for every 5 adjacent readings before being forwarded to the HR compensator. The BWS system applied in this study (Figure 2B) was a self-designed motor-driven system that incorporated an embedded force feedback control system implemented using an industrial PC (C6015-0010, Beckhoff, Germany). During tests in which BWS was used, the participant wore a body harness as depicted in Figure 2B.
2.2.6 Outcome measures
Upon completion of the model identification test, two outcome measures were used to evaluate the goodness-of-fit of the resulting model: the normalised root-mean-square error (denoted fit, Eq. 9), and the root-mean-square error (RMSE) between the measured HR and the simulated HR response (denoted RMSEI, Eq. 10). These measures are given by:
Here, HRsim represents the simulated HR response obtained using the estimated model and the input signal. HR denotes the measured heart rate from the estimation dataset, with mean value denoted
To investigate the tracking accuracy of the HR compensators and quantitatively evaluate the dynamic of their output, two outcome measures were defined: the RMSE between the HR measurement and the nominal HR response (denoted RMSEh, Eq. 11), and the average power of changes in the target treadmill speed (denoted
where HRnom represents the nominal overall closed-loop HR response, HR is the measured heart rate during the evaluation period and
We quantified the participant’s horizontal movement, viz. the distance, by the RMSE between the measured distance and the reference distance, given by Eq. (13) as
where x* is the reference distance and x represents the measured distance during the evaluation period. As the sample rate of the distance is 10 Hz, N = 7180 for the first series and N = 8971 for the second series.
3 Results
3.1 Intensity evaluation test
As illustrated in Figure 5, the reference HR was automatically set to the initial value of 130 bpm after 35 s, and the reference treadmill speed reached the upper limit of 0.6 m/s. At 165 s, the target HR was manually reduced to 125 bpm, and the reference speed also dropped below the upper limit, but it still remained too high for our participant to follow. After 460 s, the target HR was further reduced to 120 bpm, resulting in a suitable speed for our participant to follow. In this test with the nominal HR controller, Ch, we used the measurements after 560 s for outcome evaluation, and achieved the following results: RMSEh was 3.73 bpm,
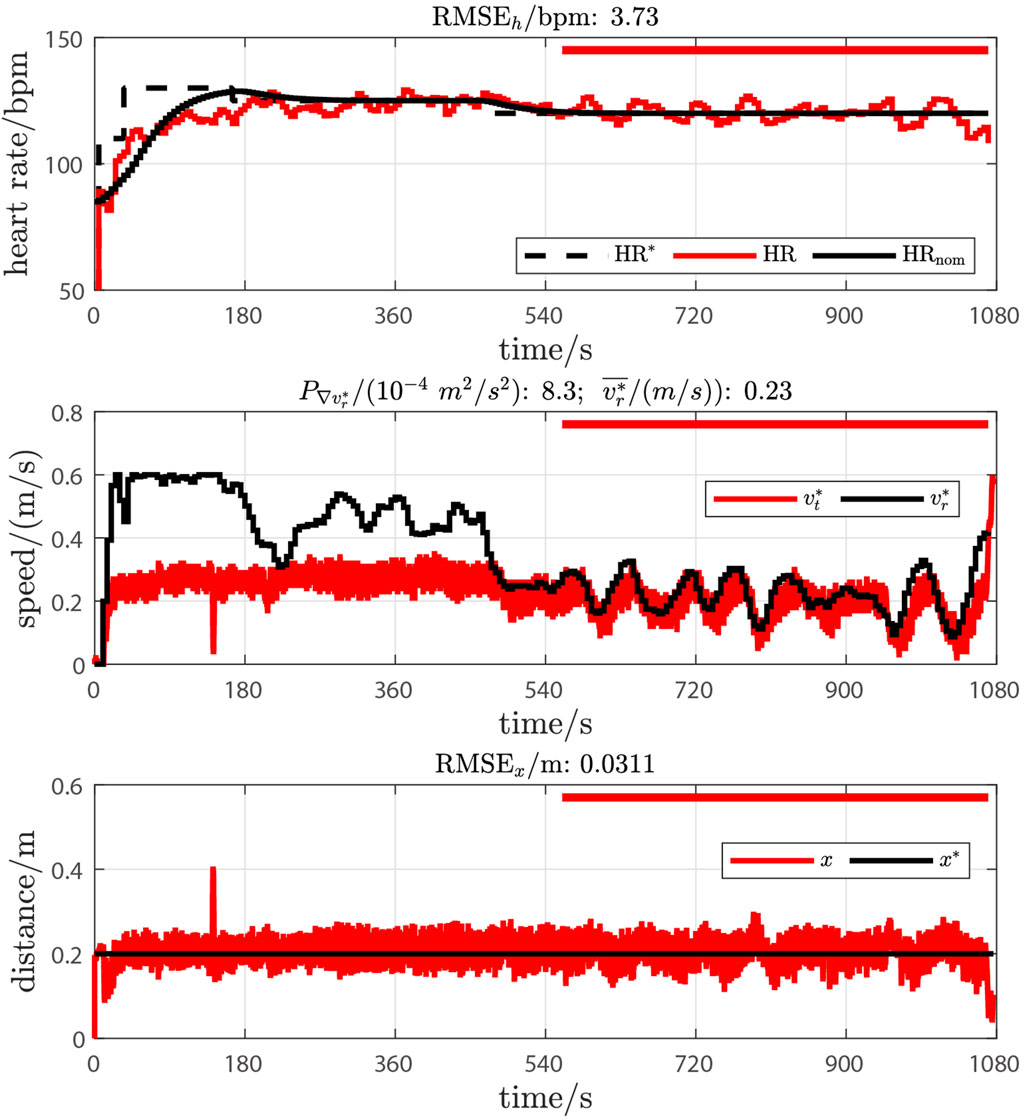
Figure 5. Results of intensity evaluation test. The upper plot shows the target heart rate (HR*, black dashed line), the measured heart rate (HR, red line) and the nominal heart rate response (HRnom, black line). The middle plot depicts the reference speed for the participant (
3.2 Plant model identification test
The original measurements and the model validation results of the model identification test are illustrated in Figure 6. The resulting model achieved a fit of 31.05% and an RMSEI of 3.25 bpm. Compared to the nominal HR response model from healthy participants (Eq. 5), the k was 79.74 bpm/(m/s) vs. 28.57 bpm/(m/s) (179.1% higher, customised vs. nominal), and τ was 35.10 s vs. 70.56 s (50.3% lower).
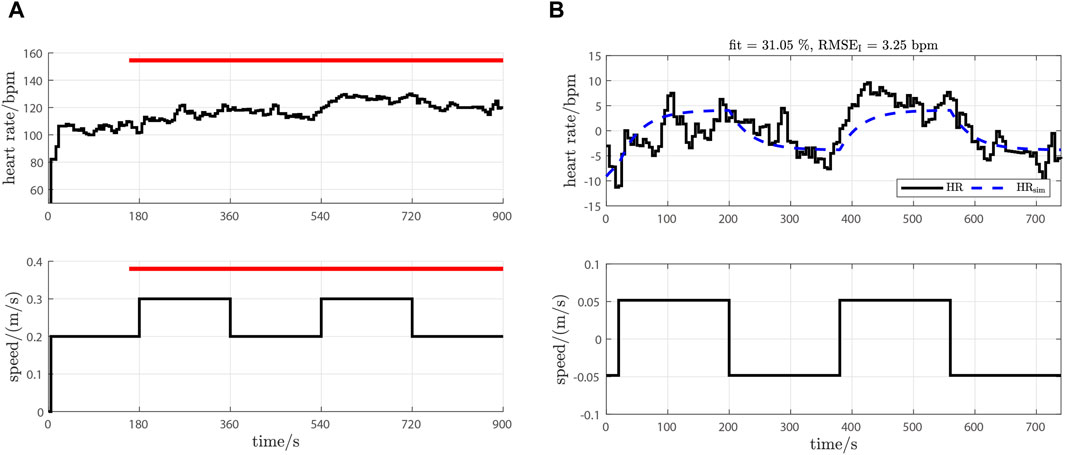
Figure 6. Original measurements and model validation result of model identification test. (A) Original measurements: upper plot is the HR measurement; lower plot is the speed of the treadmill. The evaluation period is depicted by the red horizontal bars. (B) Model validation result: upper plot is the HR measurement after detrending (HR, solid black line) and the simulated HR response of the estimated model (HRsim, blue dashed line); the lower plot is the treadmill speed after mean removal.
Substituting customised model parameters into the HR response model defined in Eq. 2 and the HR controller defined in Eq. 4, and using p = 0.0628, the transfer functions of Phc and Chc in Eqns. (14) and (15) were then
3.3 Amplitude evaluation test
As illustrated in Figure 7, the initial target HR was a square wave signal with a middle value of 120 bpm and an amplitude of 10 bpm. The period of the square wave signal was 6 min, viz. the target HR signal had four 10 bpm changes occurring at 360 s, 540 s, 720 s and 900 s.
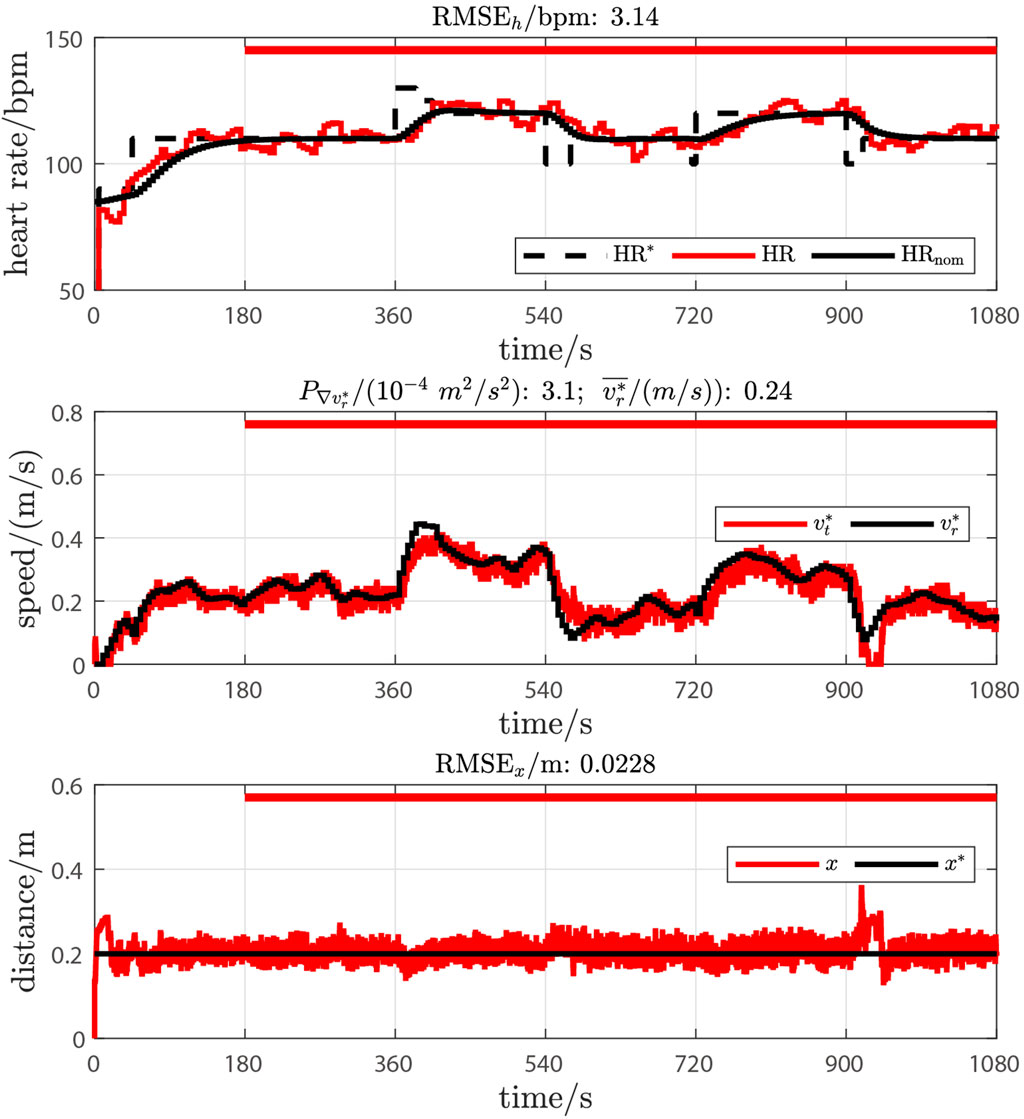
Figure 7. Results of amplitude evaluation test. The definition of labels and legends are the same as in Figure 5.
As observed in the speed measurements shown in the middle plot of Figure 7, these four changes led to noticeable speed differences between the reference and set speeds. These differences were attributed to the limited adaptability of our participant to follow speed changes. Consequently, the amplitude of the target HR was manually reduced to 5 bpm at 405 s, 570 s, 715 s and 920 s, resulting in reduced speed differences. Therefore, it can be concluded that a target square wave signal with a 5 bpm amplitude is more suitable for our participant.
3.4 Formal tests
Based on the results of the intensity evaluation test and feedback from the participant, the mean value of the reference HR, denoted HRm, was set to 130 bpm for the first series. For the second series, to prevent a high level of the reference HR exceeding the participant’s tolerance, the mean value was reduced to 120 bpm. The original measurements and test results of the first test series are illustrated in Figure 8. The test conducted with the customised HR controller showed improved HR control accuracy: RMSEh was 2.38 bpm vs. 3.91 bpm (39.1% lower, customised vs. nominal). Additionally, the customised controller obviously reduced oscillations on the reference treadmill speed:
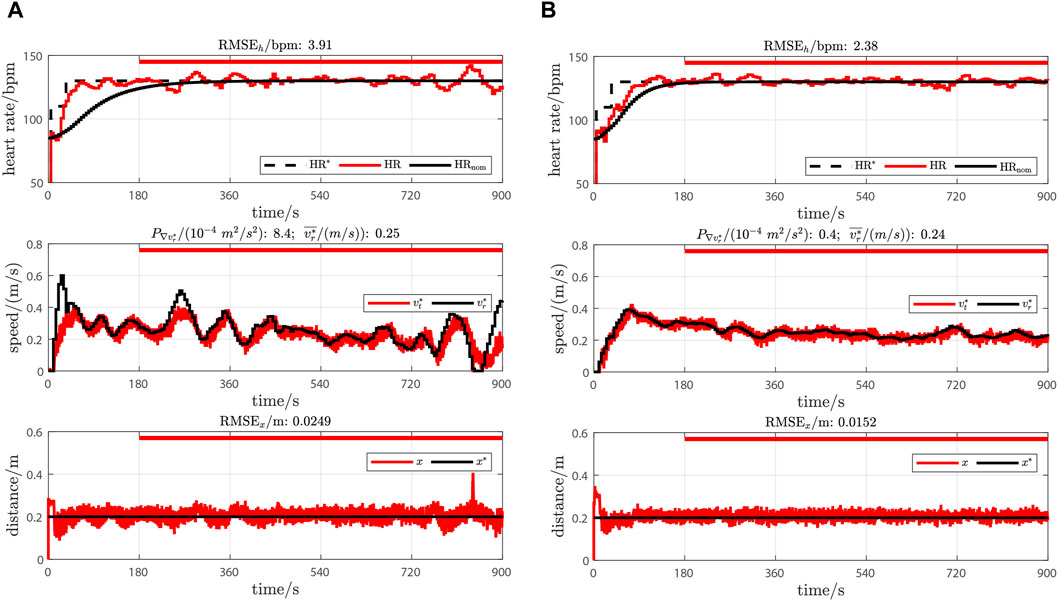
Figure 8. Test results in the first test series. (A) Test results with nominal HR controller Chn. (B) Test results with customised HR controller Chc. The definition of labels and legends are the same as in Figure 5.
In the second test series, as illustrated in Figure 9, the HR control test with the BWS system demonstrated slightly better HR control accuracy: RMSEh was 3.00 bpm vs. 3.51 bpm (14.5% lower, with BWS vs. without BWS). The test with the BWS system also achieved a higher mean reference treadmill speed with reduced oscillation:
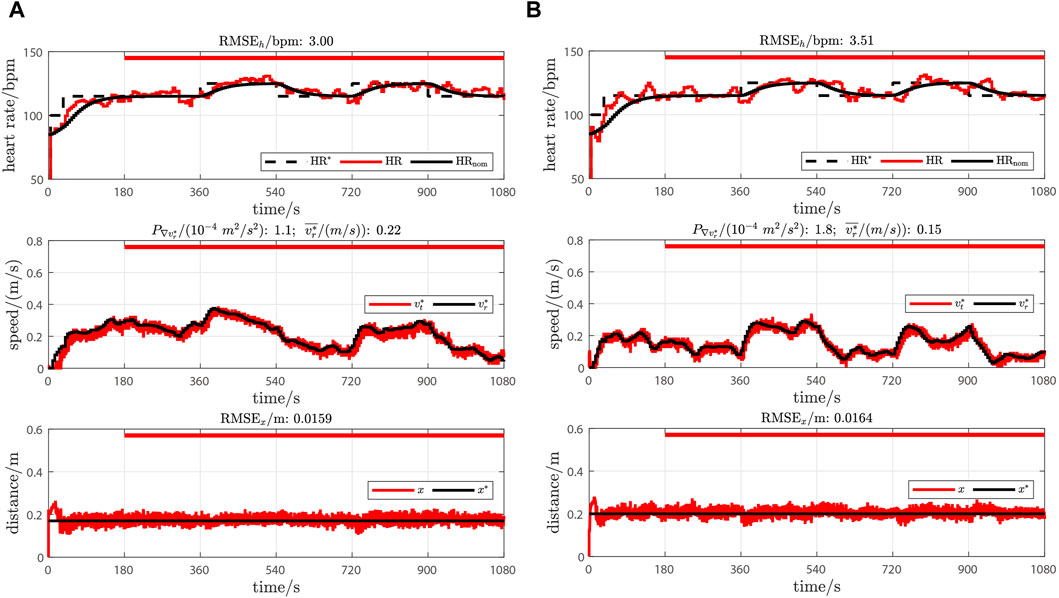
Figure 9. Test results in the second test series. (A) Test results with BWS system. (B) Test results without BWS system. The definition of labels and legends are the same as in Figure 5.
4 Discussion
The aims of present study were: to investigate whether a previously designed SP HR control system (Wang and Hunt, 2023b) is feasible to achieve accurate HR control in a participant with gait impairments, and to assess its interaction with an existing motor-driven BWS system.
Currently no measurements exist on the HR response of gait impaired participants. Therefore, our study had to start from a well-analysed HR response model from our previous study based on healthy participants, using the same model and controller structure but with the assumption that the parameters may be different. Ultimately, it is the vastly improved and highly accurate result achieved by only adapting the model and controller parameters that shows—empirically—that it is sufficient to only change the parameters, and not the structure, in this case.
The original HR and speed measurements taken during the intensity evaluation test (Figure 5), especially those taken before 460 s, highlighted a unique advantage of the SP HR control system: when the set target intensity, i.e., the target HR, exceeded the participant’s tolerance level, the participant could continue the test at their desired intensity, without interrupting the test. This feature greatly enhanced the efficiency and safety of the test procedure. It should be noted that, although the nominal HR controller in this evaluation test achieved impressive HR control accuracy when the intensity was appropriate and the response was at steady state (RMSEh was 3.73 bpm after 560 s), the test result still revealed periodic oscillations in the reference treadmill speed (
Therefore, subsequently, a model identification test was conducted to investigate differences in the HR response model between healthy and impaired participants, caused by different exercise modalities and physiological demands. The resulting model parameters from the gait-impaired participant showed a much higher (179.1% higher) gain and smaller (50.3% lower) time constant compared to the model from healthy participants. These findings aligned with our hypothesis that neurologically impaired individuals require additional and more dynamic cardiovascular and muscular activity than healthy participants.
The influence of modelling error on control accuracy was further demonstrated by comparing the results from the first series (Figure 8): applying the customised HR controller resulted in a substantial reduction in RMS HR tracking error (39.1% lower RMSEh), together with an obvious reduction in periodic oscillations in reference treadmill speed (95.2% lower
In the second test series (Figure 9), both tests achieved impressive HR control accuracy (RMSEh were 3.00 and 3.51 bpm), with the test using the BWS system demonstrating a better (14.5% lower RMSEh) RMS HR tracking error, when subjected to a square wave target HR signal. These HR tracking results are consistent with our previous SP HR control study (Wang and Hunt, 2023b) in healthy participants (RMSEh from 2.04 to 4.29 bpm) and other conventional, machine-determined, HR control studies involving healthy individuals (Kawada et al., 1999; Hunt and Fankhauser, 2016; Wang and Hunt, 2021a).
The test conducted with the BWS system also revealed an increased mean reference speed. These may be due to a reduction in the participant’s cardiovascular and muscular effort required to support the body weight and to generate supporting forces on the handrails, thus necessitating a higher treadmill speed to reach the target HR.
In the second test series, the RMSEx results were similar in both tests (3.0% difference). These results uncovered another advantage of the SP HR control system: the existence of the distance feedback loop resulted in a stable position for the participant on the treadmill. As a result, the influence of the BWS system on the horizontal movement of the participant can be effectively suppressed.
5 Conclusion
In conclusion, we found that, after customising the HR controller, the SP HR control strategy from the previous study (Wang and Hunt, 2023b) was feasible to achieve accurate HR control in a participant with gait impairments, and it can correctly interact with a motor-driven BWS system.
Data availability statement
The datasets presented in this study can be found in online repositories. The names of the repository/repositories and accession number(s) can be found below: https://doi.org/10.34914/olos:h3xhpqjxojba7fscdarkw5bjum.
Ethics statement
Ethical approval was not required for the studies involving humans because this feasibility study involved only a single case. Since the data are not generalisable, it does not fall under the Swiss Federal Act on Research Involving Human Beings, and did not require ethical approval. The studies were conducted in accordance with the local legislation and institutional requirements. The participants provided their written informed consent to participate in this study.
Author contributions
HW: Conceptualization, Data curation, Formal Analysis, Writing–original draft. DG: Conceptualization, Data curation, Writing–review and editing. TN: Conceptualization, Writing–review and editing. KH: Conceptualization, Formal Analysis, Writing–review and editing.
Funding
The author(s) declare that financial support was received for the research, authorship, and/or publication of this article. This work was supported by the Swiss National Science Foundation (Grant Ref. 320030-185351).
Conflict of interest
The authors declare that the research was conducted in the absence of any commercial or financial relationships that could be construed as a potential conflict of interest.
Publisher’s note
All claims expressed in this article are solely those of the authors and do not necessarily represent those of their affiliated organizations, or those of the publisher, the editors and the reviewers. Any product that may be evaluated in this article, or claim that may be made by its manufacturer, is not guaranteed or endorsed by the publisher.
References
Abbasi, S. J., Kim, W. J., Kim, J., Lee, M. C., Lee, B. J., and Shin, M. J. (2022). Robust control design of a human heart rate system for cardiac rehabilitation exercise. Electronics 11 (24), 4081. doi:10.3390/electronics11244081
Cheng, T. M., Savkin, A. V., Celler, B. G., Su, S. W., and Wang, L. (2008). Nonlinear modeling and control of human heart rate response during exercise with various work load intensities. IEEE Trans. Biomed. Eng. 55 (11), 2499–2508. doi:10.1109/tbme.2008.2001131
Combs, S. A., Dugan, E. L., Ozimek, E. N., and Curtis, A. B. (2012). Effects of body-weight supported treadmill training on kinetic symmetry in persons with chronic stroke. Clin. Biomech. 27 (9), 887–892. doi:10.1016/j.clinbiomech.2012.06.011
Dragunas, A. C., and Gordon, K. E. (2016). Body weight support impacts lateral stability during treadmill walking. J. Biomechanics 49 (13), 2662–2668. doi:10.1016/j.jbiomech.2016.05.026
Hunt, K. J., and Fankhauser, S. E. (2016). Heart rate control during treadmill exercise using input-sensitivity shaping for disturbance rejection of very-low-frequency heart rate variability. Biomed. Signal Process. Control 30, 31–42. doi:10.1016/j.bspc.2016.06.005
Ibala, E., Coupaud, S., and Kerr, A. (2019). Comparison of the muscle pattern variability during treadmill walking (fixed and self-pace) and overground walking of able-bodied adults. J. Ann. Bioeng. 1, 47–55. doi:10.33513/10/1901-04
Ikeuchi, Y., Ashihara, J., Hiki, Y., Kudoh, H., and Noda, T. (2009). “Walking assist device with bodyweight support system,” in 2009 IEEE/RSJ International Conference on Intelligent Robots and Systems, St. Louis, MO, USA, 10-15 October 2009 (IEEE), 4073–4079.
Kawada, T., Sunagawa, G., Takaki, H., Shishido, T., Miyano, H., Miyashita, H., et al. (1999). Development of a servo-controller of heart rate using a treadmill. Jpn. Circulation J. 63 (12), 945–950. doi:10.1253/jcj.63.945
Kraft, J. C., Augustine, J. A., Fiddler, R. E., Lewis, C., and Dames, K. D. (2023). Bodyweight support alters the relationship between preferred walking speed and cost of transport. Hum. Mov. Sci. 88, 103068. doi:10.1016/j.humov.2023.103068
Liebenberg, J., Scharf, J., Forrest, D., Dufek, J. S., Masumoto, K., and Mercer, J. (2011). Determination of muscle activity during running at reduced body weight. J. Sports Sci. 29 (2), 207–214. doi:10.1080/02640414.2010.534806
G. Liguori, Y. Feito, C. Fountaine, and B. Roy (2022). ACSM’s guidelines for exercise testing and prescription. 11th ed. (Philadelphia: Wolters Kluwer).
Luo, L., Meng, H., Wang, Z., Zhu, S., Yuan, S., Wang, Y., et al. (2020). Effect of high-intensity exercise on cardiorespiratory fitness in stroke survivors: a systematic review and meta-analysis. Ann. Phys. Rehabilitation Med. 63 (1), 59–68. doi:10.1016/j.rehab.2019.07.006
MacLean, M. K., and Ferris, D. P. (2020). Design and validation of a low-cost bodyweight support system for overground walking. J. Med. Devices 14 (4), 045001. doi:10.1115/1.4047996
Mah, S. M., Goodwill, A. M., Seow, H. C., and Teo, W. P. (2022). Evidence of high-intensity exercise on lower limb functional outcomes and safety in acute and subacute stroke population: a systematic review. Int. J. Environ. Res. Public Health 20 (1), 153. doi:10.3390/ijerph20010153
Meyns, P., Van de Crommert, H., Rijken, H., Van Kuppevelt, D., and Duysens, J. (2014). Locomotor training with body weight support in SCI: EMG improvement is more optimally expressed at a low testing speed. Spinal Cord. 52, 887–893. doi:10.1038/sc.2014.172
Morawietz, C., and Moffat, F. (2013). Effects of locomotor training after incomplete spinal cord injury: a systematic review. Archives Phys. Med. Rehabilitation 94 (11), 2297–2308. doi:10.1016/j.apmr.2013.06.023
Plawecki, A., Henderson, C. E., Lotter, J. K., Shoger, L. H., Inks, E., Scofield, M., et al. (2024). Comparative efficacy of high-intensity training versus conventional training in individuals with chronic traumatic brain injury: a pilot randomized controlled study. J. Neurotrauma. doi:10.1089/neu.2023.0494
Plotnik, M., Azrad, T., Bondi, M., Bahat, Y., Gimmon, Y., Zeilig, G., et al. (2015). Self-selected gait speed-over ground versus self-paced treadmill walking, a solution for a paradox. J. NeuroEngineering Rehabil. 12 (20), 20. doi:10.1186/s12984-015-0002-z
Sloot, L., Van der Krogt, M., and Harlaar, J. (2014). Self-paced versus fixed speed treadmill walking. Gait Posture 39 (1), 478–484. doi:10.1016/j.gaitpost.2013.08.022
Sousa, C. O., Barela, J. A., Prado-Medeiros, C. L., Salvini, T. F., and Barela, A. M. (2009). The use of body weight support on ground level: an alternative strategy for gait training of individuals with stroke. J. NeuroEngineering Rehabil. 6 (43), 43. doi:10.1186/1743-0003-6-43
Theunissen, K., Van Hooren, B., Plasqui, G., and Meijer, K. (2022). Self-paced and fixed speed treadmill walking yield similar energetics and biomechanics across different speeds. Gait Posture 92, 2–7. doi:10.1016/j.gaitpost.2021.11.005
Verrelli, C. M., Tomei, P., Caminiti, G., Iellamo, F., and Volterrani, M. (2021). Nonlinear heart rate control in treadmill/cycle-ergometer exercises under the instability constraint. Automatica 127, 109492. doi:10.1016/j.automatica.2021.109492
Vincent, H. K., Madsen, A., and Vincent, K. R. (2022). Role of antigravity training in rehabilitation and return to sport after running injuries. Arthrosc. Sports Med. Rehabilitation 4 (1), e141–e149. doi:10.1016/j.asmr.2021.09.031
Visintin, M., Barbeau, H., Korner-Bitensky, N., and Mayo, N. E. (1998). A new approach to retrain gait in stroke patients through body weight support and treadmill stimulation. Stroke 29 (6), 1122–1128. doi:10.1161/01.str.29.6.1122
Wang, H., and Hunt, K. J. (2021a). Heart rate control using first-and second-order models during treadmill exercise. Syst. Sci. Control Eng. 9 (1), 651–662. doi:10.1080/21642583.2021.1976304
Wang, H., and Hunt, K. J. (2021b). Identification of heart rate dynamics during treadmill exercise: comparison of first- and second-order models. Biomed. Eng. OnLine 20 (37), 37. doi:10.1186/s12938-021-00875-7
Wang, H., and Hunt, K. J. (2023a). Feedback control of heart rate during treadmill exercise based on a two-phase response model. PLOS ONE 18 (10), e0292310. doi:10.1371/journal.pone.0292310
Wang, H., and Hunt, K. J. (2023b). Self-paced heart rate control for treadmill exercise. Front. Control Eng. 4, 1158164. doi:10.3389/fcteg.2023.1158164
Wang, L., Yang, Y., and Su, S. (2021). “Nonparametric modelling based model predictive control for human heart rate regulation during treadmill exercise,” in 2021 43rd Annual International Conference of the IEEE Engineering in Medicine & Biology Society (EMBC), Mexico, 01-05 November 2021, 148–151.
Wiens, C., Denton, W., Schieber, M. N., Hartley, R., Marmelat, V., Myers, S. A., et al. (2019). Walking speed and spatiotemporal step mean measures are reliable during feedback-controlled treadmill walking; however, spatiotemporal step variability is not reliable. J. Biomechanics 83, 221–226. doi:10.1016/j.jbiomech.2018.11.051
Keywords: heart rate control, treadmill, real-time feedback, self-paced, gait impairment, heart rate dynamics
Citation: Wang H, Guimaraes D, Nef T and Hunt KJ (2024) Self-paced heart rate control during treadmill exercise for persons with gait impairment: a case study. Front. Control. Eng. 5:1343851. doi: 10.3389/fcteg.2024.1343851
Received: 24 November 2023; Accepted: 15 March 2024;
Published: 03 April 2024.
Edited by:
Manuel Beschi, University of Brescia, ItalyReviewed by:
Shintaro Nakatani, Tottori University, JapanGerardo Mino, Meritorious Autonomous University of Puebla, Mexico
Copyright © 2024 Wang, Guimaraes, Nef and Hunt. This is an open-access article distributed under the terms of the Creative Commons Attribution License (CC BY). The use, distribution or reproduction in other forums is permitted, provided the original author(s) and the copyright owner(s) are credited and that the original publication in this journal is cited, in accordance with accepted academic practice. No use, distribution or reproduction is permitted which does not comply with these terms.
*Correspondence: Hanjie Wang, aGFuamllLndhbmdAYmZoLmNo
†ORCID: Hanjie Wang, orcid.org/0000-0003-3505-3447