Fractional Flow Reserve Evaluated as Metric of Coronary Stenosis — A Mathematical Model Study
 Theo J. C. Faes1*
  Romain Meer
 Peter L. M. Kerkhof
- 1Department of Radiology and Nuclear Medicine, Amsterdam University Medical Centers, Amsterdam, Netherlands
- 2Cardiovascular Center, Aalst, Belgium
Introduction: Coronary arterial stenosis may impair myocardial perfusion with myocardial ischemia and associated morbidity and mortality as result. The myocardial fractional flow reserve (FFR) is clinically used as a stenosis-specific index.
Aim: This study aims to identify the relation between the FFR and the degree of coronary arterial stenosis using a simple mathematical model of the coronary circulation.
Methods: A mathematical model of the coronary circulation, including an arterial stenosis of variable degree, was developed. The relation between the FFR and the degree of stenosis (defined as the fractional cross sectional area narrowing) was investigated, including the influence of the aortic and venous pressures and the capillary resistance. An additional study concerning 22 patients with coronary artery disease permits comparison of clinical data and in silico findings.
Results: The FFR shows an S-shaped relationship with the stenosis index. We found a marked influence of venous and aortic pressure and capillary resistance. The FFR is accompanied by a clinically relevant co-metric (FFRC), defined by the Pythagorean sum of the two pressures in the definition formula for FFR. In the patient group the FFRC is strongly related to the post-stenotic pressure (R = 0.91). The FFRC requires establishment of a validated cut-off point using future trials.
Conclusion: The S-shaped dependence of FFR on the severity of the stenosis makes the FFR a measure of the ordinal scale. The marked influences of the aortic and venous pressures and the capillary resistance on the FFR will be interpreted as significant variations in intra- and inter-individual clinical findings. These fluctuations are partly connected to the neglect of considering the FFRC. At otherwise identical conditions the FFR as measured at baseline differs from the value obtained during hyperemic conditions. This expected observation requires further investigation, as the current hyperemia based evaluation fails to take advantage of available baseline data.
Introduction
A coronary artery stenosis may seriously affect myocardial perfusion with myocardial ischemia or even cardiac death as possible sequelae (1). Consequently, a function limiting coronary arterial stenosis is associated with a significant increase in morbidity and mortality, although the underlying mechanisms may partly differ for men and women (2–5). Traditionally, a stenosis has been evaluated by angiography leading to a preoccupation with coronary luminology (6). Inadequacy of this method led to a number of alternative approaches, both invasive such as pressure determinations, and non-invasive techniques including Doppler echocardiography. Often the fractional flow reserve (FFR) is clinically used as a stenosis-related index of maximum attainable local myocardial perfusion. By using pressure wires, the FFR is assessed by measuring invasively the coronary pressures proximal and distal of the stenosis. The FFR is defined as the ratio of mean coronary pressures measured directly distal and proximal of the stenosis, i.e., FFR = PDistal/PProximal [a dimensionless number in the numerical range from 0 (complete occlusion) through 1 (no occlusion)]; an FFR-value below 0.80 is considered to reflect a clinically significant stenosis. The FFR is thought to be a stenosis-specific index that reflects the effect of the coronary stenosis on the myocardial perfusion. Moreover, the FFR is reported to be independent of hemodynamic characteristics of the coronary circulation, such as blood pressure, heart rate, and cardiac contractility (7). In clinical practice, however, the use of the FFR is somewhat limited by the high costs, the extra time involved, and the need to administer adenosine to induce hyperemia with an associated risk and burden for the patient. Furthermore, the ratio FFR does not address its intrinsic companion, being the Pythagorean sum of PDistal and PProximal (8) (see section Methods for details).
By using a simple mathematical model of the coronary circulation, this study aims to identify the relationship of the FFR on the degree of stenosis, while evaluating hemodynamic characteristics of the arterial coronary circulation. Recently, Duanmu et al. presented a lumped-parameter model of the coronary circulation (9). In their model, the coronary circulation is described by defining a number of compartments, and by characterizing the hemodynamics of each compartment with the use of a three-element Windkessel model (10). Each Windkessel consists of a dissipative Poiseuille resistance (R), a blood storing compliance (C), and a blood mass inertance (L). The values of these three elements (R, C, L) were calculated from the length and diameter of the coronary vessel using CT-images (9). To study the effect of a stenosis on the coronary hemodynamics and the FFR, we extended their model by including an extra dissipative resistance to more precisely mimic the stenosis. The focus of our present study is more limited than explored in Duanmu's model. Our plain model is used to gain insight in the fundamental characteristics of the FFR metric. This discernment will guide our future simulation studies employing the Duanmu model as a convenient starting point for both the left and right coronary artery.
Our present study aims are:
• To discuss the FFR's definition with its assumptions and their theoretical consequences;
• To identify the relation of the FFR and the underlying degree of coronary arterial stenosis;
• To discuss the consequences of defining the FFR as a ratio of two pressures;
• To hint for an alternative for the FFR.
For verification of the outcomes, the theoretical issues will be related to available clinical data.
Methods
The FFR is determined by measuring the mean aortic pressure, , and the mean pressure distal to the stenosis, , during hyperemia, and by the subsequent calculation of the ratio FFR = /. In the following we will discuss: firstly, the rationale of FFR as ratio of distal-to-stenosis pressure to aortic pressure and, secondly, the mathematical relationship between this FFR and the stenosis's geometry (i.e., the ratio of the stenotic cross sectional area to the non-stenotic area) as determinant of the flow limitation.
The Rationale of the FFR as Pressure Ratio
In their landmark study Pijls and De Bruyne start from the definition of FFR as the maximum myocardial blood flow in the presence of a stenosis, FSmax, divided by the theoretical maximum myocardial blood flow in the absence of the stenosis, FNmax. Subsequently, they show that the FFR is approximately equal to the ratio of the mean pressure measured distal to the stenosis, , and the mean aortic pressure both measured during hyperemia (as indicated by the letter H in the superscript), i.e.,
The maximum flows are achieved by the administration of a hyperemic agent, e.g., adenosine.
To accomplish this result, Pijls and De Bruyne use a two-compartment model to characterize the blood flow in the vascular bed of the coronary circulation: one compartment represents the coronary arteries, with or without stenosis, and the second compartment represents the remaining distal capillary network and venous vessels of the coronary circulation (Figure 1). This model defines the following quantities: Let PA and PV be the mean aortic and the venous pressure (mmHg), respectively, and let PD be the mean pressure (mmHg) distal of the epicardial artery stenosis. Moreover, let RA and RC be the hemodynamic resistances (mmHg.s/ml) of the arterial part (either non-stenotic or stenotic) and the capillary and venous part, respectively. Finally, after the administration of a hyperemic agent the capillary resistance reduces to RCmin and the flow increases to Fmax, while the distal pressure PD decreases to . Within this model, simple hemodynamic reasoning yields the following results:
1. By application of Poiseuille's law (i.e., flow equals pressure drop divided by fluid resistance; see Equation 11) to the capillary compartment, the baseline and maximum flows equal the perfusion pressures PD – PV and – PV divided by the capillary hemodynamic resistance RC and RCmin, respectively. That is,
2. For the non-stenotic case, the pressure drop over the arterial part is negligible compared to the capillary pressure drop, so, PD ≈ PA >> PV and ≈ >> PV (where >> indicates: much larger). Hence, by substitution of ≈ PA in Equation (2), the non-stenotic flow FN becomes,
assuming an unchanged aortic pressure during hyperemia.
3. For the stenotic case, the pressure drop over the arterial part is non-negligible compared to the capillary pressure drop, so, PA > PD > PV and > > PV. Hence, with Equation (2), the stenotic flow FS becomes,
4. By substitution of these flows (Equations 3 and 4) in the definition of FFR (Equation 1) yields,
with the following rationale applied at the numbered signs of equality: (1) definition of FFR (Equation 1); (2) substitution of Equations (3, 4); (3) cancelation of the common term RCmin; (4) neglecting PV, as considered small compared to and PA.
Note that, occasionally, the FFR is measured as the ratio of the distal-to-stenosis pressure and the aortic pressure in baseline (B) instead of the hyperemic state. Let FFR(H) and FFR(B) refer to hyperemic and baseline state, respectively. Then, Equation (5) implies that FFR(H) ≤ FFR(B) since
as hyperemic is lower than the baseline and as hyperemic and baseline aortic pressure are approximately equal, ≈ PA. Thus, the FFR during hyperemia is smaller than FFR during baseline.
To summarize: under the assumptions of the model with Poiseuillean resistances, the FFR as ratio of the maximum stenotic blood flow and the theoretical maximum non-stenotic blood flow is approximated by the ratio of the mean hyperemic post-stenotic pressure and the mean aortic pressure .
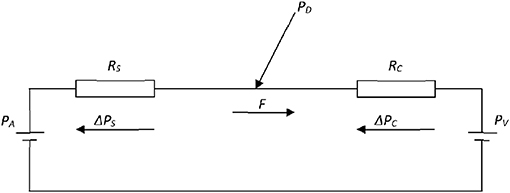
Figure 1. Electrical analog of the coronary circulation. The model consists of an aortic pressure PA and a venous pressure PV with two resistances, serially connected between these pressure sources, to represent the stenotic RS and capillary RC fluid resistances. F is the flow through the resistances, while ΔPS and ΔPC are the pressure drops over the resistances RS and RC, respectively. PD is the pressure distal to the stenosis and proximal to the capillaries.
Consequences of Defining the FFR as Ratio of Pressures
From a mathematical-physiologic viewpoint, one might interpret the FFR as a summary of two pressures, PD and PA, in only one number, being the ratio PD/PA. Subsequently, one might wonder whether relevant information is lost by summarizing two pressures in a single number which concerns a dimensionless ratio.
A convenient way to analyze the consequences of using the ratio, is to employ the analogy with the Cartesian and polar coordinate systems (see Figure 2). To be specific, consider the pressures (PA, PD) as a point in a graph with PA and PD on the abscissa and ordinate (horizontal and vertical axis), respectively. Hence, (PA, PD) act as the Cartesian coordinates. Alternatively, the same point can be defined by the polar coordinates: (i) the length of the line from the origin to the point (PA, PD); (ii) the angle between this line and the positive abscissa (or equivalently by the slope of this line). By using the Pythagorean theorem, the line's length, say FFRC, equals √(PA2 + PD2) and the tangent or slope of the angle PD/PA equals FFR (see Figure 2). Hence, FFRC = √(PA2 + PD2) and FFR act as the polar coordinates. So, in the graph the point is characterized complete by either the Cartesian coordinates (PA, PD) or the polar coordinates FFRC = √(PA2 + PD2) and FFR = PD/PA.
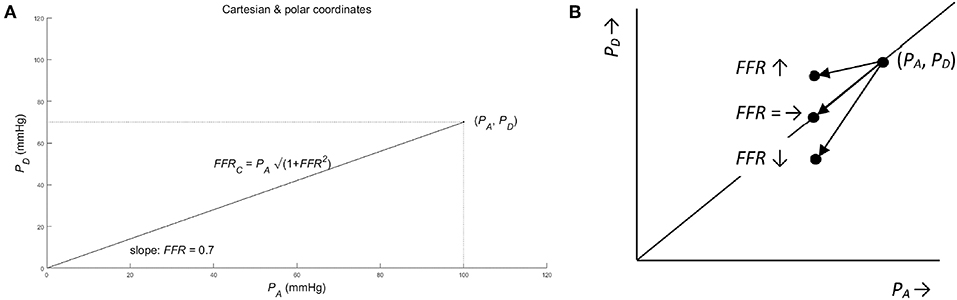
Figure 2. (A) Cartesian and polar coordinates. The pressure PA and PD represented in Cartesian coordinates (PA, PD) (see dotted lines) and in polar coordinates (. Note that the pair of pressure (PA, PD) define exactly one point in the graph, while the single FFR defines a complete line in the graph. So, mathematically speaking, the single FFR without the companion FFRC leaves ambiguity. As a result, all points on a line through the origin share the same value of FFR. (For details see Methods section). (B) Ambiguous change of FFR from point (PA, PD) for three different cases of a pressure decrease: The FFR is unchanged (see notation FFR =), if the change in PD is equal to the change of PA times FFR. Similarly, the FFR decreases (see FFR ↓) and increases (see FFR ↑), if the change in PD is smaller and larger than the change of PA times FFR, respectively (see section Methods for details).
For later use, note the following mathematical relations:
where the approximation of the square root results from Newton's Binomial Series, and becomes more accurate for smaller values of FFR. Note: if two out of the four variables PD, PA, FFR, FFRC are known, then the remaining variables can be calculated.
Using these two coordinate systems, the original question—whether information is lost by using the FFR—can be answered from a mathematical point of view. By using the FFR, as a summary measure of PA and PD, information is clearly lost, because only one of the two polar coordinates is used while the other polar coordinate is neglected. Thus, all points on the same line through the origin share the same FFR and, therefore, cannot be distinguished by the FFR alone. So, the FFR summarizes the information carried by PD and PA “one-dimensionally” along the lines passing the origin in the PA-PD-plot.
This mathematical result provides guidance to answer the remaining question whether the FFR can be interpreted as a sound measure of stenosis. As a counterexample, consider a patient developing a stenosis resulting in a decreased post-stenotic pressure, from PD to γPD (direct result of increased stenotic fluid resistance), and a decreased aortic pressure, say from PA to βPA (indirect result of reduced cardiac performance due to a decreased perfusion of the cardiac muscle tissue). Then the FFR changes from PD/PA to γPD/βPA, that is a change from FFR to (γ/β) FFR. Depending on the actual numerical values of γ and β, the FFR will decrease (γ < β), remain unchanged (γ = β), or will increase (γ > β) (see Figure 2B). Clearly, this ambiguity of the FFR is an undesired and unanticipated property for a sound measure of degree of stenosis.
The common clinical experience of a decreasing FFR with a worsening of the stenosis, may be explained by the assumption that the decrease in PD is often larger than the change in PA (γ < β) and, hence, the FFR will decrease with a worsening of the stenosis.
Relationship Between FFR and Degree of Stenosis
In order to find the relationship between the FFR and the degree of narrowing in the stenosed artery, further modeling of the stenosis is required. Various approaches may be chosen: (1) a uniform narrowing of the vessel's cross-sectional area from the normal value A0 to the “narrowed value” AS over the full vessel's length L and, then, using Poiseuille's law to calculate the narrowed vessel's hemodynamic resistance; or (2) a local narrowing of the vessel's cross-sectional area from the normal value A0 to the “narrowed value” AS over the stenosis length LS and, then, using Bernoulli's law to calculate the hemodynamic resistance. The first approach will be used in this study.
Degree of Stenosis
Let AS (dS) and A0 (d0) be the cross-sectional area (diameter) of the coronary artery with and without a stenosis. Then, the degree of cross sectional area narrowing (α) is defined as
with α in the range 0 (complete stenosis) to 1 (no stenosis). Alternatively, the stenosis degree S is defined as
Clearly, both measures are related,
The advantage of using α is, however, that the subsequent formulae will be simpler.
Poiseuille's Law Applied to a Uniform Narrowed Vessel
Let RS(α) be the hemodynamic resistance (mmHg.s/ml) of the stenotic artery with a narrowing of degree α over the vessel's length L (cm). Then, by applying Poiseuille's law, the resistance RS(α) is,
where ΔP is the vessel's pressure difference (mmHg), F is the flow (ml/s), η is the viscosity (mmHg.s/cm2), L is the vessel length (cm), and AS the cross-sectional area (cm2) of the stenotic artery.
Pressures and Flow
With reference to Figure 1, the flow (F) equals the perfusion pressure PA – PV divided by the sum of the two resistances RS(α) and RC, i.e.,
Moreover, the distal pressure PD equals the aortic pressure PA minus the pressure drop over RS(α), i.e., RS(α) F. Hence,
and by substitution of Equation (12) in Equation (13) yields,
The dependence of FFR upon the degree of narrowing α is found by first the substitution of Equation (14) in Equation (1), i.e.,
and, subsequently, the substitution of Equation (11) in Equation (15), i.e.,
or, equivalently,
Note: The FFR in Equations (15) or (16) applies to both FFR(H) or FFR(B), depending on whether the pressures were measured under hyperemia or baseline conditions.
Patient Study
This retrospective sub-study evaluates data from 22 patients (age 67 ± 11 years) from Aalst Cardiovascular Center (Belgium), having right coronary artery (RCA) stenosis in proximal (p, N = 8), medial (m, N = 12), or distal (d, N = 4) part of the vessel. FFR was derived from the ratio of the average blood pressure distal to the coronary artery stenosis (PD) and the average pressure in the aorta (PA), both obtained during i.c. adenosine infusion or after an i.v. bolus injection. Technical details are described elsewhere (5). All patients gave permission to use their data in anonymized investigations by signing a consent form. This retrospective study was exempt from institutional review by the Clinical Review Board.
Results
In silico Study
The dependence of the FFR, FFRC and PD on the degree-of-stenosis α (α = 1 is no stenosis, α = 0 is complete occlusion) is specified in Equation (17) combined with Equation (7) (see section Methods). To discuss the nature of the dependence of FFR, FFRC, and PD on α, three graphs are created, and an additional graph is drawn to document FFR vs. PD (Figure 3). In the following four points, the merits of each of these graphs is presented in detail:
1. The upper-left panel shows the clearly non-linear dependence of FFR upon α (Equation 17), for various settings of the parameters: R0/RC = 0.04 or 0.1 with PV/PA = 0 or 0.1 (see legend in upper-left panel). Note the following:
• The four lines share a similar S-shape (which is common for a hyperbolic function of the form in Equation 17) but the S-shaped curves start and end at different levels. In particular, the curves start (α = 0) at PV/PA [i.e., the origin for PV/PA = 0 and point (0, 0.1) for PV/PA = 0.1] and the lines end (α = 1) at approximately (1+ R0/RC)−1 (i.e., approximately 0.96 and 0.83, almost independently of PV/PA). Note that PV/PA dominates the starting values (left) while R0/RC dominates the end values (right), resulting in a crossover of the dotted and dashed line. These four example curves can be used to predict other parameter settings. The lower left and upper right point is determined by the value of PV/PA and (1+ R0/RC)−1 while the steepness of the curve decreases with an increasing R0/RC. In summary: the dependence of FFR on α is an S-shaped relation with the start and end points dependent upon the ratio of the aortic and the venous pressures, as well as the ratio of the non-stenotic arterial and capillary-venous resistances.
• The S-shaped form of the curves implicates that the change of the FFR for a change of α is strongly dependent on the particular location considered. In the steep middle part of the curve, a change of α results in a relatively large change in FFR, while a same sized change in α will result in much smaller change in FFR in the flat lower and upper parts of the curve. This notion is illustrated by the horizontal line with dots, where the dots are separated by an equal step size in FFR while the associated step size in α varies with the steepness of the curve. Thus, the sensitivity of the FFR, as a measure of stenotic narrowing, is strongly dependent upon the degree of stenotic narrowing. Technically speaking, this makes that FFR is a measure on an ordinal scale (i.e., equal changes in α yield unequal changes in FFR). This fact implies that common statistics like means and standard deviations, as well as parametric statistical tests, like Student's t-test, are here strictly speaking inappropriate. In summary, a unit change of FFR does not correspond to a unit change in α.
• The venous pressure is of influence on the FFR; the larger the PV/PA, the larger the FFR although this effect is more pronounced for lower α. This influence may lead to an overestimation of the actual value of the FFR. Technically speaking, the FFR is a biased measure of α. Similarly, the capillary resistance is of strong influence on the FFR; the larger R0/RC (i.e., the smaller RC) the less steep the FFR-curve is, with as result quite different values of FFR. In particular, the FFRs as measured during baseline and hyperemia are expected to differ significantly, where the baseline FFR is larger than the hyperemic FFR [see Equation (6) in section Methods]. In summary, the FFR is a biased measure of α, and the uncontrolled bias will present itself as random variations in inter-individual results.
2. The upper-right panel shows a somewhat similar non-linear S-shaped dependence of FFRC upon α (Equations 7 and 17), for four different setting of the parameters: R0/RC = 0.04 or 0.1 with PV/PA = 0 or 0.1 (see legend in upper-left panel) with PA = 100 mmHg is all four cases. Comparison of FFRC with FFR shows a marked shape difference for the smaller valued α's, and a completely different FFRC scale, running from 100 to 140 mmHg, i.e., ranging between PA and almost PA√2 (see Equation 7). In summary, the dependence of FFRC upon α is somewhat similar to the dependence of FFR upon α.
3. The lower-left panel shows that the dependence of PD upon α (Equations 7 and 17) is a scaled version of FFR for the four different setting of the parameters: R0/RC = 0.04 or 0.1 with PV/PA = 0 or 0.1 (see legend in upper-left panel) with PA = 100 mmHg is all four cases. The only difference with FFR is the fact that the scale runs from 0 to 100 mmHg while the curves start (α = 0) at PV and end (α = 1) at approximately (1+ R0/RC)−1 PA (see Equation 14). In summary, the dependence of PD upon α is a scaled version of the dependence of FFR upon α.
4. The lower-right panel shows the dependence of FFR upon PD (Equations 7 and 17), which is exactly a straight line through the origin for the four different settings of the parameters: R0/RC = 0.04 or 0.1 with PV/PA = 0 or 0.1 with PA = 100 mmHg in all cases. This single straight line is easily explained by rewriting the previous result PD = PA FFR (Equation 7) as FFR = PA−1 PD. Now it becomes evident that in a graph this relation is a straight line through the origin with a slope PA−1. In summary, the dependence of FFR upon PD is reflected by a straight line.
Figure 4 shows the dependence of PD on PA for a particular degree of stenosis α (each dot represents a particular case of values of α, PD and PA. Note that the distance between the points is increasing or, equivalently, the density is decreasing, for a decreasing α.
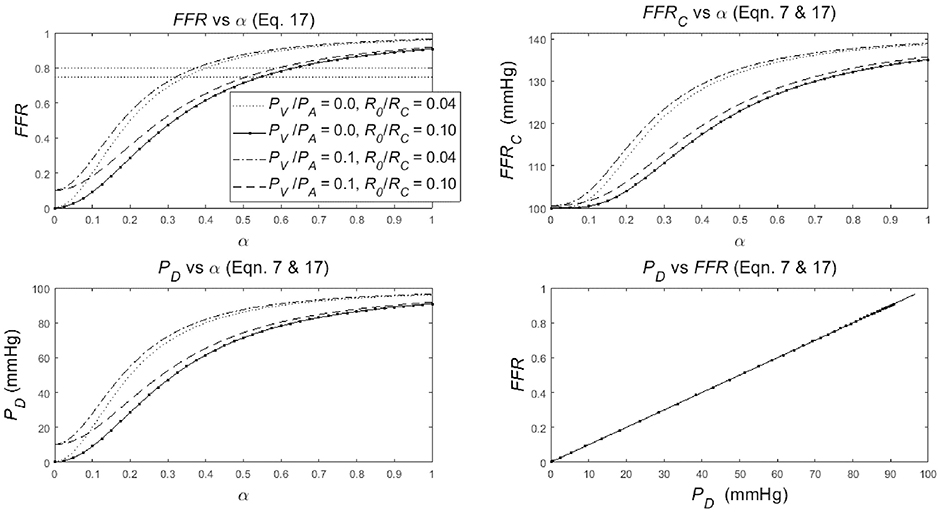
Figure 3. Simulation results for the non-linear dependence of:
• the FFR with common reference values at 0.75 and 0.8 (upper-left panel),
• its companion FFRC (upper-right panel),
• the distal-to-stenosis pressure PD (lower-left panel),
to the degree of stenosis α (α = 1 is no stenosis, α = 0 means complete occlusion) for different values of R0/RC and PV/PA (see legend).
• The relation of FFR as function of PD (lower-right panel),
(The legend in upper-left panel applies also to the upper-right and lower-left panel). See section Results for details.
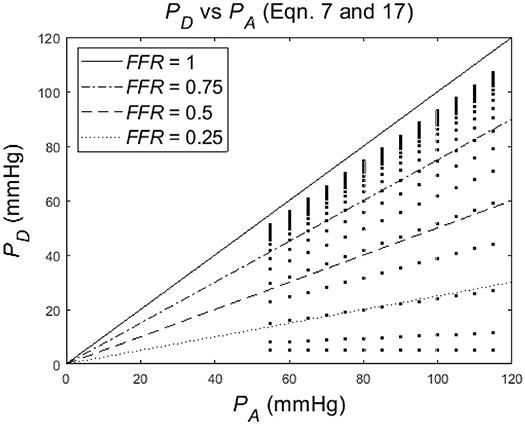
Figure 4. Simulation of distal-to-stenosis pressure PD vs. mean aortic pressure PA (Equation 17) with each dot representing a case with PA running from 55 to 115 mmHg for different values of the degree of stenosis α (α running from 1 to 0), and with lines (Equation 7) indicating FFR at 1, 0.75, 0.5, and 0.25.
Patient Study
The distribution of PA and PD data pairs is presented in Figure 5. The spread of FFRC for the recorded FFR values is shown in Figure 6, while Figure 7 illustrates that FFR sharply declines in a non-linear manner when the diameter reduction decreases beyond 60%. Note that in this study 2 out of 3 data pairs indicate that FFR can still be above the 0.80 cut-off level, while the associated diameter reduction is as large as 70%. Also is shown that the cross sectional area based stenosis metric α (running in opposite direction along the abscissa) follows a sigmoid pattern, as theoretically predicted (Equation 17). Figure 8 presents FFR against mean pressure as measured distal from the coronary stenosis, using adenosine induced hyperemia. The blue curve refers to the best fitting regression (yielding R2 = 0.581), calculated on the basis of the theoretically derived formula FFR = PD/(c1+PD) described elsewhere (11). This approach ensures that the theoretical point where the value for FFR vanishes occurs at PD = 0 mmHg, while FFR also asymptotically approaches the upper limit of 1.0 as PD increases to its physiological maximum. FFRC vs PD yields R = 0.91.
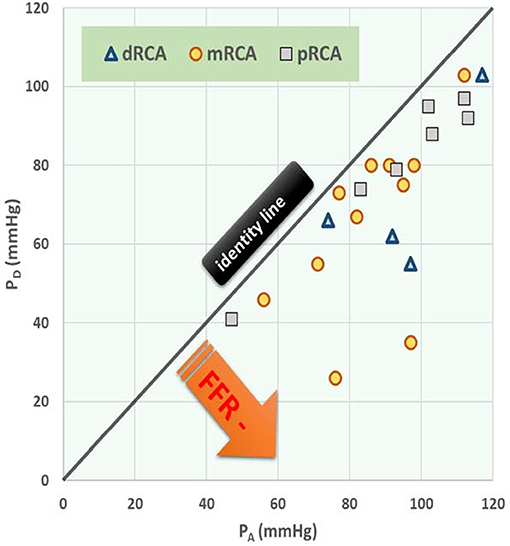
Figure 5. Post-stenotic pressure (PD) vs. mean aortic pressure (PA) during hyperemia with stenosis at different anatomical locations. Data points refer to 22 patients with right coronary artery (RCA) stenosis. The three symbols specify the anatomical location of each stenosis, being distal (d), medial (m), or proximal (p). The black (identity) line corresponds with a fractional flow reserve (FFR) of 1.00 (i.e., no stenosis). Regression line: PD = 0.873 PA – 6.836, R = 0.728, P < 0.001, N = 22. In the section Discussion, this graph is compared with Figure 4 which shows results from the in silico study.
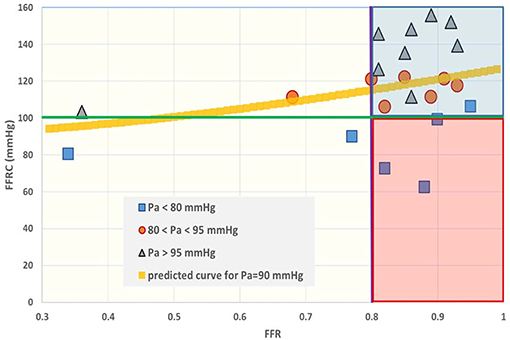
Figure 6. Fractional flow reserve (FFR) and the intrinsic companion (FFRC). The interpretation of FFR is not unique, as a large spread of the co-metric FFRC can be discerned. In the past the region between 0.75 and 0.80 was termed the “gray zone.” Data points having FFR > 0.80 (purple line) are often considered to refer to patients who do not require revascularization. However, the situation becomes different if the FFR companion (FFRC) is accepted as a second criterion. When, for example, the green line is taken as an additive cut-off level, then the data located in the red shaded area do not simultaneously fulfill both criteria. Obviously, establishment of combined cut-off levels requires robust evaluation in large patient groups. The yellow curve is calculated for PA = 90 mmHg on the basis of Equation (7), i.e., .
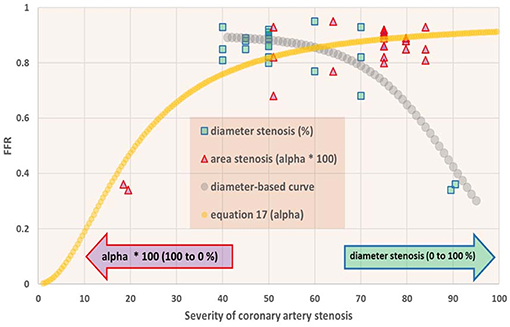
Figure 7. Fractional flow reserve (FFR) in dependence of degree of coronary artery stenosis. For the patients studied (N = 22), the FFR is shown vs. percentage diameter stenosis (squares) as well as vs. the metric α as defined in Equation (8) (triangles). On the abscissa the scales for these metrics run in opposite directions, and therefore all data points are shown twice. Note that FFR sharply drops if the stenosis exceeds 70% diameter reduction. The curve for α (Equation 17) shows a sigmoid pattern. In the section Discussion, this graph is compared with results from the in silico study (Figure 3, upper-left).
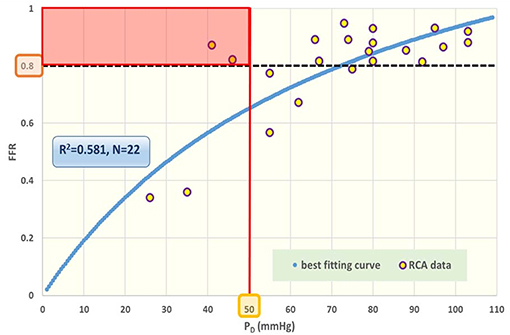
Figure 8. Fractional flow reserve (FFR) against post-stenotic mean pressure (PD). Data points for cardiac patients (N = 22) with right coronary artery (RCA) stenosis. The blue curve refers to the best fitting regression (R2 = 0.581), predicted on the basis of the theoretically derived formula FFR = PD/(c1+c2PD). The black broken line indicates the traditional cut-off level at 0.80 for FFR. The various data points near this line can be further characterized by specifying the prevailing PD value. The red line reflects a tentative complementary cut-off for the co-variable PD, assuming that a driving PD below 50 mmHg is inadequate for appropriate perfusion. Acceptance of this criterion implies that the patients within the red rectangular area are in jeopardy. Clearly, any suggested combination of cut-off levels requires future robust evaluation in large patient groups. In the section Discussion, this graph is compared with results obtained from the in silico study (Figure 3, lower-right).
Evaluation of FFR Data Presented in the Literature
As the relationship between FFR and the degree of stenosis is the main subject of this study, we also collected a variety of data from the literature. In a computational fluid dynamics (CFD) modeling study (12) it was shown that uncertainty in minimum lumen diameter had the largest impact on hemodynamic simulations, followed by boundary resistance, viscosity and lesion length. Also, uncertainties were not additive, and only slightly higher than the highest level found for a single parameter. Also based on CFD and using angiographic images it was demonstrated (13) that sensitivity analysis for physiological lesion significance was influenced less by coronary or lesion anatomy (33%) than by microvascular physiology (59%). Using a reduced-order model for the estimation of FFR (rather than 3D) based on blood flow simulations that incorporated clinical imaging and patient-specific characteristics, others found that model errors were small, and that uncertainty related to the factor by which peripheral resistance is reduced from baseline to hyperemic conditions proved to be the most influential parameter for FFR predictions, whereas uncertainty in stenosis geometry had greater effect in cases with low FFR (14). Similarly, 296 lesions were studied (15) and the authors compared (by linear regression) various clinically relevant measures, including diameter stenosis (R = 0.565), lesion length (R = 0.306), reference vessel cross sectional area (R = 0.195), and the myocardial supply area subtended by the coronary vessel under study (R = 0.504). In an attempt to further simplify calculations a 1D model was compared with a 3D model, and found to yield nearly similar findings for FFR (16). Findings reported in 38 studies (17) are summarized in Figure 9 which further illustrates the discrepancy between FFR and diameter-based indicators of coronary luminal obstruction.
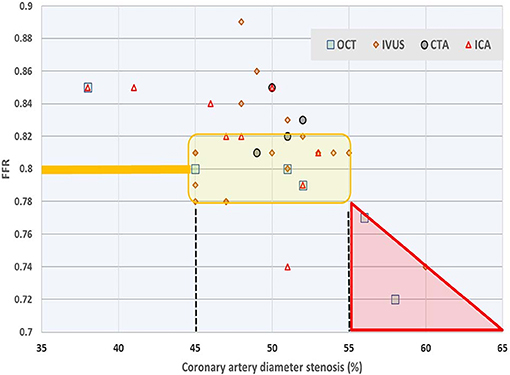
Figure 9. Survey of relationship between FFR and diameter stenosis. Average values reported in 38 studies on the basis of four measurement techniques: optical coherence tomography (OCT), intravascular ultrasound (IVUS), computed tomography angiography (CTA), and intracoronary angiography (ICA). Most authors employ linear regression or fit a second order polynomial for their study participants. The yellow shaded area refers to values of 0.78 ≤ FFR ≤ 0.82 around the common cut-off point, which narrow range corresponds with (averaged) diameter reduction anywhere between 45 and 55%. Data from Chu et al. (17).
Clinical Implications
For coronary arteries we analyzed the relationship between local diameter stenosis and the associated pressure gradient using a simple mathematical model. In clinical practice the pre- and post-stenotic pressures are obtained during induced hyperemia, and the key metric FFR, calculated for medical decision making, considers the minimum value of the ratio of these two pressures. We derived that the resulting dimensionless ratio requires consideration of an associated companion FFRC, which is the Pythagorean mean of the two pressures involved. Similar considerations apply to the separate category of coronary flow reserve metrics, as well as to recently introduced alternative metrics such as adenosine-free PD/PA and wave-free approaches. As on theoretical grounds any companion (as defined in our study by the pertinent hypotenuse) may not be neglected just for simplicity or convenience reasons, it is necessary to evaluate the precise clinical impact of FFRC in large scale patient studies.
Discussion
Limitations of myocardial perfusion, due to coronary arterial stenosis, are best described by pressure-flow relationships. In clinical practice, such investigations are limited to the estimation of either coronary artery diameter, pressure, or flow. Historically diameter reductions were calculated from coronary angiograms with emphasis on anatomy. Subsequent analysis referred to physiology and was based on (surrogates of) flow measurements aimed at determination of the reserve capacity, i.e., the maximum flow increase during hyperemia. One of the most popular approaches does not directly measure flow, but rather the ratio of two pressures measured proximally and distally from the stenosis during hyperemia, and is referred to as FFR (the primary measure evaluated in this study). Next simplified versions were explored, including ratios obtained during the (wave-free) diastolic phase (18), and even ratios without induction of hyperemia. Agreements and differences among resting coronary physiological indices led to the query: Are all things equal? (19). Recently, prudent thoughts were formulated regarding comparisons of various techniques, while pointing to the question what is precisely compared with what, and that question was formulated against the background and role of the acclaimed “gold standard” (20). Therefore, the aim of our study was a model-based evaluation of the FFR, because the model provides a complete knowledge and a full control (“gold standard”) of the conditions. Moreover, the model enables the detailed evaluation of the characteristics of the FFR, although in silico. Then, the in silico study outcomes have been compared with patient data regarding coronary diameter (reduction), pressures proximal and distal to the stenosis during baseline and adenosine. So, the in silico study is used to generate predictions that are subsequently verified using available clinical data.
The outline of the discussion is as follows: first, the answers to our four research questions (see section Introduction) are discussed point-by-point; secondly, the in silico study outcomes are compared with clinical data; thirdly, the results of our study are put into the perspective of other model studies; finally, the limitations of our study are discussed.
The FFR was evaluated as a measure of arterial coronary stenosis by using a simple mathematical model of the coronary system. The coronary circulation was modeled with two Poiseuillian hemodynamic resistances, one for the arterial part and one for the capillary and venous part and an aortic and venous pressure (see Figure 1), all in close correspondence with the original approach (7). The arterial stenosis was described by reduction of cross-sectional surface in Poiseuilles law (Equations 8–11). This simple model allowed the calculation of explicit formulae (with graphs) for the flow F (Equation 12), the distal-to-stenosis pressure PD (Equation 14), the FFR (Equation 17), all as a function of the degree of stenosis α. This model and these formulae and associated graphs, allow the evaluation of the FFR as a measure of arterial stenosis. First, our main objectives in this study (see section Introduction) are discussed point-by-point:
• Firstly, the FFR's definition and its theoretical consequences. The FFR is defined as the ratio of the maximum myocardial blood flow in presence of a stenosis and the theoretical maximum myocardial blood flow an absence of the stenosis. Pijls and De Bruyne argued that the intended FFR can be approximated by the ratio of the mean distal-to-stenosis pressure and the mean aortic pressure, both measured during a drug-induced hyperemia. Our analysis confirmed, not surprisingly, the Pijls and De Bruyne results but also clearly showed that: (1) the FFR is not a simple linear measure of the degree of stenosis (Figure 3 upper-left panel); and (2) the FFR measured at baseline conditions and during hyperemia are related similarly to the degree of stenosis and, as expected, the FFR is larger at baseline than in hyperemia FFR (see Equation 6).
• Secondly, the relation between the FFR and the degree of coronary arterial stenosis was identified. This relation was found to be an S-shaped curve, possibly significantly influenced by both the size of the capillary resistance relative to the stenotic resistance and the size of the venous pressure relative to the aortic pressure. The S-shaped curve implicates that the sensitivity of the FFR, as a measure of stenotic narrowing, is strongly dependent upon the degree of stenotic narrowing itself. Technically speaking, this makes FFR a measure of α on an ordinal scale (i.e., equal changes in α yield same-direction but unequal changes in FFR) implying that common statistics like means and standard deviations and, parametric statistical tests, like Student's t-test, are strictly speaking inappropriate. The influence of the venous pressure may lead to an overestimation of the actual value of the FFR. Technically speaking, the FFR is a biased measure of α. The influence of the capillary resistance on the steepness the FFR-curve changes the sensitivity of the FFR, resulting in quite different values of FFR. In particular, the FFR values measured during baseline and hyperemia are expected to differ significantly, with the baseline FFR larger than the hyperemic FFR (see Equation 6). All these influences make the FFR a biased measure of α and these uncontrolled biases will present themselves as random variations in intra- and inter-individual clinical results.
• In addition, one needs to consider the following trade-off in answering the question whether to determine the FFR under hyperemic or baseline conditions: In the upper-left panel of Figure 3, the two upper and two lower curves can be interpreted as the FFR at baseline and at hyperemic conditions, respectively (using the following rationale: the R0/RC value for the lower lines are larger than for the upper lines. Thus, by the inverse proportionality of RC, the RC values of the upper lines are larger than for the lower lines, and therefore the upper and lower lines refer to the baseline and hyperemic conditions, respectively). The disadvantage of the “baseline lines” (i.e., the upper lines) over the “hyperemic lines” (i.e., the lower lines) is that these “baseline lines” are far more curved than the “hyperemic lines.” So, the sensitivity of the FFR for changes for α is expected to be more uniform in the “hyperemic lines.” However, the disadvantage of the “hyperemic lines” (lower lines) is that the biasing influence of the venous pressure (PV) is more pronounced compared to the “baseline lines” (upper lines); notice that the distance between the lower “hyperemic lines” is larger compared to the distance between the higher “baseline lines.” The relevance of these findings—a more curved hyperemic line vs. a more pronounced influence of venous pressure—is in need of a clinical evaluation study, in particular for the region around the reference value FFR = 0.80. In addition, the difference between the baseline and hyperemic lines in the graph indicates that the reference value for FFR needs to be chosen significantly different for the hyperemic and baseline conditions.
• Thirdly, the FFR is a summary of two pressures, PD and PA, in one ratio, PD/PA. Our analysis (Figure 2) showed an ambiguous interpretation of the FFR. That is, a decrease (increase) of the FFR not necessarily results from an increase (decrease) of the degree of stenosis. In fact, an unambiguous interpretation of the FFR is only possible under the extra condition of a constant arterial pressure PA. This is a somewhat surprising finding because intuitively one expects the FFR to be controlled for variation in PA by the fact that the FFR normalizes PD to PA. In conclusion, in the present clinical experience with FFR the decrease in PD may be larger than in PA and, hence, the FFR will decrease with a worsening of the stenosis and the disturbing and ambiguous influence of varying PA is interpreted as random variations (noise). As a suggestion for further clinical research, the relative contribution of PD and PA on FFR can be easily assessed in clinical data by taking the logarithm of the FFR, i.e., ln(FFR) = ln(PD) – ln(PA) and, then performing a linear regression analysis to the line ln(FFR) = A*ln(PD) – B*ln(PA) + C; the size and significance of parameters A and B indicate the relative importance of PD and PA to FFR.
• Fourthly, given the complex dependence of the FFR on the degree of stenosis and the additional biasing influences of the venous pressure and capillary resistance, one might wonder whether the FFR as pressure ratio can be improved. To hint for an alternative: clearly the stenotic pressure drop, i.e., PA – PD in the model (Figure 1) is of key importance, but needs to be compared with the pressure drop over the capillary and venous part of the circulation, i.e., PD – PV. Hence, an obvious choice seems to define the alternative FFR as (PA – PD)/(PD – PV), which equals (F R0(α))/(F RC) = R0/RC 1/α2 (by Equation 11) or, reversely, by rewriting to get α at the left side, the measure of the degree of stenosis is α = √{R0/RC (PD – PV)/(PA – PD)}. Although this alternative provides explicitly the degree of stenosis and is free of a biasing influence of the venous pressure, this alternative still suffers from the influence of the intra- and inter-individually varying baseline stenotic and capillary resistances. Probably this is a drawback of all attempts to characterize stenotic resistances by a measure based on pressure measurements alone. Fundamentally, limitations of myocardial perfusion due to arterial coronary stenosis are best described by pressure-flow relationships but, in clinical practice, such investigations are often limited to the estimation of coronary artery diameter, pressure, or flow. So, the best practice needs to be found by a mathematical-physical approach, further guided by a subsequent clinical evaluation of stenotic measures.
This completes the discussion of our main objectives regarding the in silico study.
The comparison of the outcomes of the in silico study with the clinical patient data regarding coronary diameter (reduction) yields the following results:
• The in silico model predicts a relation of FFRC = (see Equation 7). Indeed, the clinical data in Figure 6 reveals such a quadratic relation, but with a large amount of scatter due to inter-individual variation of PA.
• The in silico model predicts a S-shaped dependence of FFR on α (Figure 3, upper-left panel). Indeed, the clinical data in Figure 7 shows the upper part of the S-shaped form, while the lower part of the S-shape (severe stenosis) is not visible in Figure 7 simply because these severe cases of stenosis are not present in our clinical data set. So, the clinical data is in accordance with the in silico model prediction. Note that different measures of stenosis are used. Figure 7 shows both the stenotic diameter reduction and α, while in Figure 3 the free lumen area based metric α is used.
• The in silico model predicts, for an increasing degree of stenosis, a decreasing density of cases in the plot of PD vs. PA (see Figure 4) and, indeed, this is observed in the clinical data of Figure 5.
• The in silico model predicts a linear relation between FFR and PD with a slope PA−1, for the case of a constant PA (that is a straight line from the lower-left corner to the upper-right corner). In Figure 8 the clinical data indeed shows this relation in presence of a large amount of scatter due to inter-individual variation of PA. Based on the calculation of c1 and c2 (derived from Figure 5) a best fitting curve (blue) was constructed. If a tentative second criterion (PD cut-off e.g., at 50 mmHg) is applied, then the data points in the red shaded rectangular are do not meet both requirements. This choice implies that two patients are judged to have a functional coronary stenosis despite the fact that their FFR > 0.80. Obviously, this approach assumes that the cut-offs for FFR and PD are independent. Therefore, it is very well-conceivable that the criterion for FFR may vary with the prevailing PD level. Based on machine learning methods we have already demonstrated the applicability of a non-linear divider when analyzing ejection fraction in heart failure patients (21).
• For FFR, a “gray zone” has been discussed in the literature with values between 0.80 and 0.75 (1). Although this range covers only 5% of the complete theoretical range, the more important issue is the fact that a substantial portion of patients is located within this range of uncertainty. This completes the confirmation of the in silico study predictions by our clinical data.
To put our study in perspective: Various modeling approaches have been employed to evaluate the severity of coronary stenosis (22). Some investigators (23) applied numerical modeling of the flow in a stenosed coronary artery in relation to main hemodynamic parameters. Using a resistive model of an epicardial stenosis (0–80% diameter reduction) in series with the coronary microcirculation at maximal vasodilation, FFR was evaluated for changes in coronary microvascular resistance (0.1–0.6 mmHg.min/ml), aortic pressure (between 70 and 130 mmHg), and coronary outflow pressure (0–15 mmHg), and it was found that the sensitivity of FFR to these hemodynamic changes was highest for stenoses of intermediate severity (23). Recent studies employ either a patient-specific lumped-parameter model of the coronary circulation (9) or applied the SimVascular Cardiovascular Modeling Package (24). Meta-analysis of FFR vs. quantitative coronary angiography and non-invasive imaging for evaluations of myocardial ischemia resulted in relatively poor concordance among outcomes (22). Furthermore, a visual-functional mismatch has been reported between coronary angiography and FFR (25). Pellicano et al. documented that angiography derived expressions for FFR matched those using traditional pressure ratios, thus claiming to integrate anatomy and physiology (26).
In contrast, our investigation concerns in silico studies, combined with actual patient data for the RCA; the characteristics (i.e., the scale property and the bias) of the FFR are described as a man-made measure (technical term estimator) of arterial coronary stenosis in a simple resistive model of the coronary circulation similar to the original model used by Pijls and De Bruyne. The higher FFR sensitivity for stenoses of intermediate severity was confirmed (23). Moreover, the profound influence of venous pressure was emphasized but the main difference with earlier approaches is the introduction of FFRC as a co-measure of FFR. Our graphical-mathematical analysis (with use of Cartesian and polar coordinates) indicates clearly that summarizing two pressures (PD and PA) in one ratio (FFR) only partly captures the information actually collected, and that the complementary information contained in the companion FFRC appears to be clinically relevant. As a provocative example: Consider the case of an FFR = 0.80 calculated form PD = 40 mmHg, and a worrisome low PA = 50 mmHg. This situation implies that the patient is both hypotensive (27) and that the perfusion pressure is low. Yet, the FFR is not abnormal. One would object, of course, that the PD and PA pressures themselves are clear warning signs. But that is precisely the point we emphasize, as their ratio (the FFR) is an inadequate summary of two separately already relevant pressures. One must take into account both pressures, or the combination of FFR and the FFRC to acquire the full picture. Only under the very restrictive condition that the FFRC is constant, the FFR is an unambiguous measure of the degree of stenosis. In summary, our investigation evaluates the characteristics of the FFR as measure of the degree of stenosis; our main conclusion is that the FFR is insufficient a measure of stenosis because: (1) the FFR (without FFRC) cannot be interpreted unambiguously; (2) the FFR is on ordinal scale (unit differences in FFR are not proportional to unit changes in stenosis with as result that standard statistics, like means, standard deviations, Student's t-test) do not apply and non-parametric methods must be applied; (3) the uncontrolled influences of venous and aortic pressure and the capillary resistance on the FFR present themselves in the final results as random variations (noise) while, factually, these variations originate from imperfections of the FFR as metric.
Pressure loss across a stenosis is a function of resistance, whose components include morphologic factors (including stenosis entrance angle, orifice configuration, length of stenosis, exit angles) as well as physiologic factors such as flow and associated myocardial supply area (28). Recently, the incremental value of also considering the subtended myocardial mass for identifying FFR-verified ischemia was confirmed using quantitative CT angiography (29). Furthermore, as explicitly formulated in an editorial, the question arises “which of the two instruments for gauging stenosis, FFR or angiography, is at fault” (30). Given the rather constant diameter (among comparable individuals) of the unaffected vessel (which variable is the rather constant number in the denominator for % diameter reduction), it would seem that changes for the pertinent hypotenuse, here associated with diameter reductions due to occlusion, are less pronounced compared to the hypotenuse variation associated with FFR determinations, as PA (which is the denominator in FFR) is subjected to a wide range of variations.
This completes the discussion of our analysis against the background of studies which employ FFR as a gold standard to evaluate functional limitations associated with epicardial coronary artery stenosis.
Limitations
Our model-based evaluation of the FFR as measure of the degree of stenosis was based on the simple model of the coronary circulation originally used (7). As a result, our study is limited because of (1) the use of Poiseullian resistances in a model that neglects the influences of a non-Poiseuillian pressure-flow relation in the coronary arteries, (2) the neglect of neural and hormonal factors and the autoregulation in the microvascular bed (prearterioles), (3) the neglect of the geometry of the coronary tree, (4) sex-specific differences, extensively reported in the literature (2, 31), were not investigated. Preliminary analysis showed that our approach is still feasible to arrive at similar results for the more complicated cases with non-Poiseuillian and autoregulatory effects on resistance. Moreover, the present model's focus is on hemodynamic resistances only while neglecting the Windkessel dynamics of the coronary system, but a preliminary analysis shows that similar results are found by using a model including the Windkessel properties, yet the manuscript's margin is too small to provide details.
Also, it must be noted that all studies relating FFR to relative stenosis severity, including our own investigation, compare two dimensionless ratio-based metrics (32). Such comparisons neglect the corresponding companion metrics. While both constituents of FFRC may assume a wide range of values (see e.g., Figure 5), it can be stated that the denominator term in the α or S% metrics have a rather fixed value for each vessel, given any particular patient while taking into account body mass and sex (31). The rather fixed reference level in case of diameters or areas clearly renders a more insightful interpretation to this sub-group of ratios.
The FFR approach is limited from a technical point of view, as it only considers hyperemic data. Inclusion of baseline values recorded for PA and PD may assist in developing a more comprehensive characterization of myocardial perfusion abnormalities.
Conclusions
The dependence of the FFR on the degree of stenosis shows an S-shaped form. Consequently, FFR is a measure of the ordinal scale. Moreover, the marked disturbing influences of the aortic and venous pressures and the capillary resistance on the FFR will be significantly manifested as random variations (noise) in intra- and inter-individual clinical results. These problems are partly caused by the neglect of the FFR's companion, namely the FFRC (32). Taken together, the combined use of FFR and FFRC, or alternatively PD and PA when considered in unison, provide more complete information on a flow limiting coronary stenosis. When analyzing ratios, it may also be useful to consider a logarithmic transformation.
Ethics Statement
This retrospective study in patients from Cardiovascular Center, Aalst, was exempt from permission, as stated by the local ethics committee. All patients provided permission to use their data for investigational purposes.
Author Contributions
TF designed the study, developed the software for the simulation studies, and wrote the initial version. RM developed the first versions of the software for the simulation studies and contributed to the text. GH collected patient data and implemented clinical background. PK designed the study, illustrated clinically relevant aspects, and complemented the text.
Conflict of Interest
The authors declare that the research was conducted in the absence of any commercial or financial relationships that could be construed as a potential conflict of interest.
Abbreviations
α, degree of cross sectional area narrowing for a coronary artery stenosis; A, cross-sectional area; B, baseline; C, vascular compliance; CFD, computational fluid dynamics; F, myocardial blood flow; FN, non-stenotic flow; FFR(C), fractional flow reserve (companion); H, hyperemia; L, full length of a coronary vessel; LS, length of local stenosis; L, blood mass inertance; N, non-stenotic case; cf. S; PA, coronary pressure proximal from the stenosis; PD, coronary pressure distal of the stenosis; PV, venous pressure; R, Poiseuille resistance; RA, hemodynamic resistance (mmHg.s/ml) of the arterial part; RC, hemodynamic resistance (mmHg.s/ml) of the capillary and venous parts; R0, hemodynamic resistance (mmHg.s/ml) of the coronary artery without stenosis; RCA, right coronary artery; S, stenosis; cf. N; S (%), diameter-based percentage of stenosis; cf. α.
References
1. Heyndrickx GR, Tóth GG. The FAME trials: impact on clinical decision making. Interv Cardiol. (2016) 11:116–9. doi: 10.15420/icr.2016:14:3
2. Taqueti VR. Sex differences in the coronary system. In: Kerkhof PLM, Miller VM, editors. Sex-Specific Analysis of Cardiovascular Function. Cham: Springer (2018). p. 257–78. doi: 10.1007/978-3-319-77932-4_17
3. Kang SJ, Ahn JM, Han S, Lee JY, Kim WJ, Park DW, et al. Sex differences in the visual-functional mismatch between coronary angiography or intravascular ultrasound versus fractional flow reserve. JACC Cardiovasc Interv. (2013) 6:562–8. doi: 10.1016/j.jcin.2013.02.016
4. Kim CH, Koo BK, Lee JM, Shin ES, Park J, Choi KH, et al. Influence of sex on relationship between total anatomical and physiologic disease burdens and their prognostic implications in patients with coronary artery disease. J Am Heart Assoc. (2019) 8:e011002. doi: 10.1161/JAHA.118.011002
5. Kerkhof PLM, Osto E, Tona F, Heyndrickx GR, Handly N. Sex-specific interpretation of coronary flow reserve and fractional flow reserve metrics, including their companions. Conf Proc IEEE Eng Med Biol Soc. (2019) 2019:7006–9. doi: 10.1109/EMBC.2019.8857589
6. Topol EJ, Nissen SE. Our preoccupation with coronary luminology. The dissociation between clinical and angiographic findings in ischemic heart disease. Circulation. (1995) 92:2333–42. doi: 10.1161/01.CIR.92.8.2333
7. Pijls NHJ, De Bruyne B. Coronary pressure measurement and fractional flow reserve. Heart. (1998) 80:539–42. doi: 10.1136/hrt.80.6.539
8. Kerkhof PLM, Mérillon JP, Yoo BW, Peace RA, Parry G, Heyndrickx GR, et al. The Pythagorean theorem reveals the inherent companion of cardiac ejection fraction. Int J Cardiol. (2018) 270:237–43. doi: 10.1016/j.ijcard.2018.06.074
9. Duanmu Z, Yin M, Fan X, Yang X, Luo X. A patient-specific lumped-parameter model of coronary circulation. Nat Sci Rep. (2018) 8:874. doi: 10.1038/s41598-018-19164-w
10. Westerhof N, Stergiopulos N, Noble M. Snapshots of Hemodynamics: An Aid for Clinical Research and Graduate Education. New York, NY: Springer (2010).
11. Kerkhof PLM, van de Ven PM, Yoo BW, Peace RA, Heyndrickx GR, Handly N. Ejection fraction as related to basic components in the left and right ventricular volume domains. Int J Cardiol. (2018) 255:105–10. doi: 10.1016/j.ijcard.2017.09.019
12. Sankaran S, Kim HJ, Choi G, Taylor CA. Uncertainty quantification in coronary blood flow simulations: impact of geometry, boundary conditions and blood viscosity. J Biomech. (2016) 49:2540–7. doi: 10.1016/j.jbiomech.2016.01.002
13. Morris PD, Silva Soto DA, Feher JFA, Rafiroiu D, Lungu A, Varma S, et al. Fast virtual fractional flow reserve based upon steady-state computational fluid dynamics analysis: results from the VIRTU-Fast study. JACC Basic Transl Sci. (2017) 2:434–46. doi: 10.1016/j.jacbts.2017.04.003
14. Fossan FE, Sturdy J, Müller LO, Strand A, Bråten AT, Jørgensen A, et al. Uncertainty quantification and sensitivity analysis for computational FFR estimation in stable coronary artery disease. Cardiovasc Eng Technol. (2018) 9:597–622. doi: 10.1007/s13239-018-00388-w
15. Shiono Y, Kubo T, Tanaka A, Kitabata H, Ino Y, Tanimoto T, et al. Impact of myocardial supply area on the transstenotic hemodynamics as determined by fractional flow reserve. Catheter Cardiovasc Interv. (2014) 84:406–13. doi: 10.1002/ccd.25300
16. Blanco PJ, Bulant CA, Müller LO, Talou GDM, Bezerra CG, Lemos PA, et al. Comparison of 1D and 3D models for the estimation of fractional flow reserve. Sci Rep. (2018) 8:17275. doi: 10.1038/s41598-018-35344-0
17. Chu M, Dai N, Yang J, Westra J, Tu S. A systematic review of imaging anatomy in predicting functional significance of coronary stenoses determined by fractional flow reserve. Int J Cardiovasc Imaging. (2017) 33:975–90. doi: 10.1007/s10554-017-1085-3
18. Kern MJ, Seto AH. Is instantaneous wave-free ratio a new standard of care for physiologic assessment of coronary lesions? More questions than answers. Circulation. (2017) 136:2295–7. doi: 10.1161/CIRCULATIONAHA.117.029567
19. Kern MJ, Seto AH. Agreement and differences among resting coronary physiological indices – Are all things equal? J Am Coll Cardiol. (2017) 17:2124–7. doi: 10.1016/j.jacc.2017.08.069
20. Tóth GG, Wijns W. Circulus vitiosus of validation. Eur Heart J. (2018) 39:4082–5. doi: 10.1093/eurheartj/ehy724
21. Alonso-Betanzos A, Bolón-Canedo V, Heyndrickx GR, Kerkhof PL. Exploring guidelines for classification of major heart failure subtypes by using machine learning. Clin Med Insights Cardiol. (2015) 9(Suppl. 1):57–71. doi: 10.4137/CMC.S18746
22. Christou MAC, Siontis CM, Katritsis DG, Ioannidis JPD. Meta-analysis of fractional flow reserve versus quantitative coronary angiographys and noninvasive imaging for evaluations of myocardial ischemia. Am J Cardiol. (2007) 99:450–6. doi: 10.1016/j.amjcard.2006.09.092
23. Shalman E, Rosenfeld M, Dgany E, Einav S. Numerical modeling of the flow in stenosed coronary artery. The relationship between main hemodynamic parameters. Comput Biol Med. (2002) 32:329–44. doi: 10.1016/S0010-4825(01)00033-6
24. Lan H, Updegrove A, Wilson NM, Maher GD, Shadden SC, Marsden AL. A Re-engineered software interface and workflow for the open-source SimVascular Cardiovascular Modeling Package. J Biomech Eng. (2018) 140:024501-1–11. doi: 10.1115/1.4038751
25. Park SJ, Kang SJ, Ahn JM, Shim EB, Kim YT, Yun SC, et al. Visual-functional mismatch between coronary angiography and fractional flow reserve. JACC Cardiovasc Interv. (2012) 5:1029–36. doi: 10.1016/j.jcin.2012.07.007
26. Pellicano M, Lavi I, De Bruyne B, Vaknin-Assa H, Assali A, Valtzer O, et al. Validation study of image-based fractional flow reserve during coronary angiography. Circ Cardiovasc Interv. (2017) 10:e005259. doi: 10.1161/CIRCINTERVENTIONS.116.005259
27. Verdier-Watts F, Rioufol G, Mewton N, Sanchez I, Green L, Bonnefoy-Cudraz E, et al. Influence of arterial hypotension on fractional flow reserve measurements. EuroIntervention. (2015) 1:416–20. doi: 10.4244/EIJV11I4A82
28. Kern MJ. Seeing and not believing: understanding the visual-functional mismatch between angiography and FFR. Catheter Cardiovasc Interv. (2014) 84:414–5. doi: 10.1002/ccd.25616
29. Yang DH, Kang SJ, Koo HJ, Kweon J, Kang JW, Lim TH, et al. Incremental value of subtended myocardial mass for identifying FFR-verified ischemia using quantitative CT angiography: comparison with quantitative coronary angiography and CT-FFR. JACC Cardiovasc Imaging. (2019) 12:707–17. doi: 10.1016/j.jcmg.2017.10.027
30. Seiler C. Deconstructing the idol of fractional flow reserve using the IDEAL report. Eur Heart J. (2016) 37:2081–3. doi: 10.1093/eurheartj/ehv688
31. Kerkhof PLM, Peace RA, Macfarlane PW. Sex- and age-related reference values in cardiology, with annotations and guidelines for interpretation. Adv Exp Med Biol. (2018) 1065:677–706. doi: 10.1007/978-3-319-77932-4_41
Keywords: coronary circulation, coronary stenosis, degree of stenosis, fractional flow reserve, mathematical model, clinical metrics, in silico study
Citation: Faes TJC, Meer R, Heyndrickx GR and Kerkhof PLM (2020) Fractional Flow Reserve Evaluated as Metric of Coronary Stenosis — A Mathematical Model Study. Front. Cardiovasc. Med. 6:189. doi: 10.3389/fcvm.2019.00189
Received: 03 January 2019; Accepted: 11 December 2019;
Published: 14 January 2020.
Edited by:
Gabriela Kania, University Hospital Zürich, SwitzerlandReviewed by:
Daniele Torella, University of Catanzaro, ItalyFrancesco Tona, University of Padova, Italy
Copyright © 2020 Faes, Meer, Heyndrickx and Kerkhof. This is an open-access article distributed under the terms of the Creative Commons Attribution License (CC BY). The use, distribution or reproduction in other forums is permitted, provided the original author(s) and the copyright owner(s) are credited and that the original publication in this journal is cited, in accordance with accepted academic practice. No use, distribution or reproduction is permitted which does not comply with these terms.
*Correspondence: Theo J. C. Faes, tjc.faes@amsterdamumc.nl
†ORCID: Guy R. Heyndrickx orcid.org/0000-0003-3553-3985
Peter L. M. Kerkhof orcid.org/0000-0001-9488-633X