Gene Expression Profiling Reveals the Shared and Distinct Transcriptional Signatures in Human Lung Epithelial Cells Infected With SARS-CoV-2, MERS-CoV, or SARS-CoV: Potential Implications in Cardiovascular Complications of COVID-19
 Prabhash Kumar Jha
 Aatira Vijay2†
  Arda Halu
 Shizuka Uchida
 Masanori Aikawa
- 1Center for Excellence in Vascular Biology, Brigham and Women's Hospital, Harvard Medical School, Boston, MA, United States
- 2Department of Cardiovascular and Metabolic Sciences, Lerner Research Institute, Cleveland Clinic, Cleveland, OH, United States
- 3Center for Interdisciplinary Cardiovascular Sciences, Brigham and Women's Hospital, Harvard Medical School, Boston, MA, United States
- 4Channing Division of Network Medicine, Brigham and Women's Hospital, Harvard Medical School, Boston, MA, United States
- 5Department of Clinical Medicine, Center for RNA Medicine, Aalborg University, Copenhagen, Denmark
Severe acute respiratory syndrome coronavirus 2 (SARS-CoV-2) is the causative virus for the current global pandemic known as coronavirus disease 2019 (COVID-19). SARS-CoV-2 belongs to the family of single-stranded RNA viruses known as coronaviruses, including the MERS-CoV and SARS-CoV that cause Middle East respiratory syndrome (MERS) and severe acute respiratory syndrome (SARS), respectively. These coronaviruses are associated in the way that they cause mild to severe upper respiratory tract illness. This study has used an unbiased analysis of publicly available gene expression datasets from Gene Expression Omnibus to understand the shared and unique transcriptional signatures of human lung epithelial cells infected with SARS-CoV-2 relative to MERS-CoV or SARS-CoV. A major goal was to discover unique cellular responses to SARS-CoV-2 among these three coronaviruses. Analyzing differentially expressed genes (DEGs) shared by the three datasets led to a set of 17 genes, suggesting the lower expression of genes related to acute inflammatory response (TNF, IL32, IL1A, CXCL1, and CXCL3) in SARS-CoV-2. This subdued transcriptional response to SARS-CoV-2 may cause prolonged viral replication, leading to severe lung damage. Downstream analysis of unique DEGs of SARS-CoV-2 infection revealed changes in genes related to apoptosis (NRP1, FOXO1, TP53INP1, CSF2, and NLRP1), coagulation (F3, PROS1, ITGB3, and TFPI2), and vascular function (VAV3, TYMP, TCF4, and NR2F2), which may contribute to more systemic cardiovascular complications of COVID-19 than MERS and SARS. The study has uncovered a novel set of transcriptomic signatures unique to SARS-CoV-2 infection and shared by three coronaviruses, which may guide the initial efforts in the development of prognostic or therapeutic tools for COVID-19.
Introduction
The novel severe acute respiratory syndrome coronavirus 2 (SARS-CoV-2) belongs to the Coronaviridae family of viruses (coronaviruses) and is responsible for the coronavirus disease 2019 (COVID-19) pandemic (1). Along with its other accomplices, Middle East respiratory syndrome coronavirus (MERS-CoV) and severe acute respiratory syndrome coronavirus (SARS-CoV), SARS-CoV-2 can jump species barrier followed by human-to-human transmission via droplet infection. In late December 2019, initial reports suggested the origin of SARS-CoV-2 in a seafood and wild animal trading market in Wuhan, China (2). To date, the pandemic has caused more than 83 million infections and more than 1.8 million deaths worldwide (https://www.worldometers.info/coronavirus/). SARS-CoV-2 leads to more cardiovascular complications than do MERS-CoV and SARS-CoV; however, what causes these major differences remains obscure (3, 4).
The initial genome identification of SARS-CoV-2 suggested that it has a ~80% similarity with SARS-CoV and 96% identical to a bat coronavirus; however, there are differences in its pathogenicity and host response (2). The virus nucleic acid shedding patterns in both symptomatic and asymptomatic patients of SARS-CoV-2 are similar, which explains the transmission potential of otherwise asymptomatic carriers (5). In contrast, the viral burden in the upper respiratory tract in SARS-CoV infection peaks at around 10 days after the initial exposure (6). On the contrary to SARS-CoV-2, viral load in MERS-CoV–infected individuals peak at week 2 of the onset of infection (7). This suggests the difference in the virulence and host response of these three strains.
Upon entry, next steps are viral replication, amplification, and spread in the host, which largely depend on similarities and/or uniquenesses in transcriptional signature of these viruses. Patients with SARS-CoV-2 manifest a few different but aggravated symptoms, particularly major cardiovascular complications, from SARS-CoV and MERS-CoV, which may be attributable to the difference in their transcriptional signatures. Reports of aggravated blood coagulation in COVID-19 patients suggested the mechanism of prominent elevation of D-dimer and fibrin/fibrinogen degradation products (8). Higher mortality rate is reported in COVID-19 patients with thromboembolic events (9), and treatment with anticoagulant-heparin has improved prognosis (10).
The present comparative analysis has determined key differences in transcriptional changes in lung epithelial cells induced by these virus strains. To further examine transcriptional responses of SARS-CoV-2 and other two coronaviruses, we analyzed a comprehensive map of lung epithelial cells infected with these three coronaviruses and explored pathological host responses unique to SARS-CoV-2. Our findings may help to understand potential mechanisms by which SARS-CoV-2 causes more cardiovascular complications than do two other coronaviruses and to establish molecular bases for the development of therapies against COVID-19.
Methods
RNA Sequencing and Microarray Analysis of Gene Expression Omnibus Datasets
Figure 1A depicts the workflow of gene expression analysis. For differential gene expression analysis of SARS-CoV-2 infection, raw expression counts were downloaded from Gene Expression Omnibus (GEO) accession number GSE147507 (11). RNA sequencing (RNAseq) dataset was generated on Illumina Nextseq 500 platform. The raw read counts were normalized by log2 transformation, before and after normalization box plot; principal component analysis (PCA) and density plot are shown in Supplementary Figure 1. Using INMEX tool that employs DESeq (12, 13), differential expression analysis was performed and differentially expressed genes (DEGs) were characterized for each sample with adjusted p < 0.05 [false discovery rate (FDR) corrected by Benjamini–Hochberg method]. GSE81909, the dataset we used for analysis of MERS-CoV, was generated on Agilent-Whole Human Genome Microarray 4x44K G4112. After downloading the raw read counts from GEO, we normalized the dataset using variance-stabilizing normalization followed by quantile normalization (14). Before and after normalization box plot, PCA and density plot are shown in Supplementary Figure 2. Similarly, we downloaded raw read counts of GSE17400 (15) for analysis of SARS-CoV infection. This dataset was generated on Affymetrix Human Genome U133 plus 2.0 Array. After normalization of dataset using variance-stabilizing normalization followed by quantile normalization (Supplementary Figure 3), both microarray datasets, GSE81909 and GSE17400, were subjected to DEGs analysis using LIMMA algorithm (16). DEGs were characterized for each sample with adjusted p < 0.05 (FDR corrected by Benjamini–Hochberg method). Heatmap visualization of a subset of 25 overexpressed and underexpressed genes was constructed using heatmap.2 from the gplot package in R. Volcano plots were constructed using custom scripts in R, and PCA was performed on log2 fold-change values using PMA package in R (17) (Supplementary Figure 4). It is worthwhile mentioning that all three datasets used in this study are collected from different laboratories and using different cell lines, as well as experimental techniques (e.g., microarrays, RNAseq). We selected RNAseq dataset for SARS-CoV-2 as there were especially no microarray datasets on SARS-CoV-2 in humans. Therefore, we did take the present analysis strategy of comparing each dataset with its internal control to call the DEGs for each coronavirus infection. Further, we compared the three sets of DEGs to find the shared and unique genes between coronavirus infections; we applied this strategy to minimize data variabilities (e.g., operator and platform biases). GSE147507 was generated in primary human lung epithelium (NHBE); GSE81909 was generated in human airway epithelial cells, whereas GSE17400 was generated in human bronchial epithelial cells. Supplementary Table 1 provides detailed information of each dataset and sequencing/microarray platform used.
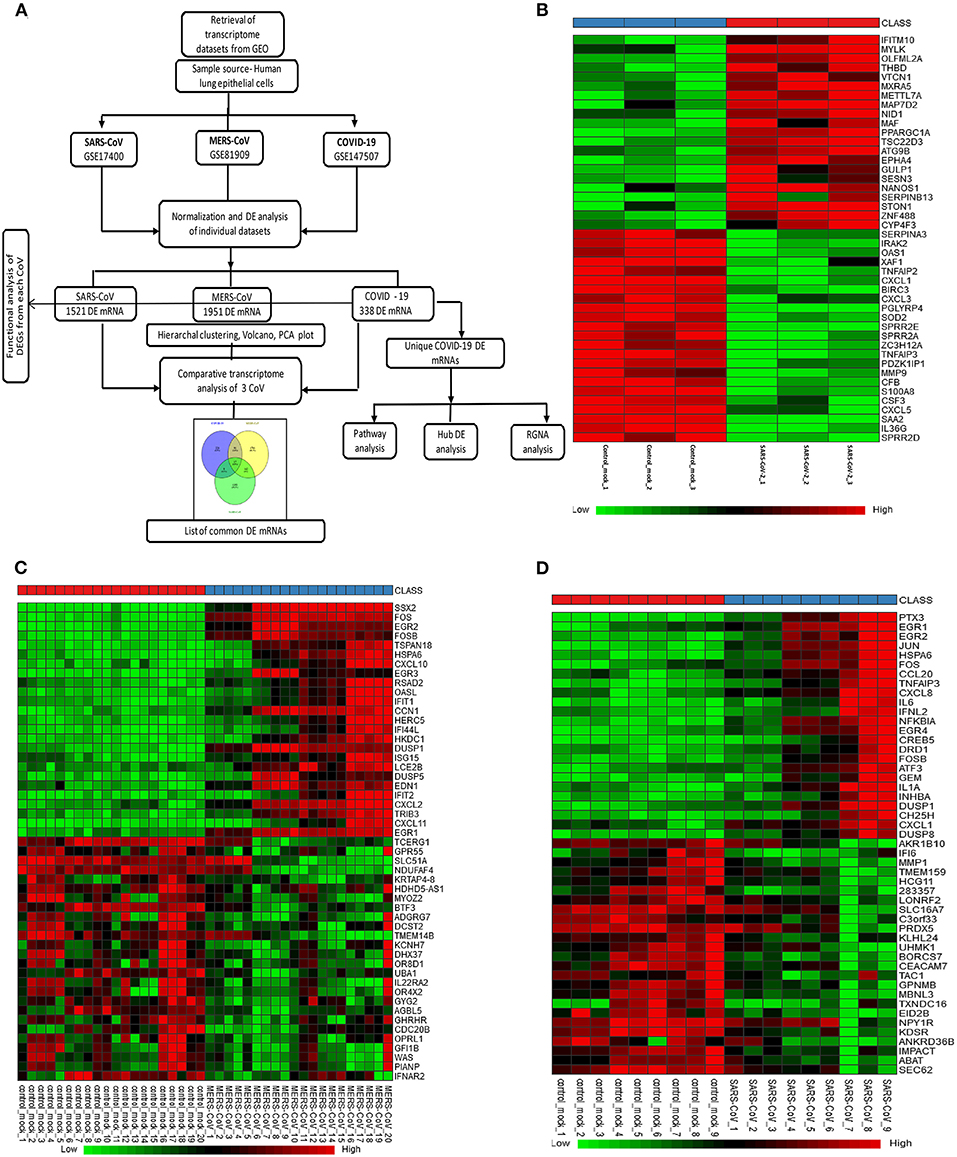
Figure 1. Gene expression profiles of the differentially expressed genes (DEGs) in human lung epithelial cells infected with coronaviruses. (A) Workflow of gene expression analysis. Selection process of eligible datasets for transcriptome analysis was based on datasets generated from infection of human lung epithelial cell in culture with SARS-CoV-2, MERS-CoV, or SARS-CoV. SARS-CoV-2, severe acute respiratory syndrome coronavirus 2; CoV, coronavirus; MERS-CoV, Middle East respiratory syndrome coronavirus; SARS-CoV, severe acute respiratory syndrome coronavirus and GEO, Gene Expression Omnibus. (B–D) Heatmaps of expression profiles for the top 25 increased and 25 decreased DEGs obtained from RNA-seq data analysis. Clustering of selected genes on the heatmap was performed by hierarchical clustering algorithm using Euclidean distance measure. (B) SARS-CoV-2, (C) MERS-CoV, and (D) SARS-CoV.
Functional Gene Set Enrichment Analysis of DEGs
To discern the implication of DEGs called from transcriptome analysis of coronavirus infection in lung epithelial cells, we performed a functional analysis using the EnrichR platform (18). This web-based software product evaluates significantly enriched pathways/terms in an input gene list with the help of its extensive gene set libraries, which includes Gene Ontology (GO) (19) and various pathway analysis libraries such as Kyoto Encyclopedia of Genes and Genomes (KEGG) pathway, Reactome pathway, wikipathway, Panther, and Biocarta. We retrieved tables of enriched pathways from each database and prepared a comprehensive table of most significant pathways for each coronavirus infection based on the adjusted p value (ranking derived from Fisher exact test for gene sets) significance.
Common DEGs Analysis Between Coronaviruses
We created a coronavirus–gene network for better visualization of the shared genes between the coronaviruses using Cytoscape software (20). The network was generated by utilizing the list of DEGs from three coronaviruses studies in which coronaviruses are the source nodes; genes are the target nodes, and the connections between them are the edges in the network. The network core represents the coronaviruses, whereas the inner-circle genes in the network are the shared ones, and outer-circle genes are unique to each coronavirus (Figure 2C). A Venn diagram representing the shared and unique DEG portion between three coronaviruses was generated using VENNY 2.1 tool (https://bioinfogp.cnb.csic.es/tools/venny/index.html). A heatmap represents the expression profiles for common DEGs between coronaviruses. Clustering of selected genes on the heatmap was performed by hierarchical clustering algorithm utilizing Euclidean distance measure.
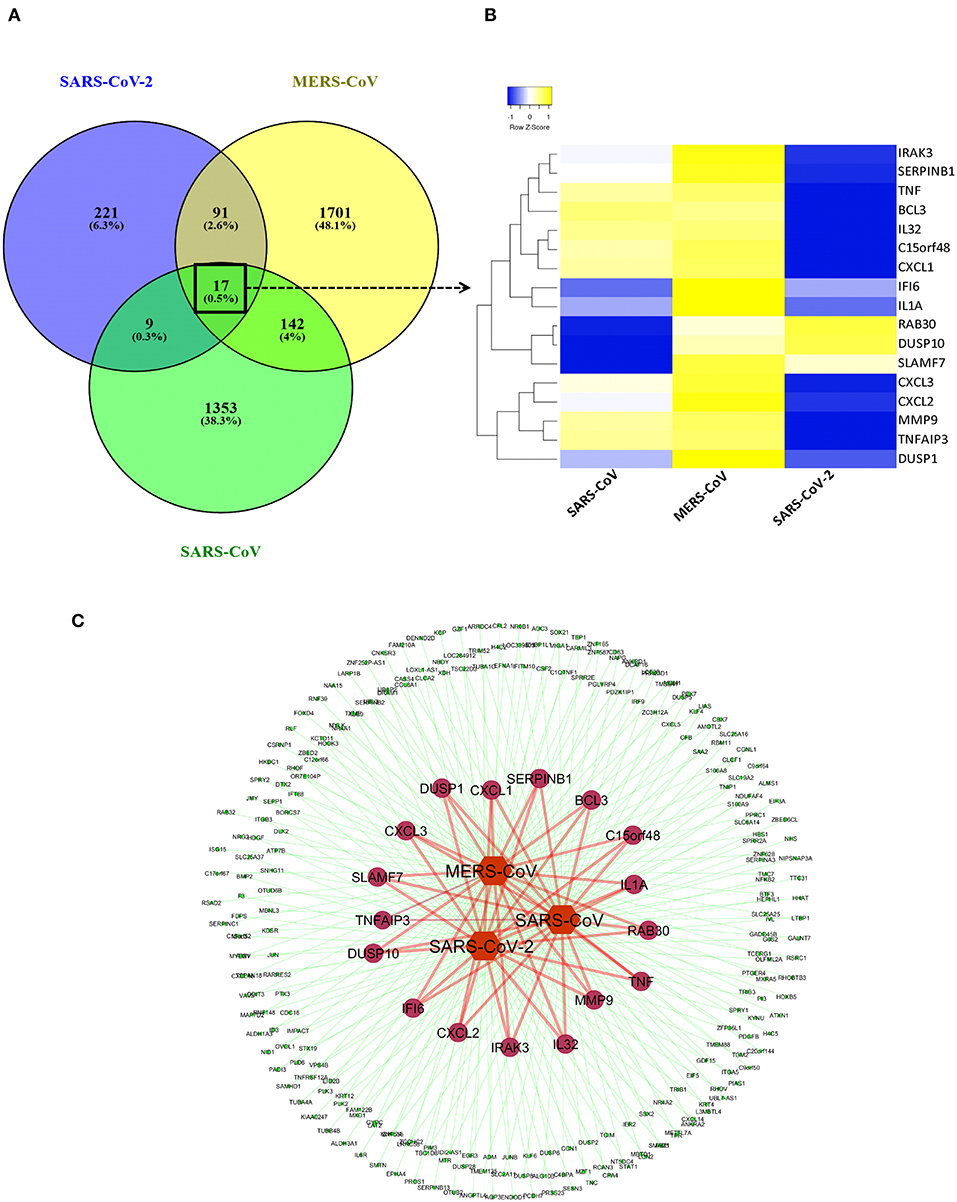
Figure 2. Shared transcriptional signatures between the three coronaviruses. (A) Venn diagram representing the shared and unique DEGs portion between three coronaviruses. (B) Heatmap representation of expression profiles for the common DEGs between coronaviruses. Clustering of selected genes on the heatmap was performed by hierarchical clustering algorithm using Euclidean distance measure. Expression scale: blue (low expression) to yellow (high expression). (C) coronavirus–gene network representing the shared and unique DEGs. Network was created between coronaviruses and their top 100 DEGs on cytoscape platform. Network core represents the coronaviruses (source nodes) and gene (target nodes). Inner circles of genes in the network are the shared ones, while outer circle genes are unique to each coronavirus.
Pathway Clustering and Network-Based Hub Gene Analysis
For visualization and interpretation of the biological relevance of unique DEGs to SARS-CoV-2 DEGs, Cytoscape v3.1 plug-in was used for analysis. Biological pathway clustering analysis was done using BinGO (21). BinGO analyzes GO terms and functional groups association within the biological networks. We performed biological pathway clustering analysis to see collective function of these genes. The size of a node is proportional to the number of targets in the biological process category. The color represents enrichment significance—the deeper the color on a color scale, the higher the enrichment significance. Hub gene network analysis was performed using NetworkAnalyst (13), which created a protein–protein interaction (PPI) network by integrating the InnateDB interactome with the original seed of 221 DEGs. This tool supports integrative analysis of gene expression data through statistical, visual, and network-based analysis approaches by taking the advantage of common functions for network topology and module analysis approaches. Briefly, the complete list of unique DEGs from SARS-CoV-2 was uploaded into the web-based server of NetworkAnalyst. Network construction was restricted to contain all the original seed proteins in order to visualize the connections. To help identify highly interconnected hub nodes, topological measures (e.g., degree and betweenness centrality) were used. Expression of the genes was considered as the network feature, where red-colored nodes are genes with increased expression, green nodes are genes with decreased expression, and gray nodes are genes not expressed in our data.
Expression2Kinases Analysis of Regulatory Gene Networks
ChEA is a comprehensive databases of kinases and transcription factors (22), and it is used in background of Expression2Kinases (X2K) (23), the tool we used to understand the upstream regulatory molecules of DEGs in SARS-CoV-2 infection. The 10 most significant transcription factors and kinases were extracted based on Fisher exact test p value enrichment scoring. We downloaded the “.graphml” file generated from the analysis to create and visualize regulatory network on Cytoscape environment. This ensures that the protein network obtained during network expansion is properly connected by automatically increasing the path length, so that there are more intermediate proteins used to connect the transcription factors. In the network, a yellow node represents intermediate proteins in the PPI regulatory network. Node size represents the significance of protein based on adjusted p value; the bigger the nodes size, the higher the significance value.
Statistical Analyses
For differential expression analysis of SARS-CoV-2 dataset GSE147507, read counts were subjected to differential expression analysis using INMEX, which utilizes the Rpackage DESeq (13). Genes with adjusted p < 0.05 were considered significant. The p value adjustment for multiple comparisons was done by the Benjamini–Hochberg method. For MERS-CoV-GSE81909 and SARS-CoV-GSE17400, differential expression analysis was performed with LIMMA algorithm for each dataset, independently using adjusted p < 0.05, based on the FDR using the Benjamini–Hochberg method and moderated t test. Significantly enriched GO terms were identified using hypergeometric tests, and p ≤ 0.05 was applied as a cutoff for statistical significance.
Results
Selection of Eligible Gene Expression Datasets for Coronavirus Infection in Human Lung Epithelial Cells
We selected three studies from the GEO accession numbers: GSE147507 for SARS-CoV-2, GSE81909 for MERS-CoV, and GSE17400 for SARS-CoV. The search was limited to transcriptome data generated in human lung epithelial cells. Figure 1A depicts the overall workflow of the analysis in this study. A total of 3/3, 20/20, and 9/9 control/infected cell culture replicates SARS-CoV-2, MERS-CoV, and SARS-CoV, respectively, were used in this analysis. GSE147507 dataset was RNAseq data and generated on Illumina Nextseq 500, and we utilized only six samples (GSM4432378, GSM4432379, GSM4432380, GSM4432381, GSM4432382, and GSM4432383); these were independent biological triplicates of primary human lung epithelium (NHBE), which were mock treated or infected with SARS-CoV-2 (USA-WA1/2020). Of note, the other two datasets were generated by microarray using Affymetrix Human Genome U133A series (GSE17400-SARS-CoV) and Agilent-014850 Whole Human Genome Microarray 4x44K G4112F (GSE81909-MERS-CoV). Sample sources of all three datasets were of human lung epithelial cells and primary lung cells infected with coronaviruses. Supplementary Table 1 provides detailed information of each dataset and sequencing/microarray platform used.
Analysis of Differentially Expressed Genes (DEGs) in the SARS-CoV-2 Dataset Led to Perturbation of Inflammatory, Coagulation, and Apoptotic Pathways
In SARS-CoV-2–infected dataset (GSE147507), we identified a total of 338 DEGs with adjusted p < 0.05 (Supplementary Dataset 1). Among these 338 DEGs, 92 genes increased, and 246 decreased. Figure 1B depicts the heatmap of expression of top significant DEGs among the samples. Table 1 lists the top 20 increased and decreased DEGs from our analysis of SARS-CoV-2 infection. Interferon (IFN)–induced transmembrane protein 10 (IFITM10), C-X-C motif chemokine ligand 14 (CXCL14), and myosin light chain kinase (MYLK) were among the most significantly increased genes, while small proline-rich protein 2D (SPRR2D), interleukin 36 gamma (IL36G), and serum amyloid A2 (SAA2) were the most decreased genes in our analysis of SARS-CoV-2–infected lung epithelial cells compared to mock controls. When these DEGs were subjected to the analysis of overrepresented biological pathways and enriched terms, several pathways related to inflammation, apoptosis, blood coagulation, and lung fibrosis were enriched (Table 2). Enriched terms and biological pathways were significantly overrepresented in the gene list if they showed an adjusted p < 0.05. DEGs from SARS-CoV-2 infection were associated with the KEGG pathways such as IL-17 signaling pathway (hsa04657) with database overlap of 21/93 (which means of 93 genes associated with this pathway reported in KEGG, 21 are present among our DEGs) and adjusted p = 1.24E-15 and TNF signaling pathway (hsa04668) with database overlap of 19/110 and adjusted p = 4.76E-12. Besides, other databases resulted in enrichment of pathways including blood coagulation (P00011) with overlap of 7/38 and adjusted p = 1.67E-04, apoptosis signaling pathway (P00006) with overlap of 7/102 and adjusted p = 0.038822, and lung fibrosis (WP3624) with overlap of 11/63 and adjusted p = 4.53E-07, among others.
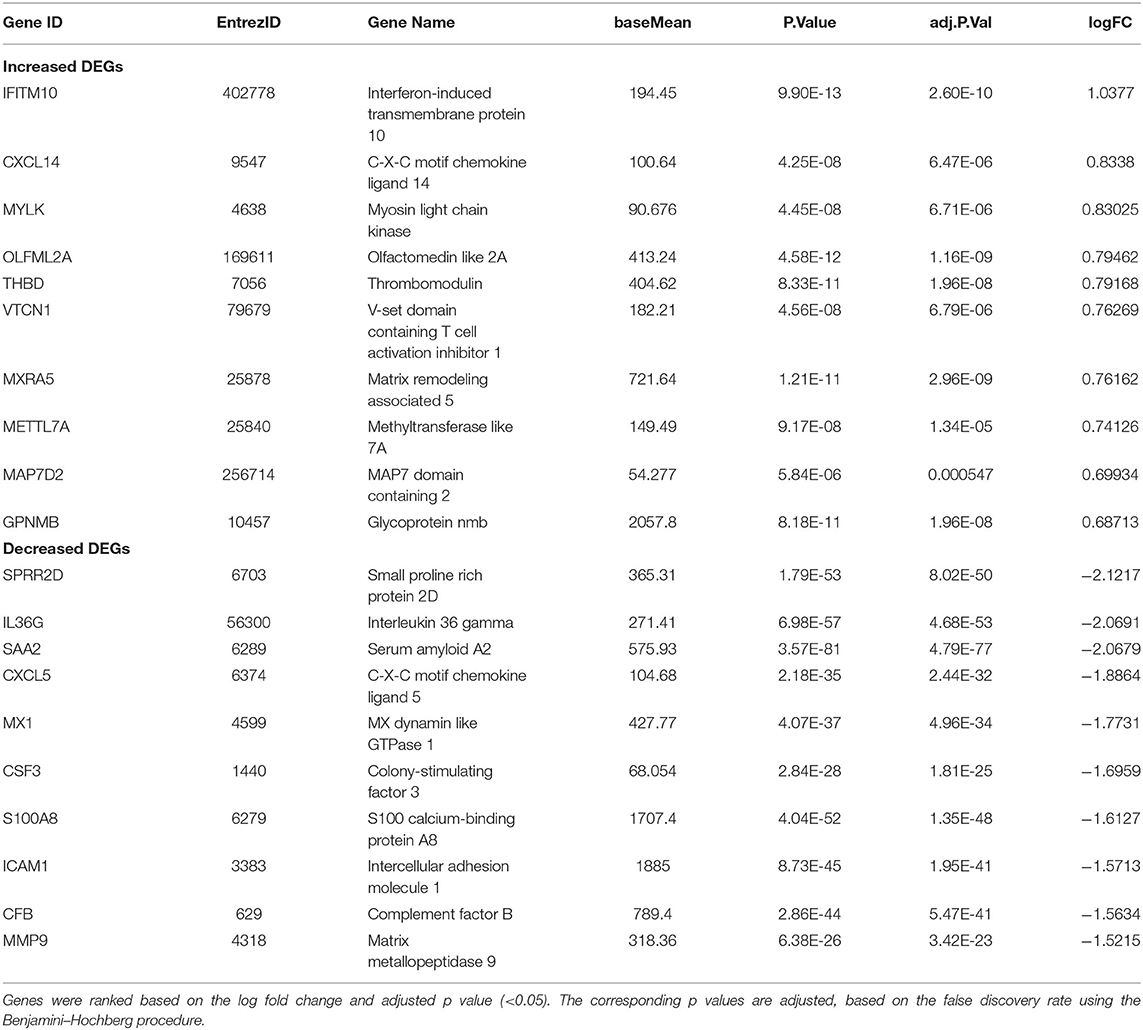
Table 1. Top 20 DEGs identified in the SARS-CoV-2 analysis.
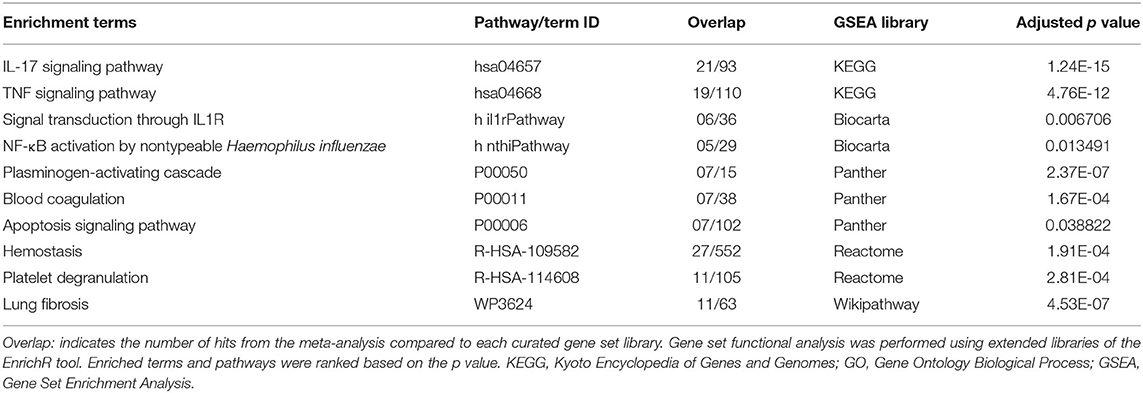
Table 2. Top enriched terms identified by functional analysis of the DEGs from SARS-CoV-2–infected human lung epithelial cells.
Identification of DEG Signature in MERS-CoV– or SARS-CoV–Infected Human Lung Epithelial Cells
In the case of MERS-CoV dataset, GSE81909, there are a total of 1,951 DEGs with adjusted p < 0.05 (Supplementary Dataset 2). Among these 1,951 DEGs, 1,120 genes increased, and 831 decreased. The microarray analysis of GSE17400 for SARS-CoV infection resulted in a total of 1,521 DEGs with adjusted p < 0.05 (Supplementary Dataset 3). Among these 1,521 DEGs, 475 increased, and 1,046 decreased. Figures 1C,D depict the heatmap of expression of top significant DEGs among the samples for MERS-CoV and SARS-CoV, respectively. As shown in Supplementary Table 2, SSX family member 2 (SSX2), fos proto-oncogene, AP-1 transcription factor subunit (FOS), and early growth response 1 (EGR1) were among the most significantly increased genes, whereas transcription elongation regulator 1 (TCERG1), G protein–coupled receptor 55 (GPR55), and casein kappa (CSN3) were the most decreased genes in our analysis of MERS-CoV–infected lung epithelial cells compared to controls. Similarly, Supplementary Table 3 shows that pentraxin 3 (PTX3), early growth response 1 (EGR1), and EGR2 were among the most significantly increased genes, whereas aldo-keto reductase family 1 member B10 (AKR1B10), IFN-α-inducible protein 6 (IFI6), and matrix metallopeptidase 1 (MMP1) are the most decreased genes in our analysis of SARS-CoV–infected lung epithelial cells compared to mock controls. When these DEGs from both MERS-CoV and SARS-CoV were subjected to the analysis of overrepresented biological pathways and enriched terms, several pathways related to inflammation and apoptosis were commonly enriched (Supplementary Tables 4, 5).
Muted Expression of Acute Inflammatory Genes Was Observed in the SARS-CoV-2 When Compared to MERS-CoV-2 and SARS-CoV
Previous studies revealed that lung epithelial cells, dendritic cells, and macrophages all express cytokines to some extent during major viral infection causing cytokine storm. However, little is known about the situation in COVID-19. Earlier studies showed IFN-γ-related cytokine storm in SARS-CoV infection, whereas MERS-CoV infection had delayed induction of proinflammatory cytokines and suppression of innate antiviral response. It is crucial to identify the primary source of the cytokine storm in response to SARS-CoV-2 infection and the underlying virological mechanisms. Our analysis of shared DEGs between three coronaviruses resulted in 17 shared DEGs (Figure 2A), among which most genes are related to acute inflammation. Figure 2B indicates that the expression levels of these genes were lower in SARS-CoV-2 when compared with the other two coronaviruses. Our identification of a muted transcriptional response to SARS-CoV-2 supports a model in which initial failure to rapidly respond to infection results in prolonged viral replication and subsequent recruitment of proinflammatory cells as the infection progresses to induce alveolar damage in COVID-19. Table 3 depicts the expression value of DEGs shared in all three coronaviruses. It is evident that the expression of critical acute inflammatory genes including TNF-α-induced protein 3 (TNFAIP3), C-X-C motif chemokine ligand 1 (CXCL1), and TNF was lower in the SARS-CoV-2 dataset compared to two other coronaviruses. These results may suggest that lung epithelial cells do not directly contribute to the cytokine storm during COVID-19 and that other immune cells appear to participate in this process.
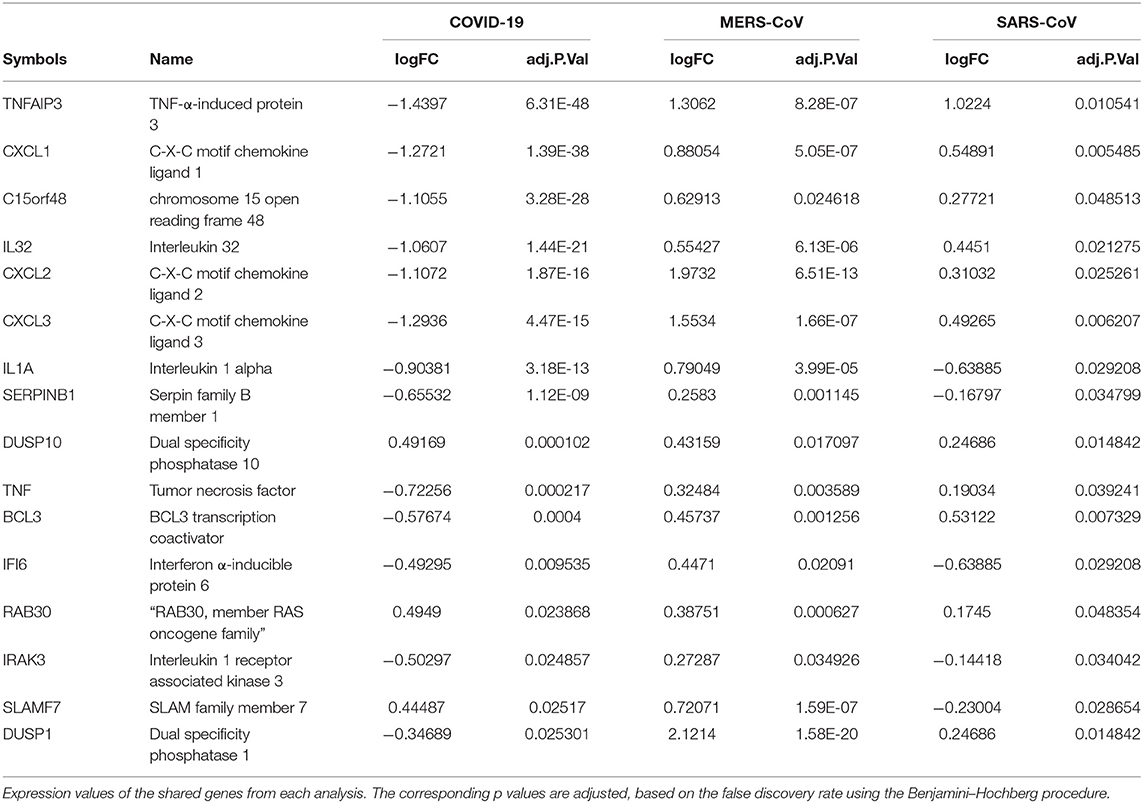
Table 3. Shared DEGs between coronaviruses.
SARS-CoV-2 Elicits Suppressed Type I IFN Response and Activation of Apoptotic Gene Signature
Dissecting the DEGs involved in IFN response to coronavirus infection in primary human lung epithelial cells revealed that SARS-CoV-2 elicits a muted response that lacks robust induction of a subset of cytokines including the type I IFN compared to the response to MERS-CoV and SARS-CoV (Figure 3A). Furthermore, our analysis revealed that in desperate bid to control the viral propagation, SARS-CoV-2 infection induced several apoptosis-related genes in human lung epithelial cells compared to responses to MERS-CoV and SARS-CoV (Figure 3B).
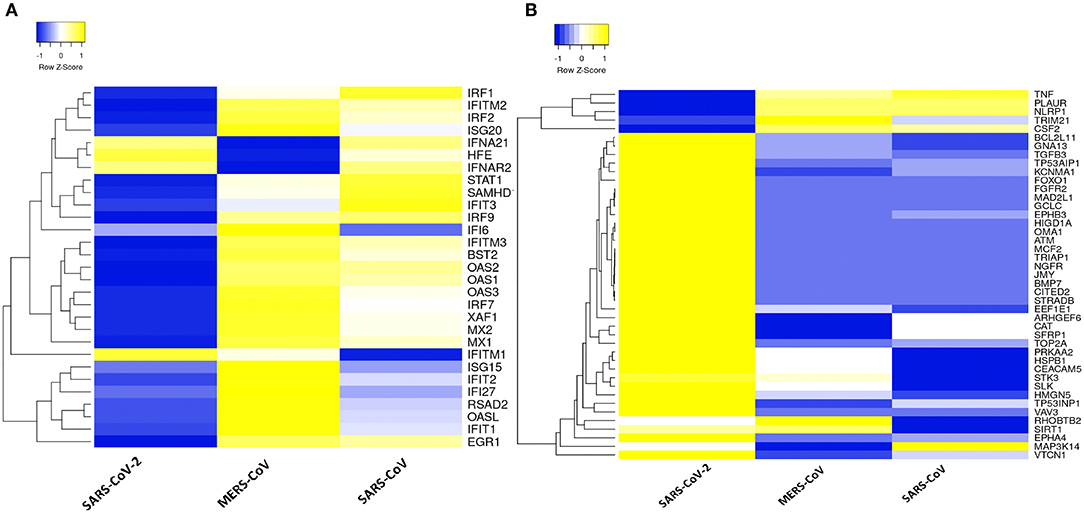
Figure 3. Type 1 IFN response and apoptotic genes signature in three coronaviruses. (A) Heatmap representation of expression profiles for the type 1 IFN response genes (GO:0060337) between coronaviruses. (B) Heatmap representation of expression profiles for the apoptotic gene signatures (GO:0042981) between coronaviruses. Clustering of selected genes on the heatmap was performed by hierarchical clustering algorithm using Euclidean distance measure. Expression scale: blue (low expression) to yellow (high expression).
Downstream Analysis of DEGs Unique to SARS-CoV-2 and Network-Based Meta-Analysis Led to Pathways and Hub Genes Related to Inflammation and Vascular Dysfunction
A set of 221 DEGs unique to SARS-CoV-2 underwent downstream analysis to understand the enriched pathways and associated hub genes. Using BinGO enrichment clusters of biological process (GO terms) associated with unique DEGs of SARS-CoV-2 was generated, which revealed enriched pathway clusters associated with immune responses/chemotaxis, blood coagulation, apoptosis, vascular remodeling, and vascular cell proliferation (Figure 4A). Supplementary Dataset 4 compiles the complete list of GO: terms enriched in DEGs associated with SARS-CoV-2 infection. We generated a PPI network by integrating the InnateDB interactome with the original seed of 221 DEGs. An expanded PPI network was generated with 2,542 nodes representing the proteins and 4,457 edges representing the interaction between these proteins. Network-based hub DEG analysis (Figure 4B) identified ribosomal protein L9 (RPL9) and SMAD family member 3 (SMAD3) to be the most highly ranked hub genes that increased and decreased among the DEGs, respectively, based on betweenness centrality and degree score. The list of top 15 hub genes based on network topology scores is shown in Table 4.
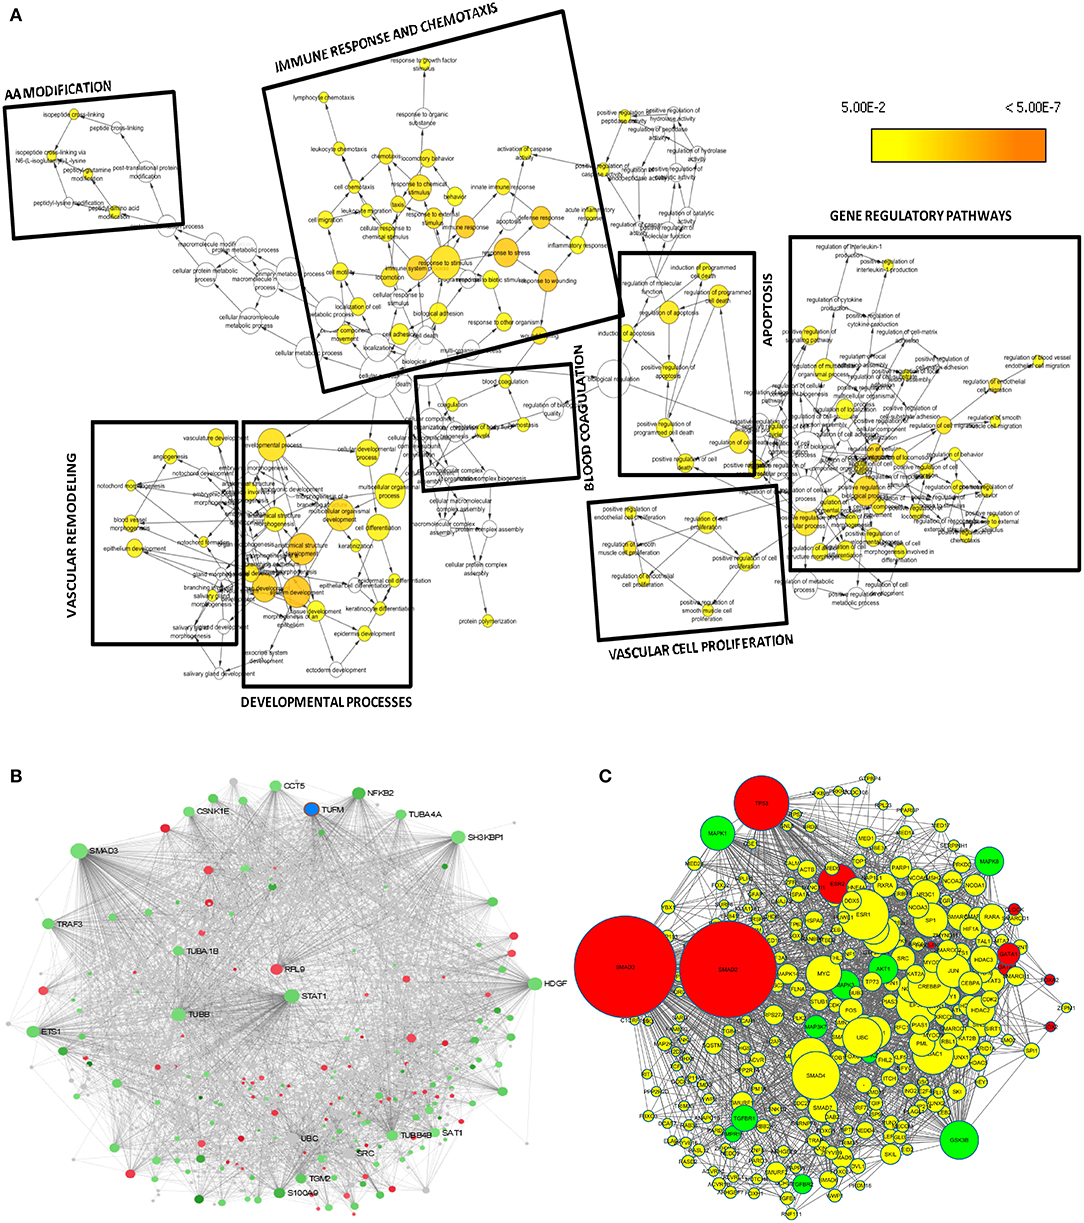
Figure 4. Downstream analysis of SARS-CoV-2–specific DEGs. (A) Overrepresentation of pathways and Gene Ontology categories in biological networks identified from DEGs unique to SARS-CoV-2. Significantly overrepresented biological processes based on GO terms were visualized in Cytoscape. The size of a node is proportional to the number of targets in the GO category. The color represents enrichment significance—the deeper the color on a color scale, the higher the enrichment significance. p values were adjusted using a Benjamini and Hochberg FDR correction. Analysis revealed the enriched pathways associated with immune responses and chemotaxis, blood coagulation, apoptosis signaling pathway, vasculature remodeling, and vascular cell proliferation. (B) Network-based analysis of hub DEGs. Interaction network of SARS-CoV-2 unique genes; red nodes represent increased and green nodes represent decreased DEGs. (C) Regulatory gene network analysis of the top 10 enriched kinases (green) and transcription factors (red) using SARS-CoV-2 specific DEGs. Yellow nodes represent the intermediate proteins in the regulatory network. Node size represents the significance of protein based on p value; the bigger the node size, the higher the significance value.
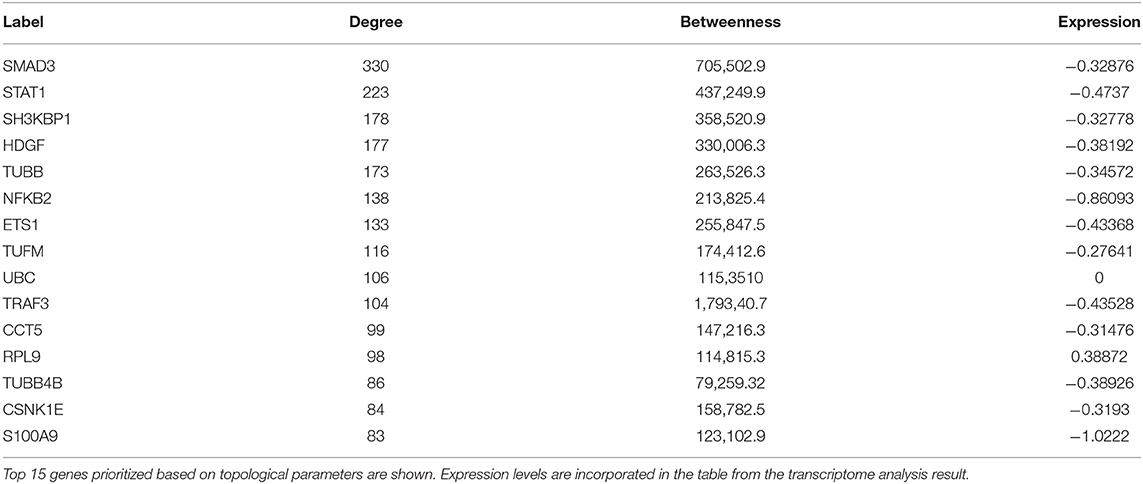
Table 4. Network-based hub genes of SARS-CoV-2 specific DEGs.
Identification of the Transcription Factors and Regulatory Kinases Network Upstream to the Unique DEGs Obtained From SARS-CoV-2
To understand what lies to the upstream of the unique DEGs identified from the SARS-CoV-2 infection, we used X2K bioinformatics tool. The regulatory gene network analysis resulted in identification of transcription factors and kinases related to the DEGs. Network in Figure 4C shows the top kinases and transcription factors related to our DEGs. The list of top 10 ranked transcription factors and protein kinases is shown in Supplementary Table 4. This analysis revealed the most important regulatory gene candidates that may be involved in the formation of regulatory complexes. Mitogen-activated protein kinase 1 (MAPK1) and MAPK3 are among the top kinases, whereas SMAD3 and SMAD2 are among the top transcription factors associated with the unique DEGs from lung epithelial cells infected with SARS-CoV-2.
Distinct Pathways and Gene Signatures Associated With SARS-CoV-2
After we removed the DEGs shared by three coronaviruses (17 DEGs) and those shared between SARS-CoV-2 and MERS-CoV (91 DEGs); and SARS-CoV-2 and SARS-CoV (9 DEGs), a total of 221 DEGs remained that was specific to SARS-CoV-2 (Figure 2A and Supplementary Dataset 1). Our interest was to identify the distinct pathways that may participate in the pathogenesis of COVID-19. Using the list of SARS-CoV-2–specific DEGs, we conducted biological process (GO) analysis on the unique set of DEGs using a Cytoscape plugin, BinGO tool. Table 5 depicts the most distinct pathways and their associated representative genes with its known function and expression fold change that may have implication on the disease pathogenesis. In the analysis, the following pathways were enriched. In the apoptosis-related pathway, the expression of neuropilin 1 (NRP1), forkhead box O1 (FOXO1), and tumor protein p53 inducible nuclear protein 1 (TP53INP1) is increased, whereas that of colony-stimulating factor 2 (CSF2) and NLR family pyrin domain containing 1 (NLRP1) is decreased. Acute inflammation–related genes included IL-6 receptor (IL-6R) that increased and serpin family A member 3 (SERPINA3), complement component 1s (C1S), serum amyloid A2 (SAA2), and complement factor B (CFB) that decreased. Among vascular dysfunction–related genes, vav guanine nucleotide exchange factor 3 (VAV3) and transcription factor 4 (TCF4) are increased, while thymidine phosphorylase (TYMP) and nuclear receptor subfamily 2 group F member 2 (NR2F2) are decreased. Genes related to blood coagulation included coagulation factor III/tissue factor (F3) and protein S (PROS1) are increased, whereas IFN-γ receptor 1 (IFNGR1), integrin subunit β3 (ITGB3), and tissue factor pathway inhibitor 2 (TFPI2) are decreased. Several pathways associated with cardiovascular dysfunction were enriched by the unique set of DEGs specific to SARS-CoV-2 infection. Table 6 summarizes the pathways and their associated genes that might play a role in cardiovascular complications.
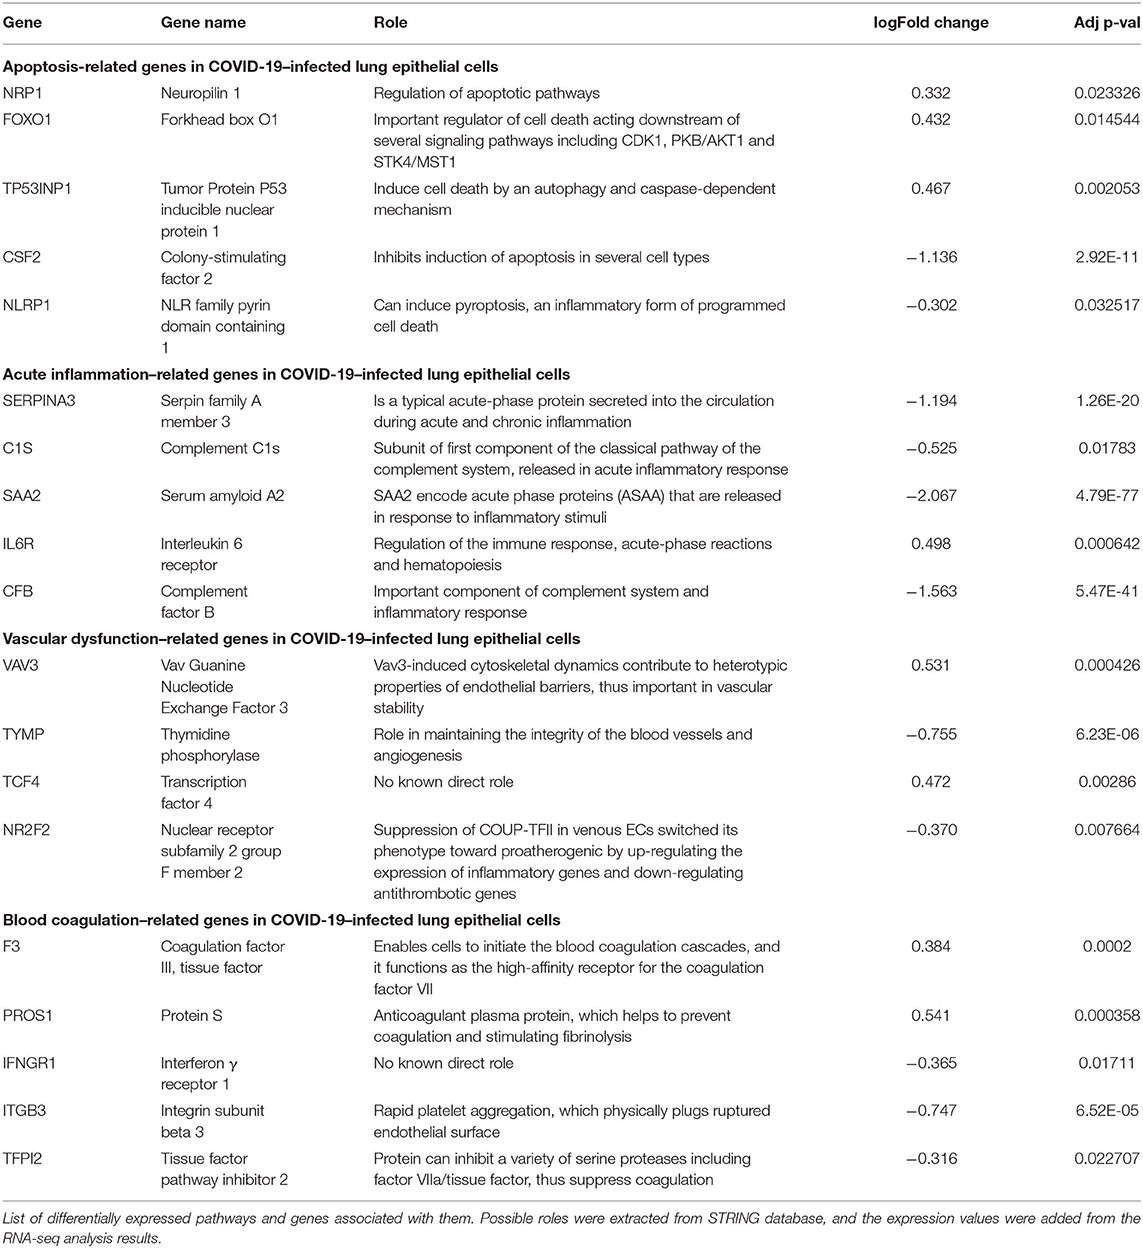
Table 5. Distinct pathways and related genes associated with SARS-CoV-2.
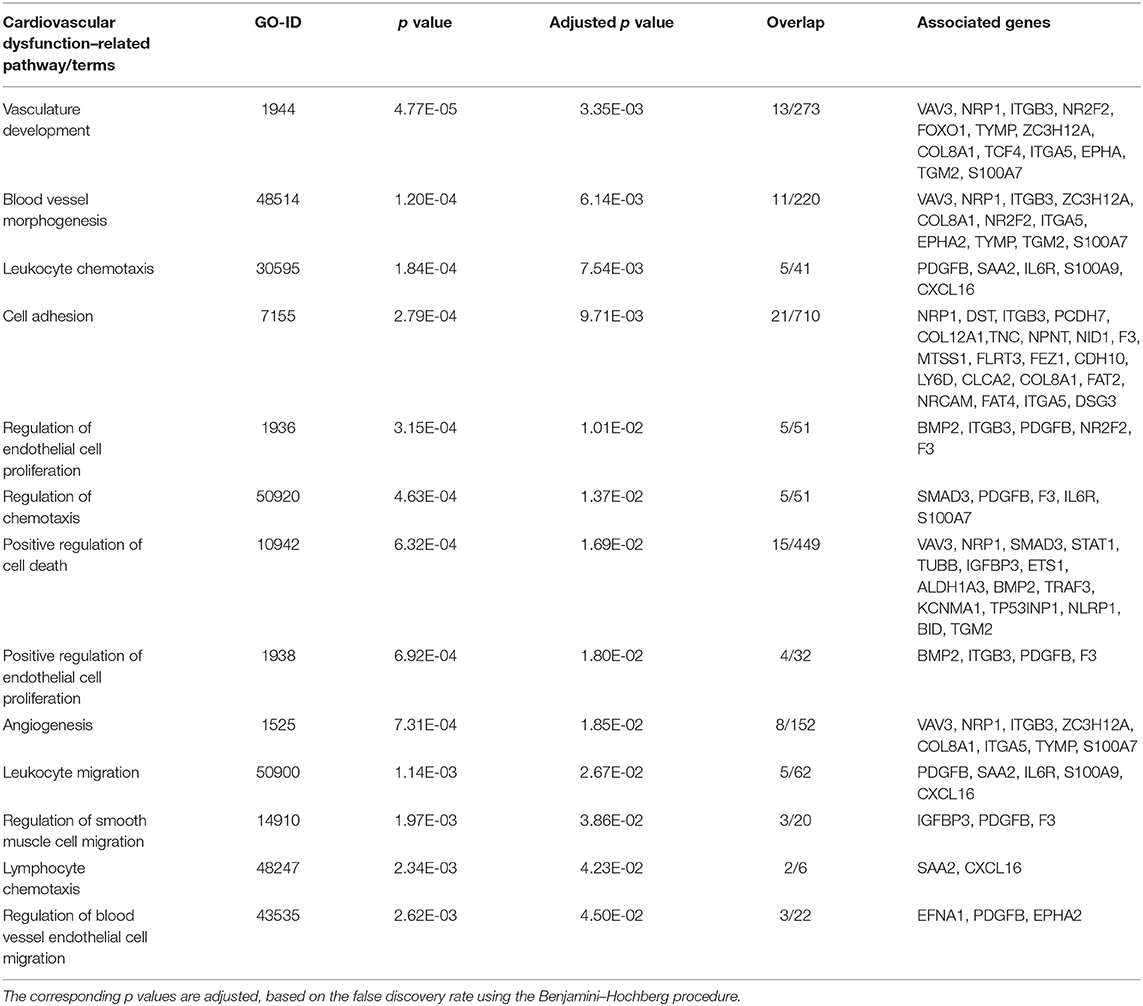
Table 6. Cardiovascular dysfunction–related pathways and genes in SARS-CoV-2 infection.
Discussion
In the present study, we focus on defining transcriptional responses to SARS-CoV-2 relative to MERS-CoV and SARS-CoV. A major goal was to discover unique cellular responses to SARS-CoV-2 among these three coronaviruses. We specifically selected datasets generated in cultured human lung epithelial cells infected with each of these three coronaviruses as this cell type is the major interface between the environment and the host and defends the lung against foreign substances and pathogens. In general, our data show that overall transcriptional footprints to SARS-CoV-2 infection were distinct from those to the other two coronaviruses. Despite the decreased expression of acute inflammatory and type I IFN genes in response to SARS-CoV-2, we observed increased expression of several genes associated with interleukin signaling, complement pathways, and chemokines. This finding echoes with the previously published study, which conducted RNAseq analysis to understand host transcriptional response to influenza A virus and SARS-CoV-2 in primary human bronchial epithelial cells (11). We used a publicly available subset of RNAseq data (GSE147507) from this study to compare it with independent datasets for SARS-CoV and MERS-CoV. It is worth mentioning that the list of DEGs unique to SARS-CoV-2 infection generated in our analysis was associated with coagulation and vascular function, which may explain why COVID-19 causes more systemic cardiovascular complications than do MERS and SARS (4, 8).
By analyzing RNAseq dataset of lung epithelial cells infected with SARS-CoV-2, we defined transcriptional signatures of 338 DEGs, including 92 increased and 246 decreased genes across the datasets. Among the top 10 increased DEGs, IFITM10, CXCL14, and MYLK are the most significantly increased genes. CXCL14 is a cytokine involved in immunoregulatory and inflammatory processes by mediating the chemotactic activity for monocytes and therefore can be implicated in the immune cell infiltration in the lung during SARS-CoV-2 infection (24). IFITM proteins family inhibit the entry of a large number of viruses; however, the exact role of IFITM10 as an antiviral agent remains unknown (25). SAA2 is the most significantly decreased gene in our analysis. SAA2 is a useful inflammatory marker in acute viral infections such as influenza, but its decreased expression in our analysis is consistent with the aberrant inflammatory response of SARS-CoV-2 infection (26). Viral infection is marked by the activation of immune system, which is evident from the enrichment of several pathways, including IL-17, TNF, and apoptosis signaling pathways among others (27). Patients who are infected with COVID-19 may develop pneumonia and progress to severe respiratory failure termed acute respiratory distress syndrome, which may result in the development of lung fibrosis (28). Consistent with this report, several genes such as colony-stimulating factor 3 (CSF3), endothelin 1 (EDN1), plasminogen activator, urokinase (PLAU), and MMP9 were reported to be differentially expressed in SARS-CoV-2 infection.
Previous studies revealed that lung epithelial cells, macrophages, and dendritic cells express cytokines to some extent during major viral infection causing cytokine storm. Evidence for molecular mechanisms of cytokine storm in COVID-19 remains limited. Earlier studies have shown IFN-γ-related cytokine storm in SARS patients (29), while delayed induction of proinflammatory cytokines and suppression of innate antiviral response by the MERS-CoV (30). It is crucial to identify the primary source of the cytokine storm in response to SARS-CoV-2 infection and the virological mechanisms behind the cytokine storm. Consistent to this model, our analysis of shared DEGs between three coronaviruses resulted in 17 DEGs, among which most molecules are related to acute inflammation. It is evident that important acute inflammatory genes (e.g., TNFAIP3, CXCL1, and TNF) are decreased in SARS-CoV-2–infected cells compared to other coronaviruses. These results may suggest that the major source of cytokine storm in COVID-19 is not lung epithelial cells, but possibly immune cell types. These aberrant transcriptional responses to SARS-CoV-2 may indicate low responses to infection, resulting in prolonged viral replication and serious lung damage in COVID-19 (31).
Our study linked DEGs unique to SARS-CoV-2 infection with pathway clusters related to immune responses, blood coagulation, apoptosis, and vascular remodeling. Apoptosis, which is a defense mechanism of hosts against the viral infection, depends on the rapid programmed cell death to curtail viral spread. Previous studies reported that SARS-CoV has evolved sophisticated molecular strategies to trigger host cell apoptotic defenses (32, 33). In our data, SARS-CoV-2 infection increased the expression of NRP1 and FOXO1. NRP1 has a regulatory role of apoptotic pathways, whereas FOXO1 is an important regulator of cell death acting downstream of several signaling pathways, including CDK1, PKB/AKT1, and STK4/MST1 (34).
Evidence suggests elevation of D-dimer and fibrin/fibrinogen degradation products in patients with COVID-19, highlighting aggravated blood coagulation (8). A recent clinical study examined seven lungs obtained during autopsy from patients with COVID-19 (35). The study observed vascular endothelial injury and widespread thrombus formation in pulmonary vessels. Immunohistochemical staining of pulmonary vasculature of COVID-19 showed alveolar capillary microthrombi were nine times as prevalent in patients with COVID-19 compared with influenza patients. In consistent with these reports, we identified coagulation-related genes in SARS-CoV-2 infection, including tissue factor that initiates the external coagulation cascades. In contrast, SARS-CoV-2 suppressed the expression of antithrombotic gene TFPI2, which inhibits a variety of serine proteases including factor VIIa/tissue factor complex.
Despite the clinical impact, the information on the mechanisms of COVID-19 and its cardiovascular complications remains limited. A systems approach, involving unbiased bioinformatics and network analysis, may help to identify causative genes and integrated pathways as drug targets for the improvement in disease management (36). Network-based analysis of hub genes in the DEGs dataset unique to SARS-CoV-2 infection resulted in prioritization of RPL9 as the most highly ranked DEG that had increased expression, based on betweenness centrality and degree score. The increased expression of RPL9, a ribosomal protein, can be attributed to the fact that virus hijacks the translational machinery of the host for its survival by the mechanisms such as ribosome shunting and phosphorylation of ribosomal proteins (37, 38).
Regulatory gene network analysis helps to understand what lies upstream of the DEGs in cells infected with SARS-CoV-2. It is important to find out the regulatory kinases and transcription factors as they participate in the pathogenesis and the progression of the virus infection (39). Among several kinases regulating the expression of DEGs expression in our analysis, genes involved in MAPK cascades (MAPK1, MAPK2, MAPK8, and MAP3K7) have roles in host response to viral infection (40). SMAD3, an effector molecule in the transforming growth factor-β signaling pathway, is also an interesting candidate in our analysis as it was the top hub gene in our network analysis and also the most significant transcription factor in our regulatory gene analysis. In the present study, SARS-CoV-2 reduced SMAD3 expression, which is consistent with previous findings on the decreased expression of SMAD3 during viral infection to overtake the host innate antiviral mechanism (41, 42).
In conclusion, our study provides the snapshot of transcriptional host responses to SARS-CoV-2 infection, in which expression of various inflammatory genes is decreased. These results may explain why many infected individuals show no symptoms. Furthermore, our study revealed that SARS-CoV-2 elicits muted antiviral type I IFN response, which may result in prolonged viral replication. These findings may also explain why SARS-CoV-2 infection has a longer incubation period than other coronavirus infections. Our analysis revealed expression of several genes related to apoptosis, coagulation, and vascular function, which may contribute to cardiovascular complications. Furthermore, our study has identified a novel set of candidate transcriptomic signatures unique to SARS-CoV-2 infection, which may guide the initial efforts in the development of diagnostic or therapeutic tools for COVID-19.
Data Availability Statement
The original contributions presented in the study are included in the article/Supplementary Material, further inquiries can be directed to the corresponding author/s.
Author Contributions
PJ, AV, and MA conceived, coordinated, and designed the study. PJ and AV retrieved the datasets, did the analysis, and wrote the manuscript. MA did the editing and result interpretation. AH and SU edited and provided technical advices on the study. All authors contributed to the article and approved the submitted version.
Funding
This work was supported by research grants from the National Heart, Lung, and Blood Institute (R01HL126901 and R01HL149302 to MA).
Conflict of Interest
The authors declare that the research was conducted in the absence of any commercial or financial relationships that could be construed as a potential conflict of interest.
Supplementary Material
The Supplementary Material for this article can be found online at: https://www.frontiersin.org/articles/10.3389/fcvm.2020.623012/full#supplementary-material
References
1. Thao TTN, Labroussaa F, Ebert N, V'kovski P, Stalder H, Portmann J, et al. Rapid reconstruction of SARS-CoV-2 using a synthetic genomics platform. Nature. (2020) 582:561–5. doi: 10.1038/s41586-020-2294-9
2. Zhou P, Yang X-L, Wang X-G, Hu B, Zhang L, Zhang W, et al. A pneumonia outbreak associated with a new coronavirus of probable bat origin. Nature. (2020) 579:270–3. doi: 10.1038/s41586-020-2951-z
3. Madjid M, Safavi-Naeini P, Solomon SD, Vardeny O. Potential effects of coronaviruses on the cardiovascular system: a review. JAMA Cardiol. (2020) 5:831–40. doi: 10.1001/jamacardio.2020.1286
4. Clerkin KJ, Fried JA, Raikhelkar J, Sayer G, Griffin JM, Masoumi A, et al. COVID-19 and cardiovascular disease. Circulation. (2020) 141:1648–55. doi: 10.1161/CIRCULATIONAHA.120.046941
5. Zou L, Ruan F, Huang M, Liang L, Huang H, Hong Z, et al. SARS-CoV-2 viral load in upper respiratory specimens of infected patients. N Engl J Med. (2020) 382:1177–9. doi: 10.1056/NEJMc2001737
6. Peiris JS, Chu CM, Cheng VC, Chan KS, Hung IF, Poon LL, et al. Clinical progression and viral load in a community outbreak of coronavirus-associated SARS pneumonia: a prospective study. Lancet. (2003) 361:1767–72. doi: 10.1016/S0140-6736(03)13412-5
7. Oh M-d, Park WB, Choe PG, Choi S-J, Kim J-I, Chae J, et al. Viral load kinetics of MERS coronavirus infection. N Engl J Med. (2016) 375:1303–5. doi: 10.1056/NEJMc1511695
8. Connors JM, Levy JH. COVID-19 and its implications for thrombosis and anticoagulation. Blood. (2020) 135:2033–40. doi: 10.1182/blood.2020006000
9. Middeldorp S, Coppens M, van Haaps TF, Foppen M, Vlaar AP, Müller MCA, et al. Incidence of venous thromboembolism in hospitalized patients with COVID-19. J Thromb Haemost. (2020) 18:1995–2002. doi: 10.20944/preprints202004.0345.v1
10. Tang N, Bai H, Chen X, Gong J, Li D, Sun Z. Anticoagulant treatment is associated with decreased mortality in severe coronavirus disease 2019 patients with coagulopathy. J Thromb Haemost. (2020) 18:1094–9. doi: 10.1111/jth.14817
11. Blanco-Melo D, Nilsson-Payant BE, Liu WC, Uhl S, Hoagland D, Moller R, et al. Imbalanced host response to SARS-CoV-2 drives development of COVID-19. Cell. (2020) 181:1036–45.e9. doi: 10.1016/j.cell.2020.04.026
12. Love MI, Huber W, Anders S. Moderated estimation of fold change and dispersion for RNA-seq data with DESeq2. Genome Biol. (2014) 15:550. doi: 10.1186/s13059-014-0550-8
13. Xia J, Benner MJ, Hancock RE. NetworkAnalyst–integrative approaches for protein-protein interaction network analysis and visual exploration. Nucleic Acids Res. (2014) 42:W167–74. doi: 10.1093/nar/gku443
14. Lin SM, Du P, Huber W, Kibbe WA. Model-based variance-stabilizing transformation for Illumina microarray data. Nucleic Acids Res. (2008) 36:e11. doi: 10.1093/nar/gkm1075
15. Yoshikawa T, Hill TE, Yoshikawa N, Popov VL, Galindo CL, Garner HR, et al. Dynamic innate immune responses of human bronchial epithelial cells to severe acute respiratory syndrome-associated coronavirus infection. PLoS ONE. (2010) 5:e8729. doi: 10.1371/journal.pone.0008729
16. Ritchie ME, Phipson B, Wu D, Hu Y, Law CW, Shi W, et al. limma powers differential expression analyses for RNA-sequencing and microarray studies. Nucleic Acids Res. (2015) 43:e47. doi: 10.1093/nar/gkv007
17. Witten DM, Tibshirani R, Hastie T. A penalized matrix decomposition, with applications to sparse principal components and canonical correlation analysis. Biostatistics. (2009) 10:515–34. doi: 10.1093/biostatistics/kxp008
18. Chen EY, Tan CM, Kou Y, Duan Q, Wang Z, Meirelles GV, et al. Enrichr: interactive and collaborative HTML5 gene list enrichment analysis tool. BMC Bioinform. (2013) 14:128. doi: 10.1186/1471-2105-14-128
19. Ashburner M, Ball CA, Blake JA, Botstein D, Butler H, Cherry JM, et al. Gene ontology: tool for the unification of biology. The Gene Ontology Consortium. Nat Genet. (2000) 25:25–9. doi: 10.1038/75556
20. Shannon P, Markiel A, Ozier O, Baliga NS, Wang JT, Ramage D, et al. Cytoscape: a software environment for integrated models of biomolecular interaction networks. Genome Res. (2003) 13:2498–504. doi: 10.1101/gr.1239303
21. Maere S, Heymans K, Kuiper M. BiNGO: a Cytoscape plugin to assess overrepresentation of gene ontology categories in biological networks. Bioinformatics. (2005) 21:3448–9. doi: 10.1093/bioinformatics/bti551
22. Lachmann A, Xu H, Krishnan J, Berger SI, Mazloom AR, Ma'ayan A. ChEA: transcription factor regulation inferred from integrating genome-wide ChIP-X experiments. Bioinformatics. (2010) 26:2438–44. doi: 10.1093/bioinformatics/btq466
23. Chen EY, Xu H, Gordonov S, Lim MP, Perkins MH, Ma'ayan A. Expression2Kinases: mRNA profiling linked to multiple upstream regulatory layers. Bioinformatics. (2012) 28:105–11. doi: 10.1093/bioinformatics/btr625
24. Schett G, Sticherling M, Neurath MF. COVID-19: risk for cytokine targeting in chronic inflammatory diseases? Nat Rev Immunol. (2020) 20:271–2. doi: 10.1038/s41577-020-0312-7
25. Qian J, Le Duff Y, Wang Y, Pan Q, Ding S, Zheng YM, et al. Primate lentiviruses are differentially inhibited by interferon-induced transmembrane proteins. Virology. (2015) 474:10–8. doi: 10.1016/j.virol.2014.10.015
26. Vollmer AH, Gebre MS, Barnard DL. Serum amyloid A (SAA) is an early biomarker of influenza virus disease in BALB/c, C57BL/2, Swiss-Webster, and DBA.2 mice. Antiviral Res. (2016) 133:196–207. doi: 10.1016/j.antiviral.2016.08.011
27. Mukherjee S, Lindell DM, Berlin AA, Morris SB, Shanley TP, Hershenson MB, et al. IL-17-induced pulmonary pathogenesis during respiratory viral infection and exacerbation of allergic disease. Am J Pathol. (2011) 179:248–58. doi: 10.1016/j.ajpath.2011.03.003
28. George PM, Wells AU, Jenkins RG. Pulmonary fibrosis and COVID-19: the potential role for antifibrotic therapy. Lancet Respir Med. (2020) 8:807–15. doi: 10.1016/S2213-2600(20)30225-3
29. Huang KJ, Su IJ, Theron M, Wu YC, Lai SK, Liu CC, et al. An interferon-gamma-related cytokine storm in SARS patients. J Med Virol. (2005) 75:185–94. doi: 10.1002/jmv.20255
30. Lau SKP, Lau CCY, Chan KH, Li CPY, Chen H, Jin DY, et al. Delayed induction of proinflammatory cytokines and suppression of innate antiviral response by the novel Middle East respiratory syndrome coronavirus: implications for pathogenesis and treatment. J Gen Virol. (2013) 94 (Pt 12):2679–90. doi: 10.1099/vir.0.055533-0
31. Blanco-Melo D, Nilsson-Payant BE, Liu W-C, Møller R, Panis M, Sachs D, et al. SARS-CoV-2 launches a unique transcriptional signature from in vitro, ex vivo, and in vivo systems. bioRxiv. (2020). doi: 10.1101/2020.03.24.004655
32. Krahling V, Stein DA, Spiegel M, Weber F, Muhlberger E. Severe acute respiratory syndrome coronavirus triggers apoptosis via protein kinase R but is resistant to its antiviral activity. J Virol. (2009) 83:2298–309. doi: 10.1128/JVI.01245-08
33. Tan YX, Tan TH, Lee MJ, Tham PY, Gunalan V, Druce J, et al. Induction of apoptosis by the severe acute respiratory syndrome coronavirus 7a protein is dependent on its interaction with the Bcl-XL protein. J Virol. (2007) 81:6346–55. doi: 10.1128/JVI.00090-07
34. Fu Z, Tindall DJ. FOXOs, cancer and regulation of apoptosis. Oncogene. (2008) 27:2312–9. doi: 10.1038/onc.2008.24
35. Ackermann M, Verleden SE, Kuehnel M, Haverich A, Welte T, Laenger F, et al. Pulmonary vascular endothelialitis, thrombosis, and angiogenesis in Covid-19. N Engl J Med. (2020) 383:120–8. doi: 10.1056/NEJMoa2015432
36. Barabasi AL, Gulbahce N, Loscalzo J. Network medicine: a network-based approach to human disease. Nat Rev Genet. (2011) 12:56–68. doi: 10.1038/nrg2918
37. Hertz MI, Landry DM, Willis AE, Luo G, Thompson SR. Ribosomal protein S25 dependency reveals a common mechanism for diverse internal ribosome entry sites and ribosome shunting. Mol Cell Biol. (2013) 33:1016–26. doi: 10.1128/MCB.00879-12
38. Meyuhas O. Physiological roles of ribosomal protein S6: one of its kind. Int Rev Cell Mol Biol. (2008) 268:1–37. doi: 10.1016/S1937-6448(08)00801-0
39. Ramezani A, Nahad MP, Faghihloo E. The role of Nrf2 transcription factor in viral infection. J Cell Biochem. (2018) 119:6366–82. doi: 10.1002/jcb.26897
40. Chu WM, Ostertag D, Li ZW, Chang L, Chen Y, Hu Y, et al. JNK2 and IKKbeta are required for activating the innate response to viral infection. Immunity. (1999) 11:721–31. doi: 10.1016/S1074-7613(00)80146-6
41. Gough NR. Enhancing and inhibiting TGF-β signaling in infection. Sci Signal. (2015) 8:ec9-ec. doi: 10.1126/scisignal.aaa6549
Keywords: SARS-CoV-2, SARS-CoV, MERS-CoV, COVID-19 and transcriptome analysis, cardiovasclar disease
Citation: Jha PK, Vijay A, Halu A, Uchida S and Aikawa M (2021) Gene Expression Profiling Reveals the Shared and Distinct Transcriptional Signatures in Human Lung Epithelial Cells Infected With SARS-CoV-2, MERS-CoV, or SARS-CoV: Potential Implications in Cardiovascular Complications of COVID-19. Front. Cardiovasc. Med. 7:623012. doi: 10.3389/fcvm.2020.623012
Received: 29 October 2020; Accepted: 26 November 2020;
Published: 15 January 2021.
Edited by:
Masataka Sata, Tokushima University, JapanReviewed by:
Ryuichi Morishita, Osaka University, JapanMasayuki Yoshida, Tokyo Medical and Dental University, Japan
Copyright © 2021 Jha, Vijay, Halu, Uchida and Aikawa. This is an open-access article distributed under the terms of the Creative Commons Attribution License (CC BY). The use, distribution or reproduction in other forums is permitted, provided the original author(s) and the copyright owner(s) are credited and that the original publication in this journal is cited, in accordance with accepted academic practice. No use, distribution or reproduction is permitted which does not comply with these terms.
*Correspondence: Masanori Aikawa, maikawa@bwh.harvard.edu
†These authors have contributed equally to this work