Prediction Model Risk-of-Bias Assessment Tool for coronary artery lesions in Kawasaki disease
 Hongbiao Huang1,2†
  Jinfeng Dong3† Shuhui Wang2†
  Yueping Shen4 Yiming Zheng2 Jiaqi Jiang2 Bihe Zeng2 Xuan Li2 Fang Yang1 Shurong Ma2 Ying He1 Fan Lin1 Chunqiang Chen5 Qiaobin Chen1*
  Haitao Lv2*
- 1Department of Pediatrics, Fujian Provincial Hospital, Fujian Provincial Clinical College of Fujian Medical University, Fuzhou, Fujian, China
- 2Department of Pediatrics, Institute of Pediatric Research, Children’s Hospital of Soochow University, Suzhou, Jiangsu, China
- 3Department of Hematology, The First Affiliated Hospital of Fujian Medical University, Fuzhou, Fujian, China
- 4Department of Epidemiology and Biostatistics, School of Public Health, Medical College of Soochow University, Suzhou, Jiangsu, China
- 5Department of Pediatrics, Fuqing City Hospital Affiliated to Fujian Medical University, Fuqing, Fujian, China
Objective: To review and critically appraise articles on prediction models for coronary artery lesions (CALs) in Kawasaki disease included in PubMed, Embase, and Web of Science databases from January 1, 1980, to December 23, 2021.
Materials and methods: Study screening, data extraction, and quality assessment were performed by two independent reviewers, with a statistics expert resolving discrepancies. Articles that developed or validated a prediction model for CALs in Kawasaki disease were included. The Critical Appraisal and Data Extraction for Systematic Reviews of Prediction Modeling Studies checklist was used to extract data from different articles, and Prediction Model Risk-of-Bias Assessment Tool (PROBAST) was used to assess the bias risk in different prediction models. We screened 19 studies from a pool of 881 articles.
Results: The studies included 73–5,151 patients. In most studies, univariable logistic regression was used to develop prediction models. In two studies, external data were used to validate the developing model. The most commonly included predictors were C-reactive protein (CRP) level, male sex, and fever duration. All studies had a high bias risk, mostly because of small sample size, improper handling of missing data, and inappropriate descriptions of model performance and the evaluation model.
Conclusion: The prediction models were suitable for the subjects included in the studies, but were poorly effective in other populations. The phenomenon may partly be due to the bias risk in prediction models. Future models should address these problems and PROBAST should be used to guide study design.
What is already known on this topic
Almost all CAL prediction models performed well in the included population but were poorly effective in other populations.
This phenomenon is partly due to the differences in the genetic backgrounds of the populations.
What this study adds
In addition to differences in genetic background, bias in model development may be one of the major reasons for the lack of efficacy of the models in different populations.
This is the first time PROBAST has been applied for the evaluation of Kawasaki disease.
PROBAST revealed a high risk of bias in all studies, mostly because of small sample size, improper handling of missing data, and inappropriate descriptions of model performance and the evaluation model.
How this study might affect research, practice or policy
The risk of bias may be one of the reasons for the poor performance of the model in different populations.
Larger sample sizes, external data validation, better processing of missing values, and the use of appropriate model construction methods are the methods to reduce the bias of prediction models.
Future prediction models should pay more attention to these problems, and PROBAST can be used to guide study design.
Introduction
Kawasaki disease (KD) is an acute, self-limiting form of vasculitis that affects children, particularly those aged < 5 years (1). Medium-sized arteries, particularly coronary arteries, are the most vulnerable vessels in this disease (2). The incidence of coronary artery lesions (CALs) in affected patients has decreased significantly because of intravenous immune globulin (IVIG) therapy; however, they still occur in 4–6% of patients (2). The incidence of CALs is also closely related to cardiovascular diseases in adulthood, especially coronary heart disease (3). Patients believed to be at high risk for the development of these lesions may benefit from more aggressive primary adjunctive therapy, particularly increased additional anti-inflammatory medications including corticosteroids and infliximab (4). As in the case of IVIG resistance prediction (4), some Japanese risk models were found to be poorly effective in predicting CAL development in a Western population (5). On the one hand, this phenomenon may be partly attributable to racial and other differences between the study populations (1); on the other hand, several studies have reported that the quality of previous research on prediction models was poor (6). For these reasons, although a large number of articles on prediction models are published every year, only a very number them have been used (7). Therefore, a systematic review of these CAL prediction models and an effective model evaluation tool are very important.
In this systematic review, we aimed to minimize subjectivity and bias inherent in related previous research (8, 9). The Prediction Model Risk-of-Bias Assessment Tool (PROBAST) is useful for assessing systematic reviews of prediction model studies and critically appraising (primary) prediction model studies (10). PROBAST contains four domains with 20 signaling questions to assess the risk of bias for the prediction of CALs in KD. In this work, PROBAST was used to evaluate the reported CAL prediction models so as to identify a more effective prediction model for application in clinical treatment. This work is the very first instance of the application of PROBAST in KD research. To date, an assessment of the risk of bias (ROB) in prediction models for KD has not been reported. Therefore, as stated previously, this work was aimed at comprehensively evaluating the performance and bias of CAL prediction models in KD.
Materials and methods
Search strategy
English articles included in the PubMed, Embase, and Web of Science databases from January 1, 1980, to December 23, 2021, were searched using the following keywords: (“Kawasaki disease” OR “mucocutaneous lymph node syndrome”) AND (“coronary artery dilatation” OR “coronary artery aneurysms” OR “coronary artery lesions”) AND (“predict” OR “score” OR “nomogram”). As described previously (8), the list was validated to examine whether it was fit for purpose by comparing it to relevant hits from the said databases when combining KD (KD, mucocutaneous lymph node syndrome) and coronary artery lesion (“coronary artery dilatation” OR “coronary artery aneurysms” OR “coronary artery lesions”) search terms with methodological search terms (“predict” OR “score” OR “nomogram”). The aims of these studies were to determine the risk factors for coronary artery injury and to improve the prognosis of KD.
Inclusion and exclusion criteria
All of the studies that focused on the prediction of CALs in KD were included. The inclusion criteria were as follows: (1) predictive models established for populations with KD, (2) a diagnosis of KD and CALs established per diagnostic criteria, and (3) inclusion of at least two predictors in the prediction model, because PROBAST was designed to assess multivariable prediction models for diagnoses and doctors usually make predictions by integrating several characteristics and symptoms (6, 10). Studies that met the following criteria were excluded: (1) studies that did not include information on clinical outcomes; (2) studies that only included a single predictor; (3) studies that did not include animal research; (4) non-inclusion of reviews, case reports, and meta-analysis; (5) studies that investigated the same object, and (6) studies in which the predictors did not include genes, because there are large differences in genetic susceptibility to KD and genetic testing is not routinely performed in the treatment of KD (4).
Study selection and data extraction
Three researchers (HH, DJ, and WS) screened studies to determine if they developed or validated a multivariable model or scoring system to predict any CAL-related outcome, respectively. Any differences were resolved through discussion or by a statistics expert (SY). Then, the Critical Appraisal and Data Extraction for Systematic Reviews of Prediction Modeling Studies (CHARMS) checklist was used for data extraction (11). The PROBAST form was used to evaluate the bias of the prediction models (10). Some methods and principles derived from Preferred Reporting Items for Systematic Reviews and Meta-analyses (PRISMA) (12) and Transparent Reporting of a Multivariable Prediction Model for Individual Prognosis or Diagnosis (TRIPOD) (6) were used. Information was extracted from each prediction model, and predictive performance was evaluated by the type of validation, discrimination, and calibration (8).
Patient and public involvement statement
Patients and/or the public were not involved in the design, or conduct, or reporting, or dissemination plans of this research.
Results
We identified 881 articles through our search of PubMed (n = 125), Embase (n = 406), and Web of Science (n = 350). Of the 881 articles, 19 pertaining to studies describing CAL prediction models met the inclusion criteria and were selected for data extraction and critical appraisal (5, 13–30). In Figure 1, the flowchart, in line with PRISMA, shows our retrieval process.
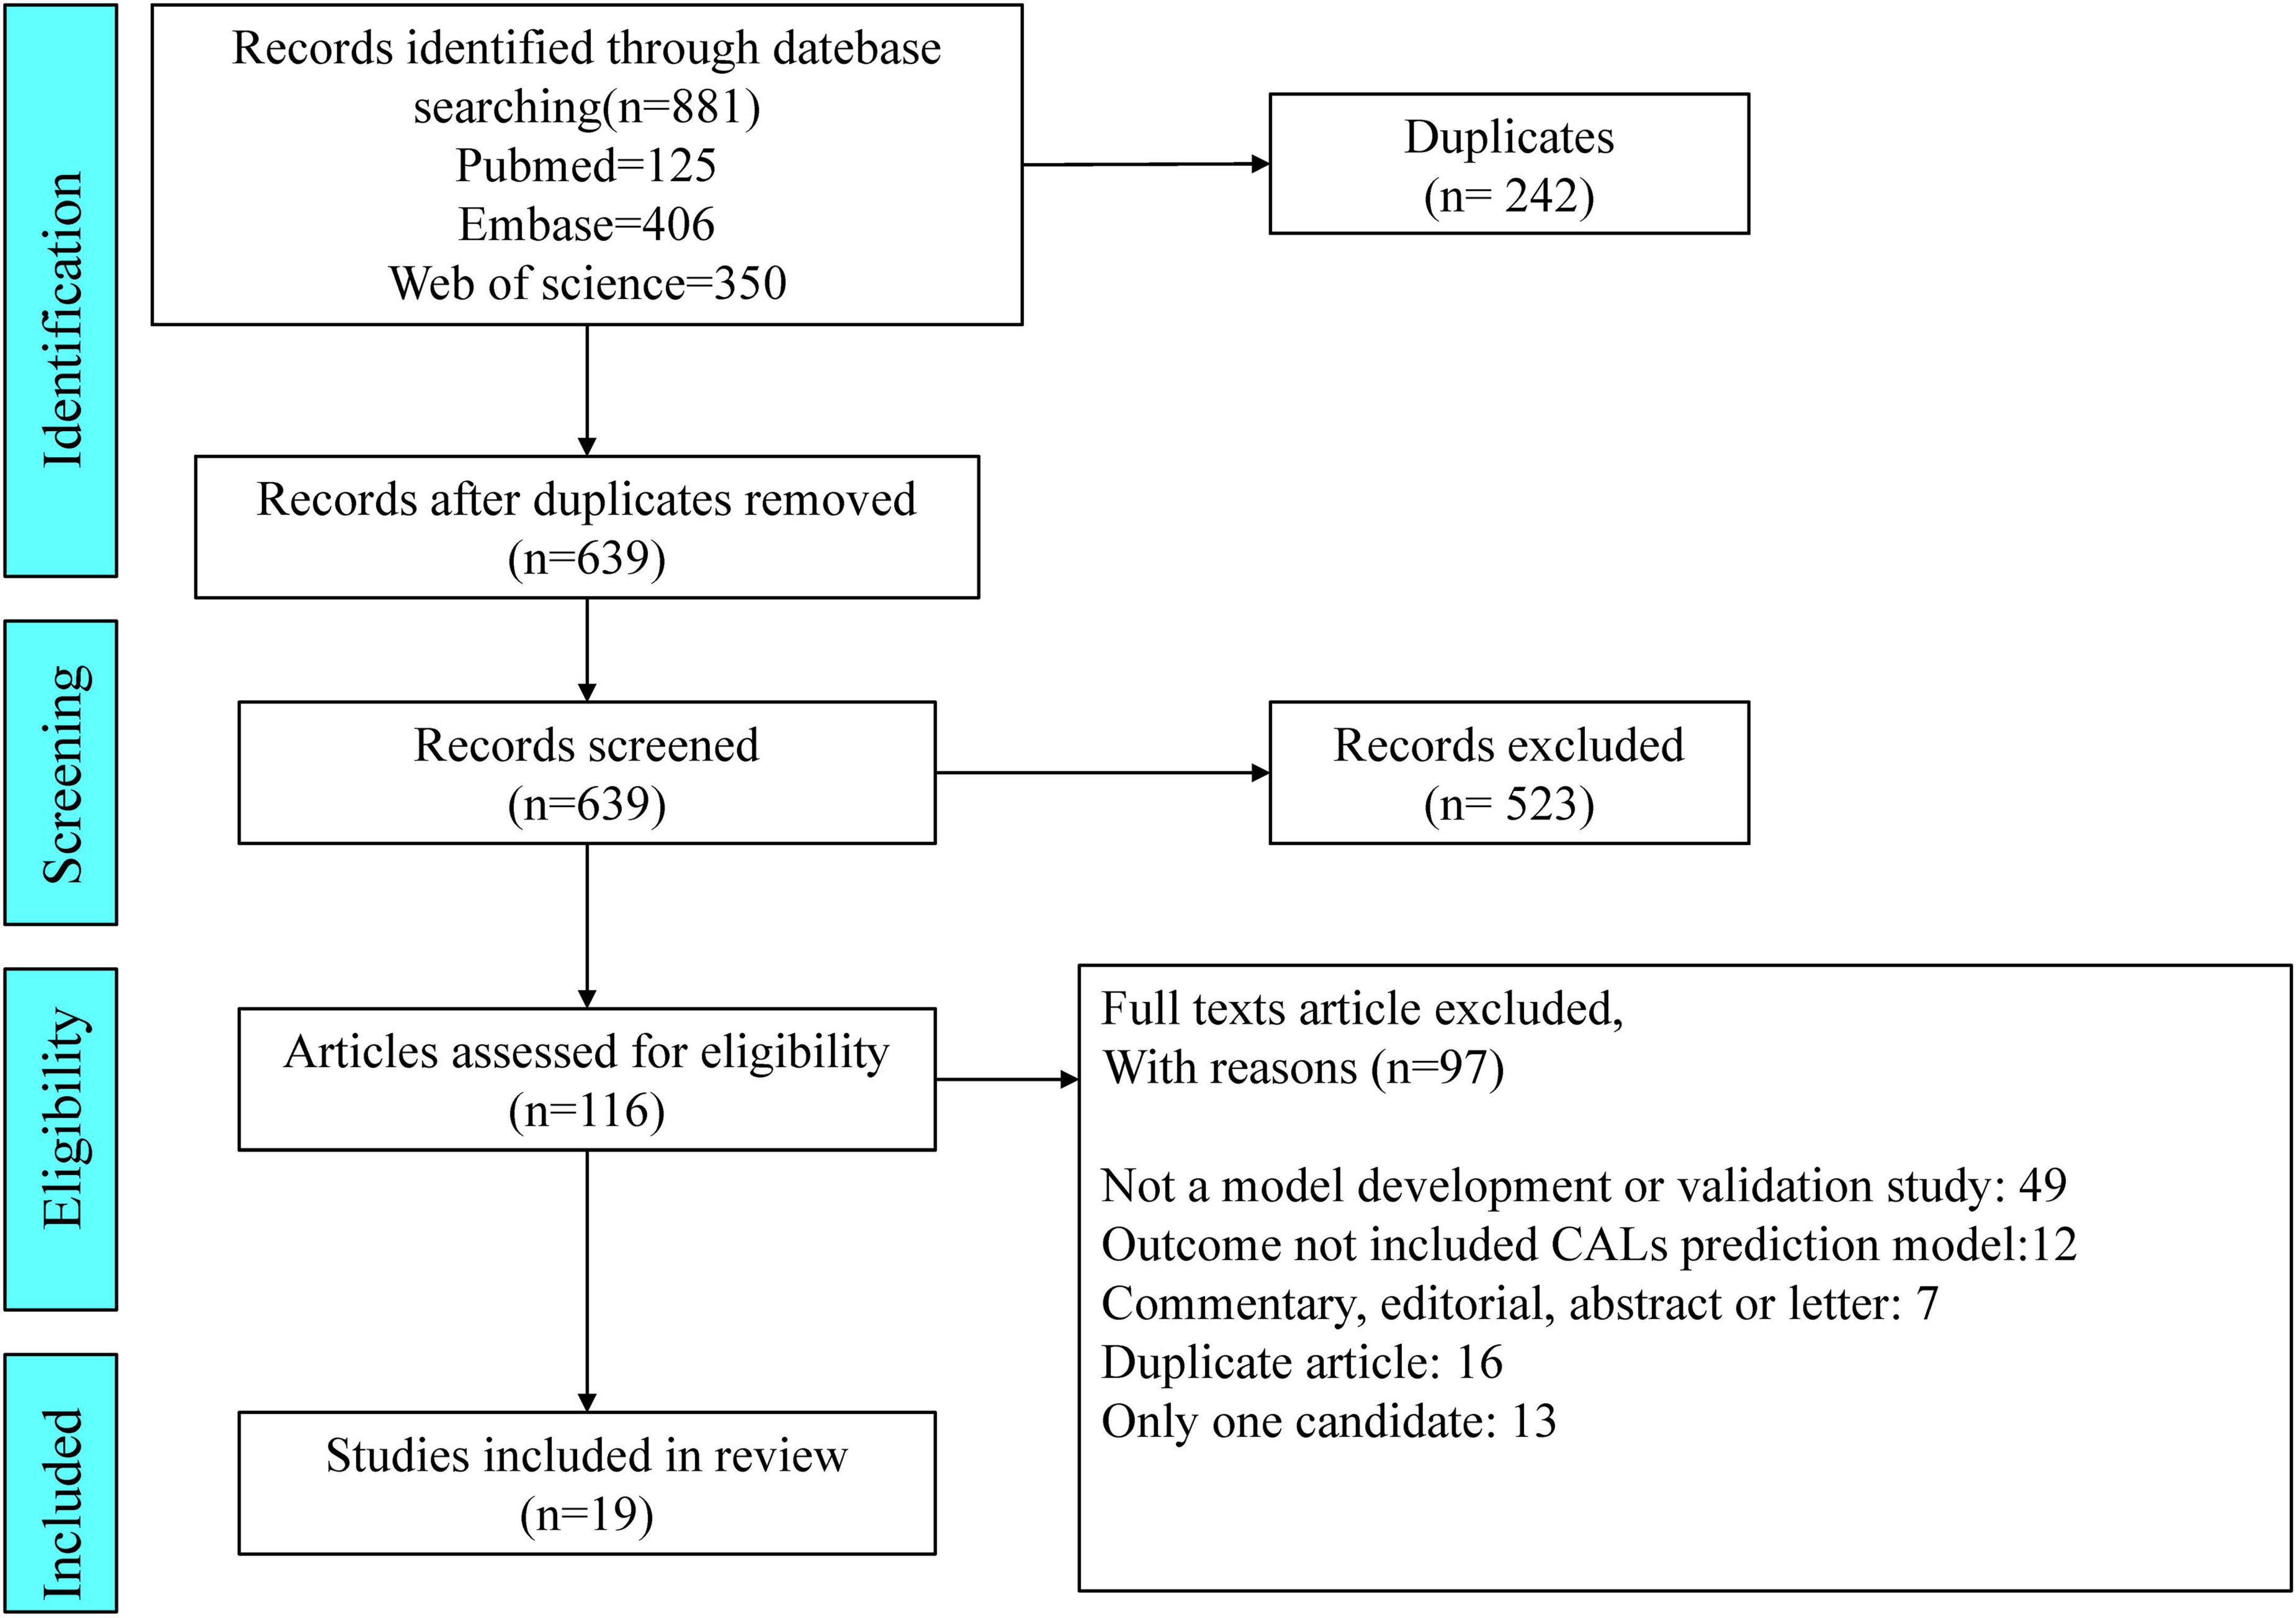
Figure 1. Preferred Reporting Items for Systematic Reviews and Meta-analyses (PRISMA) flowchart of the study inclusions and exclusions.
Study characteristics
Thirteen studies used data on patients with KD from different regions of Asia, such as China (20, 27, 29), Taiwan (16, 22, 24), Japan (13, 21, 25), Korea (14, 26, 30), and Thailand (18). Four studies were published in Europe, including Poland (15), Spain (19), Turkey (23) and France (28). The remaining two articles were for studies from the USA (5, 17) (Figure 2A). Almost all articles had been published in the last 10 years (from 2012 to 2021), except two articles (13) (26) published in 1986 and 2007, respectively (Figure 2B). The duration of follow-up was significantly different, extending from immediately after treatment (21) to 3 months after treatment (29). The number of patients included ranged from 73 (15) to 5,151 (30). All study designs were based on retrospective cohorts. The median age, sex proportion, and other details are shown in Supplementary Table 1.
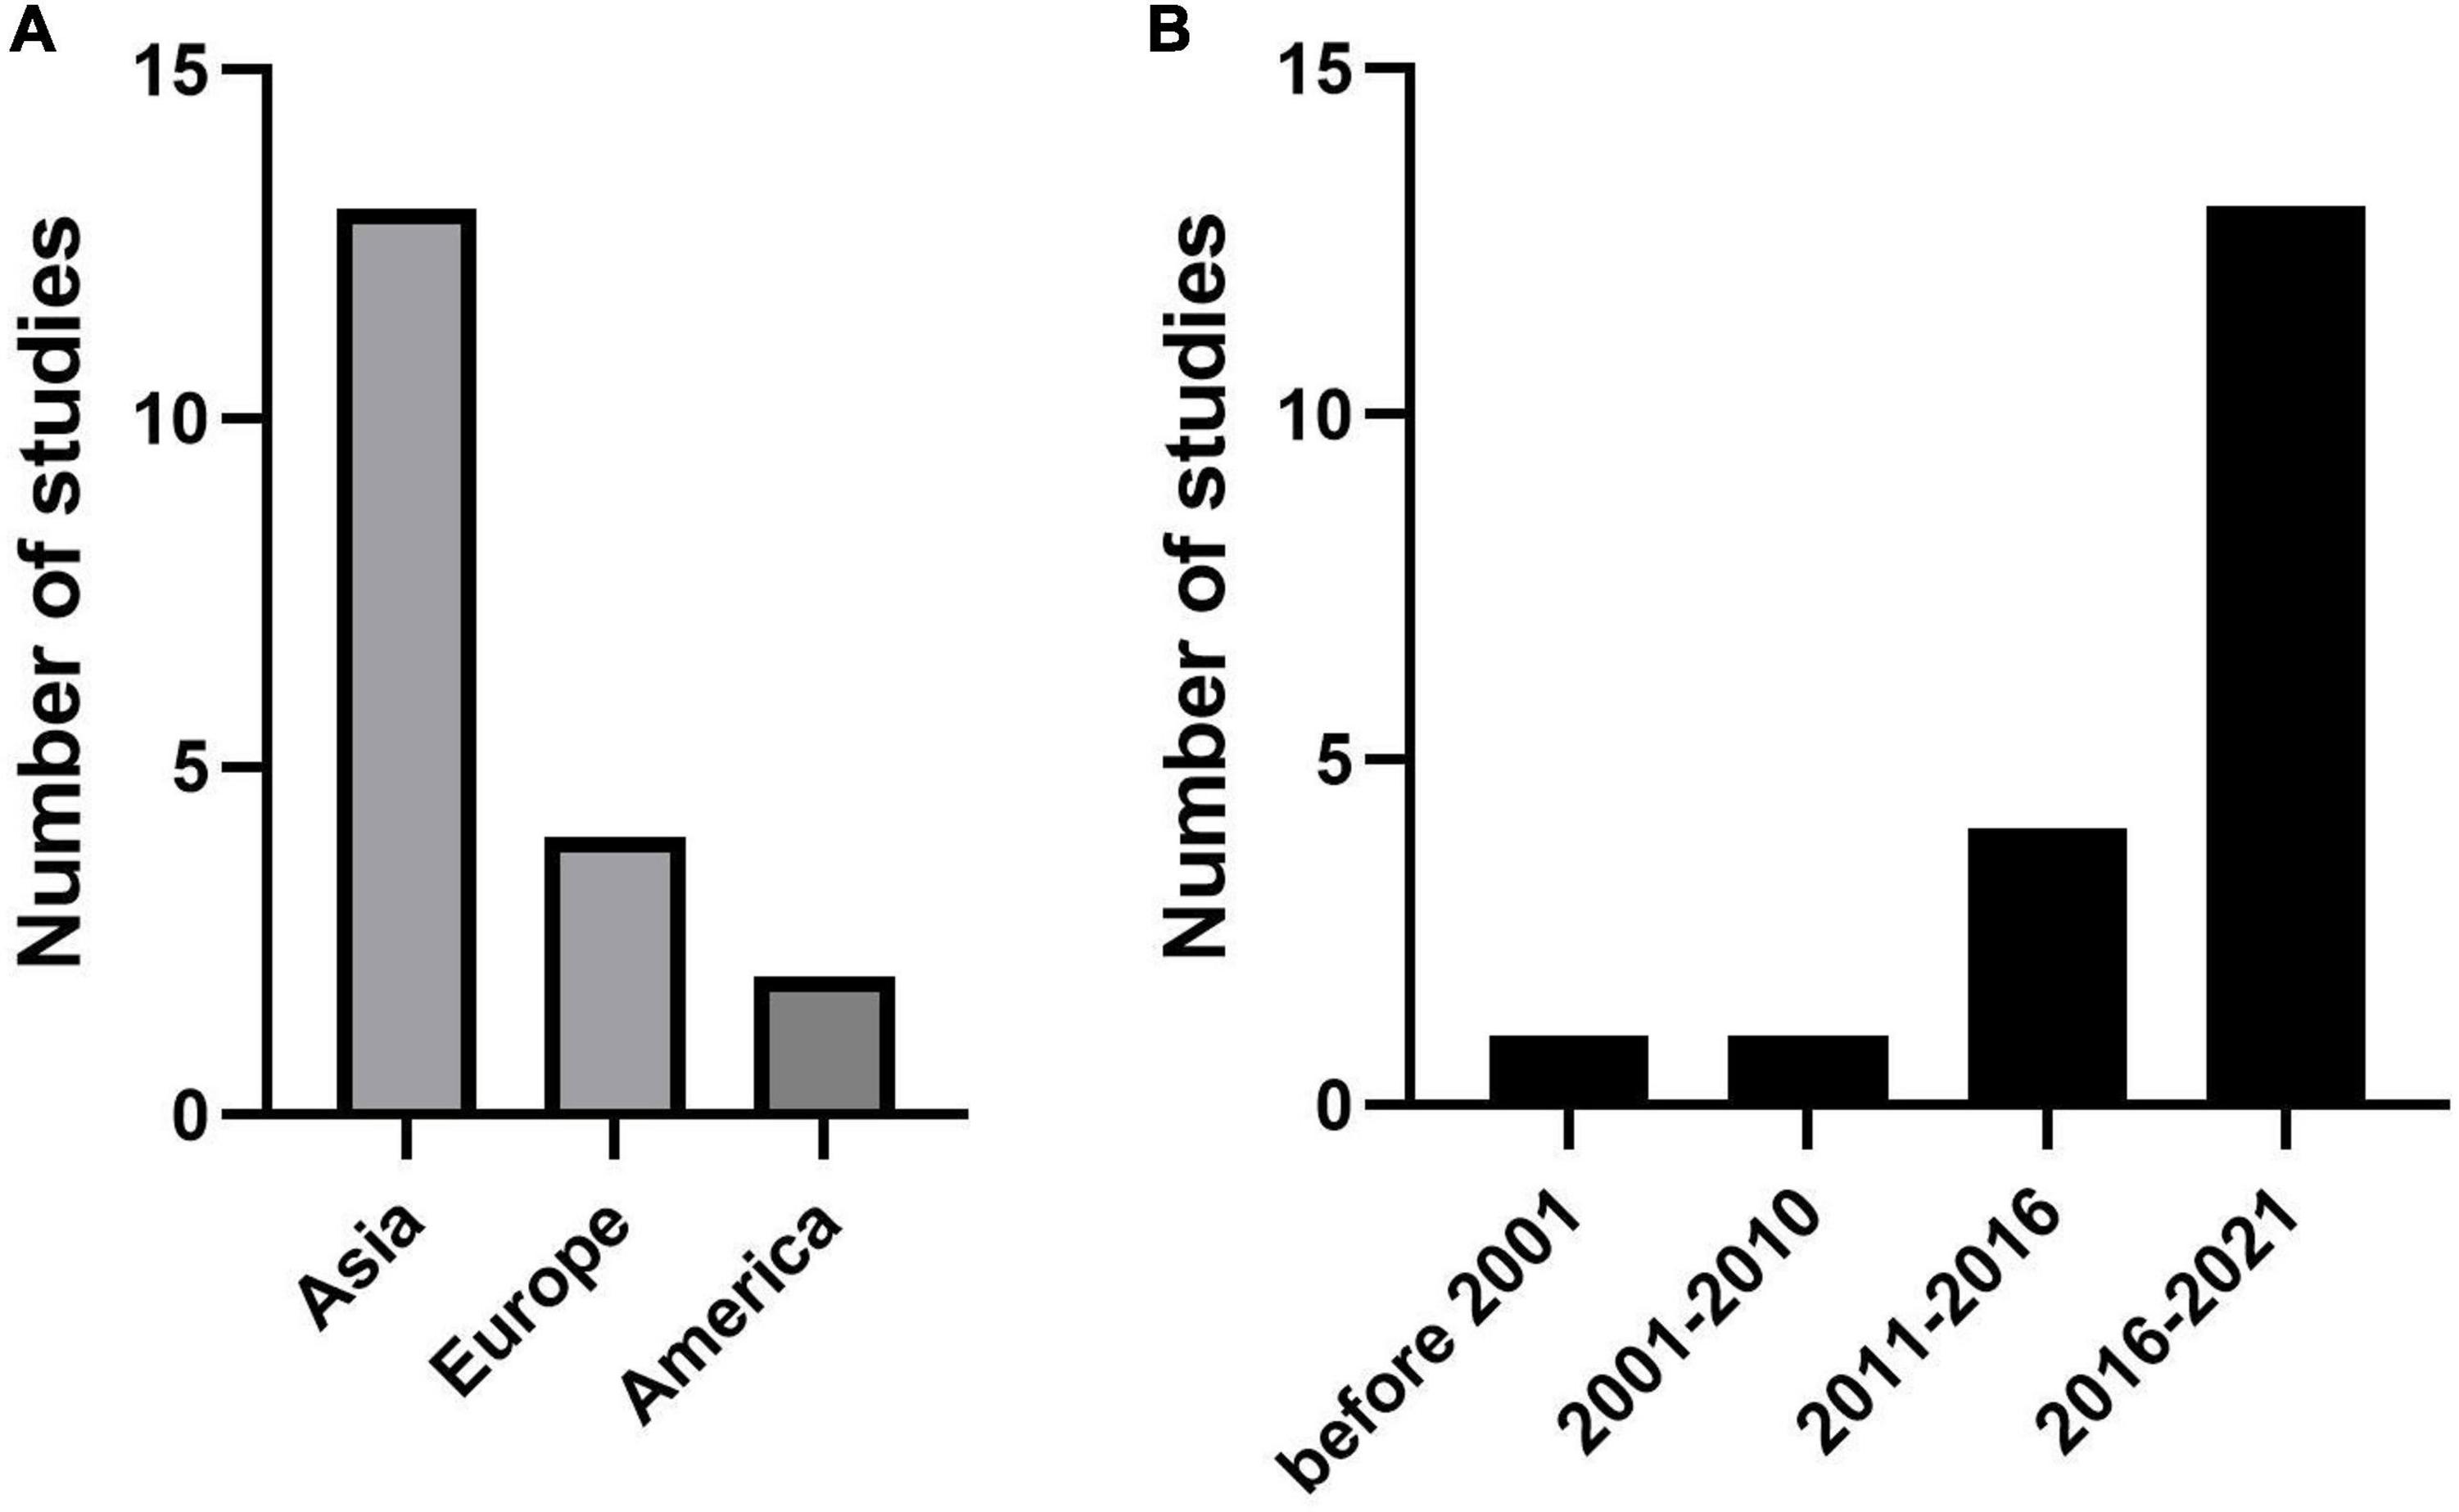
Figure 2. Publications trends for the coronary artery lesion (CAL) prediction model. (A) The number of studies in different regions. (B) The number of studies in different years.
Methods of development and validation
Most studies included used logistic regression. One study used discrimination analysis (13), while two (17, 23) used multivariable analysis. Only one study used machine learning methods. The machine learning methods included the mean structure equation model and neural networks. All but two studies (5, 21) did not use external data to validate the developed model.
Predictors in the final model
Different prediction models provided different predictors. The most frequently included predictors were C-reactive protein (CRP) level, male sex, and fever duration. Seven articles reported that these factors indicated a high risk of CALs. Platelet count, age, and IVIG resistance were considered as risk factors for CALs in six articles each. The other predictors that deserved attention included the baseline Z score and the day of the beginning of treatment. Those two predictors were screened out by more than three articles each.
Definition of coronary artery lesions and model performance
The diagnosis of CALs showed changes over the long period of the literature included in the study, resulting in different diagnostic criteria for CALs in different articles. However, these differences in CAL diagnoses were based on the relevant diagnostic guidelines at that time. Because the Z score was clinically used for a short time, less than half of the articles (7/19) defined CALs by Z score (5, 14, 16, 17, 21, 24, 25). Four of these articles were published in the last 3 years. The remaining articles used diameter to assess the occurrence of CALs. Almost half of these article outcomes (9/19) to assess the performance of CALs models were sensitivity, specificity, and AUC (area under the curve of a receiver operating characteristic curve). The ranges were as follows: sensitivity, 25.0% (30) to 87.5% (13); specificity, 68.2% (20) to 99% (21); and AUC, 0.52 (30) to 0.86 (24).
Risk of bias
All articles assessed by PROBAST tools be considered as high ROB (Supplementary Table 2). This result suggests that the poor applicability of the CAL prediction model may be related to the bias of the model itself. Sixteen of the 19 articles had a high ROB for the participants’ domain, because these articles used existing data which were considered cause ROB easily (10). Only three articles (19, 25, 30) used registration data which were recommended by PROBAST. Eighteen of the 19 articles had a low ROB for the predictor domain. The reason for unclear was that one of the predictors they included was IVIG resistance, but they evaluated the CALs from onset to 1 month. IVIG resistance may be an unavailable predictor when the onset of disease course because we did not know whether the IVIG resistance would happen. About the outcome domain, nine of the 19 articles had a low ROB. Four of the 19 articles were assessed as unclear because they did not explain the diagnostic criteria of KD. We should make clear the correct diagnosis of KD before we evaluate the classification of CALs. Six of the 19 articles used the Z score or diameter of the coronary artery as predictors, predictors were very similar to the outcome definition should be considered a high ROB (Figure 3).
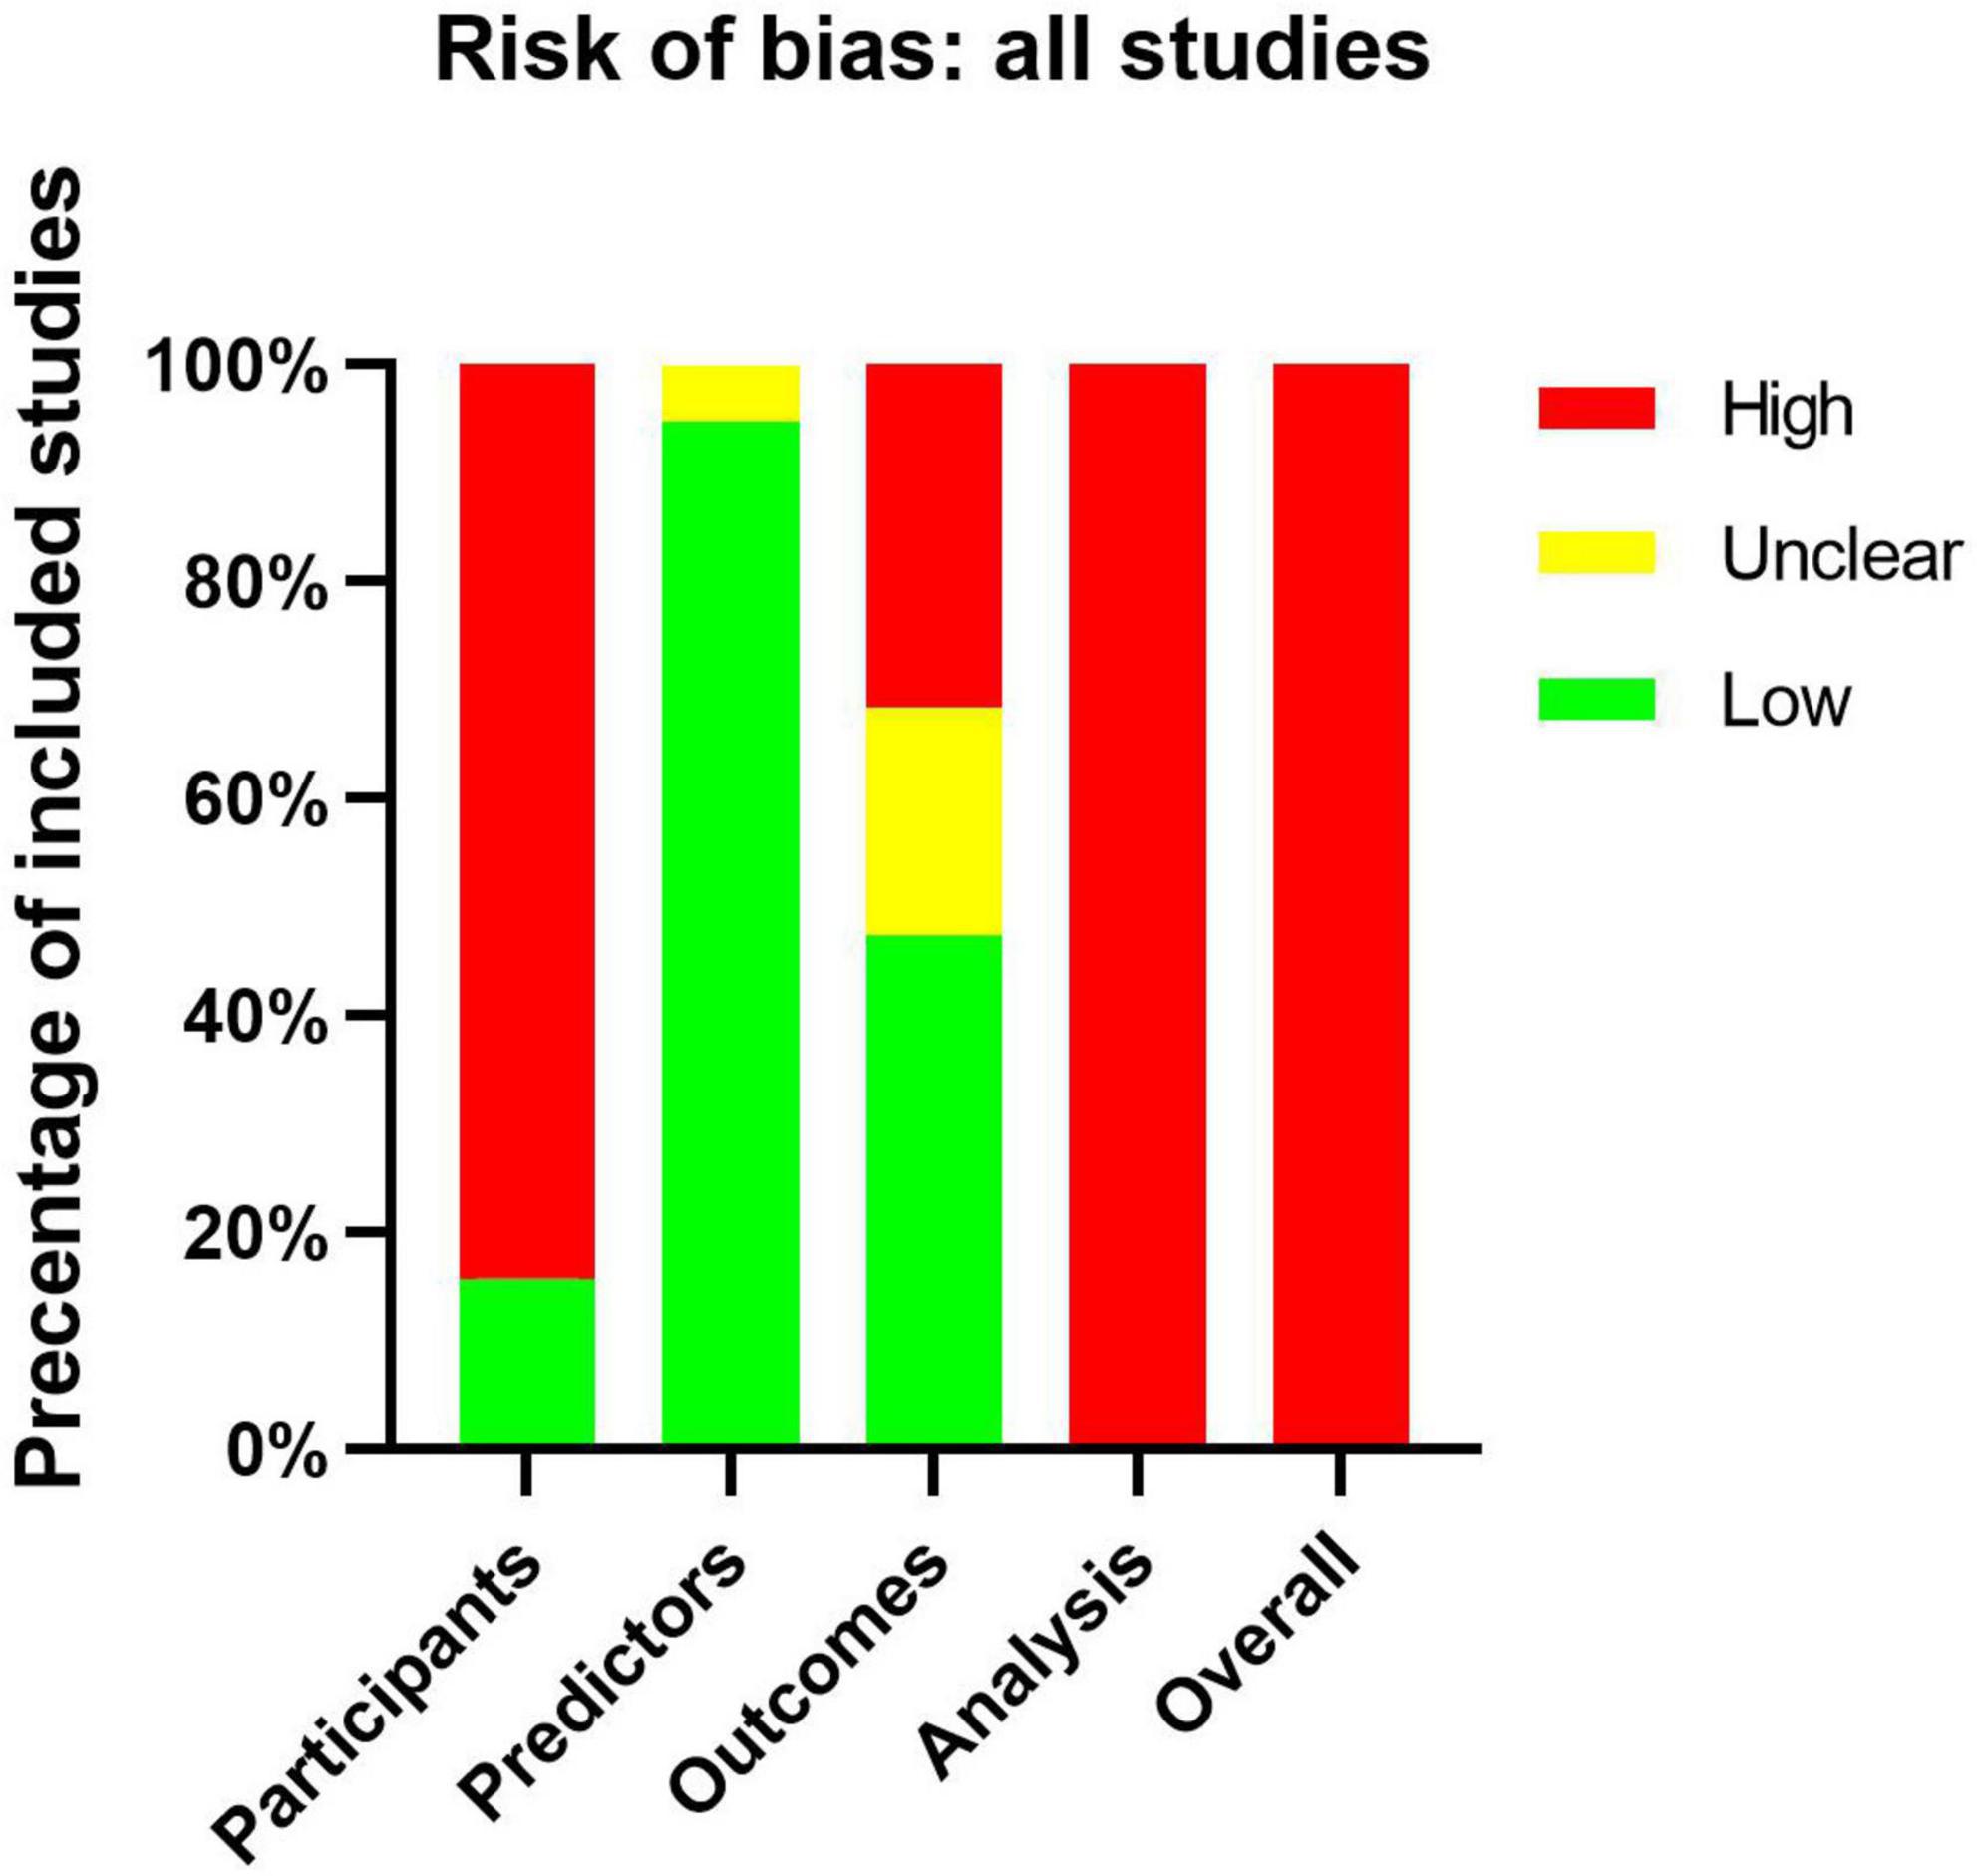
Figure 3. Risk-of-bias assessment of the included studies by using the Prediction Model Risk of Bias Assessment Tool (PROBAST).
All studies showed a high ROB for the analysis domain (Table 1), which can be attributed to many reasons. In our study, the small number of cases in training set, dichotomization of continuous predictors, lack of external validation, the use of univariable analysis to select predictors, and direct deletion of missing data were the most commonly identified deficiencies. Such serious deficiencies can yield prediction models that are unsuitable for clinical application (6). According to the event per variable (EPV) principle to evaluate the effective sample size, eight of the 19 articles had appropriate EPVs of at least 20. Only five articles did not switch the continuous predictors into classified data. None of those articles dealt with missing data with an appropriate method like multiple imputations. Three articles avoided the use of univariable analysis: two (17, 30) used multivariable logistic regression directly and one (21) used neural network analyses. Moreover, none of these articles used calibration plots or tables to calibrate the prediction model, and only two articles (5, 17) evaluated the calibration by Hosmer–Lemeshow test. Six articles evaluate the discrimination by meaning the C-index or AUC. Nine articles evaluated the classification on the basis of sensitivity and specificity. Only two articles (5, 21) used external data to validate the model performance.
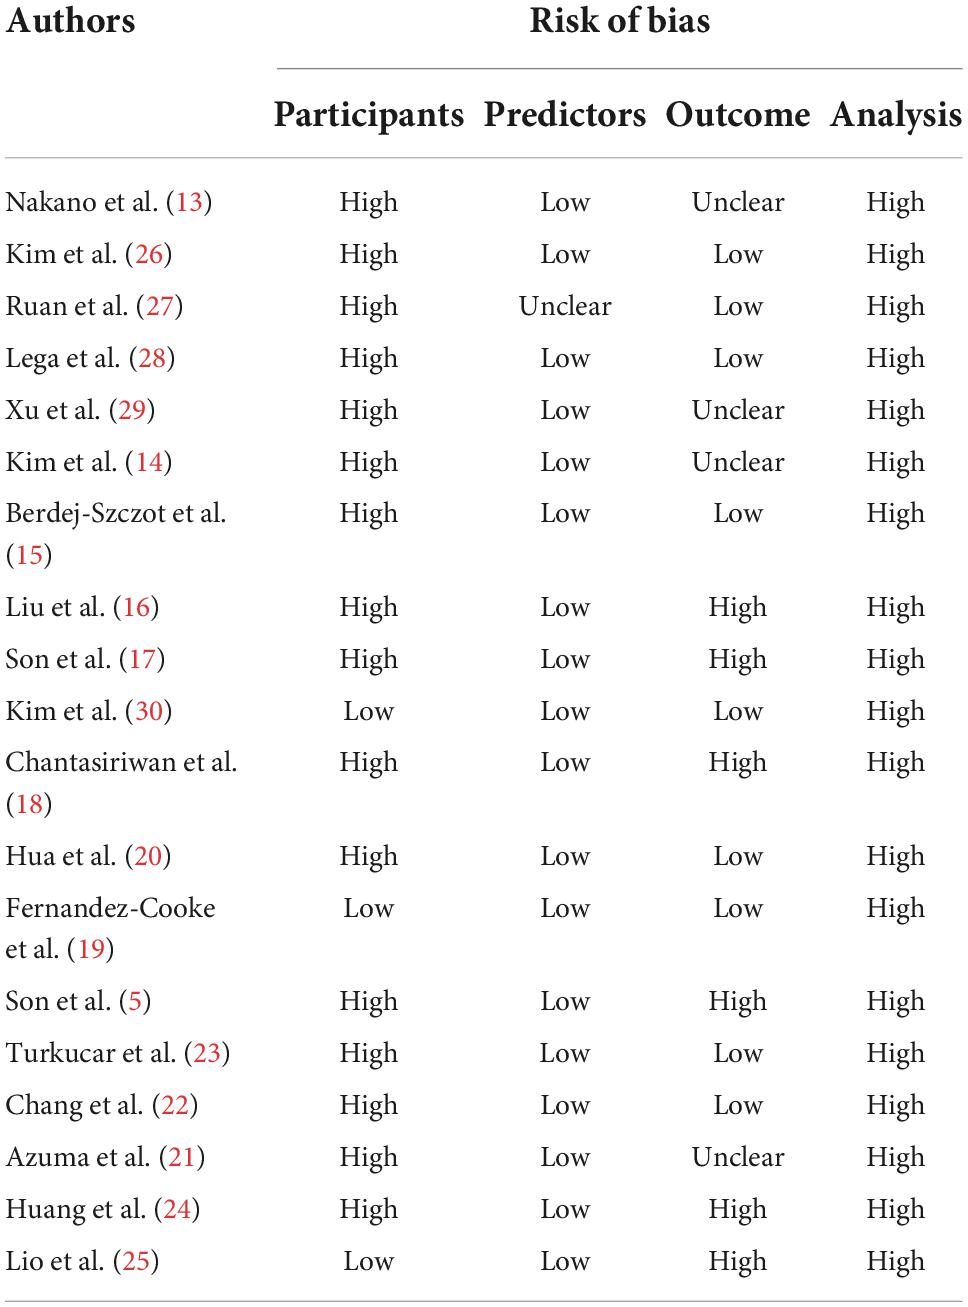
Table 1. Risk of bias assessment (using PROBAST) based on four domains across 27 studies that created CALs prediction models for Kawasaki disease.
Discussion
In this study of prediction models related to CALs in KD, we critically appraised 19 studies using PROBAST. Although these prediction models may have been suitable for the patients included in the respective studies, they were all appraised to have high ROB owing to different reasons, including small sample sizes, improper handling of missing data, and inappropriate description of model performance and evaluation model. Therefore, we have discussed the common causes of biases in prediction model, with the aim of providing references and suggestions for building a more practical CAL prediction models in the future.
Sample size
A major reason for the poor performance of the CAL prediction models in different populations was that the sample size was insufficient, and the EPV values were often less than 10, which made the model prone to overfitting. An overfitting model is too closely tailored to the training data that yields inaccurate predictions in other populations (11). Eight of the 19 articles had adequate EPVs, which may indicate us more people should be included to develop a more valuable prediction model.
Candidate predictors
Differences in the definitions and measurement methods of candidate predictors may also lead to the poor prediction performance in different populations (11). In our study, the definitions of CALs were different, and ranged from evaluation of diameters to measurement of Z scores. Moreover, the measurement methods involved different evaluation times and intervals of cardiac ultrasound after treatment with IVIG, different pediatric echocardiographers and different cardiac color Doppler ultrasound machines, which may also lead to poor prediction efficiency in different populations.
Missing data
Many studies simply deleted participants or candidate predictors with a number of missing data, which yielded a non-random subset of the original study sample, and produced inefficient prediction performance (31). Multiple imputation is strongly recommended as a preferred method for handling missing data (11, 31). Unfortunately, none of the articles assessed in our study used this method. One article used expectation maximum estimated statistics (27). The inappropriate deletion of missing data was another reason for the poor performance of the prediction model.
Model development
Because the CHARMS checklist reported that model development should not be based on univariable testing, which causes a severe risk of predictor selection bias (11), we designed the exclusion criteria by including only one predictor. However, the approaches for handling continuous predictors were still unsatisfactory. Many statements recommended keeping continuous variables continuous instead of converting them into categorical variables, which reduces predictive ability (10, 32). Only one article used a machine learning methods for analysis (21). Greater application of machine learning methods and less univariate analysis may be more conducive to the development of prediction models.
Model performance
Calibration and discrimination are often used to measure prediction model performance, and classical indicators such as sensitivity and specificity are used to evaluate the model classification abilities (10). Eight of the 19 articles used sensitivity and specificity to evaluate model performance, but different thresholds produced different values for sensitivity and specificity. The choice of the threshold should be based on the general principle rather than the data itself. Instead, the studies determined the threshold on the basis of the data itself, which may be another reason for the over-optimistic estimates of model performance. None of the articles used a calibration plot to display the model’s calibration. Two articles used only the Hosmer–Lemeshow test to calibrate the prediction model even though this test can be considered to yield poor calibration (10). Discrimination is usually assessed using C-index or AUC, since these two indicators have the same sense. Six articles used this indicator to evaluate the model performance. Due to these situations, more appropriate methods to evaluate the performance of the model, such as the calibration plot and C-index, should be included in future studies on prediction model construction.
Model evaluation
Analyses using an independent validation dataset are essential to avoid developing an overestimating model. The validation process should consist of both internal and external validation. Internal validation usually includes bootstrapping and cross-validation, while external validation differs in time (temporal validation) or location (geographical validation) from the data resource (10). Bootstrapping has been shown to be more effective in small datasets (10). In comparison with temporal validation, geographical validation has been more recommended in external validation (11). Two articles used external validation, and employed geographical validation to assess their models (5, 21). Thus, further development and verification of CAL prediction models using both internal and external validation is essential.
Conclusion
Although the reported prediction models for CALs in KD were appropriate in their respective studies, they did not perform well in other populations. In addition to the differences in genetic backgrounds, the authors’ overly optimistic evaluation models may be another reason for these discrepancies. In assessments performed using PROBAST tools, all of these models showed high ROB, mainly because of the small sample size, improper handling of missing data, inappropriate description of model performance, and inappropriate evaluation model cause the performance of model is likely to be misleading and optimistic. Future prediction models should address these problems and use PROBAST to guide the study design.
Limitations
Our study had several limitations. First, most articles (14/19) had been published before the PROBAST tool was published in 2019, so the authors of those articles could not have used this tool to assess their studies, potentially increasing the proportion of studies classified as showing a high ROB. Second, KD has obvious genetic background differences; thus, it is impossible to build a perfect model only by correcting the model bias. Third, our research included articles published in English, it may cause bias. Last, ROB judgment is subjective sometimes. Different raters may draw different conclusions, when we close the decision by a statistics expert and ruled out other raters’ conclusions may lead to another type of bias. And more reasonable methods need to be considered.
Data availability statement
The original contributions presented in this study are included in the article/Supplementary material, further inquiries can be directed to the corresponding authors.
Author contributions
HH, JD, and SW conceived the idea of the study and screened the studies. YS supervised the analysis. YZ, JJ, BZ, XL, FY, SM, YH, FL, and CC performed data collection. HH drafted the manuscript. QC and HL critically reviewed and revised this manuscript. All authors contributed to the article and approved the submitted version.
Funding
This work was supported by the National Natural Science Foundation of China (grant numbers: 81870365 and 82070512); the Natural Science Foundation of Young (No. 81900450); and the Project of Education and Scientific Research for Young and Middleaged Teachers in Fujian Province, China (grant number: JAT200124).
Acknowledgments
We thank YS for his statistical expertise.
Conflict of interest
The authors declare that the research was conducted in the absence of any commercial or financial relationships that could be construed as a potential conflict of interest.
Publisher’s note
All claims expressed in this article are solely those of the authors and do not necessarily represent those of their affiliated organizations, or those of the publisher, the editors and the reviewers. Any product that may be evaluated in this article, or claim that may be made by its manufacturer, is not guaranteed or endorsed by the publisher.
Supplementary material
The Supplementary Material for this article can be found online at: https://www.frontiersin.org/articles/10.3389/fcvm.2022.1014067/full#supplementary-material
Abbreviations
CALs, coronary artery lesions; PROBAST, Prediction Model Risk-of-Bias Assessment Tool; CRP, C-reactive protein; KD, Kawasaki disease; IVIG, intravenous immune globulin; ROB, risk of bias; CHARM, Critical Appraisal and Data Extraction for Systematic Reviews of Prediction Modeling Studies; PRISMA, Preferred Reporting Items for Systematic Reviews and Meta-analyses; TRIPOD, Transparent Reporting of a Multivariable Prediction Model for Individual Prognosis or Diagnosis; AUC, area under the curve of a receiver operating characteristic curve; EPV, event per variable.
References
1. Huang H, Jiang J, Shi X, Qin J, Dong J, Xu L, et al. Nomogram to predict risk of resistance to intravenous immunoglobulin in children hospitalized with kawasaki disease in Eastern China. Ann Med. (2022) 54:442–53. doi: 10.1080/07853890.2022.2031273
2. Friedman KG, Gauvreau K, Hamaoka-Okamoto A, Tang A, Berry E, Tremoulet AH, et al. Coronary artery aneurysms in kawasaki disease: risk factors for progressive disease and adverse cardiac events in the Us population. J Am Heart Assoc. (2016) 5:e003289. doi: 10.1161/JAHA.116.003289
3. Fukazawa R, Kobayashi J, Ayusawa M, Hamada H, Miura M, Mitani Y, et al. Jcs/Jscs 2020 guideline on diagnosis and management of cardiovascular sequelae in kawasaki disease. Circ J. (2020) 84:1348–407.
4. McCrindle BW, Rowley AH, Newburger JW, Burns JC, Bolger AF, Gewitz M, et al. Diagnosis, treatment, and long-term management of kawasaki disease: a scientific statement for health professionals from the American Heart Association. Circulation. (2017) 135:e927–99. doi: 10.1161/CIR.0000000000000484
5. Son MBF, Gauvreau K, Tremoulet AH, Lo M, Baker AL, de Ferranti S, et al. Risk model development and validation for prediction of coronary artery aneurysms in kawasaki disease in a North American Population. J Am Heart Assoc. (2019) 8:e011319. doi: 10.1161/JAHA.118.011319
6. Collins GS, Reitsma JB, Altman DG, Moons KG. Transparent reporting of a multivariable prediction model for individual prognosis or diagnosis (tripod): the tripod statement. Br J Surg. (2015) 102:148–58. doi: 10.1002/bjs.9736
7. Steyerberg EW, Moons KG, van der Windt DA, Hayden JA, Perel P, Schroter S, et al. Prognosis research strategy (progress) 3: prognostic model research. PLoS Med. (2013) 10:e1001381. doi: 10.1371/journal.pmed.1001381
8. Wynants L, Van Calster B, Collins GS, Riley RD, Heinze G, Schuit E, et al. Prediction models for diagnosis and prognosis of COVID-19: systematic review and critical appraisal. BMJ. (2020) 369:m1328. doi: 10.1136/bmj.m1328
9. Siddaway AP, Wood AM, Hedges LV. How to do a systematic review: a best practice guide for conducting and reporting narrative reviews, meta-analyses, and meta-syntheses. Annu Rev Psychol. (2019) 70:747–70. doi: 10.1146/annurev-psych-010418-102803
10. Moons KG, Wolff RF, Riley RD, Whiting PF, Westwood M, Collins GS, et al. Probast: a tool to assess risk of bias and applicability of prediction model studies: explanation and elaboration. Ann Internal Med. (2019) 170:W1–33. doi: 10.7326/M18-1377
11. Moons KG, de Groot JA, Bouwmeester W, Vergouwe Y, Mallett S, Altman DG, et al. Critical appraisal and data extraction for systematic reviews of prediction modelling studies: the charms checklist. PLoS Med. (2014) 11:e1001744. doi: 10.1371/journal.pmed.1001744
12. Page MJ, Moher D, Bossuyt PM, Boutron I, Hoffmann TC, Mulrow CD, et al. Prisma 2020 explanation and elaboration: updated guidance and exemplars for reporting systematic reviews. BMJ. (2021) 372:n160. doi: 10.1136/bmj.n160
13. Nakano H, Ueda K, Saito A, Tsuchitani Y, Kawamori J, Miyake T, et al. Scoring method for identifying patients with kawasaki disease at high risk of coronary artery aneurysms. Am J Cardiol. (1986) 58:739–42.
14. Kim BY, Kim D, Kim YH, Ryoo E, Sun YH, Jeon IS, et al. Non-responders to intravenous immunoglobulin and coronary artery dilatation in kawasaki disease: predictive parameters in Korean Children. Korean Circ J. (2016) 46:542–9. doi: 10.4070/kcj.2016.46.4.542
15. Berdej-Szczot E, Malecka-Tendera E, Gawlik T, Firek-Pedras M, Szydlowski L, Gawlik A. Risk factors of immunoglobulin resistance and coronary complications in children with kawasaki Disease. Kardiol Pol. (2017) 75:261–6. doi: 10.5603/KP.a2016.0179
16. Liu MY, Liu HM, Wu CH, Chang CH, Huang GJ, Chen CA, et al. Risk factors and implications of progressive coronary dilatation in children with kawasaki disease. BMC Pediatr. (2017) 17:139. doi: 10.1186/s12887-017-0895-8
17. Son MBF, Gauvreau K, Kim S, Tang A, Dedeoglu F, Fulton DR, et al. Predicting coronary artery aneurysms in kawasaki disease at a North American center: an assessment of baseline Z Scores. J Am Heart Assoc. (2017) 6:e005378. doi: 10.1161/JAHA.116.005378
18. Chantasiriwan N, Silvilairat S, Makonkawkeyoon K, Pongprot Y, Sittiwangkul R. Predictors of intravenous immunoglobulin resistance and coronary artery aneurysm in patients with kawasaki disease. Paediatr Int Child Health. (2018) 38:209–12. doi: 10.1080/20469047.2018.1471381
19. Fernandez-Cooke E, Barrios Tascon A, Sanchez-Manubens J, Anton J, Grasa Lozano CD, Aracil Santos J, et al. Epidemiological and clinical features of kawasaki disease in spain over 5 years and risk factors for aneurysm development. (2011-2016): kawa-race study group. PLoS One. (2019) 14:e0215665. doi: 10.1371/journal.pone.0215665
20. Hua W, Ma F, Wang Y, Fu S, Wang W, Xie C, et al. A new scoring system to predict kawasaki disease with coronary artery lesions. Clin Rheumatol. (2019) 38:1099–107. doi: 10.1007/s10067-018-4393-7
21. Azuma J, Yamamoto T, Nitta M, Hasegawa Y, Kijima E, Shimotsuji T, et al. Structure equation model and neural network analyses to predict coronary artery lesions in kawasaki disease: a single-centre retrospective study. Sci Rep. (2020) 10:11868. doi: 10.1038/s41598-020-68657-0
22. Chang LS, Lin YJ, Yan JH, Guo MM, Lo MH, Kuo HC. Neutrophil-to-lymphocyte ratio and scoring system for predicting coronary artery lesions of kawasaki disease. BMC Pediatr. (2020) 20:398. doi: 10.1186/s12887-020-02285-5
23. Turkucar S, Yildiz K, Acari C, Dundar HA, Kir M, Unsal E. Risk factors of intravenous immunoglobulin resistance and coronary arterial lesions in turkish children with kawasaki disease. Turk J Pediatr. (2020) 62:1–9. doi: 10.24953/turkjped.2020.01.001
24. Huang CY, Chiu NC, Huang FY, Chao YC, Chi H. Prediction of coronary artery aneurysms in children with kawasaki disease before starting initial treatment. Front Pediatr. (2021) 9:748467. doi: 10.3389/fped.2021.748467
25. Iio K, Morikawa Y, Miyata K, Kaneko T, Misawa M, Yamagishi H, et al. Risk factors of coronary artery aneurysms in kawasaki disease with a low risk of intravenous immunoglobulin resistance: an analysis of post raise. J Pediatr. (2022) 240:e4. doi: 10.1016/j.jpeds.2021.08.065
26. Kim T, Choi W, Woo CW, Choi B, Lee J, Lee K, et al. Predictive risk factors for coronary artery abnormalities in kawasaki disease. Eur J Pediatr. (2007) 166:421–5. doi: 10.1007/s00431-006-0251-8
27. Ruan Y, Ye B, Zhao X. Clinical characteristics of kawasaki syndrome and the risk factors for coronary artery lesions in China. Pediatr Infect Dis J. (2013) 32:e397–402.
28. Lega JC, Bozio A, Cimaz R, Veyrier M, Floret D, Ducreux C, et al. Extracoronary echocardiographic findings as predictors of coronary artery lesions in the initial phase of kawasaki disease. Arch Dis Child. (2013) 98:97–102. doi: 10.1136/archdischild-2011-301256
29. Xu H, Fu S, Wang W, Zhang Q, Hu J, Gao L, et al. Predictive value of red blood cell distribution width for coronary artery lesions in patients with kawasaki disease. Cardiol Young. (2016) 26:1151–7. doi: 10.1017/S1047951115002140
30. Kim MK, Song MS, Kim GB. Factors predicting resistance to intravenous immunoglobulin treatment and coronary artery lesion in patients with kawasaki disease: analysis of the korean nationwide multicenter survey from 2012 to 2014. Korean Circ J. (2018) 48:71–9. doi: 10.4070/kcj.2017.0136
31. Donders ART, Van Der Heijden GJ, Stijnen T, Moons KGA. Gentle introduction to imputation of missing values. J Clin Epidemiol. (2006) 59:1087–91.
Keywords: coronary artery lesions, Kawasaki disease, Prediction Model Risk-of-Bias Assessment Tool, prediction model, diagnosis
Citation: Huang H, Dong J, Wang S, Shen Y, Zheng Y, Jiang J, Zeng B, Li X, Yang F, Ma S, He Y, Lin F, Chen C, Chen Q and Lv H (2022) Prediction Model Risk-of-Bias Assessment Tool for coronary artery lesions in Kawasaki disease. Front. Cardiovasc. Med. 9:1014067. doi: 10.3389/fcvm.2022.1014067
Received: 08 August 2022; Accepted: 23 September 2022;
Published: 13 October 2022.
Edited by:
Yoshihide Mitani, Mie University, JapanReviewed by:
Fuyong Jiao, Xi’an Jiaotong University, ChinaTakamichi Ishikawa, Hamamatsu University School of Medicine, Japan
Copyright © 2022 Huang, Dong, Wang, Shen, Zheng, Jiang, Zeng, Li, Yang, Ma, He, Lin, Chen, Chen and Lv. This is an open-access article distributed under the terms of the Creative Commons Attribution License (CC BY). The use, distribution or reproduction in other forums is permitted, provided the original author(s) and the copyright owner(s) are credited and that the original publication in this journal is cited, in accordance with accepted academic practice. No use, distribution or reproduction is permitted which does not comply with these terms.
*Correspondence: Haitao Lv, lvhaitao@suda.edu.cn, haitaosz@163.com; Qiaobin Chen, 1542601681@qq.com
†These authors have contributed equally to this work