Abstract
Background:
Acute myocardial infarction (AMI) is a fatal disease that causes high morbidity and mortality. It has been reported that AMI is associated with immune cell infiltration. Now, we aimed to identify the potential diagnostic biomarkers of AMI and uncover the immune cell infiltration profile of AMI.
Methods:
From the Gene Expression Omnibus (GEO) data set, three data sets (GSE48060, GSE60993, and GSE66360) were downloaded. Differentially expressed genes (DEGs) from AMI and healthy control samples were screened. Furthermore, DEGs were performed via gene ontology (GO) functional and kyoto encyclopedia of genes and genome (KEGG) pathway analyses. The Gene set enrichment analysis (GSEA) was used to analyze GO terms and KEGG pathways. Utilizing the Search Tool for Retrieval of Interacting Genes/Proteins (STRING) database, a protein–protein interaction (PPI) network was constructed, and the hub genes were identified. Then, the receiver operating characteristic (ROC) curves were constructed to analyze the diagnostic value of hub genes. And, the diagnostic value of hub genes was further validated in an independent data set GSE61144. Finally, CIBERSORT was used to represent the compositional patterns of the 22 types of immune cell fractions in AMI.
Results:
A total of 71 DEGs were identified. These DEGs were mainly enriched in immune response and immune-related pathways. Toll-like receptor 2 (TLR2), interleukin-1B (IL1B), leukocyte immunoglobulin-like receptor subfamily B2 (LILRB2), Fc fragment of IgE receptor Ig (FCER1G), formyl peptide receptor 1 (FPR1), and matrix metalloproteinase 9 (MMP9) were identified as diagnostic markers with the value of p < 0.05. Also, the immune cell infiltration analysis indicated that TLR2, IL1B, LILRB2, FCER1G, FPR1, and MMP9 were correlated with neutrophils, monocytes, resting natural killer (NK) cells, gamma delta T cells, and CD4 memory resting T cells. The fractions of monocytes and neutrophils were significantly higher in AMI tissues than in control tissues.
Conclusion:
TLR2, IL1B, LILRB2, FCER1G, FPR1, and MMP9 are involved in the process of AMI, which can be used as molecular biomarkers for the screening and diagnosis of AMI. In addition, the immune system plays a vital role in the occurrence and progression of AMI.
Introduction
Acute myocardial infarction (AMI) is one of the leading causes of adverse outcomes in developed countries (1). Despite improved pharmacologic and device-based approaches to ameliorate AMI, no significant improvement in morbidity and mortality has been observed over the past 20 years (2). Currently, the diagnosis of AMI is often based on changes in cardiac biomarkers. Numerous biomarkers have been used for the clinical diagnosis of AMI, such as cardiac troponin I, cardiac troponin T, and MB isoenzyme of creatine kinase (CK-MB) (3, 4). However, there are limitations in sensitivity and specificity for the early diagnosis of AMI through these biomarkers (5). In addition, the classic risk factors for AMI, such as smoking, obesity, hypertension, and high serum cholesterol, can only predict the prevention and outcomes of AMI and fail to provide an acute diagnosis sufficiently (6).
Fortunately, with the development of gene chip technique and transcriptome sequencing methods, more and more gene chip technologies are used in cardiovascular clinics and studies, which contribute to the identification of novel biomarkers for the early diagnosis and prognosis of diseases. Zhang et al. found that ARG1 might play a key role in the development of AMI, which could be a biomarker of AMI and provide a reference for intensive research (7). Chen et al. identified TBX21 and PRF1 as novel diagnostic biomarkers and as potential modulatory targets via analyzing the microarray expression profile of peripheral patients with AMI (8). Furthermore, research has shown that a variety of immune cells play an increasingly significant role in the immunomodulation after AMI (9). M2 macrophages, mast cells, and eosinophils have been proven to participate in affecting cardiac after AMI, which provide new insights into the immune mechanisms in the development of AMI (10).
In this study, three microarray data sets were downloaded from GEO. They were merged into a metadata cohort and used to screen out differentially expressed genes (DEGs) between AMI and controls. Next, gene ontology (GO) functional and Kyoto encyclopedia of genes and genome (KEGG) pathway analyses were performed based on DEGs. Moreover, the gene set enrichment analysis (GSEA) was used to analyze GO terms and KEGG pathways. A protein–protein interaction (PPI) network was constructed using the Search Tool for Retrieval of Interacting Genes/Proteins (STRING) database, and then the hub genes were identified. The receiver operating characteristic (ROC) curves were analyzed and depicted for the diagnostic effectiveness of hub genes. Finally, CIBERSORT was utilized to quantify the composition of immune cells between AMI and normal tissues. Furthermore, we investigate the relationship between the hub genes and infiltrated immune cells for further research.
Materials and Methods
Gene Expression Profile Data Collection
The Gene Expression Omnibus (GEO) database collects and shares publicly a range of different high-throughput sequencing and microarray-based data sets. In our research, we searched the data sets, which consisted of patients with AMI and healthy controls. The microarray expression data sets (GSE48060, GSE60993, and GSE66360) were obtained and downloaded from the GEO database1, including GSE48060 contributed by Suresh et al., GSE66360 contributed by Kramer et al., and GSE60993 contributed by Eun et al. (11–13). These data sets were based on GPL570 platform of Affymetrix Human Genome U133 Plus 2.0 array and GPL6884 platform of Illumina HumanWG-6 v3.0 expression beadchip, respectively. These three data sets were merged into a metadata, which was used as the training group. Moreover, GSE61144 contributed by Eun et al. was served as an external validation data set (13). The detailed information about our data sets and the annotation platform is listed in Table 1.
TABLE 1
| AMI sample | Control sample | Platforms | |
| GSE60993 | 7 | 7 | Affymetrix Human Genome U133 Plus 2.0 Array |
| GSE66360 | 49 | 50 | Illumina HumanWG-6 v3.0 expression beadchip |
| GSE48060 | 31 | 21 | Affymetrix Human Genome U133 Plus 2.0 Array |
| GSE61144 | 7 | 10 | Sentrix Human-6 v2 Expression BeadChip |
Details of the Gene Expression Omnibus (GEO) data sets.
Identification of DEGs
Prior to the DEG analysis, the preprocessing step was performed. If a gene had more than one probe site, we averaged the values of the probe sites. The probe IDs were converted to the gene symbol based on the annotation files from the platform, and the probes that did not correspond to the genes symbol were excluded.
Furthermore, the three data sets were merged into a metadata cohort and the batch effects were preprocessed and adjusted by the ComBat function of the SVA package (14). In addition, the “limma” of R software was used to perform background correction and array normalization. Meanwhile, DEGs between patients with AMI and healthy controls were identified using the “limma” package (15). The threshold of DEGs in the data set was set as the adjusted value of p < 0.05 and | log2FC| > 1 (FC: fold change).
Functional Enrichment Analysis of DEGs
The “Bioconductor” and “GOplot” package of R software were utilized for analyzing the significant DEGs, and to conduct the GO enrichment, which includes molecular functions (MFs), biological processes (BPs), and cellular components (CCs) and KEGG pathway enrichment analyses (16–18). False discovery rate (FDR) <0.05 was regarded as the significantly enriched gene set.
Gene Set Enrichment Analysis
Using the GSEA software, the enrichment analysis of GO terms, KEGG pathways, and immunologic signature gene sets were performed. We set the number of permutations to 1,000, and set the permutation type as “phenotype.” The reference gene sets used during this analysis were downloaded from the Molecular Signature Database (MSigDB) (19).
Construction of a PPI Network and the Identification of Hub Genes
To further identify directly or indirectly interacting proteins related to DEGs, the STRING version 11.5 was used to construct a PPI network (20). Meanwhile, we set the confidence score as >0.700 used for network construction. Cytoscape 3.8.2 was utilized for visualizing the network, and the plug-in cyto-Hubba of the Cytoscape software was used to identify the hub genes.
Validation of Diagnostic Values of Hub Genes
We constructed the ROC curves using the mRNA expression data from 87 AMI and 78 controls via SPSS 22.0, and calculated the area under the curve (AUC) of the hub genes, which indicated the diagnostic efficiency of genes. The higher the values of AUC, the greater the diagnostic efficiency of genes. And, the results were further validated in the data set GSE61144. The value of p < 0.05 was regarded as statistically significant.
CIBERSORT
A bioinformatics algorithm called CIBERSORT was used to evaluate immune cell infiltrations. The leukocyte gene signature matrix LM22 with 1,000 permutations was used to calculate the putative abundance of immune cells (21). The data with a CIBERSORT value of p < 0.05 were filtered and retained for the following analysis. Thus, a matrix of immune cells fractions was generated. We used the R package “corrplot” to visualize a correlation analysis and 22 types of infiltrated immune cells. The visualization of the differences in immune cell infiltration between AMI and control samples was performed using the R package “vioplot.”
A Correlation Analysis Between Hub Genes and Immune Cells
We conducted Spearman’s rank correlation analysis of the hub genes and immune cells to further explore the immune mechanism during the development of AMI using the R software. The results were visualized with the “ggplot2” package.
Results
Identification of DEG in AMI
Three GEO data sets (GSE60993, GSE66360, and GSE48060) were enrolled in this study, and the merged data set included 87 patients with AMI and 78 control samples. After removing the batch effects, the analysis of DEGs was performed using the “limma” package in R software. A total of 71 DEGs include 68 upregulated genes and 3 downregulated genes. The upregulated genes and downregulated genes were significantly separated in the volcano plot (Figure 1). The expression levels of DEGs were presented in the heatmap (Figure 2).
FIGURE 1
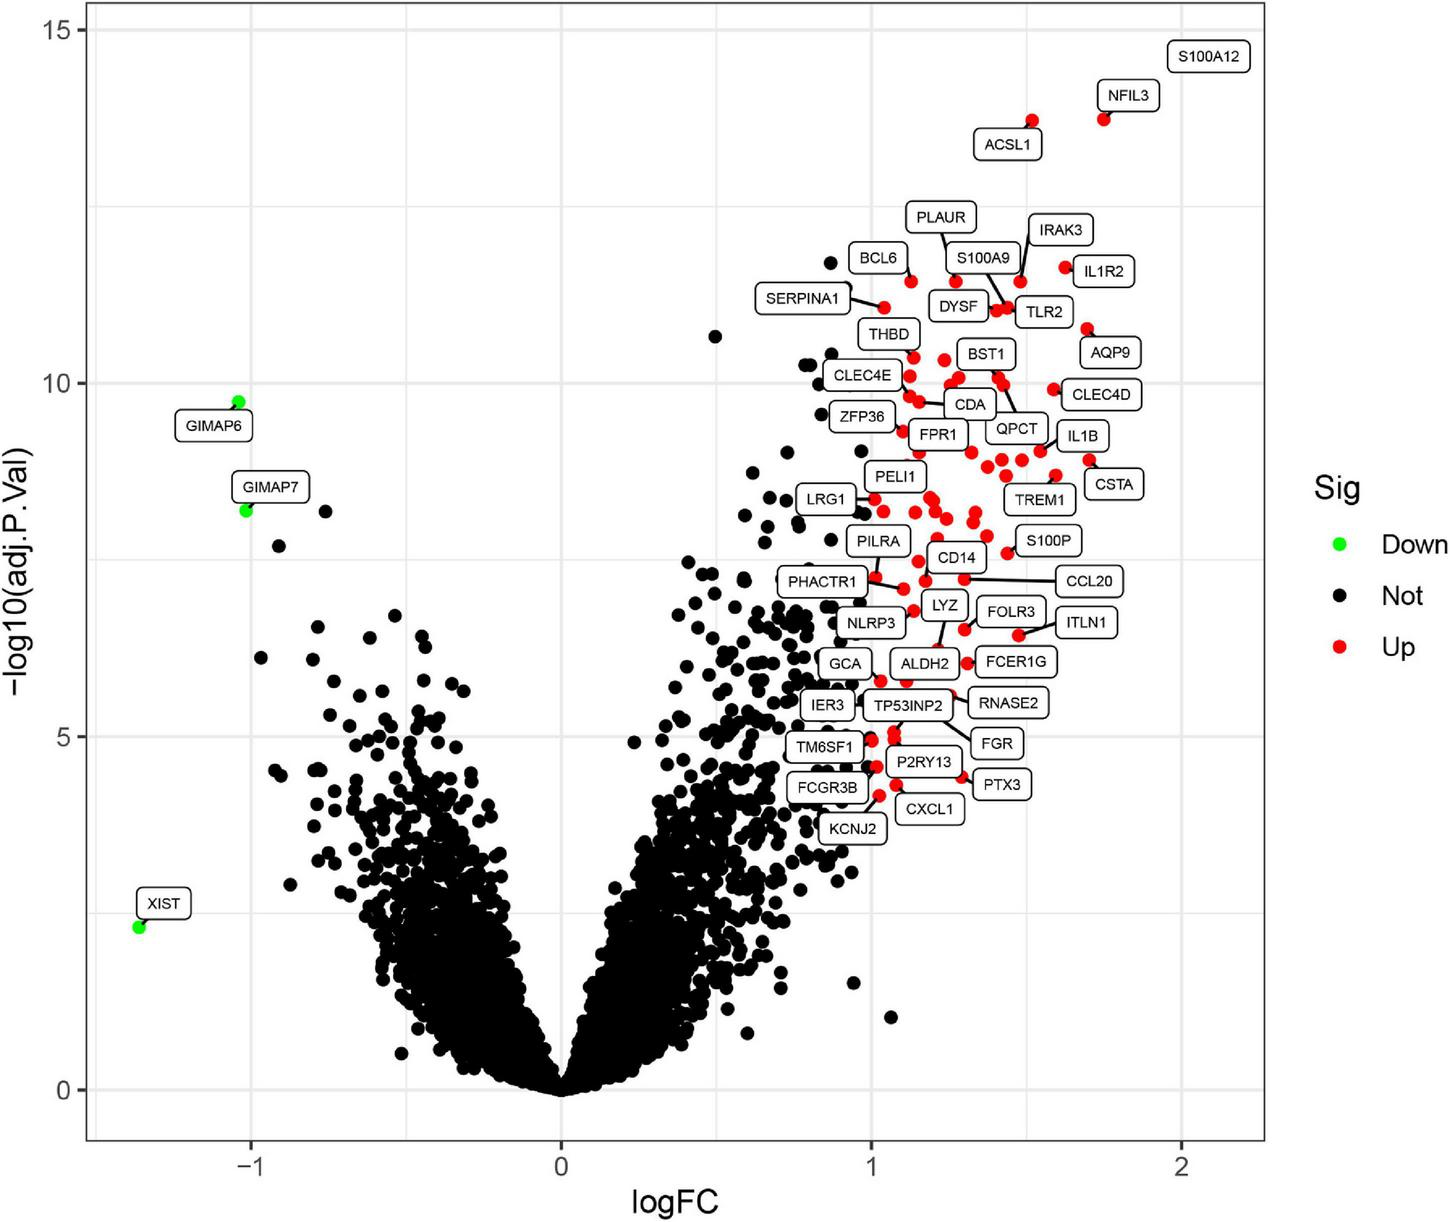
Differentially expressed genes (DEGs) between acute myocardial infarction samples and control ones. The red dots represent upregulated differential genes, the green dots represent differential downregulated genes, and the black dots represent genes without significant differences.
FIGURE 2
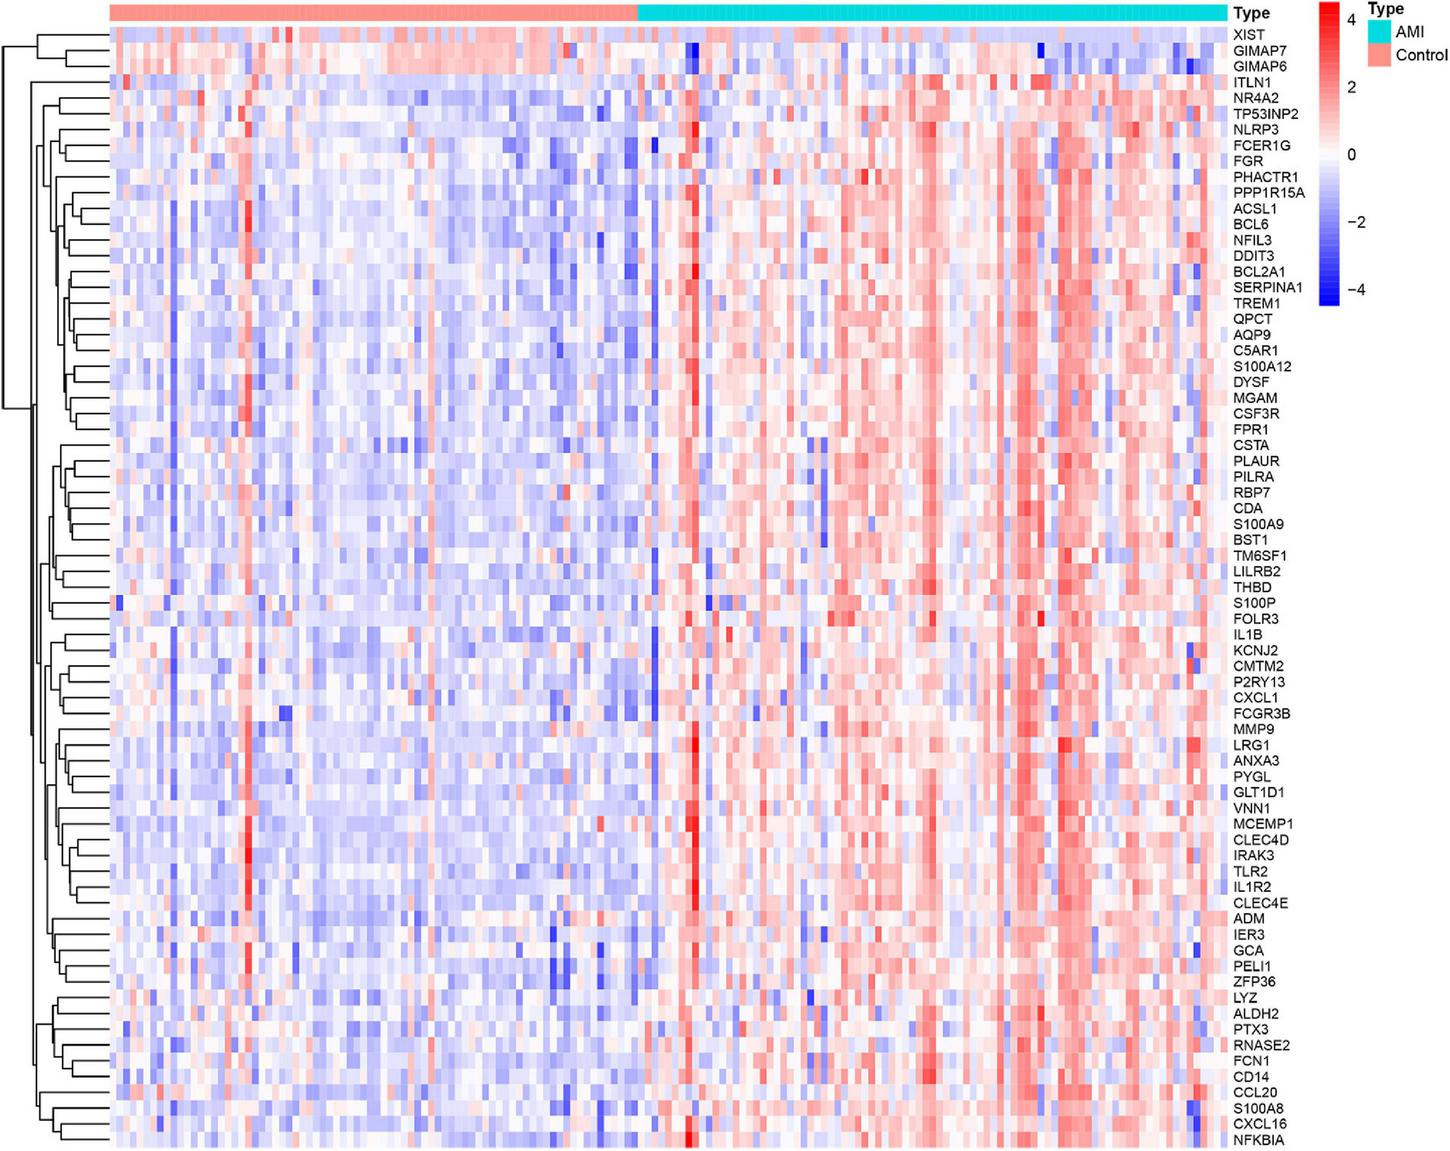
Heatmap showing the expression changes in acute myocardial infarction and control samples. Red represents upregulated DEGs, blue represents downregulated DEGS, and the gradation of color represents the value of | log FC| (FC: fold change).
Functional Enrichment Analysis of DEGs
Gene ontology function and KEGG pathways enrichment analyses were conducted to gain a deeper insight into the function of DEGs. Figure 3 showed the top 10 enriched GO terms. The GO terms containing three parts: BP, CC, and MF. We mainly focused on BP terms during this study. DEGs of BP were mainly enriched in immune responses (e.g., neutrophil activation, neutrophil-mediated immunity, neutrophil migration, and involvement in immune responses).
FIGURE 3
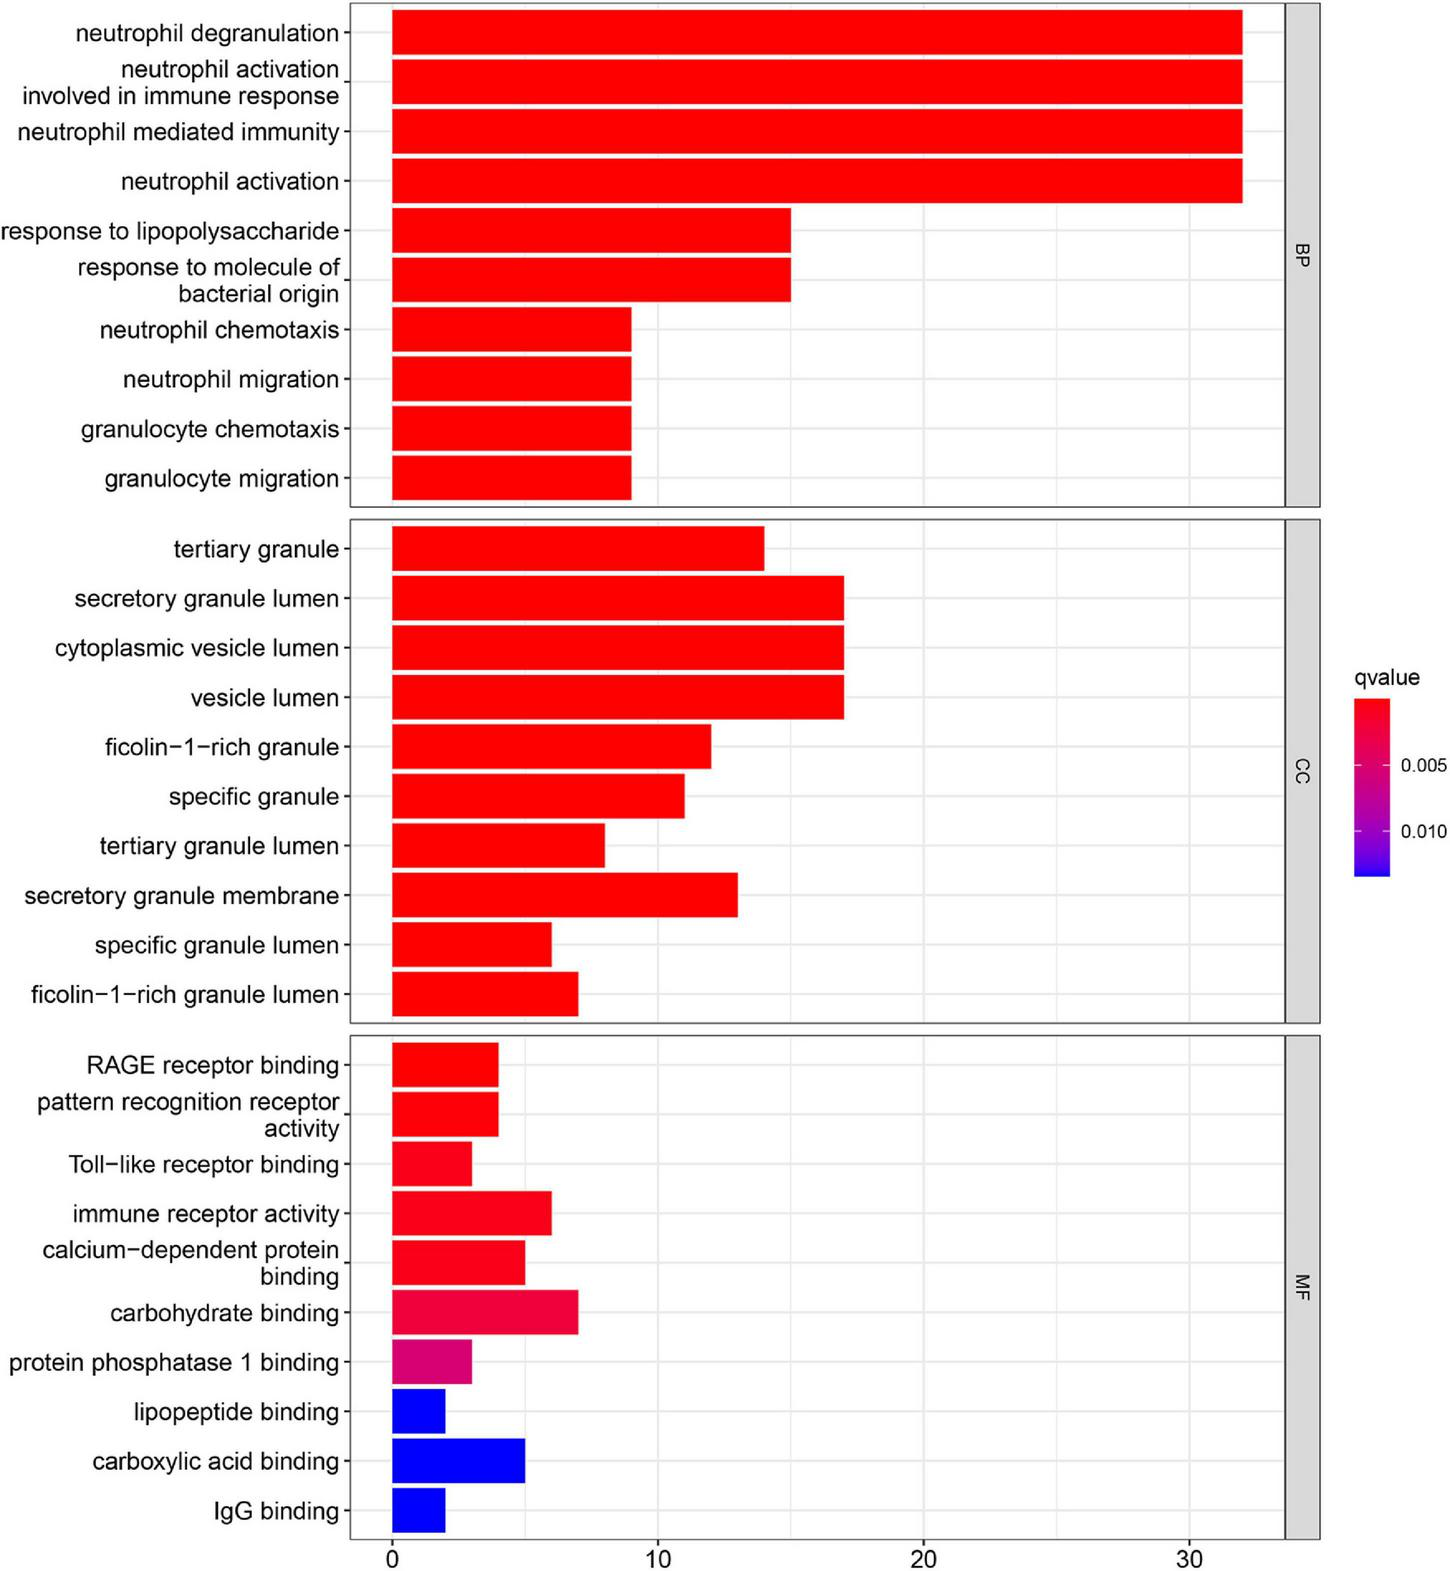
Gene ontology (GO) enrichment analyses of DEGs in acute myocardial infarction (AMI).
In addition, KEGG pathway analyses of DEGs are presented in Figure 4. The results shows the enriched pathways, primarily including immune system diseases (Legionellosis, Amoebiasis, and TB), immune-related pathways [IL-17 signaling pathways, C-type lectin receptor signaling pathway, nuclear factor-kappa B (NF-kappa B) signaling pathway, and tumor necrosis factor (TNF) signaling pathway], and transcriptional misregulation in cancer.
FIGURE 4
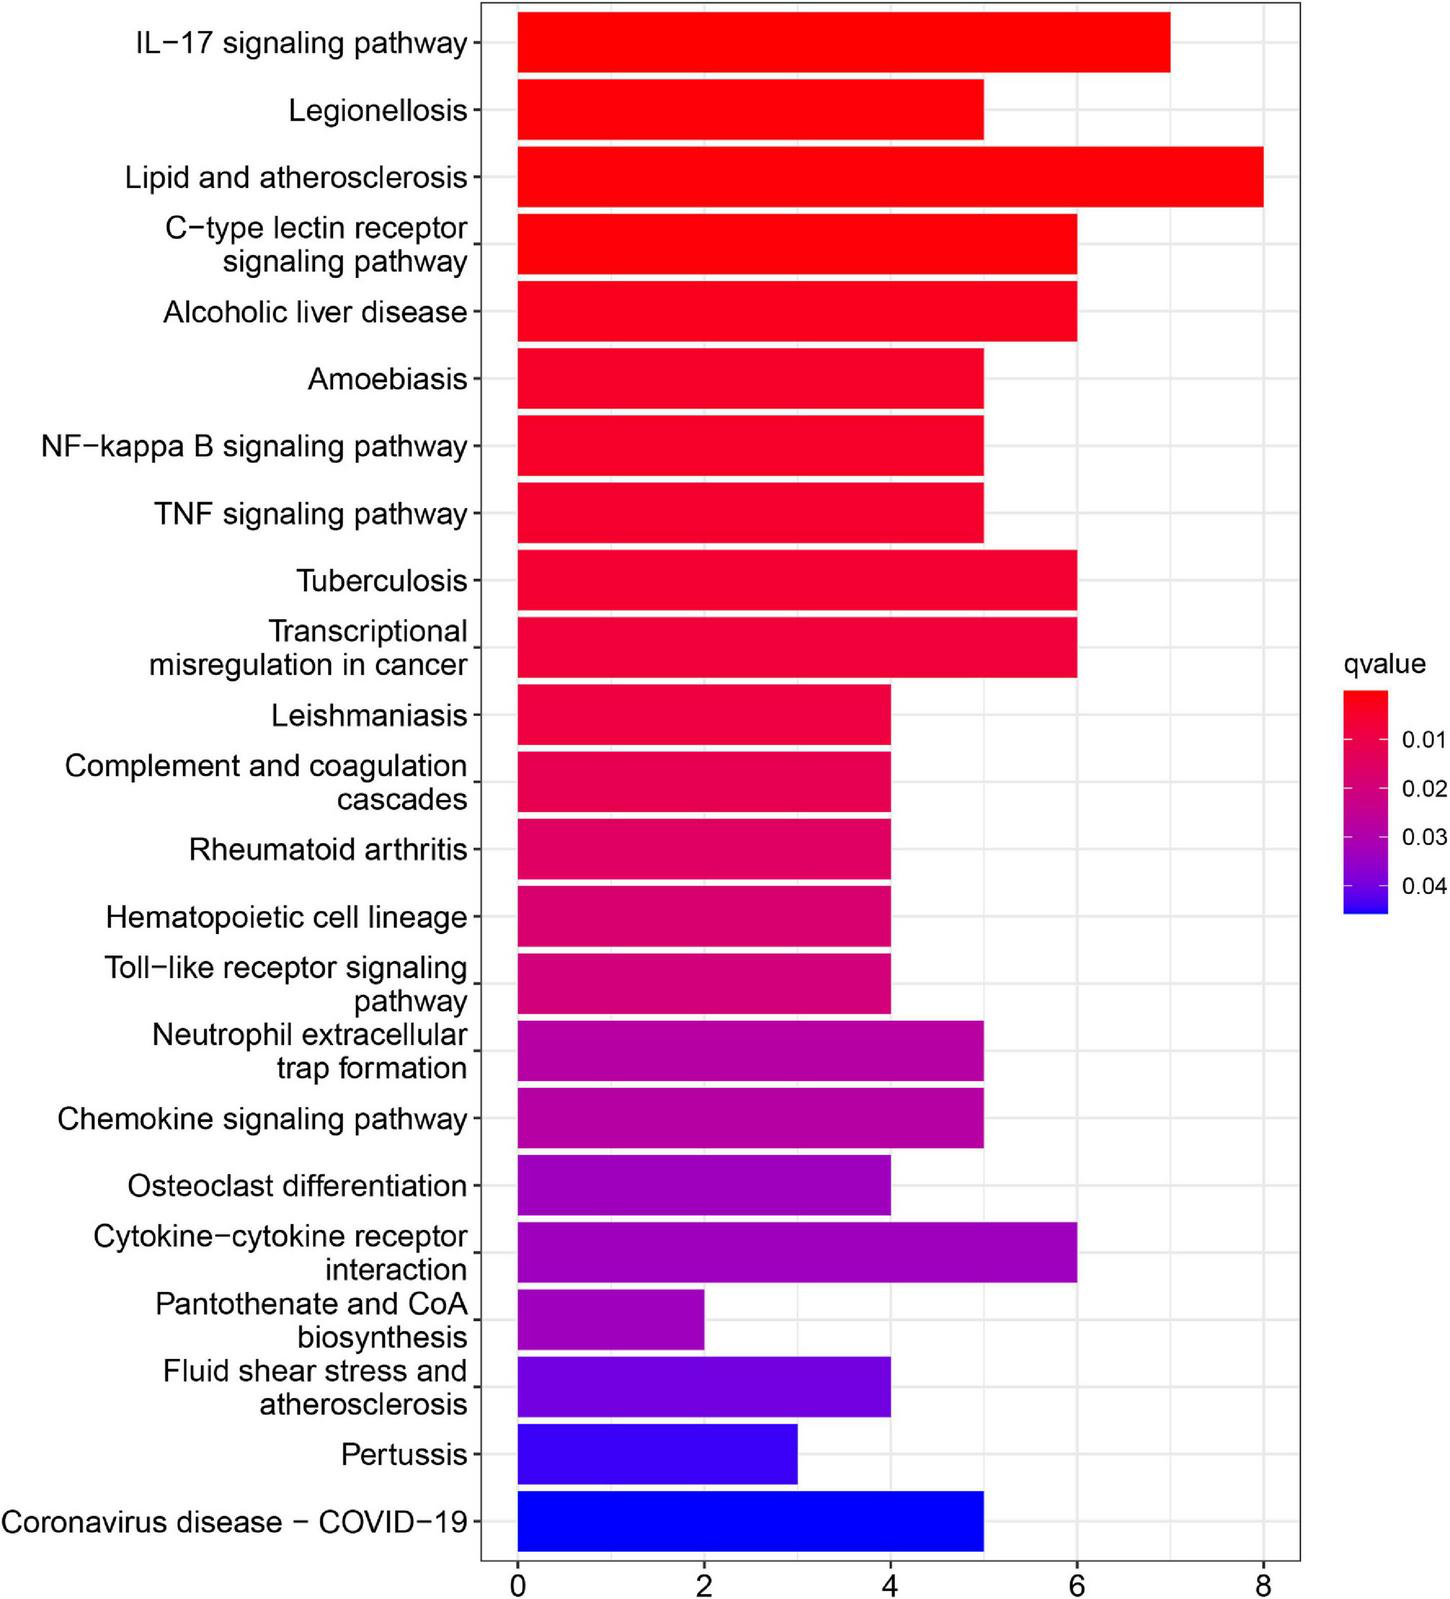
Kyoto encyclopedia of genes and genome (KEGG) pathway enrichment analysis of DEGs in AMI.
Gene Set Enrichment Analysis
To explore the potential pathways and gene function associated with the immune system, GO and KEGG analyses were performed using GSEA. The GSEA results are similar to those of the GO and KEGG analyses based on DEGs (Tables 2, 3).
TABLE 2
| GO terms | ES | NES | NOM p-value |
| Iron ion transport | 0.58 | 2.33 | 0.000 |
| Cellular response to external stimulus | 0.53 | 2.17 | 0.000 |
| P38MAPK cascade | 0.72 | 2.15 | 0.000 |
| Interleuin-1 production | 0.66 | 2.12 | 0.000 |
| Negative regulation of NF-kappa B transcription factor activity | 0.58 | 2.11 | 0.000 |
| Acute phase response | 0.78 | 2.11 | 0.000 |
| Phagocytosis | 0.57 | 2.09 | 0.000 |
| Animal organ regeneration | 0.60 | 2.09 | 0.000 |
| Cellular response to mechanical stimulus | 0.59 | 2.09 | 0.000 |
| Interleuin-1 beta production | 0.67 | 2.08 | 0.000 |
| Cellular response to extracellular stimulus | 0.50 | 2.08 | 0.000 |
| Acute inflammatory response | 0.66 | 2.07 | 0.000 |
| Positive regulation of interleukin-1 production | 0.71 | 2.07 | 0.000 |
| Dendritic cell differentiation | 0.63 | 2.05 | 0.000 |
| Vacuolar lumen | 0.56 | 2.05 | 0.000 |
| Production of molecular mediator involved in inflammatory response | 0.66 | 2.04 | 0.000 |
| Transferrin transport | 0.58 | 2.04 | 0.000 |
| Vascular endothelial growth factor receptor signaling pathway | 0.53 | 2.04 | 0.000 |
| Smooth muscle cell proliferation | 0.60 | 2.04 | 0.000 |
| Phagocytic vesicle membrane | 0.62 | 2.04 | 0.000 |
Top 20 significant GO terms enriched by differentially expressed genes (DEGs) via gene set enrichment analysis (GSEA), p < 0.05.
GO, gene otology; ES, enrichment score; NES, normalized enrichment score; NOM p-value, normalized p-value.
TABLE 3
| KEGG terms | ES | NES | NOM p-value |
| Epithelial cell signaling in Helicobacter pylori infection | 0.58 | 2.06 | 0.000 |
| Fc gamma R-mediated phagocytosis | 0.56 | 2.05 | 0.000 |
| Leukocyte transendothelial migration | 0.49 | 1.97 | 0.000 |
| Nod-like receptor signaling pathway | 0.64 | 1.90 | 0.002 |
| Toll-like receptor signaling pathway | 0.59 | 1.88 | 0.004 |
| Leishmania infection | 0.69 | 1.88 | 0.002 |
| MAPK signaling pathway | 0.39 | 1.87 | 0.000 |
| Adipocytokine signaling pathway | 0.47 | 1.84 | 0.000 |
| Hematopoietic cell lineage | 0.55 | 1.81 | 0.000 |
| Pathogenic Escherichia coli infection | 0.52 | 1.80 | 0.008 |
| Fc epsilon RI signaling pathway | 0.46 | 1.79 | 0.016 |
| Chemokine signaling pathway | 0.43 | 1.75 | 0.002 |
| Type II diabetes mellitus | 0.49 | 1.74 | 0.000 |
| ErbB signaling pathway | 0.41 | 1.71 | 0.012 |
| Bladder cancer | 0.54 | 1.70 | 0.004 |
| Complement and coagulation cascades | 0.59 | 1.69 | 0.002 |
| Galactose metabolism | 0.53 | 1.68 | 0.017 |
| Pathways in cancer | 0.34 | 1.67 | 0.000 |
| Renal cell carcinoma | 0.41 | 1.67 | 0.025 |
| Glycosaminoglycan degradation | 0.54 | 1.66 | 0.016 |
Top 20 significant KEGG pathways enriched by DEGs via GSEA, p < 0.05.
KEGG, Kyoto encyclopedia of genes and genomes; GSEA, gene set enrichment analysis; ES, enrichment score; NES, normalized enrichment score; NOM p-value, normalized p-value.
The top 20 results of the GO analysis were mainly enriched in immune responses, such as interleukin-1 beta (IL1B) production, phagocytosis, and the regulation of inflammatory response. Five representative immune-related GO terms are visualized in Figure 5A.
FIGURE 5
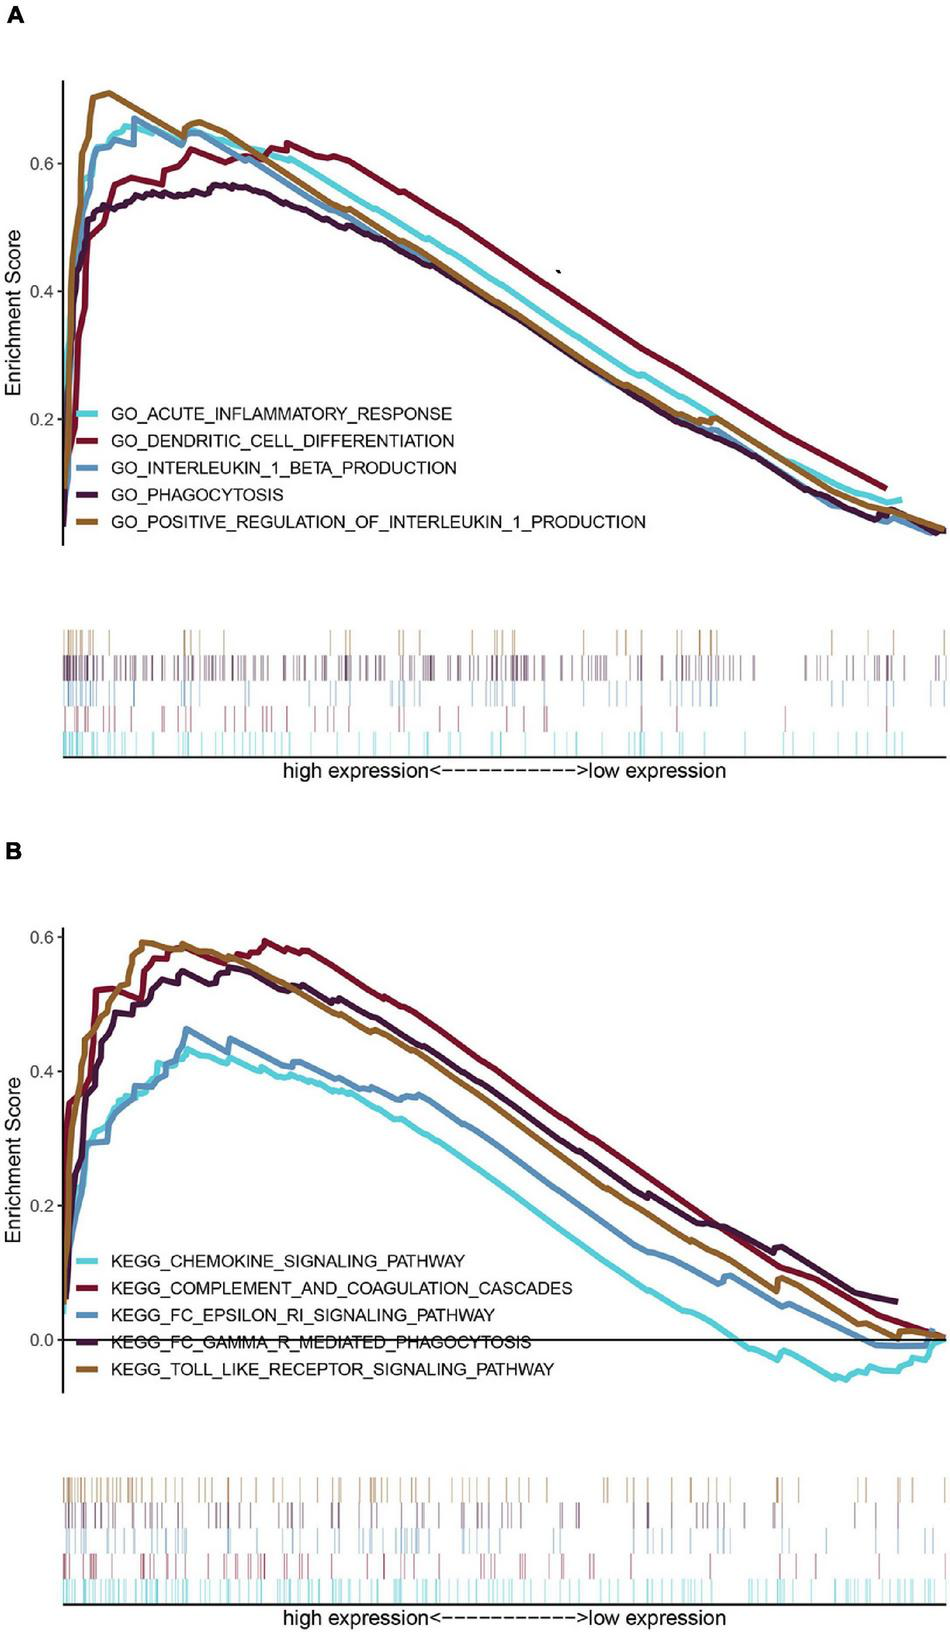
Enrichment analyses via gene set enrichment analysis (GSEA). (A) Five representative enriched immune-related GO gene sets and (B) five representative enriched immune-related KEGG pathways.
The top 20 KEGG pathways were mainly enriched in immune-related pathways [Toll-like receptor (TLR) signaling pathway, NOD-like receptor signaling pathway, Fc epsilon RI signaling pathway, and Fc gamma R-mediated phagocytosis], immune-related diseases (Leishmania infection and type II diabetes mellitus). Five representative immune-related pathways are shown in Figure 5B.
PPI Network Construction and Hub Gene Selection
To distinguish the hub genes from the common genes, a DEG PPI network was constructed using the STRING database. As seen in Figure 6, there were 35 nodes and 50 edges in this network. As seen in Figure 7, TLR 2, IL1B, leukocyte immunoglobulin-like receptor subfamily B2 (LILRB2), the Fc fragment of IgE receptor Ig (FCER1G), formyl peptide receptor 1 (FRP1), and matrix metalloproteinase 9 (MMP9) proteins interact with other proteins by >5, which suggested that they were the central nodes of the PPI network. Thus, we chose the top six genes for further research.
FIGURE 6
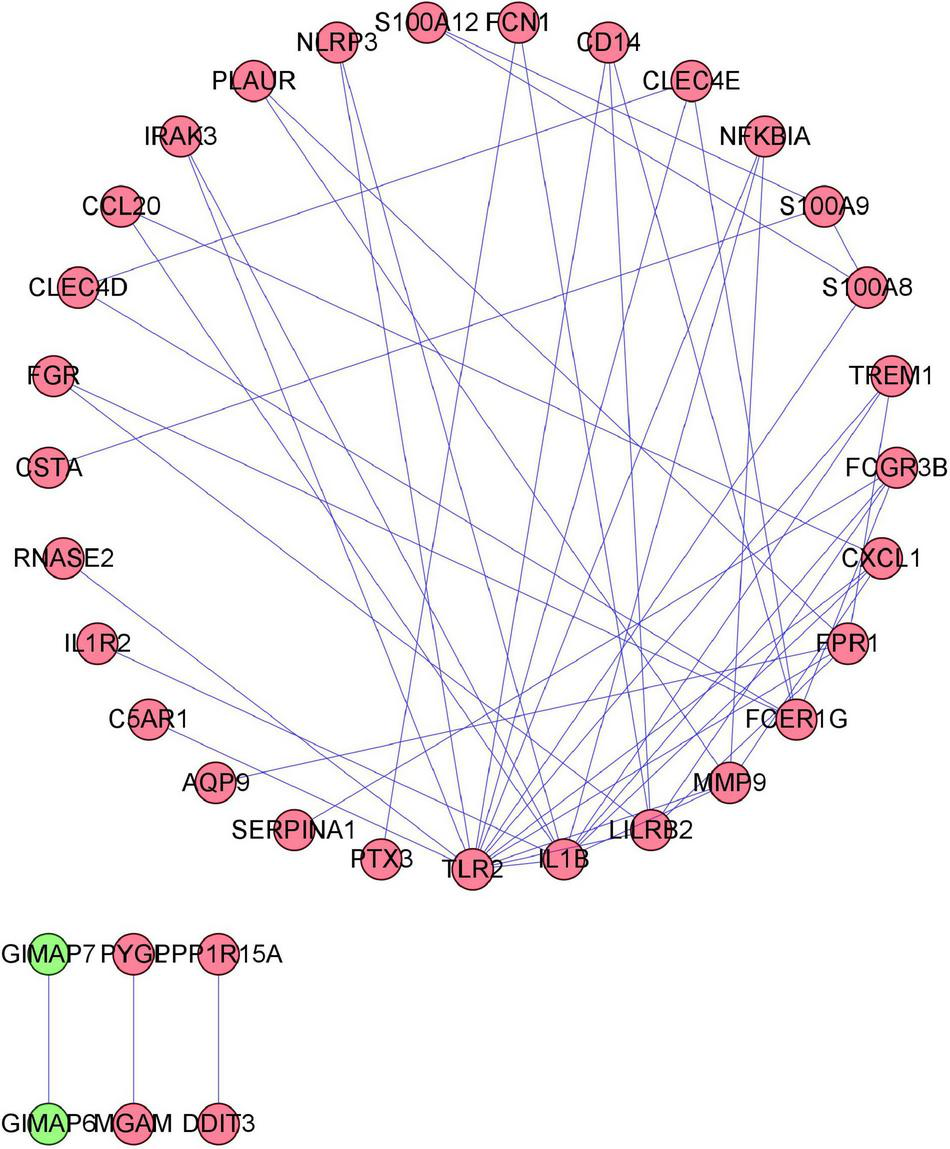
Protein–protein interaction (PPI) network construction. Circles and lines represent genes and the interaction of proteins between genes, respectively. The red represents the upregulated genes. The green represents the downregulated genes.
FIGURE 7
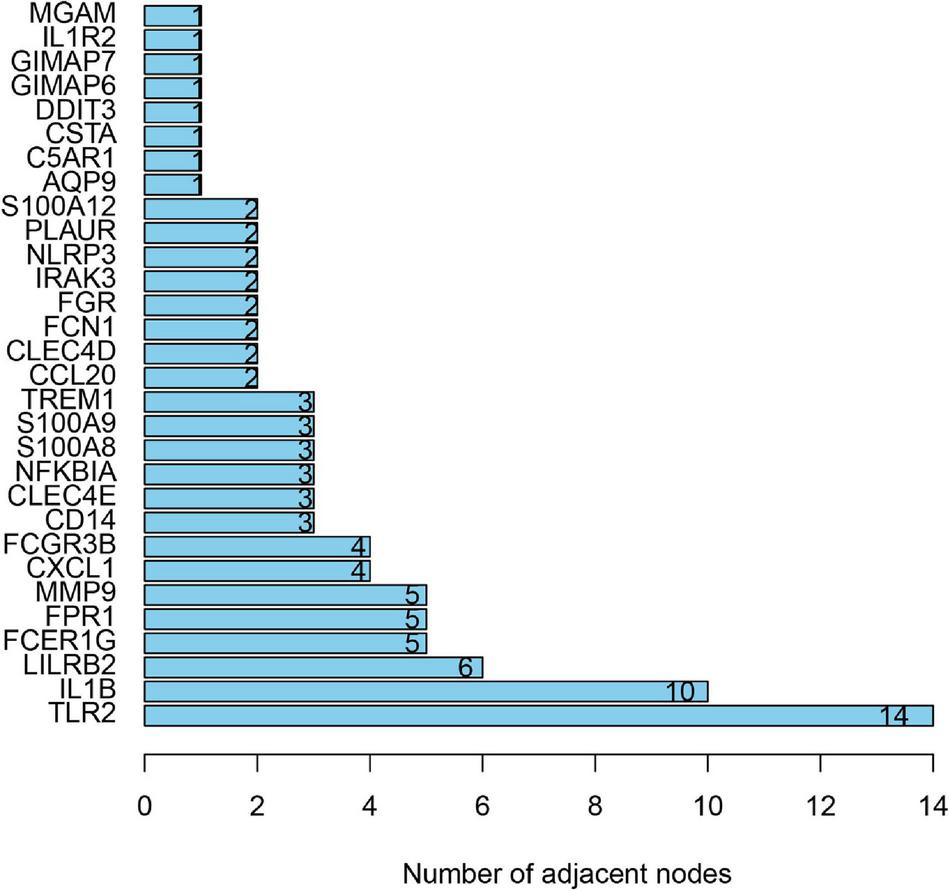
The number of adjacent nodes.
Validation of Diagnostic Values of Hub Genes
To validate the diagnostic ability of the top six hub genes obtained from the abovementioned analysis, ROC curves were constructed and the AUC value was utilized to determine the diagnostic effectiveness in distinguishing AMI from control sample. Figure 8 shows the AUC for TLR2 was 0.833 (95% CI, 0.769–0.896; p = 0.000), AUC for IL1B was 0.806 (95% CI, 0.739–0.872; p = 0.000), AUC for LILRB2 was 0.825 (95% CI, 0.760–0,889; p = 0.000), FCER1G was 0.770 (95% CI, 0.698–0.841; p = 0.000), AUC for FPR1 was 0.808 (95% CI, 0.740–0.877; p = 0.000), and AUC for MMP9 was 0.816 (95% CI, 0.748–0.884; p = 0.000), indicating that the hub genes had high diagnostic ability. Furthermore, the diagnostic power of hub genes was confirmed in the GSE61144 data set (Figure 9). The results in Figure 9 indicated that the hub genes had high diagnostic ability.
FIGURE 8
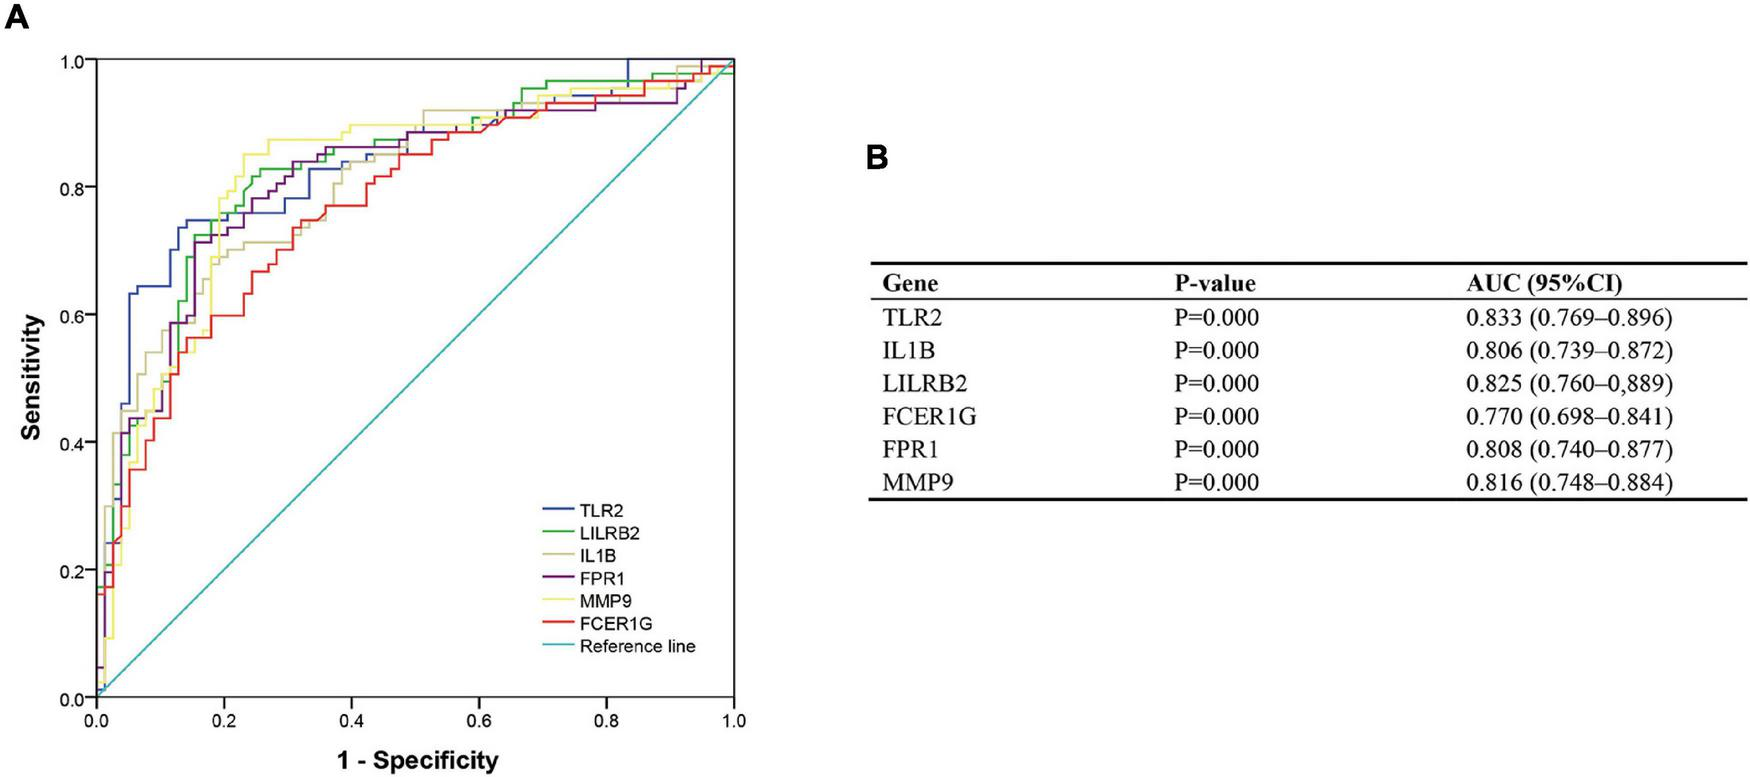
Diagnostic value of top six hub genes with receiver operating characteristic (ROC) curves. (A) Analysis with ROC curves. (B) Specific value of diagnosis efficiency.
FIGURE 9
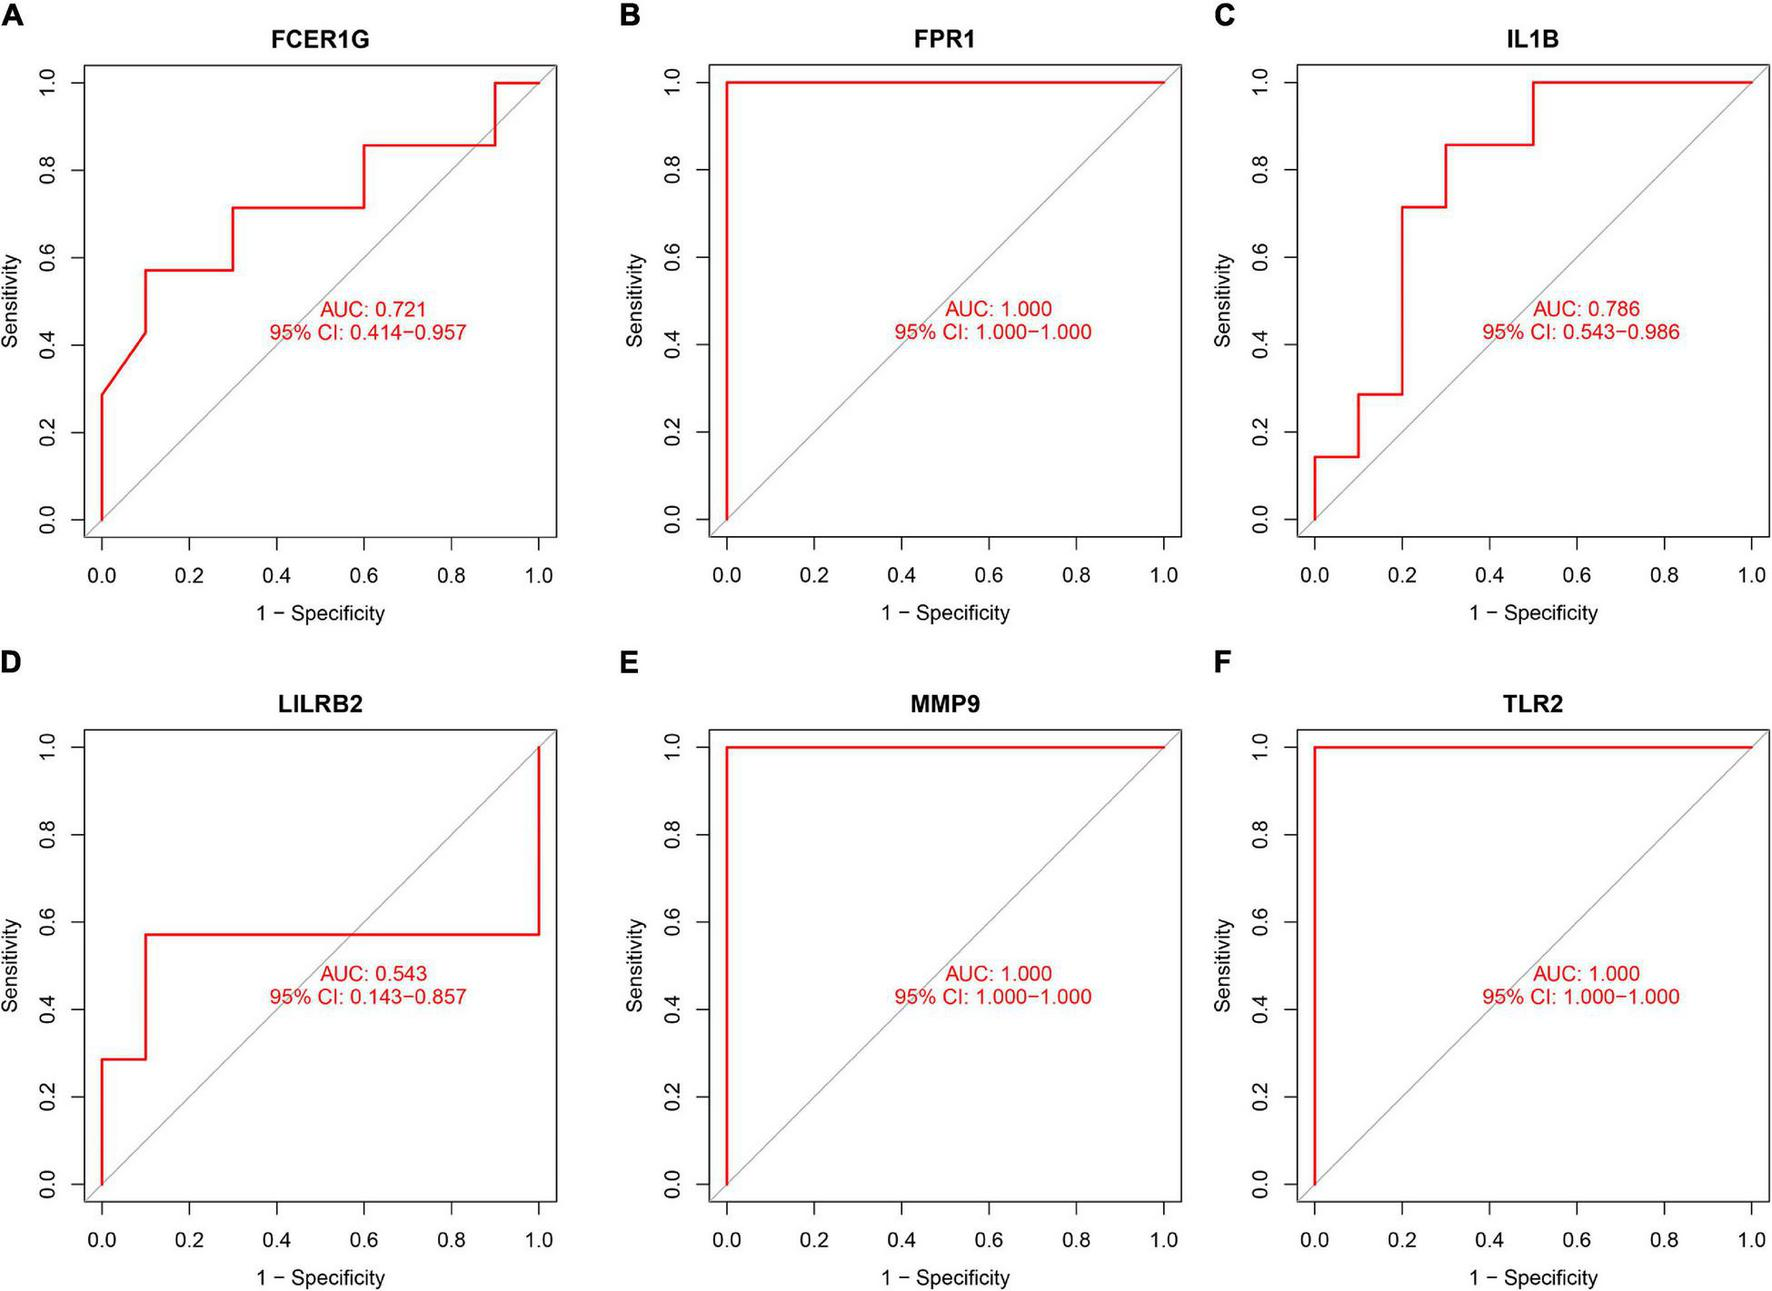
Validation of the diagnostic value of hub genes in the GSE61144 data set. (A) Fc fragment of IgE receptor Ig (FCER1G), (B) formyl peptide receptor 1 (FPR1), (C) interleukin-1B (IL1B), (D) leukocyte immunoglobulin-like receptor subfamily B2 (LILRB2), (E) matrix metalloproteinase 9 (MMP9), and (F) Toll-like receptor 2 (TLR2).
Immune Cell Infiltration
The composition of immune cells was first explored between AMI tissues and normal control tissues. As shown in Figure 10, the composition of immune cells varied significantly between the different groups. Compared with control group, the AMI group showed a lower fraction of CD8 T cells (p = 0.004), CD4 memory resting T cells (p = 0.001), gamma delta T cells (p < 0.001), M1 macrophages (p = 0.030), and eosinophils (p = 0.005). However, the AMI group contained a higher proportion of CD4 memory-activated T cells (p = 0.009), monocytes (p < 0.001), activated mast cells (p < 0.001), and neutrophils (p < 0.001).
FIGURE 10
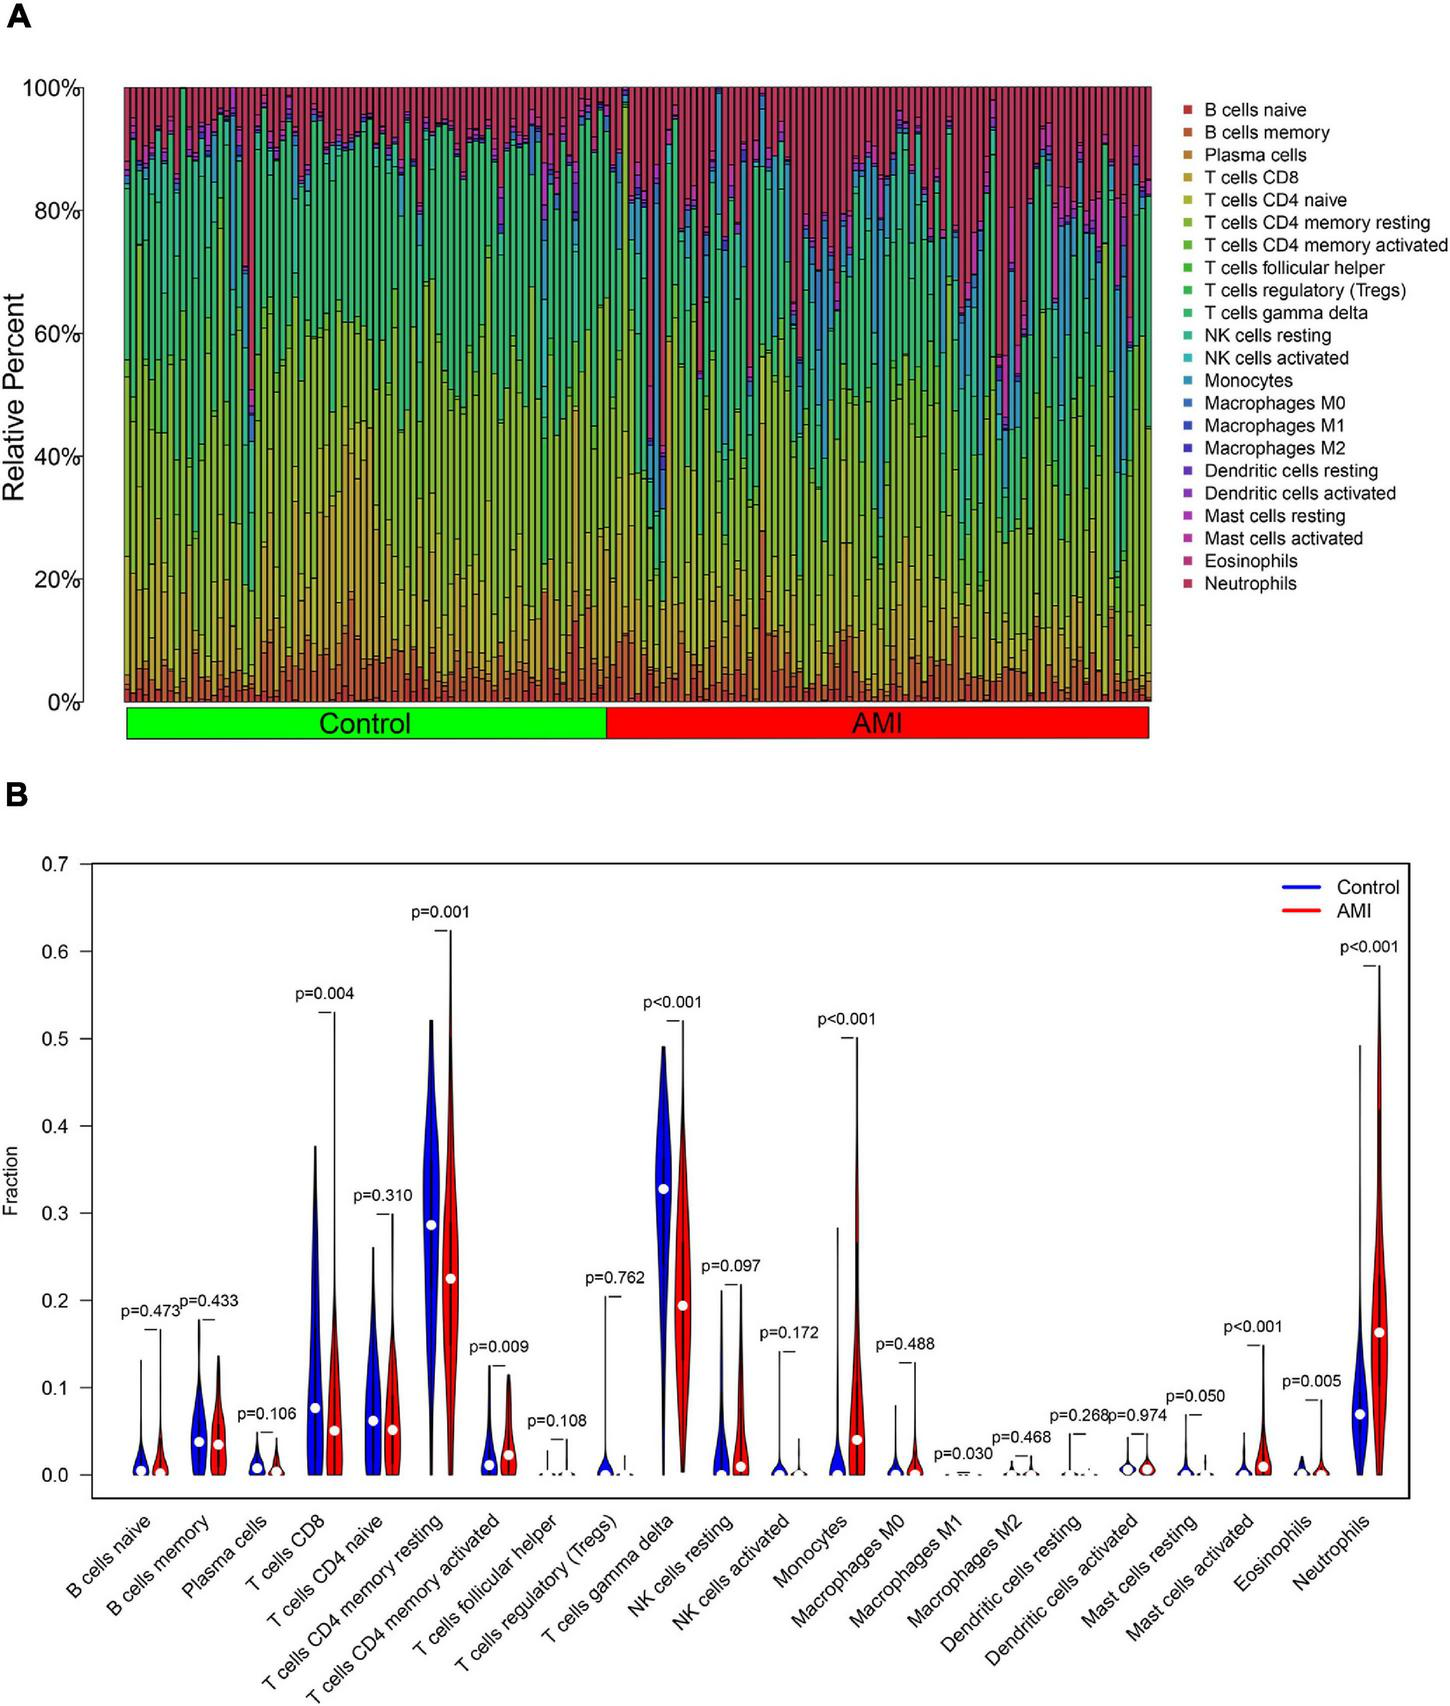
Distribution and visualization of immune cell infiltration. (A) The fraction of 22 subsets of immune cells in AMI and control samples. (B) The violin graph shows the difference of immune infiltration between AMI and control samples. The control samples are shown in blue and AMI samples are shown in red. The value of value p < 0.05.
Besides, the correlation analysis of 22 types of immune cells was conducted. The score represents the degree of correlation. The results in Figure 11 indicated that activated NK cells and regulatory T cells (Tregs) showed the most synergistic effect. Meanwhile, gamma delta T cells and neutrophils showed the most competitive effect.
FIGURE 11
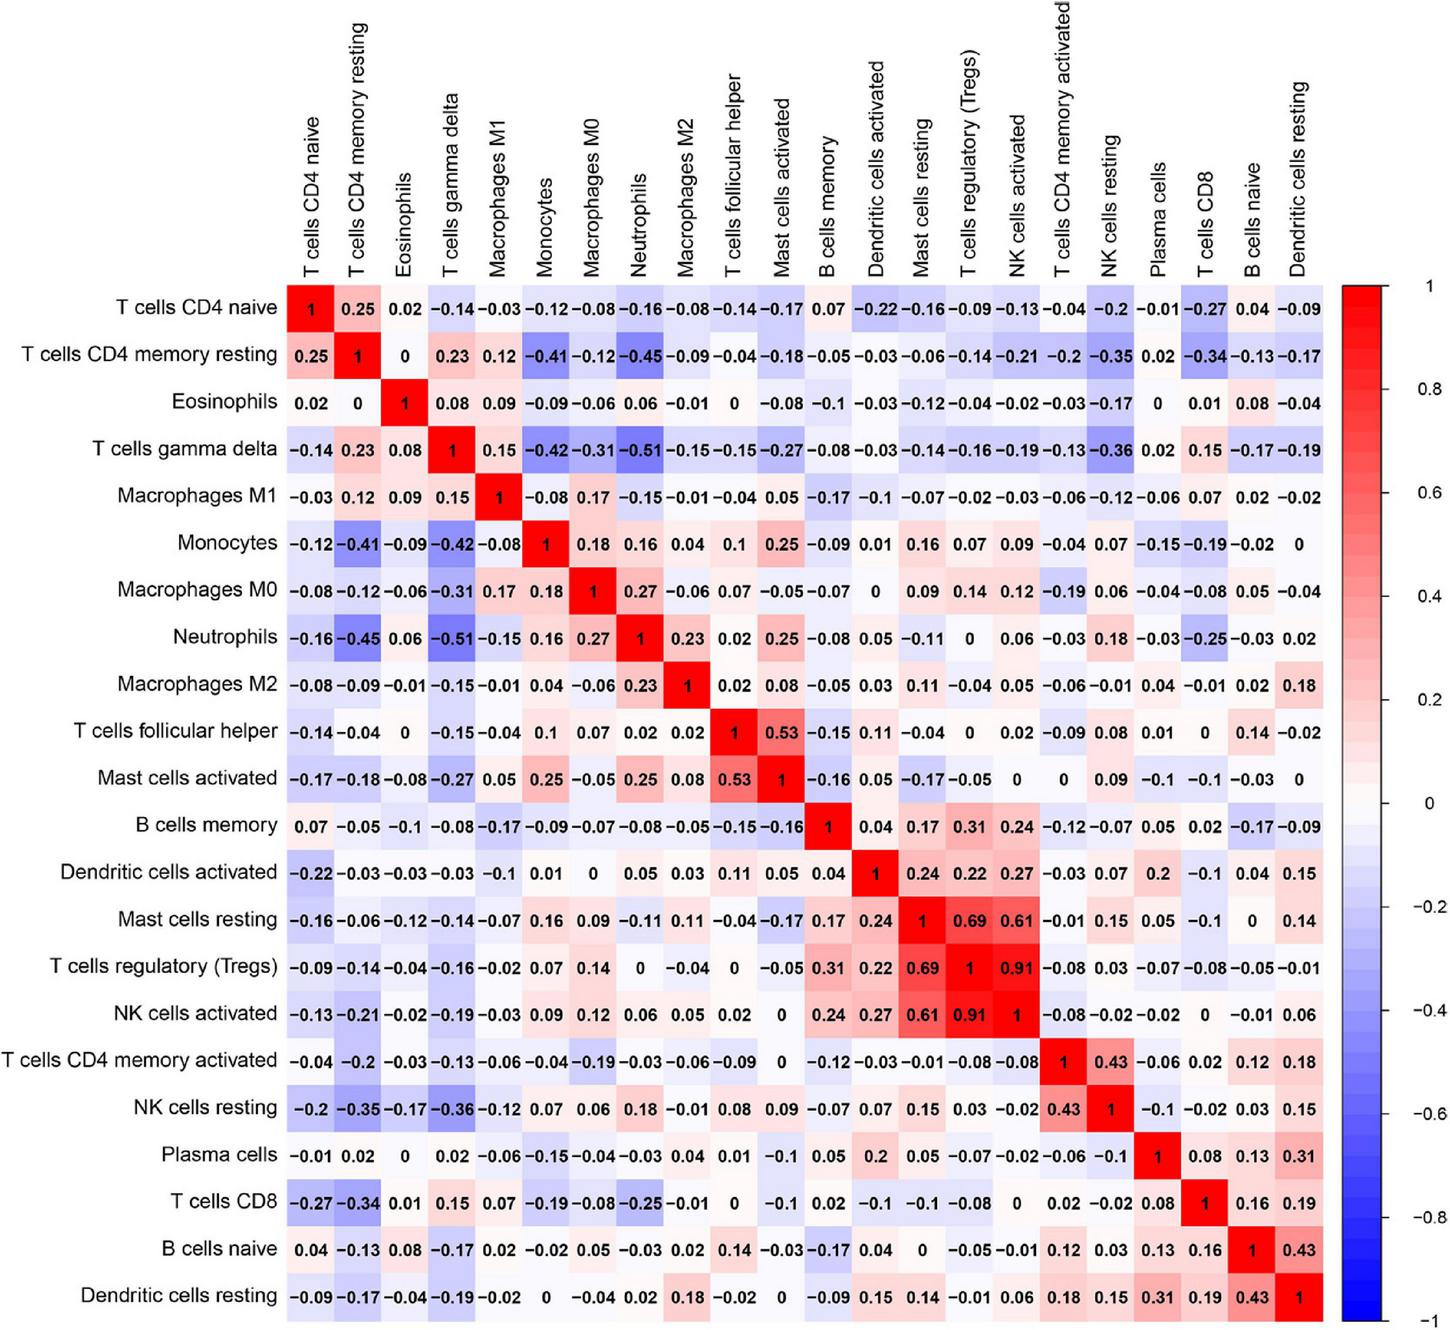
Correlation matrix among fractions of 22 immune cell subtype. Red: positive correlation; white: the same correlation levels; and blue: negative correlation.
A Correlation Analysis Between the Hub Genes and Infiltrated Immune Cells
To explore the association of the hub genes with the immune cells, we performed the Spearman’s rank correlation analysis. As shown in Figure 12, TLR2 was positively correlated with neutrophils, monocytes, activated mast cells, and resting NK cells and negatively correlated with CD8 T cells, eosinophils, gamma delta T cells, and CD4 memory resting T cells. IL1B was positively correlated with neutrophils, activated mast cells, monocytes, and resting NK cells and negatively correlated with CD4 naïve T cells, CD8 T cells, eosinophils, resting mast cells, CD4 memory resting T cells, and gamma delta T cells. LILRB2 was positively correlated with neutrophils, monocytes, activated mast cells, and resting NK cells and negatively correlated with CD8 T cells, eosinophils, plasma cells, CD4 memory resting T cells, and gamma delta T cells. FCER1G was positively correlated with monocytes, neutrophils, resting NK cells, activated mast cell, and CD4 memory-activated T cells and negatively correlated with eosinophils, gamma delta T cells, and CD4 memory resting T cells. FPR1 was positively correlated with neutrophils, monocytes, activated mast cells, and resting NK cells and negatively correlated with naïve B cells, M1 macrophages, eosinophils, gamma delta T cells, and CD4 memory resting T cells. MMP9 was positively correlated with neutrophils, monocytes, M0 macrophages, activated mast cells, and resting NK cells and negatively correlated with resting mast cells, memory B cells, CD8 T cells, eosinophils, CD4 memory resting T cells, and gamma delta T cells.
FIGURE 12
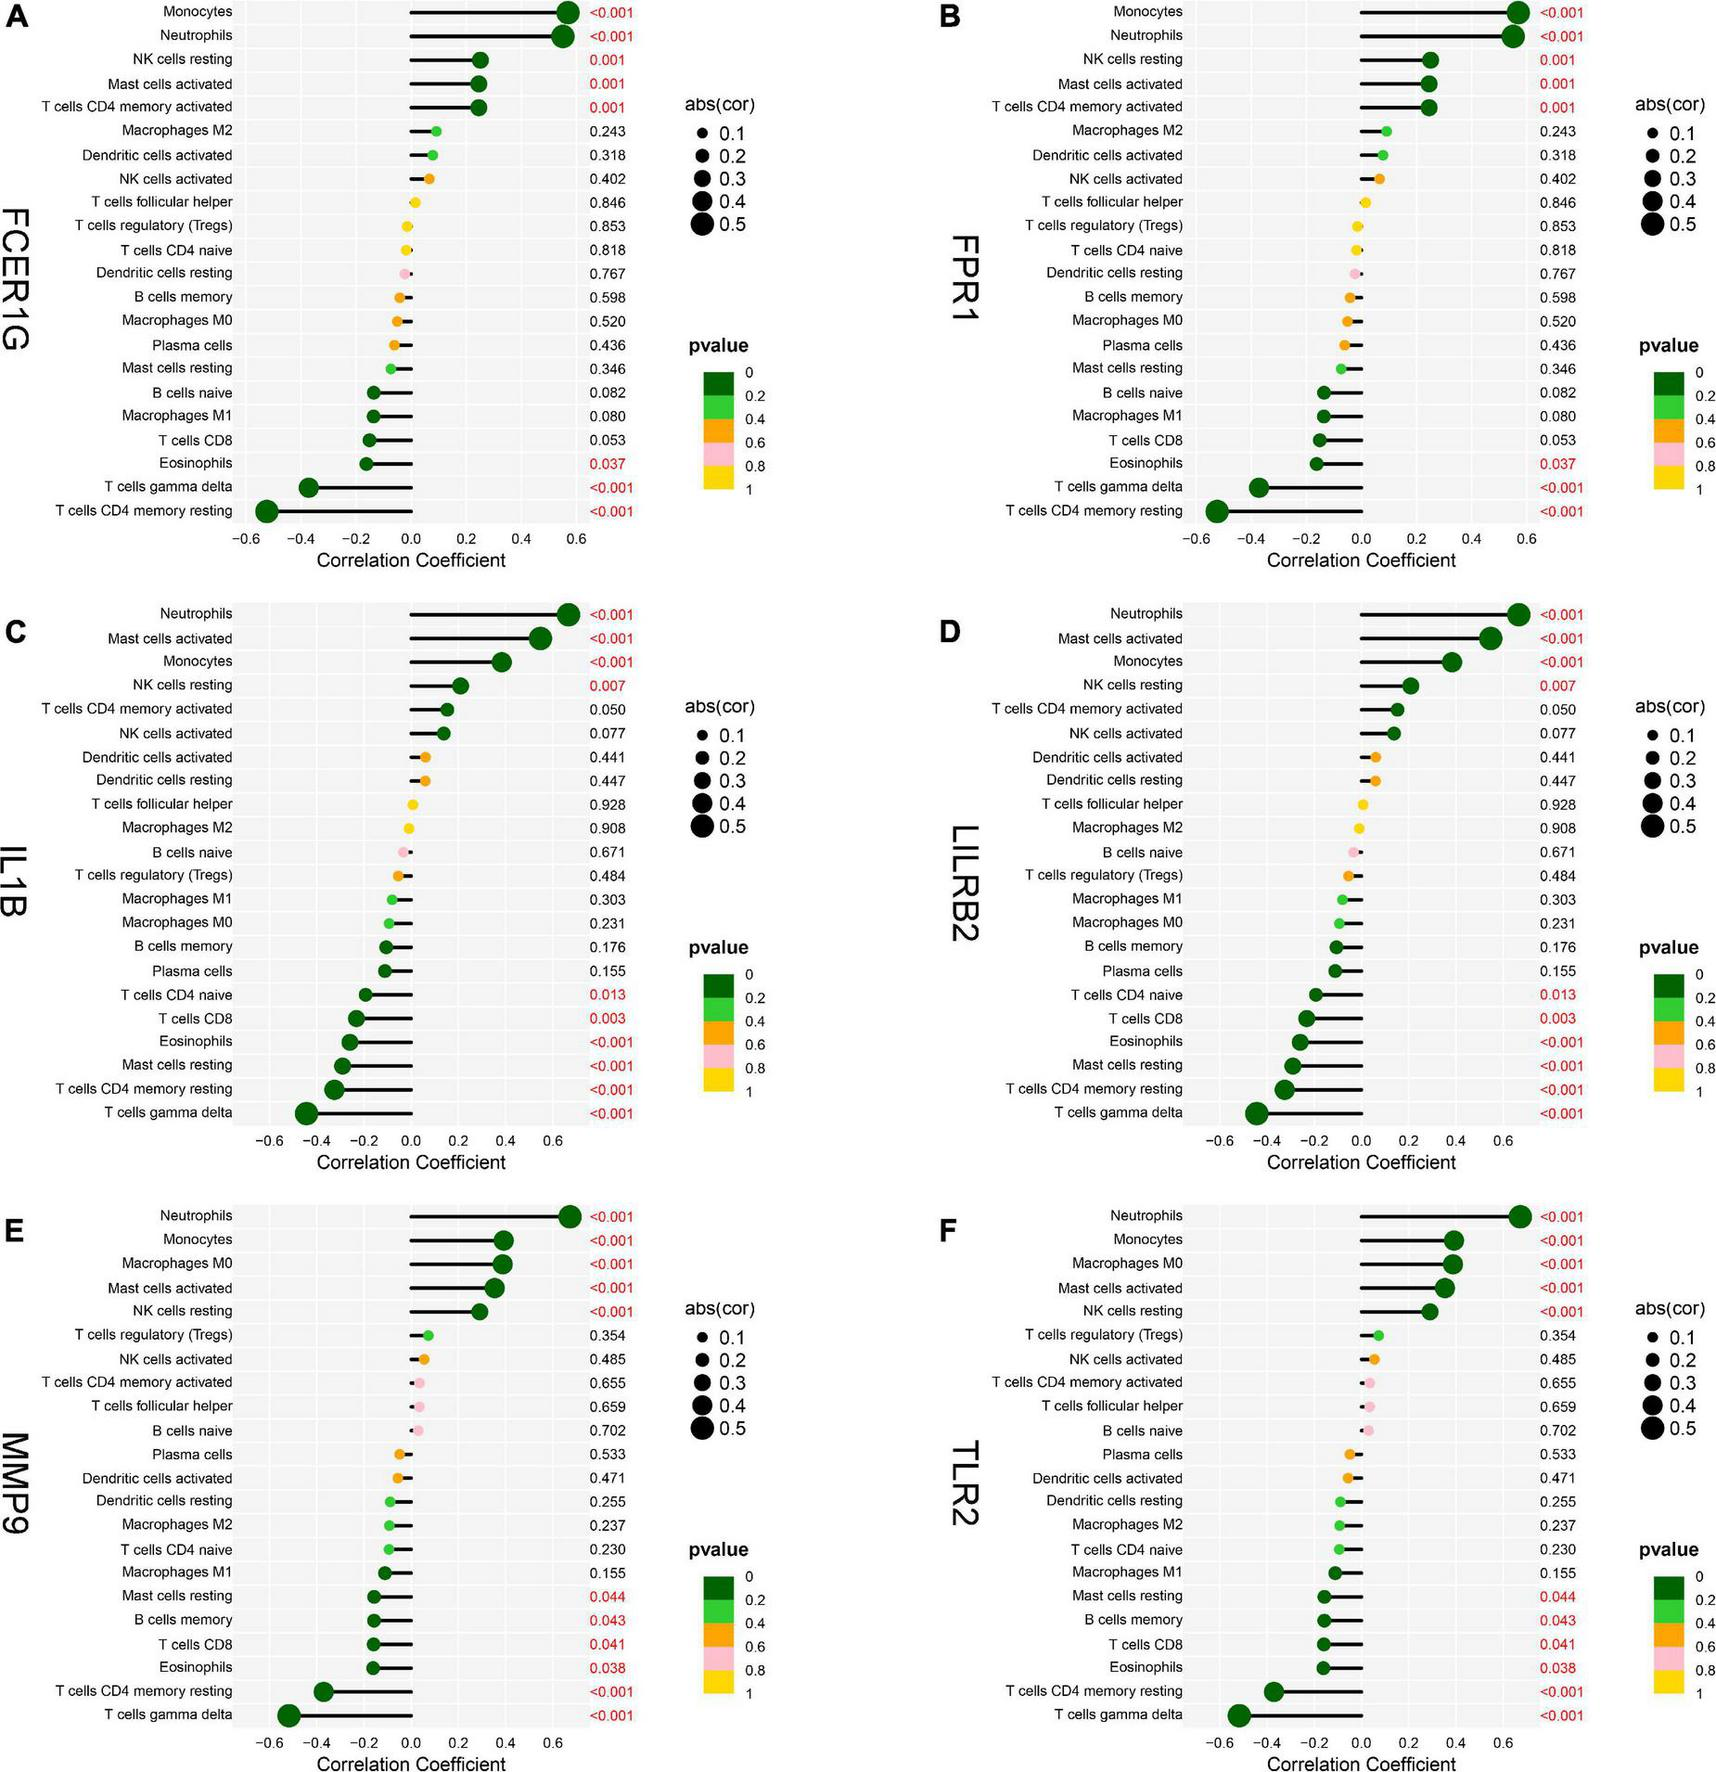
Analysis of correlation between hub genes and immune cells. (A) FCER1G, (B) FPR1, (C) IL1B, (D) LILRB2, (E) MMP9, and (F) TLR2.
Discussion
Acute myocardial infarction is a highly prevalent disease around world, which remains a leading cause of cardiovascular death. Therefore, timely and appropriate diagnosis of AMI is crucial to improve the prognosis. Previous studies have identified several diagnostic biomarkers for AMI including cardiac troponins T (cTnT) and I (cTnI), CK-MB (22). Cardiac troponins T (cTnT) has considered as the gold standard in the diagnosis of AMI, while its specificity is limited (23). Furthermore, recent research found that immune cell infiltration is closely related to the occurrence and development of AMI (24). Hence, we aimed to identify novel diagnostic biomarkers to screen for patients with AMI and reveal the role of immune cells in AMI.
In this study, we collected three data sets from the GEO database, and a total of 71 DEGs, including 68 upregulated genes and 3 downregulated genes, were found. Functional enrichment analyses were also performed, and the results demonstrated that DEGs were mainly enriched in inflammatory and immune-related functions. BP terms of GO were mainly enriched in immune responses, such as neutrophil activation, neutrophil-mediated immunity, and neutrophil migration. Through the KEGG pathway analysis, we found DEGs mainly enriched in immune system diseases and immune-related pathways, such as TB, IL-17 signaling pathways, NF-kappa B signaling pathway, and TNF signaling pathway. Moreover, the functional enrichment analysis based on DEGs between AMI and control tissues showed the results similar to those of GSEA. These findings suggested that immune and inflammatory systems are related to the pathogenesis of AMI (25). Interleukin-17 signaling pathway participates in the immune response, the production of inflammatory mediators, and poor remodeling after AMI (26). Moreover, NF-kappa B signaling pathway contributes to the enhanced inflammatory response in unstable angina, and NF-kappa B was considered to be involved in plaque destabilization (27). The IL-17 family has the capacity to activate the NF-kappa B signaling pathway and ultimately causes the expression inflammatory cytokines (28). The TNF signaling has been confirmed to be involved in the inflammatory cell accumulation and the cardiac remodeling following AMI (29). These studies confirmed that the immune response plays an important role in AMI. Thus, the exploration of novel biomarkers of AMI associated with immune cell infiltration via a bioinformatic analysis shows promise for the treatment of AMI.
Utilizing the STRING database, we constructed the PPI network and identified the hub genes. The top six hub genes, TLR2, IL1B, LILRB2, FCER1G, FPR1, and MMP9, were filtered for further study. TLRs contribute to AMI pathogenesis (30). TLR2 and TLR4 agonists trigger platelet activation in patients with AMI through NF-kappa B. Previous studies showed that the activation of TLR2 and TLR4 induced the innate immune response, increasing infarction size and influencing ventricular remodeling (31, 32). Another research indicated that the deficiency of TLR2 can alleviate inflammatory response and prevent cardiac remodeling after AMI (33).
Interleukin-1 beta is the best characterized cytokine of the IL-1 receptor family, which has been reported to serve as a key mediator of the inflammatory and immune response (34). IL1B blockage shows a promise for the treatment of AMI because of its central role in the regulation of an inflammatory response that results from AMI (35). LILRB members are the immunomodulatory receptors that can inhibit immune cell activation via cytoplasmic immunoreceptor tyrosine-based inhibitory motifs (ITIM) (36). LILRB2 has been reported to suppress the neutrophil overactivation and alleviate excessive inflammatory response (37). Yan et al. analyzed the expression of B cell-associated genes among patients with AMI, stable angina and health controls, a finding that LILRB2 and LILRB3 levels were statistically increased in AMI (38). The FCER1G gene is located on 1q23.3 (39). FCER1G is an innate immune gene and shows a negative modulatory role in the B-cell response (40). Formyl peptide receptors (FPRs) are G protein-coupled receptors that are involved in multiple pathologies (41). FPR1 knock-down mice showed decreased infarction size, suppressed inflammatory response, and cardiomyocyte apoptosis (42). More recent research suggested that FPR1 could be a novel biomarker for the diagnosis and the treatment of AMI (43, 44). Matrix metalloproteinases (MMPs) are a major family of zinc-dependent proteases that degrade diverse proteins in an extracellular matrix, which has obtained more and more attention in recent years. Recent studies have found that MMPs are closely related to immune cells and the ablation of MMP9 decreases the infarction size in AMI (45, 46). Wei et al. found that trimetazidine inhibited MMP2 and MMP9 expression and prevent cardiac rupture in mice with AMI (47). Thus, the evidence suggest that hub genes are involved in the development of AMI, which may be act as the potential therapeutic targets for AMI.
Then, we conducted the analysis of immune infiltration of AMI through the CIBERSORT algorithm, and analyzed the correlation between hub genes and infiltrating immune cells. The results from CIBERSORT showed that multiple immune cell subtypes were closely correlated with the important BPs of AMI. A higher fraction of CD4 memory-activated T cells, monocytes, activated mast cells and neutrophils, and a decreased fraction of CD8 T cells, CD4 memory resting T cells, gamma delta T cells, M1 macrophages, and eosinophils. Furthermore, the results of the correlation analysis between TLR2, IL1B, LILRB2, FCER1G, FPR1, and MMP9, and immune cells found that TLR2, IL1B, LILRB2, FCER1G, FPR1, and MMP9 all correlated with neutrophils, monocytes, resting NK cells, gamma delta T cells, and CD4 memory resting T cells. In recent years, there is a growing recognition that innate immune system plays an important contribution to the progression of heart disease (48). After AMI, a variety of immune cells, including neutrophils and monocytes, are recruited for the heart and trigger an intense inflammatory response (49). Neutrophils mediate the damage of infarcted cardiomyocytes via releasing matrix-degrading enzymes, and are also involved in postinfarction remodeling (50). Thus, these hub genes associated with immune cells could serve as potential therapeutic targets for AMI treatment. Moreover, our results (Figure 10) showed a synergistic effect between activated NK cells and Tregs cells as well as a competitive effect between gamma delta T cells and neutrophils. A few studies have reported the relationship. Accordingly, we speculate that activated NK cells and Tregs mutually reinforce their effects as well as gamma delta T cells and neutrophils mutually antagonize the activities of each other during AMI. However, the correlation between these immune cells needs to be further studied.
The limitations of our study should be considered. First, the number of original cases in each data set was low, thus we selected three data sets. Second, as the study was retrospective, the corresponding clinical information was lacking. Finally, this study was conducted via the bioinformatics analysis, further prospective studies are needed to determine the results in vivo.
Conclusion
In conclusion, TLR2, IL1B, LILRB2, FCER1G, FPR1, and MMP9 were identified as novel diagnostic biomarkers of AMI and their diagnostic values were verified using SPSS data analysis. Moreover, immune cells, such as neutrophils, monocytes, resting NK cells, gamma delta T cells, and CD4 memory resting T cells, may be involved in the occurrence and development of AMI. These immune cells may provide a novel perspective on immunotherapeutic targets for patients with AMI.
Publisher’s Note
All claims expressed in this article are solely those of the authors and do not necessarily represent those of their affiliated organizations, or those of the publisher, the editors and the reviewers. Any product that may be evaluated in this article, or claim that may be made by its manufacturer, is not guaranteed or endorsed by the publisher.
Statements
Data availability statement
Publicly available datasets were analyzed in this study. This data can be found here: All the raw data used in this study are available in the public GEO database (https://www.ncbi.nlm.nih.gov/geo/; Accession numbers: GSE66360, GSE48060, GSE60993, and GSE61144).
Author contributions
YW and WX conceived and designed this study. TJ, JH, ZX, HC, LL, and JP collected the data as well as provided assistance in data analysis. TJ, JH, and WX provided significant suggestions on the methodology. YW conducted data management and bioinformatics analysis and drafted the manuscript. YW, TJ, JH, ZX, HC, LL, and JP edited and revised the manuscript. All authors read and approved the final manuscript.
Funding
This study was supported by the National Natural Science Foundation of China (82000234), the Natural Science Foundation of Jiangxi Province (20202BABL206004), and the Technological Project of Health Commission of Jiangxi Province (202110022).
Acknowledgments
We thank the GEO for providing available data for AMI.
Conflict of interest
The authors declare that the research was conducted in the absence of any commercial or financial relationships that could be construed as a potential conflict of interest.
Footnotes
References
1.
ViraniSSAlonsoABenjaminEJBittencourtMSCallawayCWCarsonAPet alHeart disease and stroke statistics-2020 update: a report from the American heart association.Circulation. (2020) 141:e139–596. 10.1161/CIR.0000000000000757
2.
KapurNKThayerKLZweckE. Cardiogenic shock in the setting of acute myocardial infarction.Methodist Debakey Cardiovasc J. (2020) 16:16–21. 10.14797/mdcj-16-1-16
3.
de LemosJADraznerMHOmlandTAyersCRKheraARohatgiAet alAssociation of troponin T detected with a highly sensitive assay and cardiac structure and mortality risk in the general population.JAMA. (2010) 304:2503–12. 10.1001/jama.2010.1768
4.
de WinterRJKosterRWSturkASandersGT. Value of myoglobin, troponin T, and CK-MBmass in ruling out an acute myocardial infarction in the emergency room.Circulation. (1995) 92:3401–7. 10.1161/01.cir.92.12.3401
5.
ZhaoEXieHZhangY. Predicting diagnostic gene biomarkers associated with immune infiltration in patients with acute myocardial infarction.Front Cardiovasc Med. (2020) 7:586871. 10.3389/fcvm.2020.586871
6.
LawMRWattHCWaldNJ. The underlying risk of death after myocardial infarction in the absence of treatment.Arch Intern Med. (2002) 162:2405–10. 10.1001/archinte.162.21.2405
7.
ZhangRJiZQuYYangMSuYZuoWet alClinical value of ARG1 in acute myocardial infarction patients: bioinformatics-based approach.Biomed Pharmacother. (2020) 121:109590. 10.1016/j.biopha.2019.109590
8.
ChenJYuLZhangSChenX. Network analysis-based approach for exploring the potential diagnostic biomarkers of acute myocardial infarction.Front Physiol. (2016) 7:615. 10.3389/fphys.2016.00615
9.
XiongY-YGongZ-TTangR-JYangY-J. The pivotal roles of exosomes derived from endogenous immune cells and exogenous stem cells in myocardial repair after acute myocardial infarction.Theranostics. (2021) 11:1046–58. 10.7150/thno.53326
10.
XuJ-YXiongY-YLuX-TYangY-J. Regulation of Type 2 immunity in myocardial infarction.Front Immunol. (2019) 10:62. 10.3389/fimmu.2019.00062
11.
SureshRLiXChiriacAGoelKTerzicAPerez-TerzicCet alTranscriptome from circulating cells suggests dysregulated pathways associated with long-term recurrent events following first-time myocardial infarction.J Mol Cell Cardiol. (2014) 74:13–21. 10.1016/j.yjmcc.2014.04.017
12.
MuseEDKramerERWangHBarrettPParvizFNovotnyMAet alA whole blood molecular signature for acute myocardial infarction.Sci Rep. (2017) 7:12268. 10.1038/s41598-017-12166-0
13.
ParkH-JNohJHEunJWKohY-SSeoSMParkWSet alAssessment and diagnostic relevance of novel serum biomarkers for early decision of ST-elevation myocardial infarction.Oncotarget. (2015) 6:12970–83. 10.18632/oncotarget.4001
14.
LeekJTJohnsonWEParkerHSJaffeAEStoreyJD. The sva package for removing batch effects and other unwanted variation in high-throughput experiments.Bioinformatics. (2012) 28:882–3. 10.1093/bioinformatics/bts034
15.
RitchieMEPhipsonBWuDHuYLawCWShiWet allimma powers differential expression analyses for RNA-sequencing and microarray studies.Nucleic Acids Res. (2015) 43:e47. 10.1093/nar/gkv007
16.
SepulvedaJL. Using R and bioconductor in clinical genomics and transcriptomics.J Mol Diagn. (2020) 22:3–20. 10.1016/j.jmoldx.2019.08.006
17.
WalterWSánchez-CaboFRicoteM. GOplot: an R package for visually combining expression data with functional analysis.Bioinformatics. (2015) 31:2912–4. 10.1093/bioinformatics/btv300
18.
KanehisaMGotoS. KEGG: kyoto encyclopedia of genes and genomes.Nucleic Acids Res. (2000) 28:27–30.
19.
LiberzonASubramanianAPinchbackRThorvaldsdóttirHTamayoPMesirovJP. Molecular signatures database (MSigDB) 3.0.Bioinformatics. (2011) 27:1739–40. 10.1093/bioinformatics/btr260
20.
SzklarczykDGableALLyonDJungeAWyderSHuerta-CepasJet alSTRING v11: protein-protein association networks with increased coverage, supporting functional discovery in genome-wide experimental datasets.Nucleic Acids Res. (2019) 47:D607–13. 10.1093/nar/gky1131
21.
NewmanAMLiuCLGreenMRGentlesAJFengWXuYet alRobust enumeration of cell subsets from tissue expression profiles.Nat Methods. (2015) 12:453–7. 10.1038/nmeth.3337
22.
AroraGBittnerV. Chest pain characteristics and gender in the early diagnosis of acute myocardial infarction.Curr Cardiol Rep. (2015) 17:5. 10.1007/s11886-014-0557-5
23.
SandovalYSmithSWSexterAThordsenSEBruenCACarlsonMDet alType 1 and 2 myocardial infarction and myocardial injury: clinical transition to high-sensitivity cardiac troponin I.Am J Med. (2017) 130:1431–9.e4. 10.1016/j.amjmed.2017.05.049
24.
WeilBRNeelameghamS. Selectins and immune cells in acute myocardial infarction and post-infarction ventricular remodeling: pathophysiology and novel treatments.Front Immunol. (2019) 10:300. 10.3389/fimmu.2019.00300
25.
JaénRIVal-BlascoAPrietoPGil-FernándezMSmaniTLópez-SendónJLet alInnate immune receptors, key actors in cardiovascular diseases.JACC Basic to Transl Sci. (2020) 5:735–49. 10.1016/j.jacbts.2020.03.015
26.
Mora-RuízMDBlanco-FavelaFChávez RuedaAKLegorreta-HaquetMVChávez-SánchezL. Role of interleukin-17 in acute myocardial infarction.Mol Immunol. (2019) 107:71–8. 10.1016/j.molimm.2019.01.008
27.
LiuzzoGSantamariaMBiasucciLMNarducciMColafrancescoVPortoAet alPersistent activation of nuclear factor kappa-B signaling pathway in patients with unstable angina and elevated levels of C-reactive protein evidence for a direct proinflammatory effect of azide and lipopolysaccharide-free C-reactive protein on human mon.J Am Coll Cardiol. (2007) 49:185–94. 10.1016/j.jacc.2006.07.071
28.
SongXQianY. The activation and regulation of IL-17 receptor mediated signaling.Cytokine. (2013) 62:175–82. 10.1016/j.cyto.2013.03.014
29.
XiaoJMoonMYanLNianMZhangYLiuCet alCellular FLICE-inhibitory protein protects against cardiac remodelling after myocardial infarction.Basic Res Cardiol. (2012) 107:239. 10.1007/s00395-011-0239-z
30.
HallyKELa FlammeACLarsenPDHardingSA. Platelet Toll-like receptor (TLR) expression and TLR-mediated platelet activation in acute myocardial infarction.Thromb Res. (2017) 158:8–15. 10.1016/j.thromres.2017.07.031
31.
TimmersLPasterkampGde HoogVCArslanFAppelmanYde KleijnDPV. The innate immune response in reperfused myocardium.Cardiovasc Res. (2012) 94:276–83. 10.1093/cvr/cvs018
32.
ArslanFde KleijnDPPasterkampG. Innate immune signaling in cardiac ischemia.Nat Rev Cardiol. (2011) 8:292–300. 10.1038/nrcardio.2011.38
33.
ShishidoTNozakiNTakahashiHArimotoTNiizekiTKoyamaYet alCentral role of endogenous Toll-like receptor-2 activation in regulating inflammation, reactive oxygen species production, and subsequent neointimal formation after vascular injury.Biochem Biophys Res Commun. (2006) 345:1446–53. 10.1016/j.bbrc.2006.05.056
34.
Lopez-CastejonGBroughD. Understanding the mechanism of IL-1β secretion.Cytokine Growth Factor Rev. (2011) 22:189–95. 10.1016/j.cytogfr.2011.10.001
35.
LiZHuSHuangKSuTCoresJChengK. Targeted anti-IL-1β platelet microparticles for cardiac detoxing and repair.Sci Adv. (2020) 6:eaay0589. 10.1126/sciadv.aay0589
36.
van der TouwWChenH-MPanP-YChenS-H. LILRB receptor-mediated regulation of myeloid cell maturation and function.Cancer Immunol Immunother. (2017) 66:1079–87. 10.1007/s00262-017-2023-x
37.
Lewis MarffyALMcCarthyAJ. Leukocyte Immunoglobulin-Like Receptors (LILRs) on human neutrophils: modulators of infection and immunity.Front Immunol. (2020) 11:857. 10.3389/fimmu.2020.00857
38.
YanWSongHJiangJXuWGongZDuanQet alCharacteristics of B cell-associated gene expression in patients with coronary artery disease.Mol Med Rep. (2016) 13:4113–21. 10.3892/mmr.2016.5029
39.
KüsterHThompsonHKinetJP. Characterization and expression of the gene for the human Fc receptor gamma subunit. Definition of a new gene family.J Biol Chem. (1990) 265:6448–52. 10.1016/s0021-9258(19)39347-0
40.
SweetRANickersonKMCullenJLWangYShlomchikMJ. B Cell-Extrinsic Myd88 and Fcer1g negatively regulate autoreactive and normal B cell immune responses.J Immunol. (2017) 199:885–93. 10.4049/jimmunol.1600861
41.
VacchelliELe NaourJKroemerG. The ambiguous role of FPR1 in immunity and inflammation.Oncoimmunology. (2020) 9:1760061. 10.1080/2162402X.2020.1760061
42.
ZhouQ-LTengFZhangY-SSunQCaoY-XMengG-W. FPR1 gene silencing suppresses cardiomyocyte apoptosis and ventricular remodeling in rats with ischemia/reperfusion injury through the inhibition of MAPK signaling pathway.Exp Cell Res. (2018) 370:506–18. 10.1016/j.yexcr.2018.07.016
43.
PerrettiMLeroyXBlandEJMontero-MelendezT. Resolution pharmacology: opportunities for therapeutic innovation in inflammation.Trends Pharmacol Sci. (2015) 36:737–55. 10.1016/j.tips.2015.07.007
44.
ZhangSLiuWLiuXQiJDengC. Biomarkers identification for acute myocardial infarction detection via weighted gene co-expression network analysis.Medicine (Baltimore). (2017) 96:e8375. 10.1097/MD.0000000000008375
45.
LiMXingSZhangHShangSLiXRenBet alA matrix metalloproteinase inhibitor enhances anti-cytotoxic T lymphocyte antigen-4 antibody immunotherapy in breast cancer by reprogramming the tumor microenvironment.Oncol Rep. (2016) 35:1329–39. 10.3892/or.2016.4547
46.
YadavSKKambisTNKarSParkSYMishraPK. MMP9 mediates acute hyperglycemia-induced human cardiac stem cell death by upregulating apoptosis and pyroptosis in vitro.Cell Death Dis. (2020) 11:186. 10.1038/s41419-020-2367-6
47.
GongWMaYLiAShiHNieS. Trimetazidine suppresses oxidative stress, inhibits MMP-2 and MMP-9 expression, and prevents cardiac rupture in mice with myocardial infarction.Cardiovasc Ther. (2018) 36:e12460. 10.1111/1755-5922.12460
48.
SwirskiFKNahrendorfM. Cardioimmunology: the immune system in cardiac homeostasis and disease.Nat Rev Immunol. (2018) 18:733–44. 10.1038/s41577-018-0065-8
49.
PrabhuSDFrangogiannisNG. The biological basis for cardiac repair after myocardial infarction: from inflammation to fibrosis.Circ Res. (2016) 119:91–112. 10.1161/CIRCRESAHA.116.303577
50.
CarboneFNencioniAMachFVuilleumierNMontecuccoF. Pathophysiological role of neutrophils in acute myocardial infarction.Thromb Haemost. (2013) 110:501–14. 10.1160/TH13-03-0211
Summary
Keywords
acute myocardial infarction, immune cell infiltration, hub gene, bioinformatics, CIBERSORT
Citation
Wu Y, Jiang T, Hua J, Xiong Z, Chen H, Li L, Peng J and Xiong W (2022) Integrated Bioinformatics-Based Analysis of Hub Genes and the Mechanism of Immune Infiltration Associated With Acute Myocardial Infarction. Front. Cardiovasc. Med. 9:831605. doi: 10.3389/fcvm.2022.831605
Received
09 December 2021
Accepted
28 February 2022
Published
06 April 2022
Volume
9 - 2022
Edited by
Yuli Huang, Shunde Hospital, Southern Medical University, China
Reviewed by
Guangyin Zhang, First Teaching Hospital of Tianjin University of Traditional Chinese Medicine, China; Hairuo Lin, Nanfang Hospital, Southern Medical University, China; Lintao Zhong, Zhuhai People’s Hospital, China
Updates
Copyright
© 2022 Wu, Jiang, Hua, Xiong, Chen, Li, Peng and Xiong.
This is an open-access article distributed under the terms of the Creative Commons Attribution License (CC BY). The use, distribution or reproduction in other forums is permitted, provided the original author(s) and the copyright owner(s) are credited and that the original publication in this journal is cited, in accordance with accepted academic practice. No use, distribution or reproduction is permitted which does not comply with these terms.
*Correspondence: Wenjun Xiong, xiongwenjunnc@foxmail.com
This article was submitted to Cardiovascular Genetics and Systems Medicine, a section of the journal Frontiers in Cardiovascular Medicine
Disclaimer
All claims expressed in this article are solely those of the authors and do not necessarily represent those of their affiliated organizations, or those of the publisher, the editors and the reviewers. Any product that may be evaluated in this article or claim that may be made by its manufacturer is not guaranteed or endorsed by the publisher.