Identification and validation of key genes associated with atrial fibrillation in the elderly
 Chuanbin Liu
 Jing Zeng
 Jin Wu
 Jing Wang4
  Jiao Fan
- 1Western Medical Branch of PLA General Hospital, Beijing, China
- 2Department of Endocrinology, The Second Medical Centre & National Clinical Research Centre for Geriatric Disease, Chinese PLA General Hospital, Beijing, China
- 3Tianjin Key Laboratory of Risk Assessment and Control Technology for Environment and Food Safety, Institute of Environmental and Operational Medicine, Tianjin, China
- 4Department of General Medicine, The First Medical Center of PLA General Hospital, Beijing, China
- 5Department of Ophthalmology, PLA Strategic Support Force Characteristic Medical Center, Beijing, China
- 6Department of Cardiovascular Surgery, the First Medical Center of PLA General Hospital, Beijing, China
- 7Clinical Pharmacy Laboratory, Chinese PLA General Hospital, Beijing, China
- 8Institute of Geriatrics, The Second Medical Centre & National Clinical Research Centre for Geriatric Disease, Chinese PLA General Hospital, Beijing, China
Background: Atrial fibrillation (AF) is the most common cardiac arrhythmia and significantly increases the risk of stroke and heart failure (HF), contributing to a higher mortality rate. Increasing age is a major risk factor for AF; however, the mechanisms of how aging contributes to the occurrence and progression of AF remain unclear. This study conducted weighted gene co-expression network analysis (WGCNA) to identify key modules and hub genes and determine their potential associations with aging-related AF.
Materials and methods: WGCNA was performed using the AF dataset GSE2240 obtained from the Gene Expression Omnibus, which contained data from atrial myocardium in cardiac patients with permanent AF or sinus rhythm (SR). Hub genes were identified in clinical samples. Gene Ontology (GO) and Kyoto Encyclopedia of Genes and Genomes (KEGG) enrichment analyses were also performed.
Results: Green and pink were the most critical modules associated with AF, from which nine hub genes, PTGDS, COLQ, ASTN2, VASH1, RCAN1, AMIGO2, RBP1, MFAP4, and ALDH1A1, were hypothesized to play key roles in the AF pathophysiology in elderly and seven of them have high diagnostic value. Functional enrichment analysis demonstrated that the green module was associated with the calcium, cyclic adenosine monophosphate (cAMP), and peroxisome proliferator-activated receptors (PPAR) signaling pathways, and the pink module may be associated with the transforming growth factor beta (TGF-β) signaling pathway in myocardial fibrosis.
Conclusion: We identified nine genes that may play crucial roles in the pathophysiological mechanism of aging-related AF, among which six genes were associated with AF for the first time. This study provided novel insights into the impact of aging on the occurrence and progression of AF, and identified biomarkers and potential therapeutic targets for AF.
Introduction
Atrial fibrillation (AF) is the most common cardiac arrhythmia and increases the risk of myocardial infarction (MI), heart failure (HF), and stroke, contributing to a higher mortality rate (1). Increasing age is a prominent risk factor for AF, and approximately 70% of individuals with AF are between the ages of 65 and 85 years (2, 3). One in three individuals of European descent over the age of 55 has AF (4). With the aging population, the prevalence of AF and the absolute number of AF patients will continuously increase worldwide in the coming decades. With the continuous development and promotion of new technologies, such as radiofrequency ablation (RA) surgery and left atrial appendage closure (LAAC), treatment options for AF have evolved considerably. However, the mechanisms of how aging contributes to the development and progression of AF are still unclear. Aggressive antithrombotic therapy effectively prevents AF complications, but the low awareness of AF results in some patients not receiving timely and effective treatment, eventually causing strokes or death (5). In addition, paroxysmal and asymptomatic AF cannot be easily diagnosed using electrocardiography (ECG) and Holter monitoring (6). Thus, biomarkers for AF screening are urgently necessary.
AF is accompanied by a complex biological process under the synergistic action of multiple genes (7, 8). The traditional biological methods to study the expression and function of many genes cannot reveal a more comprehensive systemic behavior through gene interactions. Genetics plays an important role in studying the etiology of many complex diseases. Individual genes do not work alone but interact with other genes to influence human health. Studies have shown that each gene interacts with an average of 4–8 other genes and is involved in ten biological functions (9). Gene networks can predict the function of new genes and identify hundreds of genes associated with complex diseases, thus, predicting relevant targets for therapeutic intervention in diseases. Weighted gene co-expression network analysis (WGCNA) is a commonly used method for constructing gene networks, detecting gene modules, and identifying hub genes in modules (10). The WGCNA has been widely used to identify key genes involved in human disease progressions, such as cancer, Alzheimer's disease (AD), and mental disorders. Moreover, WGCNA has been validated as a valuable method to identify the underlying mechanisms, potential biomarkers, or therapeutic targets by focusing on key modules (11–13). Previous studies on the mechanisms of AF have concentrated on electrical and structural remodeling, with relatively few identifying comprehensive regulatory networks (14, 15). Li et al. (16) screened several AF-related genes and pathways using the WGCNA method and performed preliminary validation at the animal level. In contrast, this study focused on the differences in the expression of key genes between elderly patients with AF and non-AF patients.
The present study used the GSE2240 dataset downloaded from the Gene Expression Omnibus (GEO) database to perform WGCNA to identify the AF closely associated gene modules for further analysis of Gene Ontology (GO) and Kyoto Encyclopedia of Genes and Genomes (KEGG). Hub genes in the modules highly associated with AF were identified, and the biological functions and pathways of genes in the key modules were analyzed. Quantitative reverse transcription polymerase chain reaction (RT-qPCR) was used to detect peripheral blood leukocytes in elderly AF patients and controls to verify the results of the hub genes in critical modules. This study revealed the potential regulatory mechanisms underlying aging in AF and identified novel biomarkers and therapeutic targets.
Materials and methods
Dataset information
The AF dataset, GSE2240, was obtained from the National Center for Biotechnology Information (NCBI) Gene Expression Omnibus (GEO; https://www.ncbi.nlm.nih.gov/geo/). GSE2240 contained data on 30 right atrial appendages from 10 patients with permanent AF, defined as AF duration longer than 3 months, and 20 patients with sinus rhythm (SR), with no history of AF.
Data pre-processing
Raw data were pre-processed identically R for background correction and normalization. R package annotation was conducted to match probes and gene symbols, and the probes matching several genes were removed. The median was regarded as the final expression value for the gene matched by multiple probes. We calculated the standard deviation (SD) for each gene and ranked them from the largest to the smallest, and the top 5000 genes were chosen for WGCNA refer to the official tutorials.
Construction of the weighted gene co-expression network
A gene co-expression network was constructed using the R package WGCNA (10, 17). In this analysis, nodes represented genes, and edges represented the degree of co-expression. Firstly, the hclust function was used to cluster the samples to determine whether there were outliers samples. Then, weighted correlation coefficients were introduced to calculate the adjacency matrix of the expression profile genes. The co-expression similarity between genes i and j was defined as Sij = |cor(i,j)|. The correlated adjacency of the genes was further analyzed using the power function: aij = |Sij|β. After that, soft threshold β was chosen within a specific range to satisfy the scale-free network and better network connectivity. Fit index R2 > 0.85 was set to make the connections between genes obey the approximate scale-free network distribution. And the pickSoftThreshold function was applied to automatically filter the appropriate soft threshold β. Finally, the blockwiseModules function was used for network construction and module detection to generate the topological overlap matrix (TOM) with a minimum module size of 50 and a merge cut height of 0.25 for co-expressed gene modules. Based on the heterogeneity of TOM, the genes with similar expression patterns were divided into the same module by means of average link hierarchical clustering, and the gene modules were identified by dynamic shearing tree method.
Correlation analysis of co-expression modules with clinical traits
Gene modules are clusters of genes that are closely related to co-expression. WGCNA uses a hierarchical clustering approach to identify gene modules and represents each cluster with a different color. Genes not assigned to any module are placed in gray modules. Principal component analysis was performed for each module, and the module eigengenes (MEs) were calculated using the first principal component representing the overall expression level of the module. Module-trait correlation coefficients were calculated to provide a heat map of the correlation coefficients between modules and traits (18). Then, we screened the gene modules significantly associated with the traits using the eigenvectors of modules, correlation coefficients of traits, and module significance (P < 0.05). The values of gene significance (GS) and module membership (MM) were calculated. GS represents the correlation between gene expression and traits within the calculated module, and MM represents the correlation coefficient between the expression of a gene and the expression of the main component of the gene within the module. Finally, the list of genes calculated by the networkScreening function was screened by setting the value range of GS, MM, and q.weighted to identify and characterize the key hub genes.
Network visualization and functional enrichment analysis
Gene modules significantly associated with traits were selected, and network maps were drawn by weighted co-expression relationships between genes using the Cytoscape software. Functional annotation analysis of genes in the core module based on the Gene Ontology (GO) database and signaling pathway enrichment analysis of genes in the core module based on the Kyoto Encyclopedia of Genes and Genomes (KEGG) database were performed to determine the biological functions and potential biological pathways of genes in the trait-related modules.
Validation of the clinically related genes by RT-qPCR
All protocols and the use of human blood samples were in accordance with the Declaration of Helsinki and approved by the Human Ethics Review Committee of the Chinese PLA General Hospital. All leukocyte samples were obtained from the PLA General Hospital Biosample Bank, including 9 elderly AF patients and 9 elderly non-AF controls. Blood samples were collected in EDTA anticoagulation tubes. Leukocytes were isolated from human peripheral blood by Ficoll density gradient centrifugation according to the manufacturer's instructions and stored at −80°C until further analysis. Detailed patient characteristics are summarized in Supplementary Table S1.
Total RNA was extracted from leukocytes using an RNAprep Pure Blood Kit (TIANGEN Biotech Corporation, China), according to the standard protocol. Absorption spectrophotometry using NanoDrop-1,000 (Thermo Fisher Scientific, Yokohama, Japan) was used to determine RNA concentrations and purity (260/280 ratio >1.8). The RNA (1 μg per sample) was reverse transcribed using the High-Capacity cDNA Reverse Transcription Kit (Applied Biosystems, CA, USA) in a total reaction volume of 20 μl, following the manufacturer's instructions. Then, RT-qPCR was performed as follows: pre-denatured at 95°C for 30 s; denatured at 95°C for 5 s, and 40 cycles at 60°C for 30–34 s. All experiments were performed in triplicates. The housekeeping gene GAPDH was used as the endogenous reference. The primer sequences of PTGDS, COLQ, ASTN2, VASH1, RCAN1, AMIGO2, RBP1, MFAP4, and ALDH1A1 used in this study are listed in Supplementary Table S2. The relative mRNA expression levels were calculated using the 2−ΔΔCt method. A flow chart of this study is shown in Figure 1.
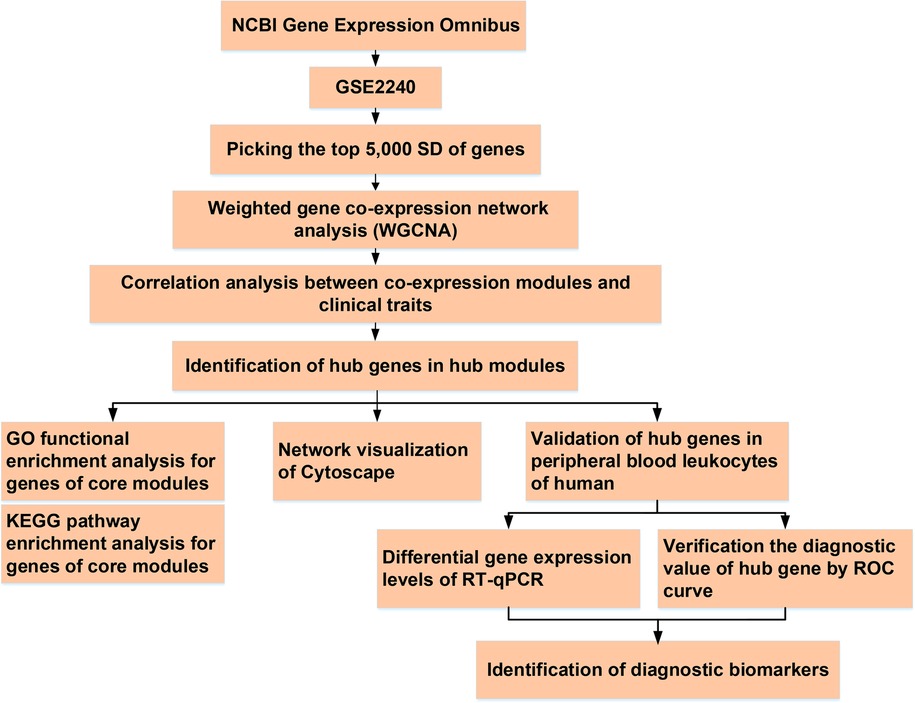
Figure 1. The flowchart of analysis process.
Statistical analysis
Statistical analyses were performed using SPSS statistical package (version 21.0; SPSS Inc., Chicago, USA). Continuous variables were presented as mean ± standard error (SE), and categorical variables were expressed as percentages. Student's t-test or the chi-square test was used to determine the differences between AF patients and controls. The sample size was analyzed by PASS (version 15.0; NCSS, USA). Differences were considered statistically significant at P < 0.05.
Results
Construction of WGCNA network
Gene expression values of all samples were subjected to sample clustering and phenotypic heat map analysis. As shown in Figure 2A, there were no significant outlier samples. Therefore, all the samples were included in the subsequent data analysis. Using the WGCNA, we calculated and selected β = 8 as the soft threshold for the dataset based on the scale-free network fit index and average connectivity (Figures 2B,C). The adjacency and TOM matrices between genes were calculated. A hierarchical clustering tree of the genes was constructed based on the TOM matrix. Then, the genes were divided into 19 modules using the dynamic shearing tree method. Each module was represented by a colored rectangle, and the vertical coordinates were the gene occupancy ratio. The tree branches correspond to 10 different gene modules, each leaf on the tree corresponds to a gene, and similar genes are clustered into modules of the same color (Figures 3A,B). The module name and the number of genes included in each module were as follows: turquoise (1,617), blue (513), brown (489), yellow (430), green-yellow (105), black (188), magenta (163), pink (177), red (199), purple (135), yellow (332), grey (21), tan (95), salmon (92), cyan (91), midnight blue (79), light cyan (68), grey60 (68), and light green (58). Genes from each module are listed in Supplementary Table S3. The genes in the gray module could not be clustered to any other module and were removed from the subsequent analysis.
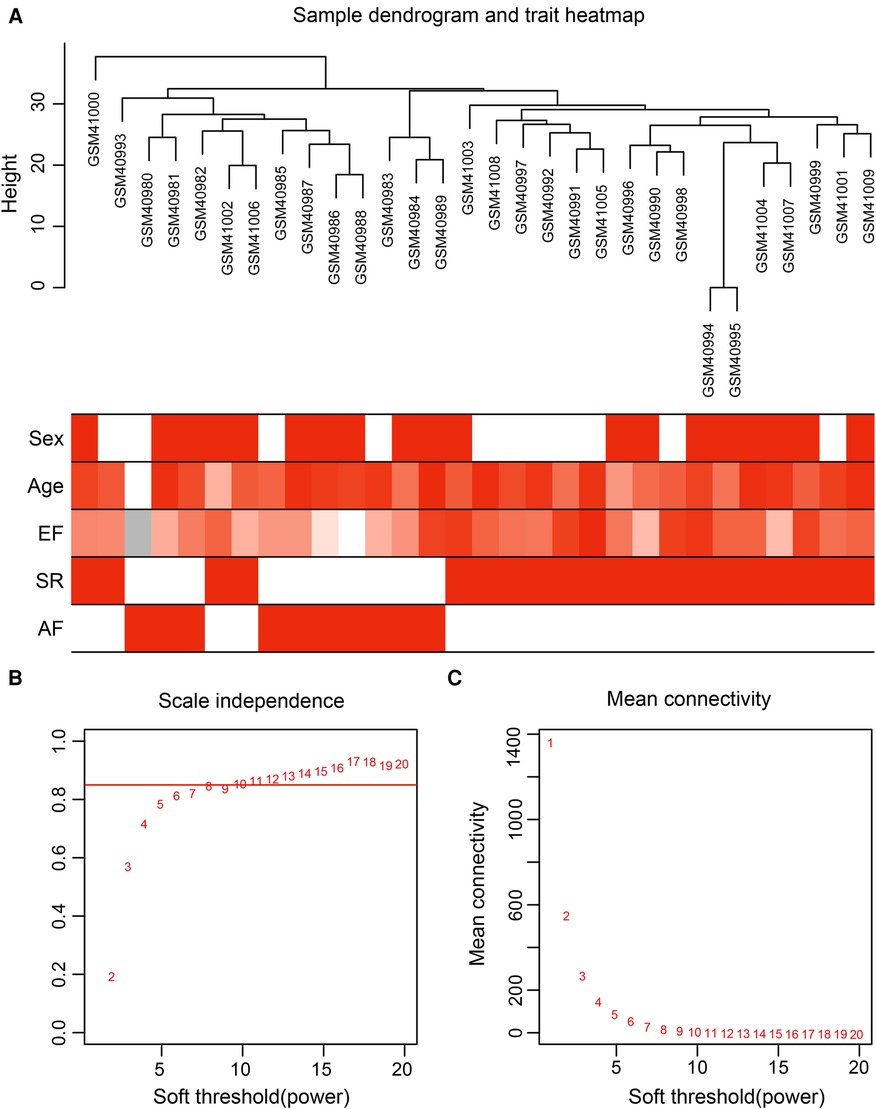
Figure 2. Data preparation of co-expression network. (A) Clinical feature heatmap and hierarchical clustering dendrogram. The degree of heatmap from white to dark red recognizes low to high levels of clinical characteristics, and gray indicates unavailable data. The clinical feature includes sex, age, ejection fraction (EF), SR and AF. (B,C) A scale-free co-expression network estimated by the soft-thresholding powers, and the best power value β was obtained as 8.
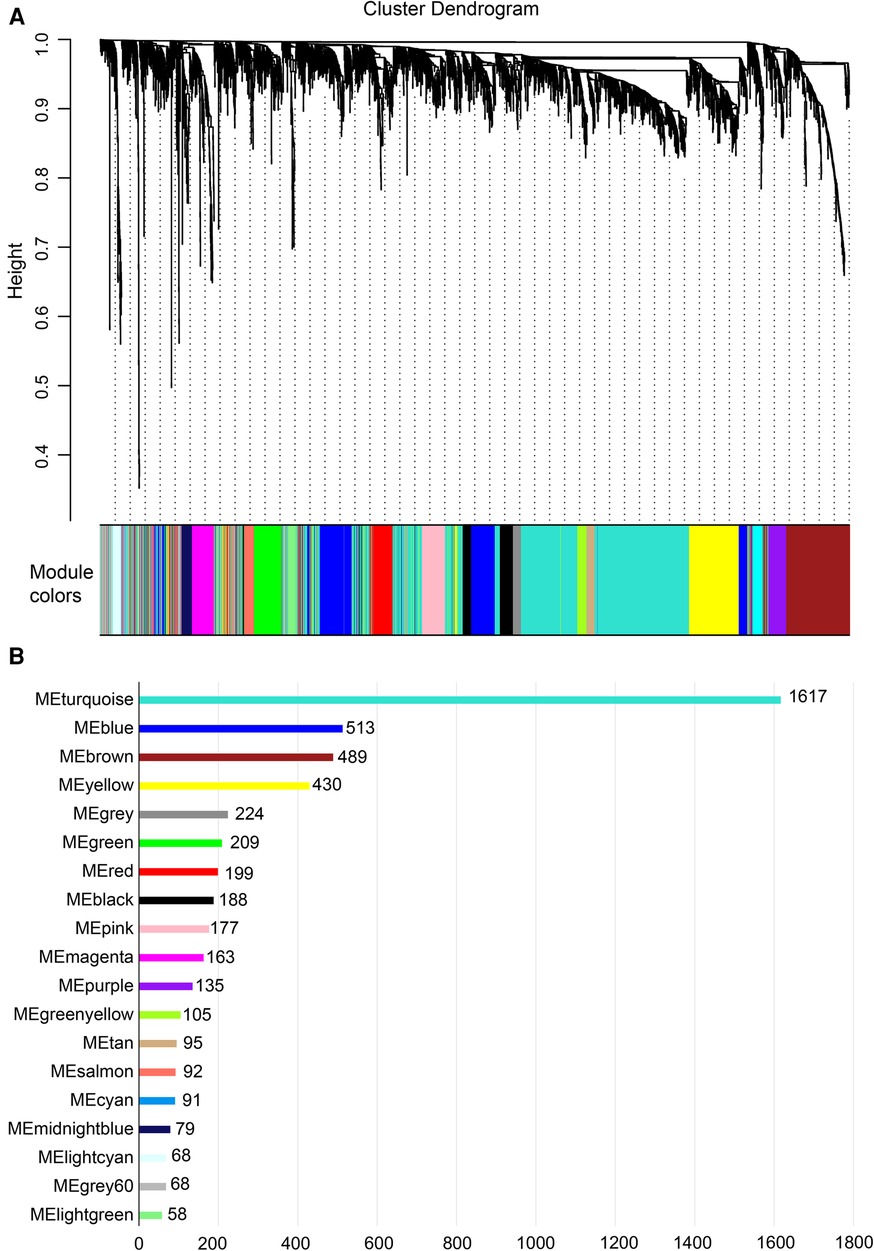
Figure 3. Construction of co-expression network. (A) Nineteen co-expression modules constructed by clustering dendrograms and partitioned into different module colors (non-clustering genes shown in gray). (B) The bar plot of numbers in modules.
Correlation between modules and clinical traits
The correlation heat map between co-expression modules and clinical traits was drawn by calculating the relationship between each gene module and clinical traits. Hierarchical clustering and heat map analyses were performed for each module. The correlations between the modules are shown in Figure 4A. The pink and green modules are distributed in different clustering subtrees. In this study, the pink module exhibited the highest positive correlation (r = 0.76, P < 0.0001) with the SR phenotype, and the green module exhibited the highest negative correlation with the AF phenotype (r = −0.8, P < 0.0001) (Figure 4B). Therefore, we focused on these two modules in the subsequent analysis.
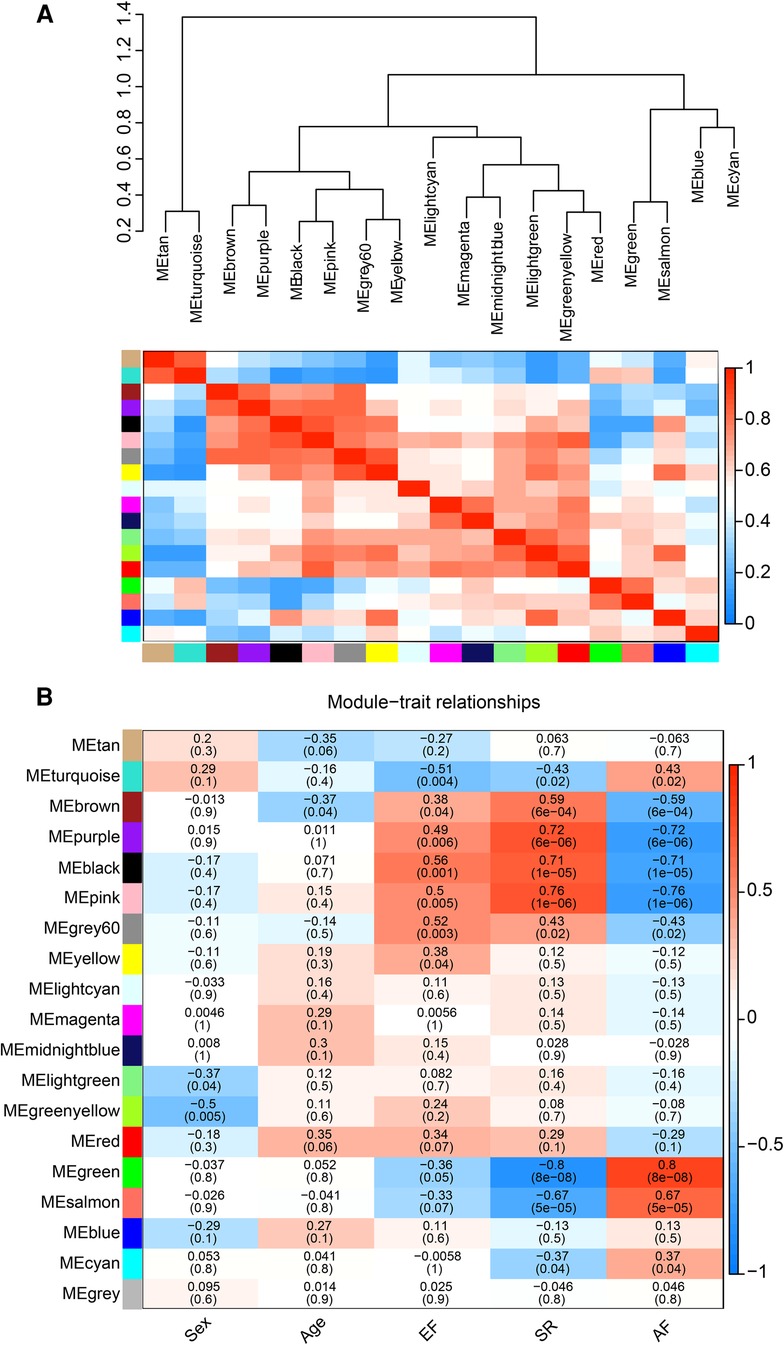
Figure 4. Correlation between co-expression modules and clinical traits. (A) Hierarchical clustering trees and heatmap of different modules. The red shows positive correlation and blue shows negative correlation. (B) Correlation relationship between each network module and traits. The values in the matrix cell indicate the correlation coefficient and the related p-value.
The pink and green modules were used as key modules for GS and MM analyses, respectively. The correlation coefficient between GS and MM was r = 0.75, P < 0.0001 (Figure 5A) and r = 0.65, P < 0.0001 (Figure 5B) for the green and pink modules, respectively. Figures 5C,D represent the heat map of eigengene expression for the two modules. Figures 5E,F show the heat and clustering map between the genes of the two modules and each clinical trait.
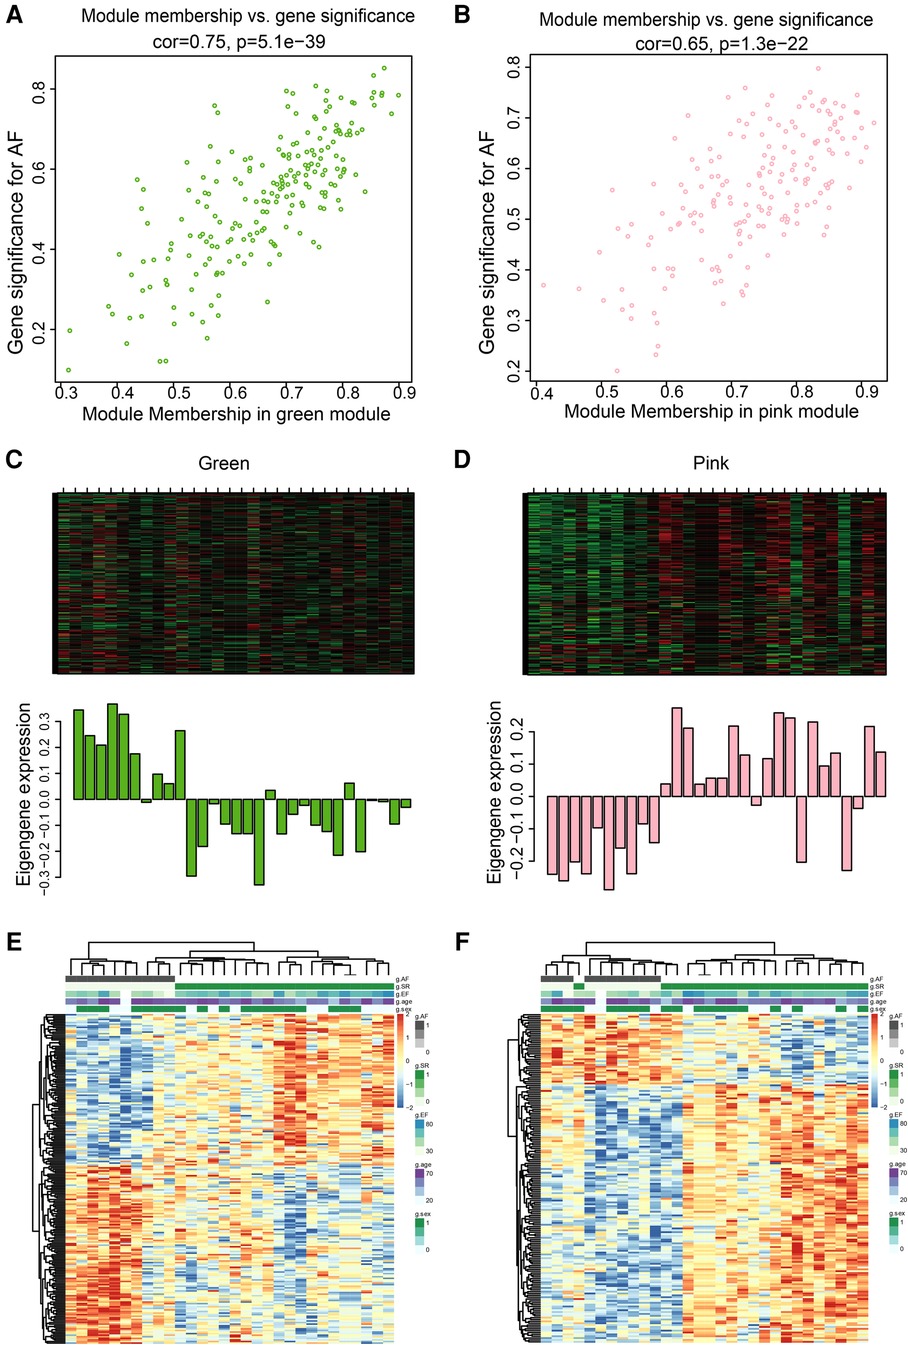
Figure 5. Correlation between green and pink modules with SR and AF. (A,B) Scatter plot in green (A) and pink (B) modules with GS (y-axis) and MM (x-axis). (C,D) The expression level of genes in green (C) and pink (D) modules. In the heatmap, green indicates the low expression and red indicates the high expression for samples. (E,F) Heatmap and clustering map of clinical traits in green (E) and pink (F) modules. In the clustering map, the varying shades of color recognizes low to high levels of expression in each clinical trait.
Finally, three criteria were used to screen for key hub genes in the pink and green modules: GS > 0.65, MM > 0.8, and q.weighted <0.01. After excluding non-coding genes, 16 hub genes were screened in the green module (Table 1) and 23 hub genes in the pink module (Table 2).
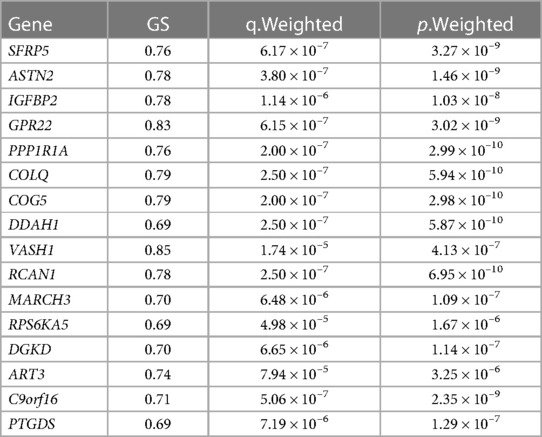
Table 1. Hub genes screened in the green module.
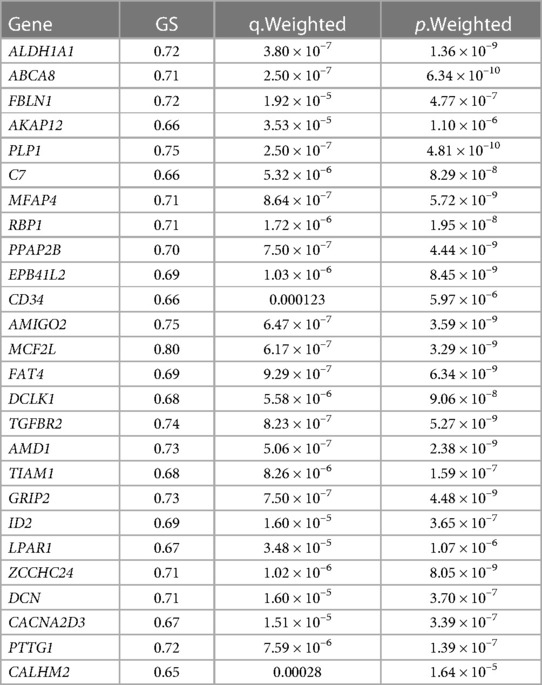
Table 2. Hub genes screened in the pink module.
Network visualization and functional enrichment analysis
The size of the node shape represents the number of edges connected to that node, and the width of the edge represents the weight of the connection between two nodes. GO enrichment analysis was performed on the hub genes in the two modules separately; the respective module genes are shown in Figure 6. The gene functions of the green module were enriched in cyclic adenosine monophosphate (cAMP)-mediated signaling (GO:0019933), activation of protein kinase A activity (GO:0034199), regulation of inflammatory response (GO:0050727), cellular calcium ion homeostasis (GO:0006874), and other biological processes. In addition, the gene functions of the pink module were mainly enriched in the reactive oxygen species (ROS) metabolic process (GO:0072593), Wnt signaling pathway (GO:0060071), aging (GO:0007568), calcium ion transport (GO:0006816), and regulation of mitochondrial membrane potential (GO:0051881).
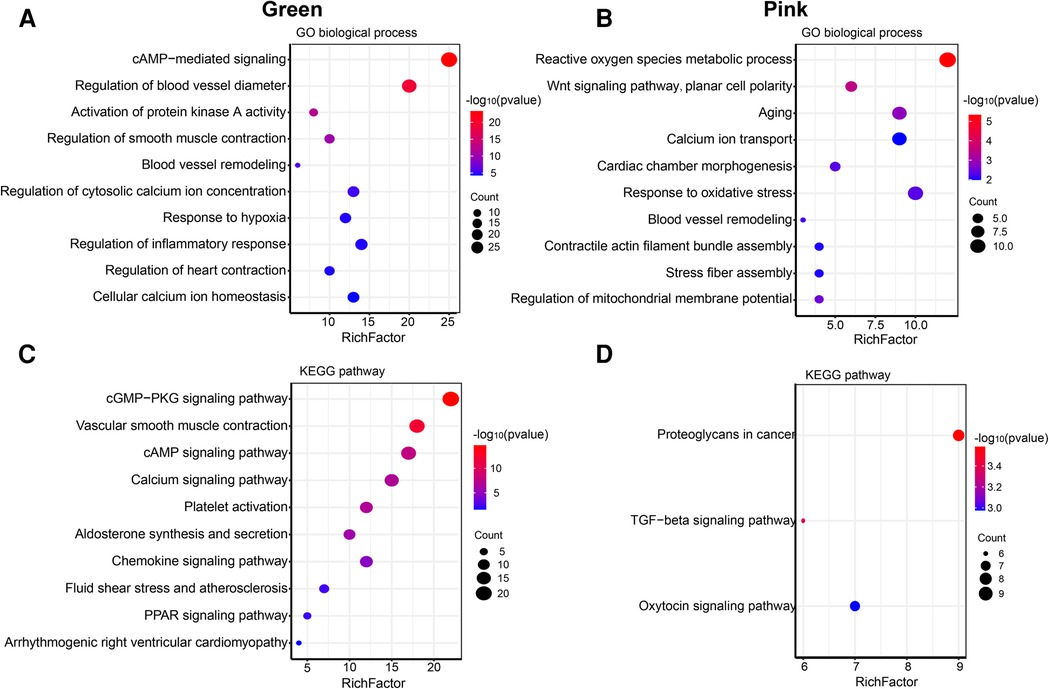
Figure 6. Go and KEGG enrichment analysis of green and pink modules. (A) GO analysis of biological process of green module. (B) GO analysis of biological process of pink module. (C) KEGG pathway analysis of green module. (D) KEGG pathway analysis of pink module. The size of the bras represents the number of genes, and the color of the dots represents the −log10(P) value, the x-axis represents the RichFactor of genes.
The KEGG pathway analysis showed that the green module was mainly enriched in the calcium signaling pathway (hsa04020), cAMP signaling pathway (hsa04024), and peroxisome proliferator-activated receptors (PPAR) signaling pathway (hsa03320). The pink module gene was mainly enriched in the transforming growth factor beta (TGF-β) signaling pathway (hsa04350). The corresponding data are presented in Supplementary Tables S4, S5. The screened hub gene list was inputted into the Cytoscape software. The interaction relationship graph between the co-expression network genes was made according to the weights of the genes, as shown in Figures 7A,B.
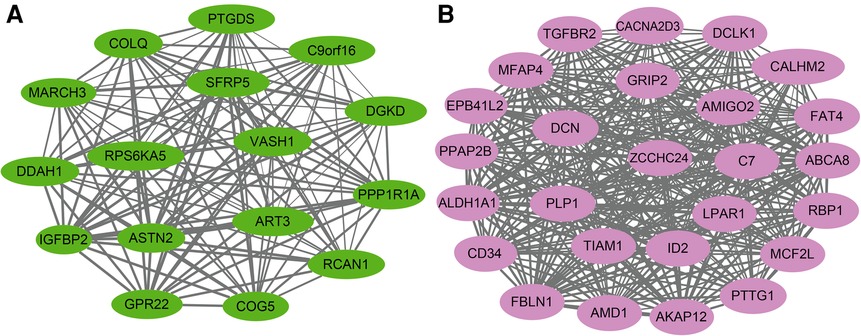
Figure 7. Hub gene map of the green module (A) and pink module (B).
Validation of hub genes in human peripheral blood leukocytes
We performed RT-qPCR to detect gene expression levels in peripheral blood leukocytes collected from elderly AF patients and controls to validate the hub genes further. As shown in Figure 8A, we found that the expression of PTGDS, COLQ, ASTN2, VASH1, and RCAN1 genes from the green module was significantly increased in the AF group compared with those in the control (SR) group. In contrast, the expression of AMIGO2, RBP1, MFAP4, and ALDH1A1 genes in the pink module was decreased in the AF group compared with those in the SR group, suggesting that these genes can potentially be involved in the molecular mechanisms of AF.
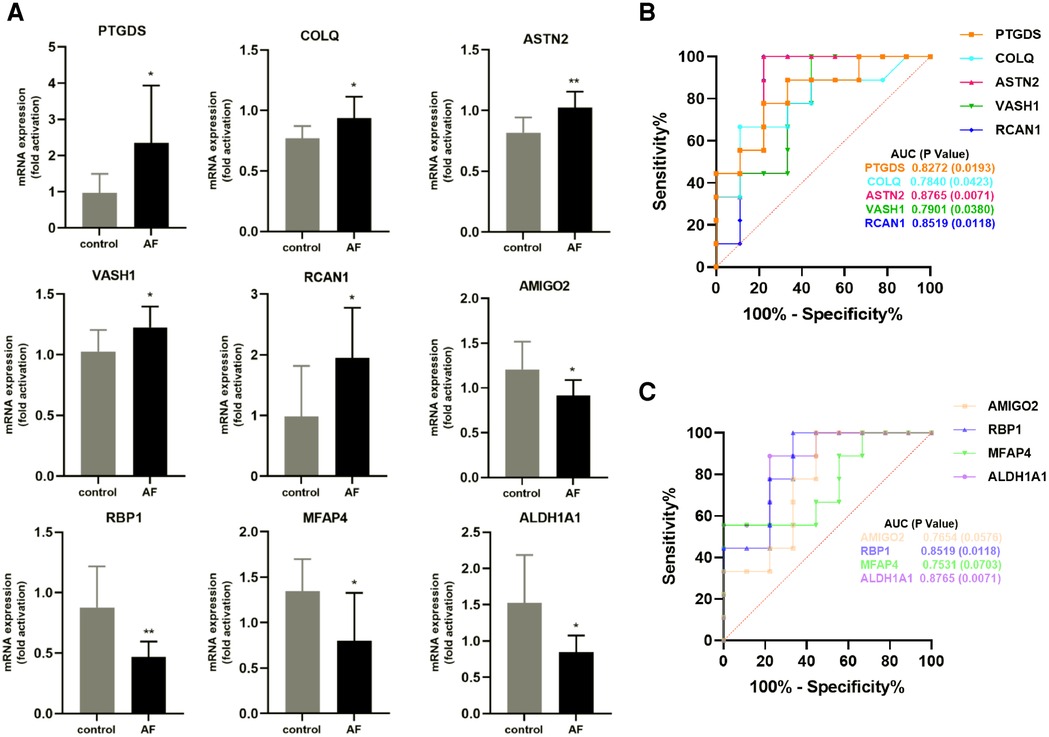
Figure 8. Validation of hub genes in human peripheral blood leukocytes. (A) Relative mRNA expression level of nine hub genes in AF patients and controls (* P < 0.05, **P < 0.01). (B) ROC curve for five hub genes from the green module. (C) ROC curve for four hub genes from the pink module.
Furthermore, based on gene expression levels, receiver operating characteristic (ROC) analysis was used to investigate whether the nine genes could predict AF in the elderly. As shown in Figure 8B, the area under the curve (AUC) and P value of PTGDS, COLQ, ASTN2, VASH1, and RCAN1 from the green module were 0.8272 (0.0193), 0.7840 (0.0423), 0.8765 (0.0071), 0.7901 (0.0380), and 0.8519 (0.0118), respectively. The AUC and P value of AMIGO2, RBP1, MFAP4, and ALDH1A1 in the pink module was 0.7654 (0.0576), 0.8519 (0.0118), 0.7531 (0.0703), and 0.8765 (0.0071), respectively (Figure 8C). These results indicate that the seven genes PTGDS, COLQ, ASTN2, VASH1, RCAN1, RBP1, and ALDH1A1 could be gene markers to differentiate AF patients and controls.
Discussion
AF results from multiple factors; thus, its mechanism is complex. Genetic factors, advanced age, hypertension, and diabetes can cause metabolic, electrical, and structural remodeling of the myocardium, eventually leading to AF (7, 8, 19, 20). Aging is an important risk factor for AF, and most patients with AF are elderly (2). The mechanisms and factors that predispose the development, progression, and regression during aging need to be urgently investigated. The study of aging-related factors and the occurrence of AF has an important role in revealing the pathogenesis of AF and providing a theoretical and experimental basis for the early diagnosis and targeted intervention of AF, which is of great importance.
The traditional gene-level analysis focuses more on strong-effect genes. However, it is challenging to find weak-effect genes. The systematic mining idea of WGCNA is a good complement to the analysis of weak-effect genes. WGCNA strengthens the correlations of strongly-correlated genes after power function treatment. In contrast, the correlations of weakly-correlated genes weaken significantly after power function treatment, thus making the network relationships obey an approximate scale-free network distribution (10, 21). Compared with conventional clustering methods, scale-free network distribution is more characteristic of biological data and can effectively restore the role of genes in biological processes. Therefore, constructing a WGCNA network can help identify and screen important modules and hub genes associated with specific clinical traits.
In this study, RNA-seq datasets downloaded from the GEO were analyzed using WGCNA, identified, and clustered into 19 color modules. The correlation between genes and clinical traits was performed for each module. The green module was most correlated with the AF phenotype, and the pink module was most significantly correlated with the SR phenotype. Finally, 16 hub genes were screened from the green module, and 23 hub genes from the pink module. In line with this finding (2, 22–26), we observed that gene functions were mainly enriched in cAMP-mediated signaling, activation of protein kinase A activity, regulation of inflammatory response, and cellular calcium ion homeostasis in the green module. The pink module gene functions were mainly enriched in the ROS metabolic process, Wnt signaling pathway, aging, calcium ion transport, and regulation of mitochondrial membrane potential. In addition, KEGG pathway analysis showed that the green module gene was mainly enriched in the calcium signaling pathway, cAMP signaling pathway, and PPAR signaling pathway, while the pink module gene was mainly enriched in the TGF-β signaling pathway, suggesting that the main causes of AF were abnormal calcium homeostasis, energy metabolism, and fibrosis, which is consistent with previous studies (7, 8, 19, 20).
We screened 16 hub genes in the green and 23 in the pink modules and validated this finding in peripheral blood leukocytes from elderly AF patients and controls. RT-qPCR showed that PTGDS, COLQ, ASTN2, VASH1, and RCAN1 were highly expressed in the AF group, whereas AMIGO2, RBP1, MFAP4, and ALDH1A1 were highly expressed in the control group. In addition, ROC analysis indicated that seven of these genes have high diagnostic value as biomarkers for AF.
PTGDS, a member of the lipocalin superfamily, plays dual roles in prostaglandin metabolism and lipid transport, which are involved in various cellular processes. PTGDS expression is correlated with advanced tumor stages, metastasis, and poor prognosis (27–29). Mallmann et al. have reported that PTGDS also regulates voltage-gated CaV2.2 Ca2+ channels (30, 31). However, the role of PTGDS in AF has not been investigated.
Studies have shown that mutations in COLQ can lead to congenital myasthenic syndrome (CMS), which causes cardiac autonomic dysfunction (32, 33). Interestingly, Çubukçuoğlu et al. (34) found that the expression of COLQ was higher in degenerative mitral regurgitation patients with AF than in those with SR (P = 0.003), which is consistent with the results of our study.
ASTN2, a large vertebrate-specific transmembrane protein, is primarily expressed in the developing and adult brain, with the highest levels detected in the cerebellum (35, 36). Behesti et al. (37) demonstrated that ASTN2 binds to and regulates the surface expression of multiple synaptic proteins in postmigratory neurons by endocytosis, resulting in the modulation of synaptic activity. In addition, by systematic analysis, Burt et al. (38) found that ASTN2 has pleiotropic effects on cardiometabolic and psychiatric traits. However, ASTN2 role in AF remains unclear.
VASH1 is an endothelium-derived negative feedback regulator of angiogenesis (39). VASH1 is involved in tumorigenesis, atherosclerosis, age-dependent macular degeneration, and diabetic retinopathy (40, 41). Wang et al. (42) reported that the expression of VASH1 increased rapidly in the ischemic myocardium following AMI. However, the role of VASH1 in AF has not been explored.
RCAN1, previously known as DSCR1/MCIP1/Calcipressin-1/Adapt78 in mammals, belongs to a family of endogenous regulators of calcineurin activity (43). RCAN1 has been implicated in maintaining heart function. Mutations in RCAN1 can lead to congenital heart disease (44). In addition, RCAN1 contributes to the maintenance of mitochondrial function and modulates tissue damage during myocardial ischemia-reperfusion (45). Xiao et al. (46) recently reported that RCAN1 might be a novel biomarker for persistent AF.
AMIGO2, a novel member of the gene family encoding type I transmembrane proteins, has been studied in cancer research (47). Ma et al. (48) showed that the loss of AMIGO2 causes dramatic damage to cardiac preservation after ischemic injury. However, the role of AMIGO2 in AF has not been studied.
RBP1, an intracellular chaperone that binds retinol and retinal with high affinity, protects retinoids from non-specific oxidation and delivers retinoids to specific enzymes (49). Yu et al. (50) found that altered RBP1 expression affects epithelial cell retinoic acid, proliferation, and microenvironment. However, its role in AF remains unclear.
MFAP4, also known as MAGP-36 in some species, is produced by vascular smooth muscle cells and is highly enriched in the blood vessels of the heart and lungs, contributing to the structure and function of elastic fibers (51, 52). MFAP4 is involved in cardiac remodeling and its deletion attenuates the progression of angiotensin II-induced atrial fibrosis and AF (53). In addition, MFAP4 is associated with aneurysms and peripheral arterial diseases (54).
ALDH1A1, a member of the ALDH family, is highly expressed by stem cells in cancer (55). Da et al. (56) recently found that ALDH1A1 was associated with cardiac development and protection after MI. However, the role of ALDH1A1 in AF has not been explored.
In summary, WGCNA analysis showed that the green and pink modules were highly relevant to AF. Hub genes screened from the modules, such as PTGDS, COLQ, ASTN2, VASH1, RCAN1, AMIGO2, RBP1, MFAP4, and ALDH1A1, may be involved in the occurrence and progression of AF by regulating biological processes, including calcium homeostasis, energy metabolism, fibrosis, inflammatory response, and mitochondrial function. Experiments using samples of patients further validated the differential expression of hub genes screened by WGCNA analysis in different groups and explored their feasibility as biomarkers of AF. This study also identified six novel AF-related genes not previously reported, such as PTGDS, ASTN2, VASH1, AMIGO2, RBP1, and ALDH1A1, which may be important regulators of AF. However, given the limited samples of vitro experiment in our study, the role of hub genes and mechanisms need to be further identified through in the larger vitro or vivo study(such as heart tissue of AF patients), in order to pave the way for the biomarkers development of AF. In conclusion, our findings provide a theoretical and experimental basis for screening and preventing AF.
Data availability statement
The datasets presented in this study can be found in online repositories. The names of the repository/repositories and accession number(s) can be found in the article/Supplementary Material.
Ethics statement
The studies involving human participants were reviewed and approved by the Human Ethics Review Committee of the Chinese PLA General Hospital. The patients/participants provided their written informed consent to participate in this study.
Author contributions
CL, JW, XW, MZ, and JF: Conceptualization, methodology, research design, writing, and original draft preparation. JZ, JW, MZ, and MY: Bioinformatics data collection and analysis. CL and JZ: preparation of figures. CL and JF: Review, revision, and editing. All authors contributed to the article and approved the submitted version.
Funding
This study was supported by the National Natural Science Foundation of China (82200366, 82270269, 82070447), Beijing Nova Program, and the Open Project of the National Clinical Research Center for Geriatric Diseases, Chinese PLA General Hospital (NCRCG-PLAGH-2022016).
Conflict of interest
The authors declare that the research was conducted in the absence of any commercial or financial relationships that could be construed as a potential conflict of interest.
Publisher's note
All claims expressed in this article are solely those of the authors and do not necessarily represent those of their affiliated organizations, or those of the publisher, the editors and the reviewers. Any product that may be evaluated in this article, or claim that may be made by its manufacturer, is not guaranteed or endorsed by the publisher.
Supplementary material
The Supplementary Material for this article can be found online at: https://www.frontiersin.org/articles/10.3389/fcvm.2023.1118686/full#supplementary-material.
References
1. Kornej J, Börschel CS, Benjamin EJ, Schnabel RB. Epidemiology of atrial fibrillation in the 21st century: novel methods and new insights. Circ Res. (2020) 127(1):4–20. doi: 10.1161/CIRCRESAHA.120.316340
2. Bencivenga L, Komici K, Nocella P, Grieco FV, Spezzano A, Puzone B, et al. Atrial fibrillation in the elderly: a risk factor beyond stroke. Ageing Res Rev. (2020) 61:101092. doi: 10.1016/j.arr.2020.101092
3. Hindricks G, Potpara T, Dagres N, Arbelo E, Bax JJ, Blomström-Lundqvist C, et al. 2020 ESC Guidelines for the diagnosis and management of atrial fibrillation developed in collaboration with the European Association for Cardio-Thoracic Surgery (EACTS): The Task Force for the diagnosis and management of atrial fibrillation of the European Society of Cardiology (ESC) Developed with the special contribution of the European Heart Rhythm Association (EHRA) of the ESC. Eur Heart J. (2021) 42(5):373–498. doi: 10.1093/eurheartj/ehaa612
4. Staerk L, Wang B, Preis SR, Larson MG, Lubitz SA, Ellinor PT, et al. Lifetime risk of atrial fibrillation according to optimal, borderline, or elevated levels of risk factors: cohort study based on longitudinal data from the framingham heart study. Br Med J. (2018) 361:k1453. doi: 10.1136/bmj.k1453
5. Xing L, Lin M, Du Z, Jing L, Tian Y, Yan H, et al. Epidemiology of atrial fibrillation in northeast China: a cross-sectional study, 2017–2019. Heart. (2020) 106(8):590–5. doi: 10.1136/heartjnl-2019-315397
6. Gladstone DJ, Wachter R, Schmalstieg-Bahr K, Quinn FR, Hummers E, Ivers N, et al. Screening for atrial fibrillation in the older population: a randomized clinical trial. JAMA Cardiol. (2021) 6(5):558–67. doi: 10.1001/jamacardio.2021.0038
7. Wang B, Lunetta KL, Dupuis J, Lubitz SA, Trinquart L, Yao L, et al. Integrative omics approach to identifying genes associated with atrial fibrillation. Circ Res. (2020) 126(3):350–60. doi: 10.1161/CIRCRESAHA.119.315179
8. Liu Y, Li B, Ma Y, Huang Y, Ouyang F, Liu Q. Mendelian randomization integrating GWAS, eQTL, and mQTL data identified genes pleiotropically associated with atrial fibrillation. Front Cardiovasc Med. (2021) 8:745757. doi: 10.3389/fcvm.2021.745757
9. Miklos GL, Rubin GM. The role of the genome project in determining gene function: insights from model organisms. Cell. (1996) 86(4):521–9. doi: 10.1016/s0092-8674(00)80126-9
10. Langfelder P, Horvath S. WGCNA: an R package for weighted correlation network analysis. BMC Bioinformatics. (2008) 9:559. doi: 10.1186/1471-2105-9-559
11. Niemira M, Collin F, Szalkowska A, Bielska A, Chwialkowska K, Reszec J, et al. Molecular signature of subtypes of non-small-cell lung cancer by large-scale transcriptional profiling: identification of key modules and genes by weighted gene co-expression network analysis (WGCNA). Cancers (Basel). (2019) 12(1):37. doi: 10.3390/cancers12010037
12. Sun H, Yang J, Li X, Lyu Y, Xu Z, He H, et al. Identification of feature genes and pathways for Alzheimer's disease via WGCNA and LASSO regression. Front Comput Neurosci. (2022) 16:1001546. doi: 10.3389/fncom.2022.1001546
13. Radulescu E, Jaffe AE, Straub RE, Chen Q, Shin JH, Hyde TM, et al. Identification and prioritization of gene sets associated with schizophrenia risk by co-expression network analysis in human brain. Mol Psychiatry. (2020) 25(4):791–804. doi: 10.1038/s41380-018-0304-1
14. Brundel BJJM, Ai X, Hills MT, Kuipers MF, Lip GYH, de Groot NMS. Atrial fibrillation. Nat Rev Dis Primers. (2022) 8(1):21. doi: 10.1038/s41572-022-00347-9
15. Moreira LM, Takawale A, Hulsurkar M, Menassa DA, Antanaviciute A, Lahiri SK, et al. Paracrine signalling by cardiac calcitonin controls atrial fibrogenesis and arrhythmia. Nature. (2020) 587(7834):460–5. doi: 10.1038/s41586-020-2890-8
16. Li W, Wang L, Wu Y, Yuan Z, Zhou J. Weighted gene co-expression network analysis to identify key modules and hub genes associated with atrial fibrillation. Int J Mol Med. (2020) 45(2):401–16. doi: 10.3892/ijmm.2019.4416
17. Cui Z, Bhandari R, Lei Q, Lu M, Zhang L, Zhang M, et al. Identification and exploration of novel macrophage M2-related biomarkers and potential therapeutic agents in endometriosis. Front Mol Biosci. (2021) 8:656145. doi: 10.3389/fmolb.2021.656145
18. Jaime-Lara RB, Roy A, Wang Y, Stanfill A, Cashion AK, Joseph PV. Gene co-expression networks are associated with obesity-related traits in kidney transplant recipients. BMC Med Genomics. (2020) 13(1):37. doi: 10.1186/s12920-020-0702-5
19. Lauder L, Mahfoud F, Azizi M, Bhatt DL, Ewen S, Kario K, et al. Hypertension management in patients with cardiovascular comorbidities. Eur Heart J. (2022) 7:ehac395. doi: 10.1093/eurheartj/ehac395
20. Oost LJ, Tack CJ, de Baaij JHF. Hypomagnesemia and cardiovascular risk in type 2 diabetes. Endocr Rev. (2022) 8:bnac028. doi: 10.1210/endrev/bnac028
21. Zeng D, He S, Ma C, Wen Y, Song W, Xu Q, et al. Network-based approach to identify molecular signatures in the brains of depressed suicides. Psychiatry Res. (2020) 294:113513. doi: 10.1016/j.psychres.2020.113513
22. Reinhardt F, Beneke K, Pavlidou NG, Conradi L, Reichenspurner H, Hove-Madsen L, et al. Abnormal calcium handling in atrial fibrillation is linked to changes in cyclic AMP dependent signaling. Cells. (2021) 10(11):3042. doi: 10.3390/cells10113042
23. Gao X, Wu X, Yan J, Zhang J, Zhao W, DeMarco D, et al. Transcriptional regulation of stress kinase JNK2 in pro-arrhythmic CaMKIIδ expression in the aged atrium. Cardiovasc Res. (2018) 114(5):737–46. doi: 10.1093/cvr/cvy011
24. Yang L, Chen Y, Huang W. Hub genes identification, small molecule compounds prediction for atrial fibrillation and diagnostic model construction based on XGBoost algorithm. Front Cardiovasc Med. (2022) 9:920399. doi: 10.3389/fcvm.2022.920399
25. Lv X, Li J, Hu Y, Wang S, Yang C, Li C, et al. Overexpression of miR-27b-3p targeting Wnt3a regulates the signaling pathway of Wnt/β-catenin and attenuates atrial fibrosis in rats with atrial fibrillation. Oxid Med Cell Longev. (2019) 2019:5703764. doi: 10.1155/2019/5703764
26. Mesubi OO, Rokita AG, Abrol N, Wu Y, Chen B, Wang Q, et al. Oxidized CaMKII and O-GlcNAcylation cause increased atrial fibrillation in diabetic mice by distinct mechanisms. J Clin Invest. (2021) 131(2):e95747. doi: 10.1172/JCI95747
27. Hu S, Ren S, Cai Y, Liu J, Han Y, Zhao Y, et al. Glycoprotein PTGDS promotes tumorigenesis of diffuse large B-cell lymphoma by MYH9-mediated regulation of Wnt-β-catenin-STAT3 signaling. Cell Death Differ. (2022) 29(3):642–56. doi: 10.1038/s41418-021-00880-2
28. Nault JC, Couchy G, Caruso S, Meunier L, Caruana L, Letouzé E, et al. Argininosuccinate synthase 1 and periportal gene expression in sonic hedgehog hepatocellular adenomas. Hepatology. (2018) 68(3):964–76. doi: 10.1002/hep.29884
29. Alves MR, Do Amaral NS, Marchi FA, Silva FIB, Da Costa AABA, Carvalho KC, et al. Prostaglandin D2 expression is prognostic in high-grade serous ovarian cancer. Oncol Rep. (2019) 41(4):2254–64. doi: 10.3892/or.2019.6984
30. Mallmann R, Ondacova K, Moravcikova L, Jurkovicova-Tarabova B, Pavlovicova M, Moravcik R, et al. Four novel interaction partners demonstrate diverse modulatory effects on voltage-gated CaV2.2 Ca2+ channels. Pflugers Arch. (2019) 471(6):861–74. doi: 10.1007/s00424-018-02248-x
31. Lacinova L, Mallmann RT, Jurkovičová-Tarabová B, Klugbauer N. Modulation of voltage-gated CaV2.2 Ca2+ channels by newly identified interaction partners. Channels (Austin). (2020) 14(1):380–92. doi: 10.1080/19336950.2020.1831328
32. El Kadiri Y, Ratbi I, Sefiani A, Lyahyai J. Novel copy number variation of COLQ gene in a Moroccan patient with congenital myasthenic syndrome: a case report and review of the literature. BMC Neurol. (2022) 22(1):292. doi: 10.1186/s12883-022-02822-y
33. Luo X, Wang C, Lin L, Yuan F, Wang S, Wang Y, et al. Mechanisms of congenital myasthenia caused by three mutations in the COLQ gene. Front Pediatr. (2021) 9:679342. doi: 10.3389/fped.2021.679342
34. Çubukçuoğlu Deniz G, Durdu S, Doğan Y, Erdemli E, Özdağ H, Akar AR. Molecular signatures of human chronic atrial fibrillation in primary mitral regurgitation. Cardiovasc Ther. (2021) 2021:5516185. doi: 10.1155/2021/5516185
35. Wilson PM, Fryer RH, Fang Y, Hatten ME. Astn2, a novel member of the astrotactin gene family, regulates the trafficking of ASTN1 during glial-guided neuronal migration. J Neurosci. (2010) 30(25):8529–40. doi: 10.1523/JNEUROSCI.0032-10.2010
36. Guo T, Bao A, Xie Y, Qiu J, Piao H. Single-Cell sequencing analysis identified ASTN2 as a migration biomarker in adult glioblastoma. Brain Sci. (2022) 12(11):1472. doi: 10.3390/brainsci12111472
37. Behesti H, Fore TR, Wu P, Horn Z, Leppert M, Hull C, et al. ASTN2 modulates synaptic strength by trafficking and degradation of surface proteins. Proc Natl Acad Sci U S A. (2018) 115(41):E9717–26. doi: 10.1073/pnas.1809382115
38. Burt O, Johnston KJA, Graham N, Cullen B, Lyall DM, Lyall LM, et al. Genetic variation in the ASTN2 locus in cardiovascular, metabolic and psychiatric traits: evidence for pleiotropy rather than shared biology. Genes (Basel). (2021) 12(8):1194. doi: 10.3390/genes12081194
39. Watanabe K, Hasegawa Y, Yamashita H, Shimizu K, Ding Y, Abe M, et al. Vasohibin as an endothelium-derived negative feedback regulator of angiogenesis. J Clin Invest. (2004) 114(7):898–907. doi: 10.1172/JCI21152
40. Takahashi Y, Saga Y, Koyanagi T, Takei Y, Machida S, Taneichi A, et al. The angiogenesis regulator vasohibin-1 inhibits ovarian cancer growth and peritoneal dissemination and prolongs host survival. Int J Oncol. (2015) 47(6):2057–63. doi: 10.3892/ijo.2015.3193
41. de Oliveira MB, Meier K, Jung S, Bartels-Klein E, Coxam B, Geudens I, et al. Vasohibin 1 selectively regulates secondary sprouting and lymphangiogenesis in the zebrafish trunk. Development. (2021) 148(4):dev194993. doi: 10.1242/dev.194993
42. Wang W, Shang W, Zou J, Liu K, Liu M, Qiu X, et al. ZNF667 facilitates angiogenesis after myocardial ischemia through transcriptional regulation of VASH1 and Wnt signaling pathway. Int J Mol Med. (2022) 50(4):129. doi: 10.3892/ijmm.2022.5185
43. Davies KJ, Ermak G, Rothermel BA, Pritchard M, Heitman J, Ahnn J, et al. Renaming the DSCR1/Adapt78 gene family as RCAN: regulators of calcineurin. FASEB J. (2007) 21(12):3023–8. doi: 10.1096/fj.06-7246com
44. Villahoz S, Yunes-Leites PS, Méndez-Barbero N, Urso K, Bonzon-Kulichenko E, Ortega S, et al. Conditional deletion of Rcan1 predisposes to hypertension-mediated intramural hematoma and subsequent aneurysm and aortic rupture. Nat Commun. (2018) 9(1):4795. doi: 10.1038/s41467-018-07071-7
45. Parra V, Altamirano F, Hernández-Fuentes CP, Tong D, Kyrychenko V, Rotter D, et al. Down syndrome critical region 1 gene, Rcan1, helps maintain a more fused mitochondrial network. Circ Res. (2018) 122(6):e20–33. doi: 10.1161/CIRCRESAHA.117.311522
46. Xiao S, Zhou Y, Liu A, Wu Q, Hu Y, Liu J, et al. Uncovering potential novel biomarkers and immune infiltration characteristics in persistent atrial fibrillation using integrated bioinformatics analysis. Math Biosci Eng. (2021) 18(4):4696–712. doi: 10.3934/mbe.2021238
47. Soerjomataram I, Jemal A, Bray F. Global cancer statistics 2020: GLOBOCAN estimates of incidence and mortality worldwide for 36 cancers in 185 countries. CA Cancer J Clin. (2021) 71(3):209–49. doi: 10.3322/caac.21660
48. Ma X, Hu P, Chen H, Fang T. Loss of AMIGO2 causes dramatic damage to cardiac preservation after ischemic injury. Cardiol J. (2019) 26(4):394–404. doi: 10.5603/CJ.a2018.0049
49. Napoli JL. Cellular retinoid binding-proteins, CRBP, CRABP, FABP5: effects on retinoid metabolism, function and related diseases. Pharmacol Ther. (2017) 173:19–33. doi: 10.1016/j.pharmthera.2017.01.004
50. Yu J, Perri M, Jones JW, Pierzchalski K, Ceaicovscaia N, Cione E, et al. Altered RBP1 gene expression impacts epithelial cell retinoic acid, proliferation, and microenvironment. Cells. (2022) 11(5):792. doi: 10.3390/cells11050792
51. Toyoshima T, Ishida T, Nishi N, Kobayashi R, Nakamura T, Itano T. Differential gene expression of 36-kDa microfibril-associated glycoprotein (MAGP-36/MFAP4) in rat organs. Cell Tissue Res. (2008) 332(2):271–8. doi: 10.1007/s00441-008-0587-7
52. Mohammadi A, Sorensen GL, Pilecki B. MFAP4-Mediated effects in elastic fiber homeostasis, integrin signaling and cancer, and its role in teleost fish. Cells. (2022) 11(13):2115. doi: 10.3390/cells11132115
53. Wang H, Liu M, Wang X, Shuai W, Fu H. MFAP4 deletion attenuates the progression of angiotensin II-induced atrial fibrosis and atrial fibrillation. Europace. (2022) 24(2):340–7. doi: 10.1093/europace/euab124
54. Pilecki B, de Carvalho PVSD, Kirketerp-Møller KL, Schlosser A, Kejling K, Dubik M, et al. MFAP4 deficiency attenuates angiotensin II-induced abdominal aortic aneurysm formation through regulation of macrophage infiltration and activity. Front Cardiovasc Med. (2021) 8:764337. doi: 10.3389/fcvm.2021.764337
55. Muralikrishnan V, Fang F, Given TC, Podicheti R, Chtcherbinine M, Metcalfe TX, et al. A novel ALDH1A1 inhibitor blocks platinum-induced senescence and stemness in ovarian cancer. Cancers (Basel). (2022) 14(14):3437. doi: 10.3390/cancers14143437
Keywords: atrial fibrillation, hub genes, weighted gene co-expression network analysis, elderly, biomarkers
Citation: Liu C, Zeng J, Wu J, Wang J, Wang X, Yao M, Zhang M and Fan J (2023) Identification and validation of key genes associated with atrial fibrillation in the elderly. Front. Cardiovasc. Med. 10:1118686. doi: 10.3389/fcvm.2023.1118686
Received: 7 December 2022; Accepted: 2 March 2023;
Published: 29 March 2023.
Edited by:
Dongtak Jeong, Hanyang University-ERICA, Republic of KoreaReviewed by:
Seung Pil Jang, Bethphagen Inc, Republic of KoreaHwan-Cheol Park, Hanyang University Guri Hospital, Republic of Korea
© 2023 Liu, Zeng, Wu, Wang, Wang, Yao, Zhang and Fan. This is an open-access article distributed under the terms of the Creative Commons Attribution License (CC BY). The use, distribution or reproduction in other forums is permitted, provided the original author(s) and the copyright owner(s) are credited and that the original publication in this journal is cited, in accordance with accepted academic practice. No use, distribution or reproduction is permitted which does not comply with these terms.
*Correspondence: Minghua Zhang zmformer@126.com Jiao Fan fanjiao@301hospital.com.cn
†These authors have contributed equally to this work
Specialty Section: This article was submitted to Cardiovascular Genetics and Systems Medicine, a section of the journal Frontiers in Cardiovascular Medicine