Red blood cell distribution width and all-cause mortality in congestive heart failure patients: a retrospective cohort study based on the Mimic-III database
 Xuan Ji
 Weiqi Ke
- 1Department of Traditional Chinese Medicine, The First Affiliated Hospital of Shantou University Medical College, Shantou, China
- 2Department of Anesthesiology, The First Affiliated Hospital of Shantou University Medical College, Shantou, China
Background: The red blood cell distribution width (RDW) is a metric that measures the variation in the size of red blood cells and is presented as the red blood cell volume coefficient of variation. Increased RDW levels are closely linked to an elevated risk of death from congestive heart failure (CHF) and might be a new risk marker for cardiovascular disease. This research sought to evaluate the possible link between RDW levels and all-cause mortality in CHF patients after controlling for other covariates.
Methods: The publicly accessible Mimic-III database served as the source of data for our research. We employed ICU admission scoring systems to gather information on each patient's demographical data, laboratory test results, comorbid conditions, vital signs, and scores. Among CHF patients, the link between baseline RDW levels and short-, medium-, and long-term all-cause mortality was evaluated by Cox proportional hazard analysis, smooth curve fitting, and Kaplan–Meier survival curves.
Results: In total, 4,955 participants were selected for the study with an average age of 72.3 ± 13.5 years (old) and with males accounting for 53.1%. The findings recorded from the fully adjusted Cox proportional hazard model showed that higher RDW was associated with a greater risk of 30-day, 90-day, 365-day, and 4-year all-cause death; the HRs and 95% confidence intervals were 1.11 (1.05, 1.16), 1.09 (1.04, 1.13), 1.10 (1.06, 1.14), and 1.10 (1.06, 1.13), respectively. The results were stable and reliable using subgroup analysis. Smooth curve fitting and the K-M survival curve method further validated our results.
Conclusion: The RDW levels had a u-shaped connection with 30-day mortality. The RDW level was linked to an elevated risk of short-, medium-, and long-term all-cause death among CHF patients.
Introduction
End-stage heart failure is the common terminal phase of the development of most cardiovascular diseases. It is a clinical condition hallmarked by cardiac insufficiency, the activation of the neuroendocrine system, and the abnormal distribution of peripheral blood flow. The early detection and correct diagnosis of Congestive heart failure (CHF) are of great importance for the treatment and prognoses of CHF patients. At present, the diagnosis of CHF is mainly based on echocardiography and patients' chief complaints, while there is no definite index to anticipate the mortality among CHF patients.
The advantage of this measurement method over the traditional method of examining the morphology of red blood cell shape and size heterogeneity on blood smears is that it is highly accurate and objective. In recent years, it has been found that red blood cell distribution width (RDW) levels may be utilized as a biomarker of cardiovascular and cerebrovascular illnesses (HF, coronary artery disease, brain death or pulmonary arterial hypertension, etc.) (1–3), and the RDW level at admission is considerably linked to the occurrence and prognosis of CHF complications (4). Therefore, RDW performs an increasingly instrumental function in the severity and prognosis of CHF patients. For example, compared with the NYHA grading and the left ventricular ejection fraction (LVEF) (5), RDW has a more significant statistical relationship with the CHF patients' prognoses and may be used as a monitoring indicator of CHF progression (6). Previous studies on the link between RDW levels and the prognoses of patients with cardiovascular diseases have been reported (7–9), but the connection between RDW levels and short-, medium-, and long-term death among CHF patients has received less research attention (10, 11). Therefore, this research was designed to examine whether RDW levels were associated with 30-day, 90-day, 365-day, and 4-year all-cause deaths among CHF patients.
Participants and methods
Study design
This study used a retrospective cohort design to investigate the relationship between RDW levels and all-cause mortality in CHF patients. The RDW level acquired at the baseline served as the independent target variable. The dependent variables encompassed the all-cause mortality in the first 30 days, 90 days, 365 days, and 4 years.
Study population
The Multiparameter Intelligent Monitoring in Intensive Care III Version 1.4 (Mimic-III V. 1.4) database was developed by Philips Medical, Beth Israel Deacon Medical Center, and MIT Computational Physiology Laboratory. It is a free and open public database that comprises clinical information from over 50,000 real-world patients hospitalized in the intensive care unit at Beth Israel Deacon Medical Center between 2001 and 2012 (6, 12). On the basis of International Classification of Diseases (ICD-9) codes, we successfully collected data on 8,952 individuals with congestive heart failure utilizing the PostgreSQL Structured Query Language.
Inclusion and exclusion criteria
The following were the requirements for participation: (1) patients with ICD-9 disease codes of 4,280–4,289 and 39,891; and (2) patients with a first admission and those with a first admission to the ICU (n = 8,952). The following were the exclusionary conditions: (1) patients aged <18 years; (2) patients with the length of ICU stay <24 h; (3) patients with leukemia and myelodysplastic syndrome; (4) patients with Dbsource = metavision; and (5) patients with missing baseline RDW values at ICU admission.
Variables
At baseline, we determine the RDW value and set it as a continuous variable in the study (13, 14). The all-cause death over 30 days, 90 days, 365 days, and 4 years was recorded as a dichotomous variable. The Social Security Death Index data were used to acquire information on survival (encompassing survival outcomes and death time).
As a result, the fully adjusted model was developed using the variables below: (1) continuous variables (obtained at baseline): age; heart rate; systolic blood pressure (SBP); temperature; pulse oxygen saturation (SPO2); diastolic blood pressure (DBP); respiratory rate; albumin level; blood urea nitrogen (Bun) level; sodium level; prothrombin time (Pt); platelet level; hemoglobin level; partial thromboplastin time (Ptt); hematocrit level; glucose level; potassium level; creatinine level; bicarbonate level; serum anion gap; red blood cell distribution width (RDW) level; red blood cell (RBC) count; white blood cells (WBC) count; the Simplified Acute Physiology Score II (SAPS II); the Sequential Organ Failure Assessment (SOFA) score; and the Elixhauser-van Walraven Comorbidity Index (EVCI); and (2) categorical variables (obtained at baseline): sex; admission type; insurance type; deficiency anemias; blood loss anemia; coagulopathy; renal failure; hypothyroidism; complicated diabetes; uncomplicated diabetes; peripheral vascular disease; hypertension; liver disease; pulmonary circulation; valvular disease; chronic pulmonary disease; and cardiac arrhythmias.
Statistical analysis
Continuous data are reported as the mean ± standard deviation (SD) (Gaussian distribution), and categorical data are given as percentages and frequencies. To test for differences among various RDW levels (quartiles), we employed the χ2 test (categorical data), the Kruskal–Wallis H test (skewed distribution), or one-way ANOVA (normal distribution). The link between all-cause mortality and RDW was examined by constructing three separate models utilizing multivariate and univariate Cox proportional hazards regression models, including a nonadjusted model (there were no covariates that were corrected.), a minimally adjusted model (sociodemographic characteristic was the only accounted covariate) and a fully adjusted model (adjustments were made to the factors listed in Table 1) (15). The effect sizes were calculated and the 95 percent confidence intervals were determined. Given the widespread presumption that Cox proportional hazards regression model-based approaches are incapable of dealing with nonlinear models, we utilized a Cox proportional hazards regression model incorporating cubic spline functions and smoothing curve fitting to probe into the nonlinear characteristics between RDW and all-cause death (penalized spline method). As soon as we found nonlinearity, we employed a recursive technique to compute the inflection point. Afterward, we used the two sides of the inflection point to design a two-piecewise Cox proportional hazards regression model. The Kaplan–Meier (K-M) technique was utilized to evaluate the differences in the survival rate between each subgroup of patients with RDW values at admission. A stratified Cox proportional hazards regression model was utilized to carry out the subgroup analysis. Continuous data were first transformed to categorical data depending on the clinical threshold or tertile, and thereafter we conducted interaction tests. The likelihood ratio test was executed after the tests for effect modifications of the subgroups markers were completed (16).
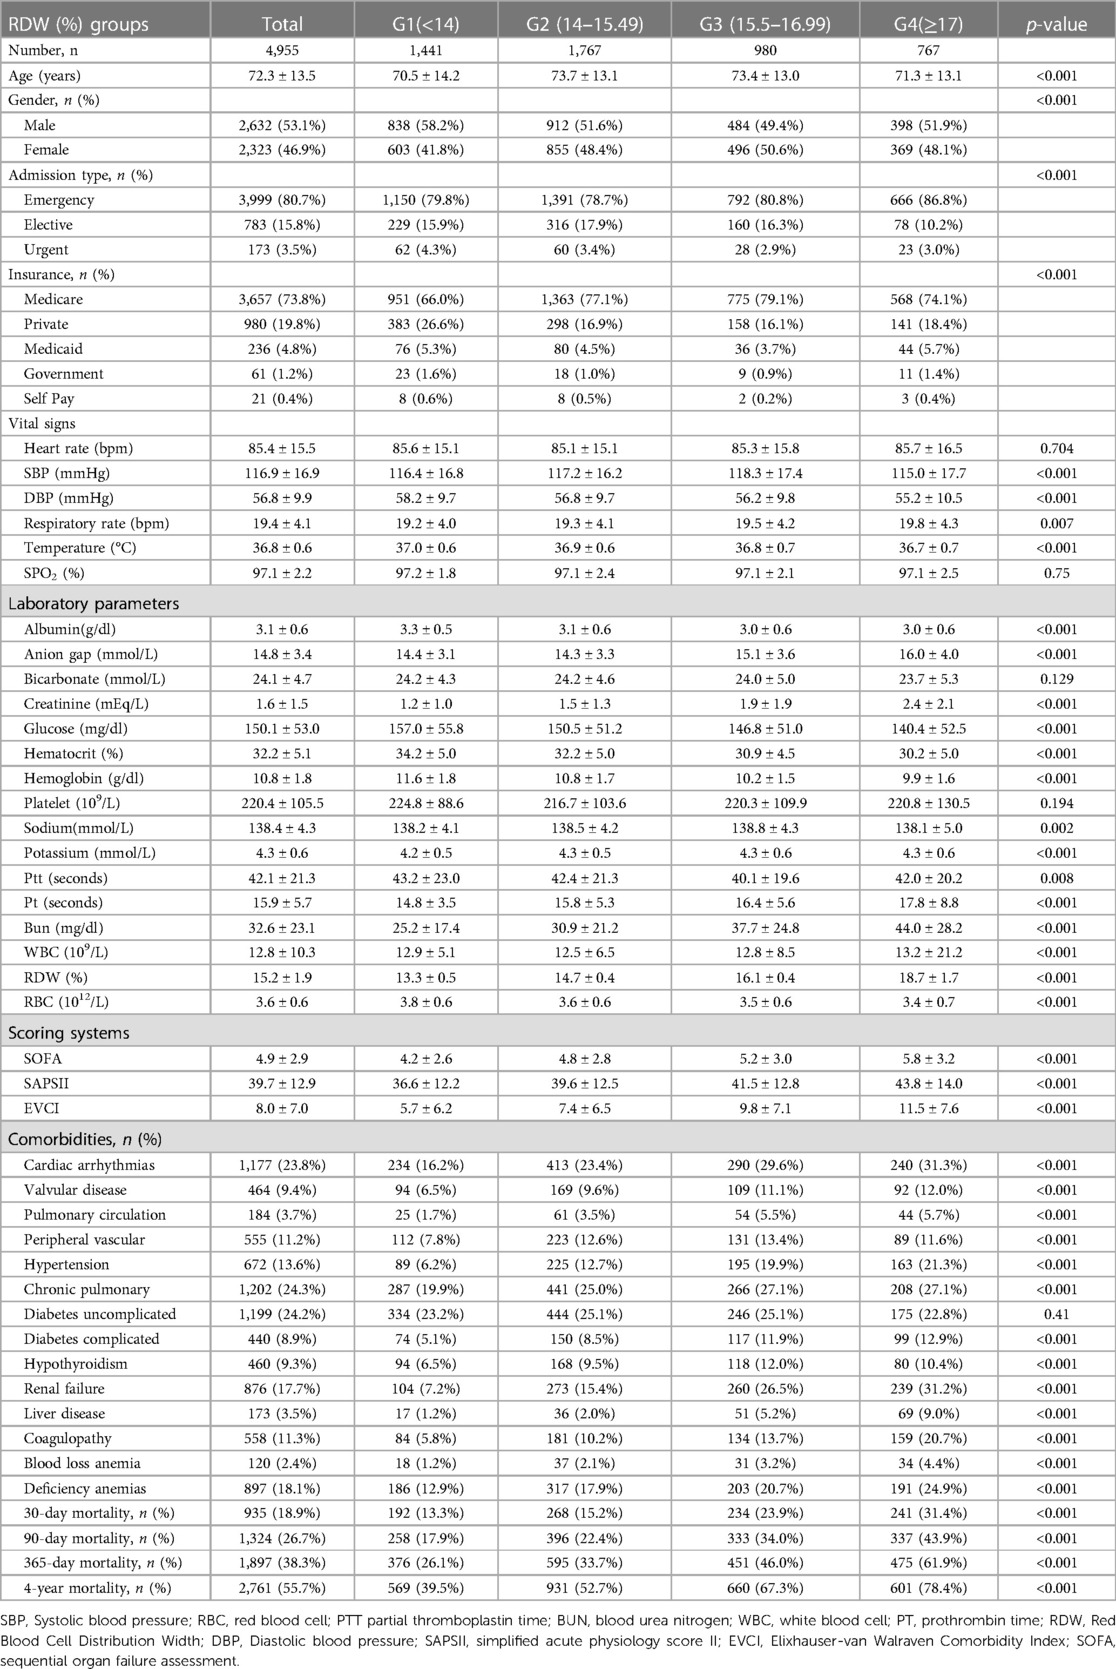
Table 1. Participant's baseline characteristics (N = 4955).
A sensitivity analysis was undertaken to validate our findings' robustness. We transformed RDW into a categorical variable predicated on the clinical cutoff value and computed the P for the pattern to validate the findings obtained when RDW was used as a continuous variable and to investigate the potential of nonlinearity in the distribution.
Statistical testing was accomplished with the help of the statistical software program R (http://www.R-project.org, The R Foundation) and EmpowerStats (http://www. empowerstats.com, X&Y Solutions, Inc., Boston, MA); The statistically significant differences were identified at p < 0.05 (17).
Results
Baseline characteristics
After filtering by eligibility requirements, 4,955 individuals were selected for the final analysis of data (see the flow chart in Figure 1). Table 1 summarizes the baseline features of these selected participants according to the clinical cutoff points of the RDW (%) groups. Males constituted around 53.1 percent of the 4,955 individuals that were selected, with an average age of 72.3 ± 13.5 years. The findings illustrated no statistically significant difference in the heart rate, SPO2, bicarbonate level, platelet level, or uncomplicated diabetes across the distinct RDW (%) groups (all p values >0.05). The subjects within the highest RDW (%) group (RDW ≥ 17%) had elevated values for the respiratory rate, serum anion gap, creatinine, sodium, potassium, Pt, Bun, WBC count, SOFA score, SAPS II score, and EVCI score and consisted of more patients with emergencies, coagulopathy, complicated diabetes, hypertension, pulmonary circulation, renal failure, valvular disease, liver disease, cardiac arrhythmias, blood loss anemia, and deficiency anemias in contrast with those in the other subgroups. Opposite trends were detected for SBP, DBP, temperature, albumin level, bicarbonate level, glucose level, hematocrit level, hemoglobin level, RBC count, and complicated diabetes.
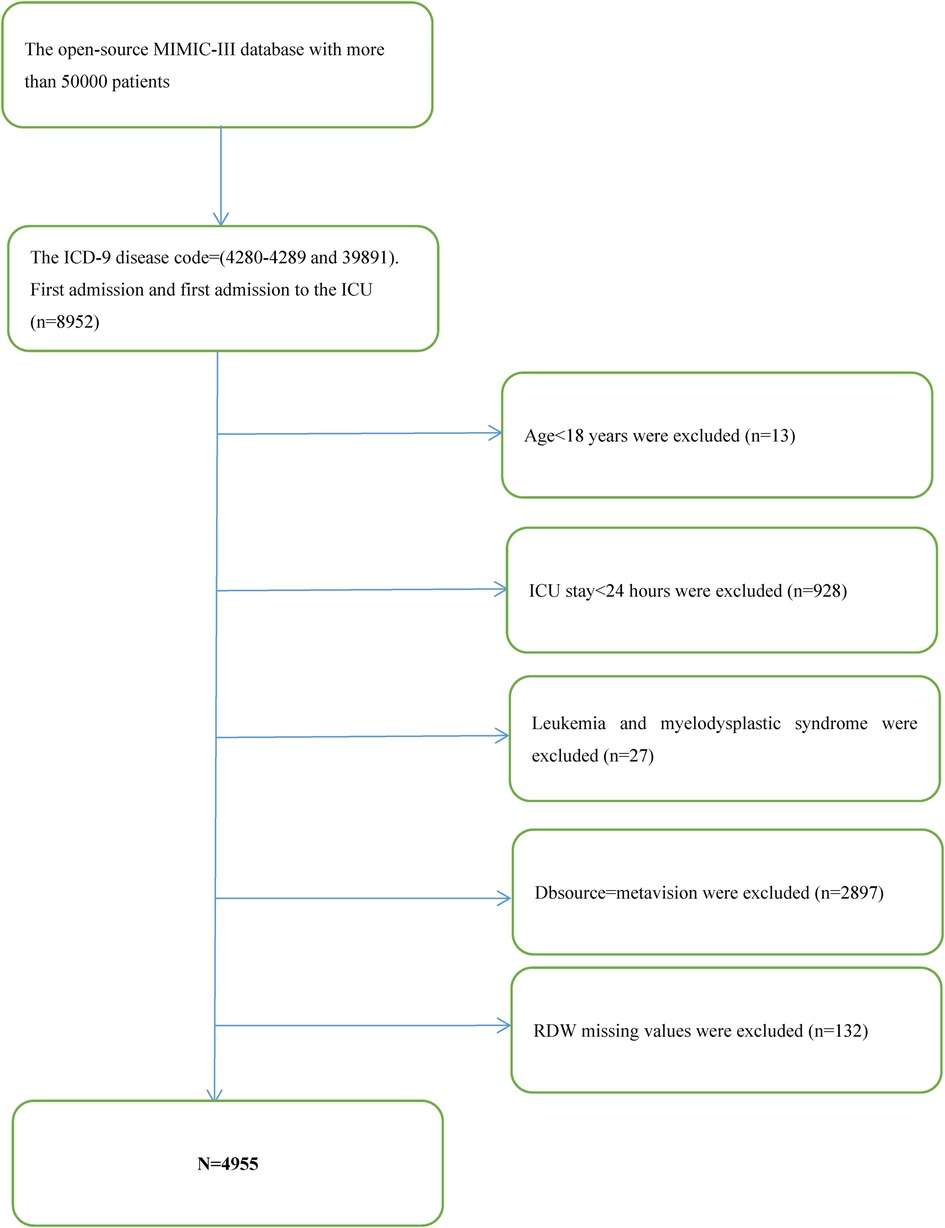
Figure 1. Flowchart of patient selection.
Results of the adjusted and unadjusted Cox proportional hazard models
As part of this investigation, we developed 3 models to evaluate the independent impact of RDW levels on all-cause death (multivariate and univariate Cox proportional hazard models). Table 2 depicts the effect sizes [hazard ratios (HRs)] and 95 percent confidence intervals. As previously stated, the model-based effect size may be defined by the difference between the unit of RDW linked to the risk of mortality in the unadjusted model (Model 1). The effect size of 1.19 for 365-day all-cause death in the unadjusted model implies that the unit difference in RDW is related to a 19-percentage increase in the mortality risk. There was a 19% increase in mortality risk in the minimally-adjusted model (Model 2) due to a change in the RDW unit. A difference in the RDW unit for the fully adjusted model (Model 3) (adjustments were made for all variables displayed in Table 1), was linked to an elevated mortality risk of 10%. To carry out sensitivity analysis, the RDW level from continuous data was transformed into categorical data (clinical cut point for RDW), and the P in the fully adjusted model for the RDW level pattern as a categorical variable was similar to the findings obtained from the RDW level as a continuous variable. Furthermore, we discovered that the effect size pattern in various RDW subgroups was non-equidistant. The findings for all-cause death over 30 days, 90 days, and 4 years were congruent to those of 365-days, which were stable and reliable. Table 2 presents the findings.
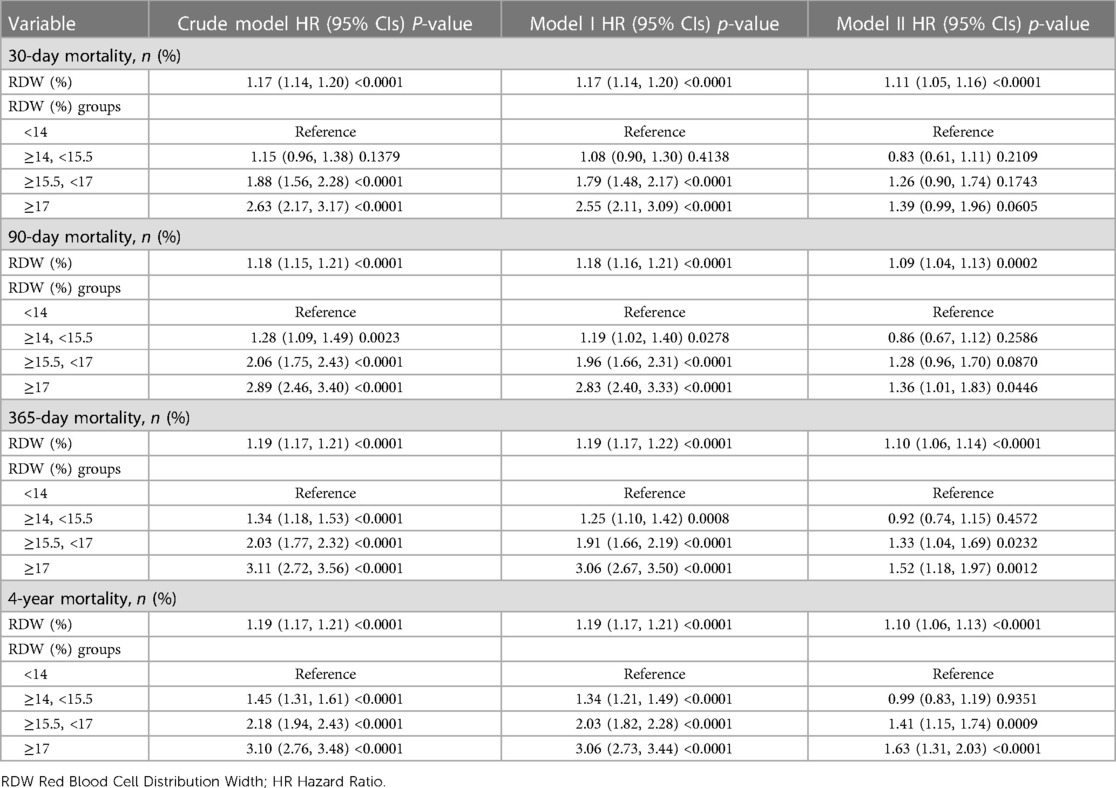
Table 2. Association of RDW with mortality.
The results of nonlinearity of RWD and all-cause mortality
The nonlinear connection between RDW levels and all-cause death was investigated in the current research (Figures 2–5). The smooth curve fitting and the findings reported from the Cox proportional hazards regression model integrating cubic spline functions revealed a nonlinear link between RDW levels following the adjustment of the covariates below: age; potassium level; DBP; platelet level; temperature; hematocrit level; albumin level; creatinine level; bicarbonate level; serum anion gap; SPO2; glucose level; respiratory rate; hemoglobin level; SBP; sodium level; heart rate; Ptt; Pt; Bun level; WBC count; RDW level; RBC count; SOFA score; SAPS II score; EVCI score; sex; admission type; insurance type; deficiency anemias; peripheral vascular disease; coagulopathy; complicated diabetes; uncomplicated diabetes; hypothyroidism; chronic pulmonary disease; renal failure; hypertension; liver disease; pulmonary circulation; blood loss anemia; valvular disease; and cardiac arrhythmias. To fit the relationship, we utilized the two-piecewise Cox proportional hazard model and the Cox proportional hazard model. Based on the p-value obtained from the log-likelihood ratio test, we determined the best-suited model. We found a U-shaped relationship between RDW values and 30-day mortality in our study population (as shown in Figure 2); a positive correlation between RDW and 90-day mortality for RDW values higher than 15.5% (as shown in Figure 3); and a significant positive correlation between RDW and 365-day and 4-year mortality, with higher values of RDW as mortality also increased (as shown in Figures 4, 5). What's more, the largest difference in all-cause mortality between the groups occurred in the first few days of follow-up. Over time, the curves for each group became more parallel.
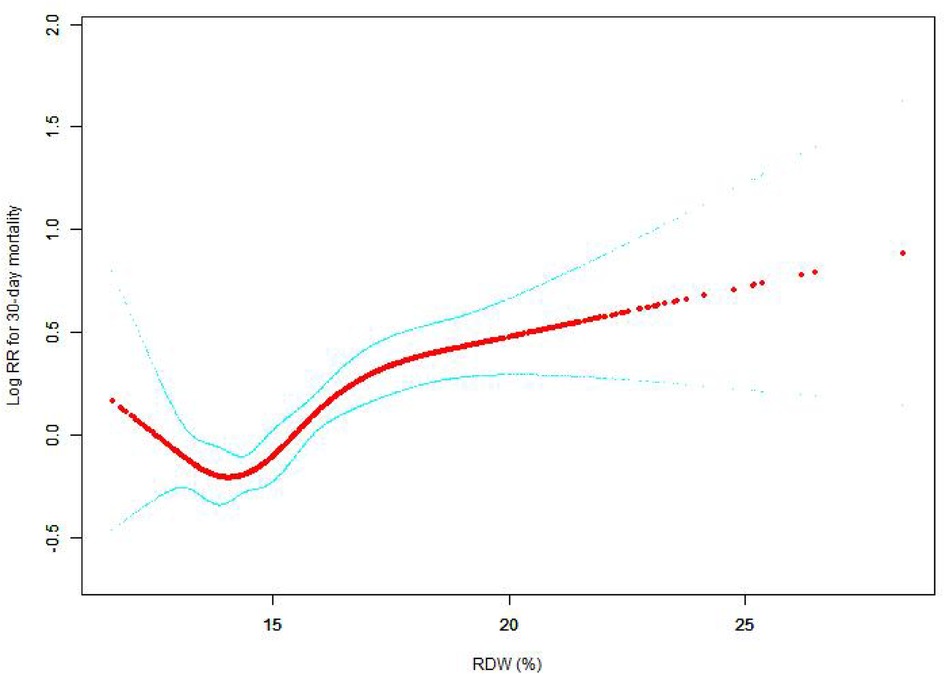
Figure 2. Association between RDW and 30-day all-cause mortality. A generalized additive model (GAM) revealed a threshold, nonlinear relationship between RDW and 30-day all-cause death. The smooth curve fit between variables is shown by a solid red line. The 95 percent confidence interval from the fit is represented by imaginary lines.
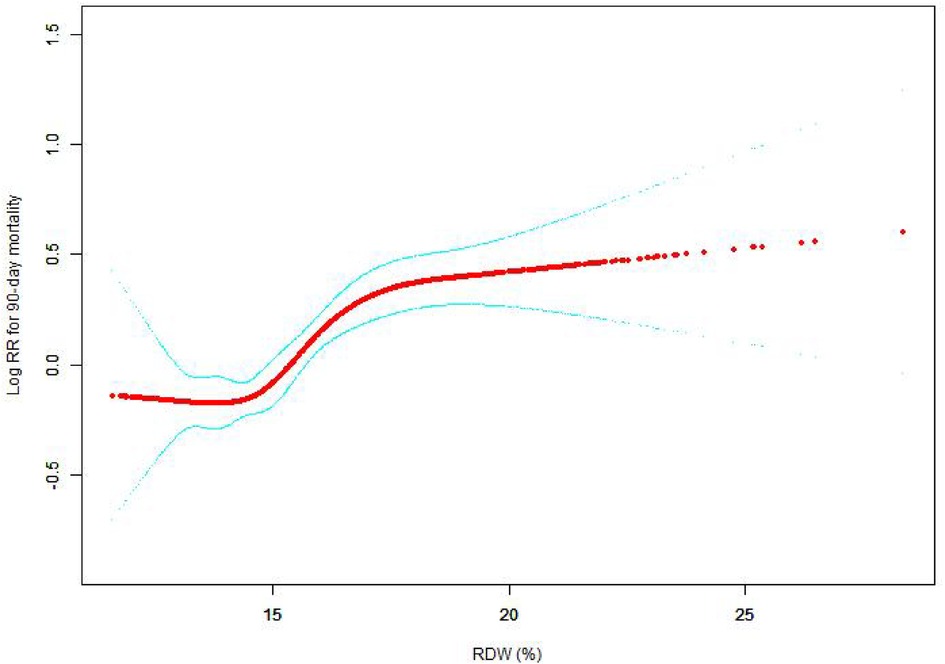
Figure 3. Association between RDW and 90-day all-cause mortality. A generalized additive model (GAM) revealed a threshold, nonlinear relationship between RDW and 90-day all-cause death. The smooth curve fit between variables is shown by a solid red line. The 95 percent confidence interval from the fit is represented by imaginary lines.
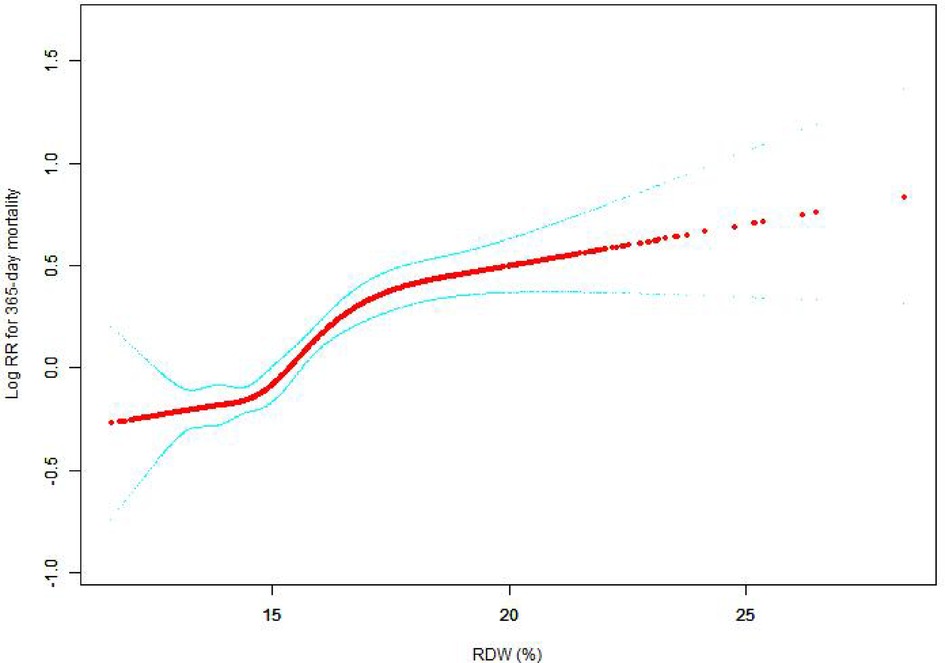
Figure 4. Association between RDW and 365-day all-cause mortality. A generalized additive model (GAM) revealed a threshold, nonlinear relationship between RDW and 365-day all-cause death. The smooth curve fit between variables is shown by a solid red line. The 95 percent confidence interval from the fit is represented by imaginary lines.
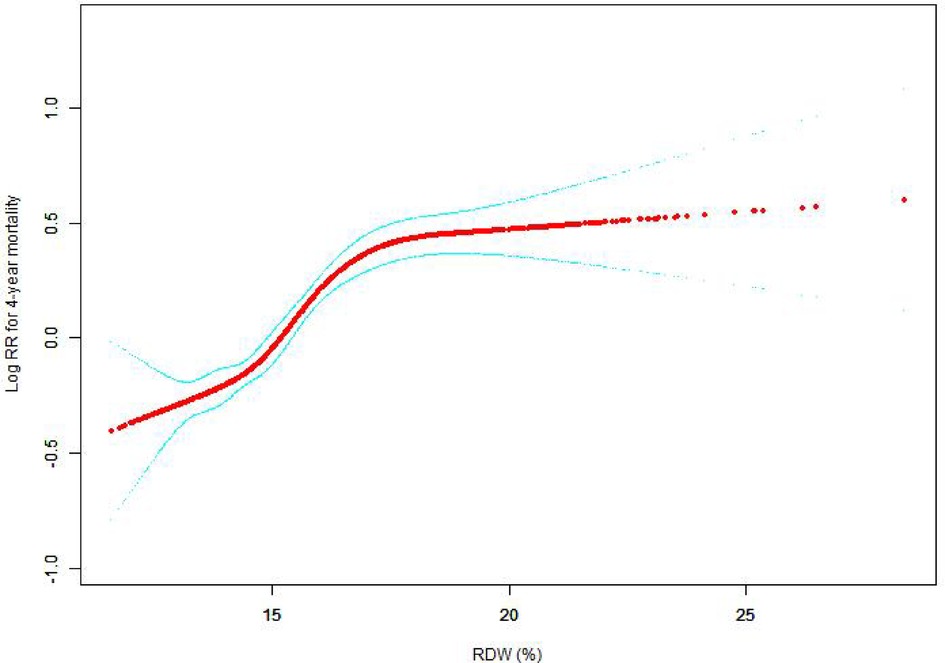
Figure 5. Association between RDW and 4-year all-cause mortality. A generalized additive model (GAM) revealed a threshold, nonlinear relationship between RDW and 4-year all-cause death. The smooth curve fit between variables is shown by a solid red line. The 95 percent confidence interval from the fit is represented by imaginary lines.
Survival status of the patients with different admission RDW levels
We performed Kaplan-Meier survival curves based on RDW groups, with all-cause mortality as the dependent variable for the primary outcome indicator. The K-M survival curve illustrated that the patients' survival time values in each RDW group were G1 > G2 > G3 > G4 at any time within the 4 years (p < 0.0001), as shown in Figure 6. Survival probability of the CHF patients decreases as time increases, and moreover, we found that the group with RDW higher than 17 (G4) group showed the lowest survival probability.
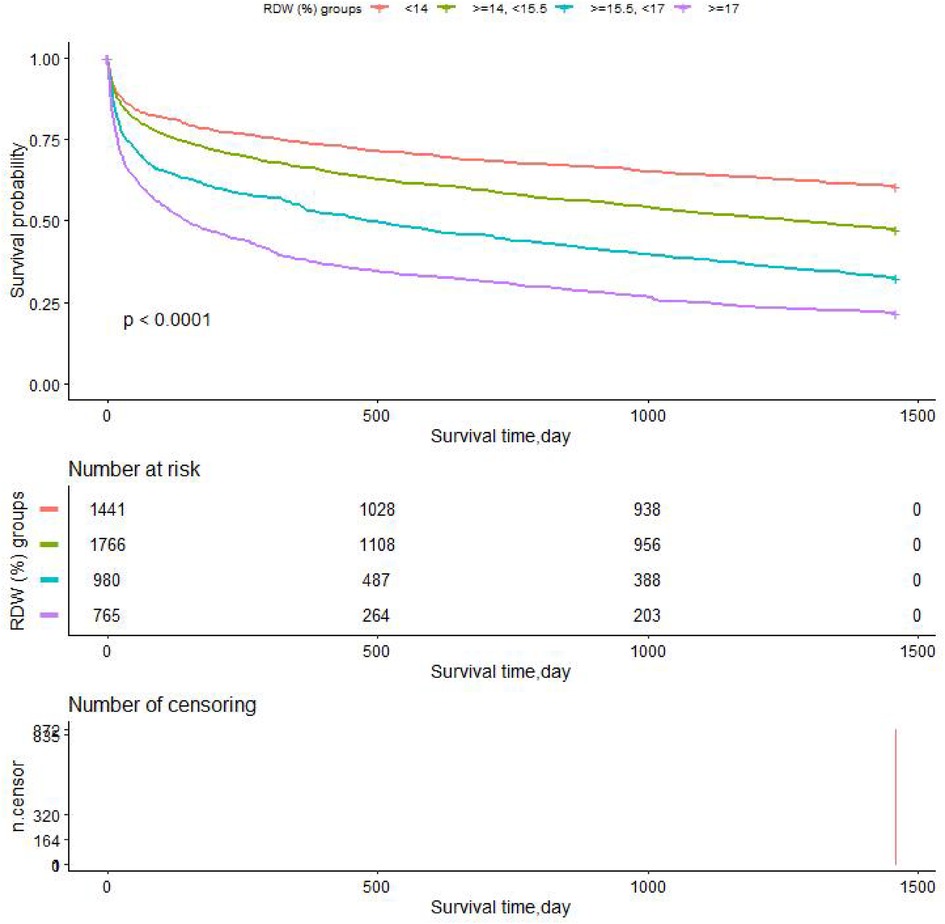
Figure 6. Kaplan-Meier survival curves demonstrating differences in overall survival (years).
Subgroup analysis
We used age (years), sex, admission type, insurance type, SBP (mmHg), respiratory rate (bpm), SPO2 (%), DBP (mmHg), heart rate (bpm), albumin level (mmol/dl), temperature (°C), bicarbonate level (mmol/L), WBC count (109/L), sodium level (mmol/L), platelet level (109/L), creatinine level (mEq/L), potassium level (mmol/L), serum anion gap (mmol/L), Ptt (seconds), Pt (seconds), hematocrit level (%), Bun level (mg/dl), hemoglobin level (g/dl), RBC count (1012/L), glucose level (mg/dl), SOFA score, SAPS II score, EVCI score, blood loss anemia, uncomplicated diabetes, chronic pulmonary disease, complicated diabetes, hypertension, hypothyroidism, peripheral vascular disease, renal failure, pulmonary circulation, liver disease, valvular disease, coagulopathy, cardiac arrhythmias, and deficiency anemias as the stratification parameters to examine the patterns of their effect sizes (Table 3). Depending on a priori specification, only a relatively small number of interactions were discovered.
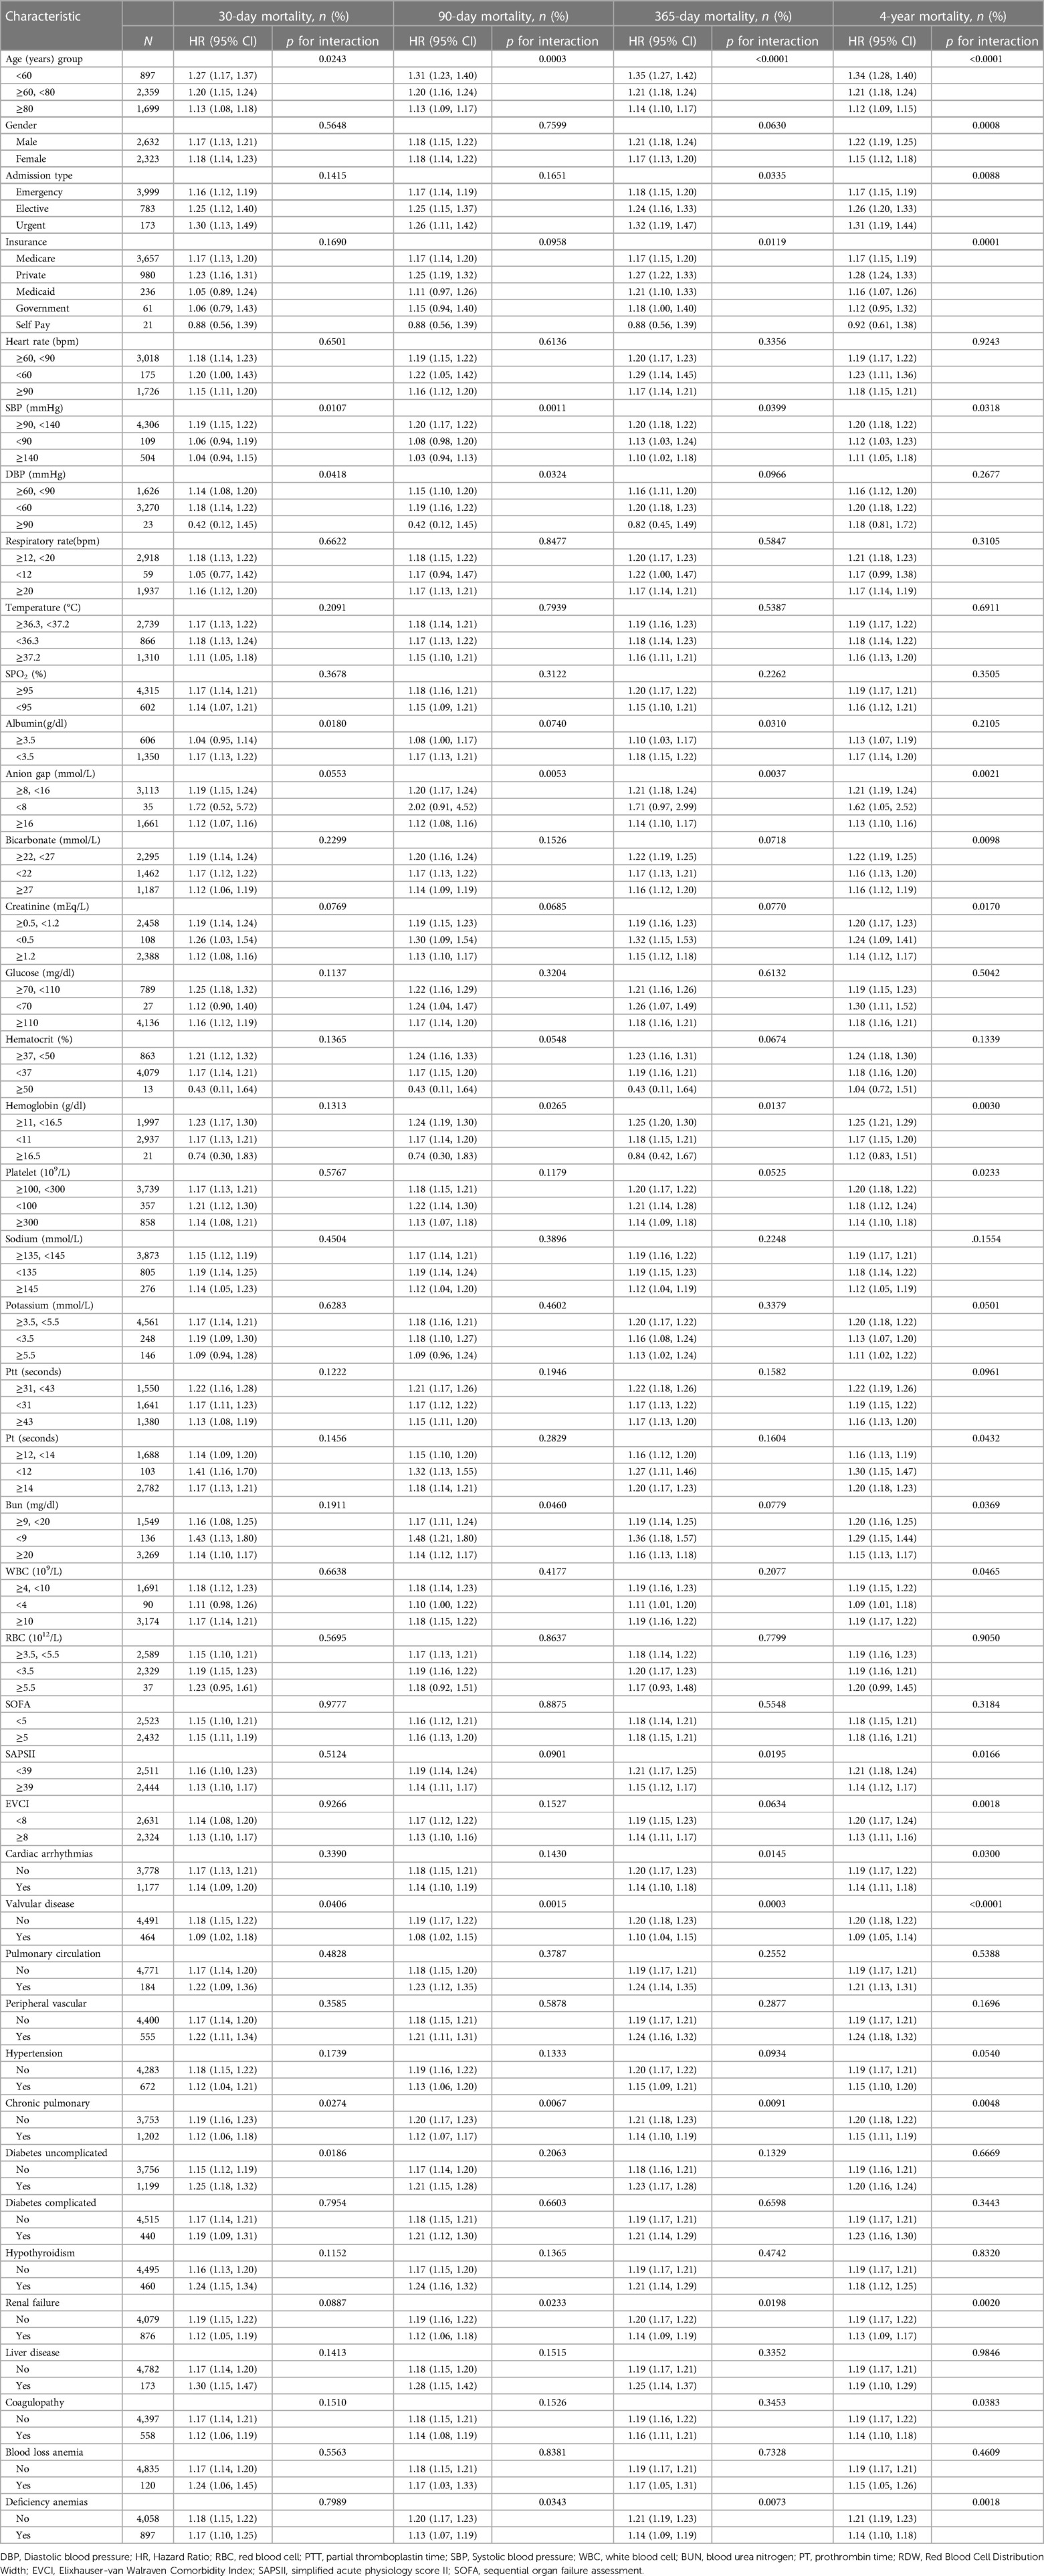
Table 3. Subgroup's RWD effect size on mortality in prespecified and exploratory subgroups.
Our findings are highly dependable and consistent when evaluated both across subgroups and overall. The stratified analysis reveals a near-consensus among the results of nearly every subgroup, with effect values that are statistically significant and a 95 percent confidence interval.
The results of our subgroup analysis on diseases affecting major organs exhibit a remarkable level of uniformity and reliability. Across all variables, there is a direct association between the RDW value and the patient's likelihood of mortality in the short, medium, and long term, with higher RDW values indicating a higher risk of mortality.
Discussion
Individuals suffering from congestive heart failure (CHF) are in the end stages of cardiac disease and have a five-year survival rate equivalent to that of malignant tumor patients (18). For the earlier identification of high-risk patients, appropriate risk stratification is critical. At present, risk stratification for heart failure patients mainly relies on clinical symptoms, imaging, and laboratory tests. The RDW is one of the components of the whole blood cell count, and it represents the degree of variation in red blood cell volume in circulating blood. Research reports have illustrated that RDW is linked to cardiovascular diseases (1, 19, 20), respiratory diseases (2), diabetes (21–23), autoimmune diseases (24), liver cancer (25), stroke (3) and so on. This article mainly introduced the relationship between RDW and CHF.
The normal erythrocyte volume is approximately 80–1,100 fL. Under some physiological conditions (pregnancy, aging, exercise, etc.) or pathological conditions (iron deficiency anemia, hemolytic anemia, etc.), erythrocyte formation is affected, resulting in an uneven erythrocyte volume. Increased RDW levels reflect impaired RBC growth (such as deficiencies in hematopoietic materials including vitamin B12, folic acid, and iron) or increased RBC breakdown (such as after hemolysis and blood transfusions), the iron deficiency and bone marrow distress that is common in heart failure could be associated with the RDW change (26). The high limit for RDW is usually 15.5% and limits greater than 15.5% are considered elevated. In clinical application, RDW combined with MCV is usually utilized for the diagnosis of anemia. For patients with reduced MCV, elevated RDW levels are considered iron deficiency anemia and globulin formation disorder anemia (27).
Any pathological changes that can affect RBC maturation, such as nutrient deficiencies (primarily iron, folic acid, and vitamin B12 deficiencies) and bone marrow suppression, may lead to elevated RDW levels, which are prevalent among heart failure patients and are linked to poor prognosis. Overactivation of the sympathetic nervous system and renin-angiotensin system among heart failure patients may also lead to elevated RDW levels and heterogeneity in RBC volume (28). The volume heterogeneity affects the oxygen-carrying capacity of RBC and further affects the scavenging of free radicals and oxidative stress response (29). In addition, many inflammatory markers associated with heart failure, including the erythrocyte sedimentation rate, hypersensitive C-reactive protein level, or WBC count, are strongly associated with RDW (30).
Elevated RDW levels may lead to tissue hypoperfusion. Several research reports have illustrated that RDW levels are positively linked to central venous pressure and negatively correlated with mixed venous oxygen saturation (31). Low erythropoietin production and decreased serum albumin may be related to the mechanism by which RDW affects the prognoses of heart failure patients.
RDW is economical, quick, and simple to detect and can be combined with other prognostic indicators for more specific risk stratification and early treatment of these patients (32–34).
Multiple research reports have evaluated the link between RDW and the clinical outcomes of cardiovascular events. Remo et al. showed that RDW is a robust indication of poorer long-term outcomes among acute heart failure patients, and its predictive significance is superior compared to other well-established biological markers or risk factors (35). Patients exhibiting greater RDW levels were found to have greater higher Charlson Index scores and more comorbid conditions. This is consistent with our research. Our study showed that high RDW levels correspond to high EVCI scores. Yan Borne et al. illustrated that RDW was linked to the long-term prevalence of first hospital admission in middle-aged individuals with HF (36). Domingo et al. pointed out that elevated RDW level upon discharge was linked to unfavorable long-term outcomes, irrespective of anemia status and levels of hemoglobin (37). Andras et al. found that enhanced RDW levels allowed for an accurate prediction of the long-term death of cardiac resynchronization therapy patients independent of NT-proBNP. RDW enhances risk stratification and might promote accurate patient identification for cardiac resynchronization treatment, according to a reclassification study (38). Muhlestein et al. suggested that greater initial RDW levels during hospitalization for HF were linked to 30-day all-cause readmission, longer length of stay, and 30-day mortality, implying that early-stage RDW levels could assist in personalized treatment and prognosis improvement (39). G. Michael et al. pointed out that RWD was a significant independent biomarker of morbidity and death in two large contemporary heart failure populations. Determining how and why this biomarker is linked to outcomes might reveal new information about the pathophysiology of heart failure (40).
Our findings demonstrated a positive link between RDW and 30-day, 90-day, 365-day, and 4-year all-cause mortality among CHF patients receiving intensive care after adjustment for other covariates. RDW levels had a nonlinear relationship with 30-day, 90-day, 365-day, and 4-year all-cause mortality in CHF patients in critical condition, presenting a U-shaped curve. The greatest benefit was observed in the first 30 days and this benefit was reduced at 90 days, 365 days, and 4 years. Subgroup analysis helped us better understand trends in all-cause mortality and RDW levels in different populations. In a subgroup analysis, we found that RDW levels had less interaction with 30-day, 90-day, 365-day, and 4-year all-cause death in CHF patients in critical condition, and the findings were reliable and stable. The K-M survival curve confirmed our hypothesis that RDW levels were positively correlated with long-, medium-, and short-term all-cause mortality.
The clinical implications of this research include the following: (1) we observed curved relationships between RDW levels and 30-day, 90-day, 365-day, and 4-year all-cause death among CHF patients receiving intensive care; (2) the findings obtained from this research can aid the establishment of diagnostic and prognostic RDW models for CHF patients in the short, medium and long term.
Our study has some advantages. (1) The Mimic-III database is a comprehensive publicly accessible repository with reliable data, numerous covariables, and sufficient adjustment for confounding factors. (2) Our investigation uncovered a significant non-linear association between the red blood cell distribution width and CHF patients, which may has ramifications for the use of illness markers in the future to help with mortality prediction. (3) This study was a real-world study without invasive damage to patients. (4) The independent variables of interest were presented as categorical and continuous variables. This strategy has the potential to decrease data analysis contingencies and improve the outcomes' robustness. (5) The interaction test results obtained for different subgroups in this study could better enable us to conduct data analysis and draw stable conclusions.
This research has some drawbacks as follows: (1) the research object of this study was CHF, so there are some limitations in the generality and extrapolation of this study, and it is not applicable to other patients. (2) The RDW value was recorded for the first time upon patient admission to the ICU without observation of laboratory follow-up data, so the results may be biased. (3) There may be some potential confounding factors that were not included in the laboratory examination on the first day following ICU admission, so our results may also be affected by other confounding factors. For example, NTproBNP and C-reactive protein plasma levels are more powerful prognostic predictors in heart failure patients. However, the data obtained at baseline were largely missing. (4) Erythrocyte transfusion is an important potential confounding factor. However, there was no record of erythrocyte transfusion prior to admission to the hospital or ICU in the Mimic-III V. 1.4 database. (5) Our research was unable to elucidate the underlying mechanisms of RDW and all-cause mortality, which requires further study. (6) We were unable to obtain serum iron ion data for ICU patients, which is an important confounding factor that may have affected our results. We will consider this confounding factor in future studies, highlighting the possible impact of unmeasured factors (e.g., iron deficiency) on our conclusions, in order to improve the design of our study.
Conclusion
Our investigation uncovered a significant non-linear association between the red blood cell distribution width and CHF patients. The RDW levels had a u-shaped connection with 30-day mortality. The RDW level was associated with an elevated risk of long-, medium-, and short-term all-cause death among CHF patients. In conclusion, RDW is an objective marker for determining the severity of HF and anticipating the mortality risk in CHF patients, and it is a convenient, inexpensive, and easy-to-obtain effective indicator.
Data availability statement
Publicly available datasets were analyzed in this study. This data can be found here: The datasets used in this investigation may be found in the MIMIC-III database (https://mimic.mit.edu/).
Ethics statement
Ethical review and approval was not required for the study on human participants in accordance with the local legislation and institutional requirements. Written informed consent for participation was not required for this study in accordance with the national legislation and the institutional requirements.
Author contributions
WK was in charge of the research's overall execution and manuscript writing, while XJ was in charge of analyzing the data. All authors contributed to the article and approved the submitted version.
Acknowledgments
We thank Linlin Jiang and Xinglin Chen who offered instruction in the data analysis process.
Conflict of interest
The authors declare that the research was conducted in the absence of any commercial or financial relationships that could be construed as a potential conflict of interest.
Publisher's note
All claims expressed in this article are solely those of the authors and do not necessarily represent those of their affiliated organizations, or those of the publisher, the editors and the reviewers. Any product that may be evaluated in this article, or claim that may be made by its manufacturer, is not guaranteed or endorsed by the publisher.
References
1. Danese E, Lippi G, Montagnana M. Red blood cell distribution width and cardiovascular diseases. J Thorac Dis. (2015) 7:E402–11. doi: 10.3978/j.issn.2072-1439.2015.10.04
2. Nathan SD, Reffett T, Brown AW, Fischer CP, Shlobin OA, Ahmad S, et al. The red cell distribution width as a prognostic indicator in idiopathic pulmonary fibrosis. Chest. (2013) 143:1692–8. doi: 10.1378/chest.12-1368
3. Kim J, Kim YD, Song TJ, Park JH, Lee HS, Nam CM, et al. Red blood cell distribution width is associated with poor clinical outcome in acute cerebral infarction. Thromb Haemost. (2012) 108:349–56. doi: 10.1160/TH12-03-0165
4. Huang YL, Hu ZD, Liu SJ, Sun Y, Qin Q, Qin BD, et al. Prognostic value of red blood cell distribution width for patients with heart failure: a systematic review and meta-analysis of cohort studies. PLoS One. (2014) 9:e104861. doi: 10.1371/journal.pone.0104861
5. Sotiropoulos K, Yerly P, Monney P, Garnier A, Regamey J, Hugli O, et al. Red cell distribution width and mortality in acute heart failure patients with preserved and reduced ejection fraction. Esc Heart Fail. (2016) 3:198–204. doi: 10.1002/ehf2.12091
6. Kawasoe S, Kubozono T, Ojima S, Miyata M, Ohishi M. Combined assessment of the red cell distribution width and b-type natriuretic peptide: a more useful prognostic marker of cardiovascular mortality in heart failure patients. Intern Med. (2018) 57:1681–8. doi: 10.2169/internalmedicine.9846-17
7. Uemura Y, Shibata R, Takemoto K, Uchikawa T, Koyasu M, Watanabe H, et al. Elevation of red blood cell distribution width during hospitalization predicts mortality in patients with acute decompensated heart failure. J Cardiol. (2016) 67:268–73. doi: 10.1016/j.jjcc.2015.05.011
8. Aung N, Ling HZ, Cheng AS, Aggarwal S, Flint J, Mendonca M, et al. Expansion of the red cell distribution width and evolving iron deficiency as predictors of poor outcome in chronic heart failure. Int J Cardiol. (2013) 168:1997–2002. doi: 10.1016/j.ijcard.2012.12.091
9. Nakashima K, Ohgami E, Kato K, Yoshitomi S, Maruyama T, Harada M. Prognostic significance of red cell distribution width in hospitalized older patients with heart failure or infection. Geriatr Gerontol Int. (2019) 19:988–92. doi: 10.1111/ggi.13755
10. Zalawadiya SK, Zmily H, Farah J, Daifallah S, Ali O, Ghali JK. Red cell distribution width and mortality in predominantly African-American population with decompensated heart failure. J Card Fail. (2011) 17:292–8. doi: 10.1016/j.cardfail.2010.11.006
11. Dai Y, Konishi H, Takagi A, Miyauchi K, Daida H. Red cell distribution width predicts short- and long-term outcomes of acute congestive heart failure more effectively than hemoglobin. Exp Ther Med. (2014) 8:600–6. doi: 10.3892/etm.2014.1755
12. Johnson AEW, Pollard TJ, Shen L, Lehman LH, Feng M, Ghassemi M, et al. MIMIC-III, a freely accessible critical care database. Sci Data. (2016) 3:160035. doi: 10.1038/sdata.2016.35
13. Peng S, Li W, Ke W. Association between red blood cell distribution width and all-cause mortality in unselected critically ill patients: analysis of the mimic-iii database. Front Med (Lausanne). (2023) 10:1152058. doi: 10.3389/fmed.2023.1152058
14. Vashistha T, Streja E, Molnar MZ, Rhee CM, Moradi H, Soohoo M, et al. Red cell distribution width and mortality in hemodialysis patients. Am J Kidney Dis. (2016) 68:110–21. doi: 10.1053/j.ajkd.2015.11.020
15. Feng QT, Chen C, Yu QY, Chen SY, Huang X, Zhong YL, et al. The benefits of higher lmr for early threatened abortion: a retrospective cohort study. PLoS One. (2020) 15:e231642. doi: 10.1371/journal.pone.0231642
16. Research article triglyceride/high-density lipoprotein cholesterol ratio is associated with in-hospital mortality in acute type b aortic dissection. doi: 10.1155/2020/5419846
17. Li F, Xu M, Fan Y, Wang Y, Song Y, Cui X, et al. Diffuse myocardial fibrosis and the prognosis of heart failure with reduced ejection fraction in Chinese patients: a cohort study. Int J Cardiovasc Imaging. (2020) 36:671–89. doi: 10.1007/s10554-019-01752-0
18. Fonarow GC, Bui AL, Horwich TB. Epidemiology and risk profile of heart failure. Nat Rev Cardiol. (2011) 8:30–41. doi: 10.1038/nrcardio.2010.165
19. Guray Y, Ipek EG, Guray U, Demirkan B, Kafes H, Asarcikli LD, et al. Red cell distribution width predicts mortality in infective endocarditis. Arch Cardiovasc Dis. (2014) 107:299–307. doi: 10.1016/j.acvd.2014.04.008
20. Parizadeh SM, Jafarzadeh Esfehani R, Bahreyni A, Ghandehari M, Shafiee M, Rahmani F, et al. The diagnostic and prognostic value of red cell distribution width in cardiovascular disease; current status and prospective. BioFactors (Oxford). (2019) 45:507–16. doi: 10.1002/biof.1518
21. Malandrino N, Wu WC, Taveira TH, Whitlatch HB, Smith RJ. Association between red blood cell distribution width and macrovascular and microvascular complications in diabetes. Diabetologia. (2012) 55:226–35. doi: 10.1007/s00125-011-2331-1
22. Xanthopoulos A, Giamouzis G, Melidonis A, Kitai T, Paraskevopoulou E, Paraskevopoulou P, et al. Red blood cell distribution width as a prognostic marker in patients with heart failure and diabetes mellitus. Cardiovasc Diabetol. (2017) 16:81. doi: 10.1186/s12933-017-0563-1
23. Zorlu A, Bektasoglu G, Kukul Guven FM, Dogan OT, Gucuk E, Refiker Ege M, et al. Usefulness of admission red cell distribution width as a predictor of early mortality in patients with acute pulmonary embolism. Am J Cardiol. (2012) 109:128–34. doi: 10.1016/j.amjcard.2011.08.015
24. Liu Q, Dang A, Chen B, Lv N, Wang X, Zheng D. The association of red blood cell distribution width with anemia and inflammation in patients with takayasu arteritis. Clin Chim Acta. (2015) 438:205–9. doi: 10.1016/j.cca.2014.08.025
25. Hu Z, Sun Y, Wang Q, Han Z, Huang Y, Liu X, et al. Red blood cell distribution width is a potential prognostic index for liver disease. Clin Chem Lab Med. (2013) 51(7):1403–8. doi: 10.1515/cclm-2012-0704
26. Adams KJ, Mehra MR, Oren RM, O’Connor CM, Chiong JR, Ghali JK, et al. Prospective evaluation of the association between cardiac troponin t and markers of disturbed erythropoiesis in patients with heart failure. Am Heart J. (2010) 160:1142–8. doi: 10.1016/j.ahj.2010.07.033
27. Pascual-Figal DA, Bonaque JC, Manzano-Fernandez S, Fernandez A, Garrido IP, Pastor-Perez F, et al. Red blood cell distribution width predicts new-onset anemia in heart failure patients. Int J Cardiol. (2012) 160:196–200. doi: 10.1016/j.ijcard.2011.04.018
28. Park TS, Zambidis ET. A role for the renin-angiotensin system in hematopoiesis. Haematologica. (2009) 94:745–7. doi: 10.3324/haematol.2009.006965
29. Semba RD, Patel KV, Ferrucci L, Sun K, Roy CN, Guralnik JM, et al. Serum antioxidants and inflammation predict red cell distribution width in older women: the women’s health and aging study i. Clin Nutr. (2010) 29:600–4. doi: 10.1016/j.clnu.2010.03.001
30. Relation between red blood cell distribution width and inflammatory biomarkers in a large cohort of unselected outpatients.
31. Yang H, Liu X, Qu C, Shi S, Liang J, Yang B. Usefulness of red blood cell distribution width to predict heart failure hospitalization in patients with hypertrophic cardiomyopathy. Int Heart J. (2018) 59:779–85. doi: 10.1536/ihj.17-507
32. Al-Najjar Y, Goode KM, Zhang J, Cleland JG, Clark AL. Red cell distribution width: an inexpensive and powerful prognostic marker in heart failure. Eur J Heart Fail. (2009) 11:1155–62. doi: 10.1093/eurjhf/hfp147
33. Sargento L, Simões AV, Longo S, Lousada N, Palma Dos Reis R. Red blood cell distribution width is a survival predictor beyond anemia and nt-probnp in stable optimally medicated heart failure with reduced ejection fraction outpatients. Clin Hemorheol Microcirc. (2017) 65:185–94. doi: 10.3233/CH-16155
34. Bazick HS, Chang D, Mahadevappa K, Gibbons FK, Christopher KB. Red cell distribution width and all-cause mortality in critically ill patients*. Crit Care Med. (2011) 39:1913–21. doi: 10.1097/CCM.0b013e31821b85c6
35. Melchio R, Rinaldi G, Testa E, Giraudo A, Serraino C, Bracco C, et al. Red cell distribution width predicts mid-term prognosis in patients hospitalized with acute heart failure: the rdw in acute heart failure (re-ahf) study. Intern Emerg Med. (2019) 14:239–47. doi: 10.1007/s11739-018-1958-z
36. Borne Y, Smith JG, Melander O, Hedblad B, Engstrom G. Red cell distribution width and risk for first hospitalization due to heart failure: a population-based cohort study. Eur J Heart Fail. (2011) 13:1355–61. doi: 10.1093/eurjhf/hfr127
37. Pascual-Figal DA, Bonaque JC, Redondo B, Caro C, Manzano-Fernandez S, Sanchez-Mas J, et al. Red blood cell distribution width predicts long-term outcome regardless of anaemia status in acute heart failure patients. Eur J Heart Fail. (2009) 11:840–6. doi: 10.1093/eurjhf/hfp109
38. Boros AM, Perge P, Jenei Z, Karády J, Zima E, Molnár L, et al. Measurement of the red blood cell distribution width improves the risk prediction in cardiac resynchronization therapy. Dis Markers. (2016) 2016:1–13. doi: 10.1155/2016/7304538
39. Muhlestein JB, Lappe DL, Anderson JL, Muhlestein JB, Budge D, May HT, et al. Both initial red cell distribution width (rdw) and change in rdw during heart failure hospitalization are associated with length of hospital stay and 30-day outcomes. Int J Lab Hematol. (2016) 38:328–37. doi: 10.1111/ijlh.12490
Keywords: congestive heart failure, red blood cell distribution width, all-cause mortality, cox proportional hazards regression, RDW
Citation: Ji X and Ke W (2023) Red blood cell distribution width and all-cause mortality in congestive heart failure patients: a retrospective cohort study based on the Mimic-III database. Front. Cardiovasc. Med. 10:1126718. doi: 10.3389/fcvm.2023.1126718
Received: 13 January 2023; Accepted: 17 April 2023;
Published: 3 May 2023.
Edited by:
Remo Furtado, Brazilian Clinical Research Institute, BrazilReviewed by:
Flavia Bittar Britto Arantes, Universidade Federal de Uberlândia, BrazilFrederico Toledo Campo Dall'Orto, Hospital Maternidade e Pronto Socorro.Santa Lúcia, Brazil
© 2023 Ji and Ke. This is an open-access article distributed under the terms of the Creative Commons Attribution License (CC BY). The use, distribution or reproduction in other forums is permitted, provided the original author(s) and the copyright owner(s) are credited and that the original publication in this journal is cited, in accordance with accepted academic practice. No use, distribution or reproduction is permitted which does not comply with these terms.
*Correspondence: Weiqi Ke wqke2@stu.edu.cn