Evaluation of the relationship between left atrial stiffness, left ventricular stiffness, and left atrioventricular coupling index in type 2 diabetes patients: a speckle tracking echocardiography study
 Hai Nguyen Ngoc Dang
 Thang Viet Luong
 Binh Anh Ho
- 1The Faculty of Medicine, Duy Tan University, Da Nang, Vietnam
- 2Department of Internal Medicine, Hue University of Medicine and Pharmacy, Hue, Vietnam
- 3Cardiovascular Center, Hue Central Hospital, Hue, Vietnam
Background: Cardiovascular complications are a leading cause of mortality and disability in individuals with diabetes mellitus (DM). Moreover, DM can directly impact the structure and function of cardiac muscle. We conducted a study to evaluate cardiac stiffness in DM patients in both the left atrium (LA) and left ventricle (LV), as well as to assess the impact of DM on the synchronization of the LA and LV, particularly within the Vietnamese population, utilizing speckle tracking echocardiography (STE).
Methods: We studied 111 research subjects divided into two groups comprising 52 patients with DM and 59 healthy individuals. All the subjects provided relevant clinical information, and echocardiography was performed to assess the indices of LA stiffness, LV stiffness, and left atrioventricular coupling index (LACI).
Results: Our study indicated that DM patients exhibited greater LA and LV stiffness than control patients. The LACI (%) in the DM group was also greater than that in the control group (17.12% ± 6.72% vs. 12.28% ± 3.96%, respectively; p < 0.001). The LACI was positively correlated with the LA and LV stiffness indices. Decreased levels of LV GLS, adjusted for age, sex, blood pressure, and BMI, have emerged as identified risk factors for DM.
Conclusions: LA stiffness, LV stiffness, and the LACI are greater in DM patients than in normal individuals.
1 Introduction
Diabetes mellitus (DM), particularly type 2 DM, is a prevalent medical condition. As of 2021, approximately 1 in 10 adults worldwide have DM. The global prevalence of DM is on the rise, with an estimated 783.2 million individuals (12.2%) projected to have DM, especially in developing countries such as Vietnam, where the trend is increasing (1).
Cardiovascular complications are a leading cause of mortality and disability in individuals with DM (2). DM increases the risk of cardiovascular diseases such as hypertension, coronary artery disease, and heart failure. Moreover, DM can directly impact the structure and function of cardiac muscle (3, 4). Despite recent advancements, effective therapeutic approaches for DM-related cardiac dysfunction remain limited. Cardiac dysfunction often remains clinically silent in DM patients and is frequently undetected until the later stages of the disease. Even in patients without symptoms, normal blood pressure, and well-controlled DM (5), the silent increase in blood glucose impedes optimal cellular glucose utilization, leading to cardiac fibrosis. Cardiac fibrosis, characterized by increased extracellular matrix proteins, collagen deposition, disruption of cardiac cell order, and restructuring of the cardiac architecture, is a hallmark of DM-related cardiovascular changes (2). Changes in cardiac structure due to DM-related fibrosis are often associated with alterations in myocardial stiffness (6).
Cardiovascular complications in DM patients are typically investigated only after the manifestation of evident heart failure symptoms. With advanced imaging techniques and increasing awareness that heart failure is becoming more prevalent in DM patients, early detection of cardiac fibrotic changes is possible. Cardiac magnetic resonance imaging is widely considered the gold standard for evaluating cardiac function. However, cardiac magnetic resonance imaging is not always readily available, especially in remote or economically disadvantaged areas (7, 8). Similarly, myocardial perfusion imaging in laboratory animals provides high-resolution imaging but is impractical for continuous monitoring in a clinical setting. Recent advancements in echocardiographic imaging techniques, particularly speckle tracking echocardiography (STE), have allowed continuous, detailed, noninvasive, and relatively high-resolution assessments of cardiac function in both clinical and experimental settings, overcoming limitations in time and accessibility (5). Among these newer ultrasound techniques, STE has emerged as a noninvasive biomarker for the early detection of morphological and functional changes in the heart (9).
The stiffness of the left atrium (LA) and left ventricle (LV) has been demonstrated to be a crucial index for assessing and predicting various conditions, such as hypertension, atrial fibrillation, coronary artery disease, and heart failure (10–14). Additionally, the left atrioventricular coupling index (LACI) is considered one of the indices that can predict the likelihood of atrial fibrillation, heart failure, and other cardiovascular events early in life (15–17). Recognizing the significant role of LA stiffness, LV stiffness, and LACI, we hypothesize that DM may influence the stiffness of the LV and LA and the synchronization of the LA and LV in diabetic patients. Therefore, we conducted a study to assess cardiac stiffness in DM patients in both the LV and LA, as well as the impact of DM on the synchronization of the LA and LV, particularly in the Vietnamese population, where there is an increasing trend in DM incidence (1), using STE.
2 Materials and methods
2.1 Study population
A cross-sectional study was conducted at the University Medical Hospital in Hue from February 2022 to October 2023. The study was approved by the Institutional Review Board of Hue University of Medicine and Pharmacy (No: H2022/312). The study participants were adults aged 18 years and older who provided informed consent before enrollment.
We divided the study population into two groups: the type 2 DM group and the healthy control group. The type 2 DM group comprised 52 consenting adults who met the selection criteria and did not meet the exclusion criteria. These patients were diagnosed with diabetes following the guidelines of the American Diabetes Association and the European Association for the Study of Diabetes (18). The exclusion criteria included hypertension, severe valvular heart disease, congenital heart disease, hypertrophic cardiomyopathy, dilated cardiomyopathy, ischaemic heart disease, reduced ejection fraction heart failure, atrial fibrillation, pacemaker implantation, other severe cardiac arrhythmias, severe comorbidities affecting life expectancy, insufficient echocardiographic data, and poor-quality echocardiographic images for analysis. The control group consisted of 59 healthy adults who underwent health screening, had no history of cardiovascular disease or diabetes, and were age-matched to the type 2 DM group.
2.2 Clinical data collection
The clinical data collected included personal and family medical histories and clinical variables obtained through direct interviews and medical records. Patient measurements included height (measured to the nearest 0.1 centimeters), weight (measured to the nearest 0.1 kilograms), and waist circumference (WC) (measured to 0.1 centimeters). Body mass index (BMI) was calculated as weight in kilograms divided by the square of height in meters (19). Body surface area (BSA) was calculated using the formula BSA = (1/6)(Weight*Height)0.5 (20). Blood pressure was determined by the mean of three appropriately sized automated cuff readings taken one minute apart after five minutes of rest. Laboratory data, including glycated haemoglobin (HbA1c) levels, were collected. HbA1c levels were measured using a Roche analyser.
2.3 Transthoracic echocardiogram
We utilized a specialized Affiniti 70 echocardiography machine from Philips Healthcare at the University Medical Hospital in Hue. During the ultrasound procedure, the machine simultaneously recorded the electrocardiogram alongside the echocardiographic images. All echocardiograms included in the final data analysis were performed on patients in normal sinus rhythm. The echocardiographic procedure adhered to the guidelines outlined by the American Society of Echocardiography for performing a comprehensive transthoracic echocardiographic examination in adults (21). These measurements are performed by an echocardiography expert, who is independent of the research team and is unaware of other patient information during processing.
2.4 Speckle tracking echocardiography
During the ultrasound examination, patients were routinely imaged in the apical four-chamber, two-chamber, and three-chamber views. Each image was acquired over two consecutive cardiac cycles and subsequently stored on a USB drive. The speckle tracking analysis of myocardial strain was performed using offline QLAB software version 15.
To assess LV strain, a cardiac cycle was defined from the R wave to the R wave. The selection of end-diastolic and end-systolic frames was based on the closure of the mitral and aortic valves, respectively. At the mitral annulus, two reference points were positioned, and one was placed at the apex. The process involved automated border tracing, with potential manual adjustments if deemed necessary. LV global longitudinal strain (GLS) was then calculated using three apical chamber views. Individuals with compromised image quality, insufficient border tracking, shortened views, or missing images were excluded from the analysis.
LA strain was assessed in both the two-chamber and four-chamber views using reference points beginning at the P wave and R wave in the cardiac cycle. The average strain values were calculated from two references. LA strain measurements were obtained during the reservoir, conduit, and contractile phases of LA function, denoted as the LA strain reservoir function (LASr), LA strain conduit function (LAScd), and LA strain contractile function (LASct), respectively.
The results of the LV and LA strains are conventionally represented as negative values. However, for convenience in analysis and display, we utilized the absolute values of these results. These parameters were measured by an independent echocardiography specialist who was not affiliated with the research team and remained uninformed about other patient details throughout the procedure. The detailed methodology is illustrated in Figure 1.
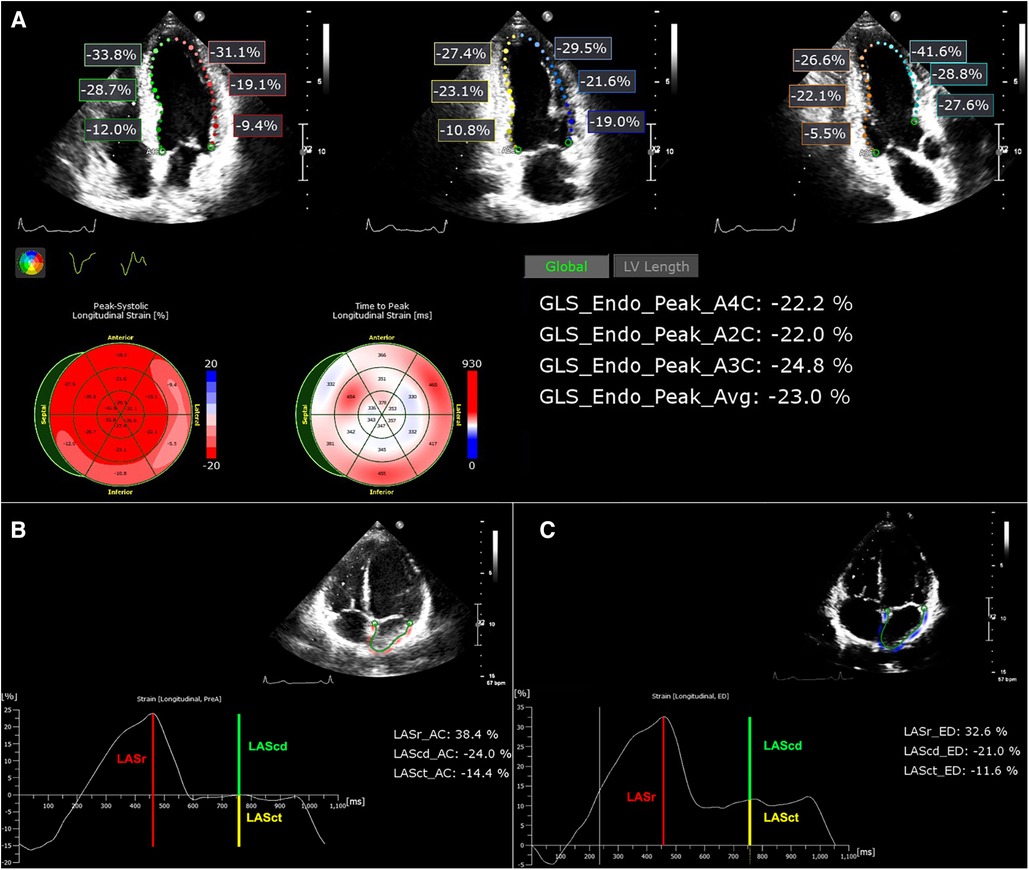
Figure 1. (A) Images of LV strain analysis. The results are displayed with the LV GLS for the apical 4-chamber, 2-chamber, and 3-chamber chambers and their respective averages. (B,C) LA strain images with reference points beginning at the P wave and R wave, respectively.
2.5 Left atrial stiffness
The initial report introducing the concept and validating the noninvasive estimation of LA stiffness was by Kurt et al. (22). The LA stiffness is calculated as the ratio of E/e′ to LASr. This formula has been widely employed in numerous studies to assess LA stiffness (23, 24). The LA filling index is determined by the ratio of the mitral early-diastolic inflow peak velocity (E) to the LASr (E/LASr ratio) (25, 26). Additionally, recent studies have recognized the role of the LAVI/LASr ratio as equivalent to the aforementioned measures (27).
2.6 Left ventricular stiffness
LV stiffness is assessed using several parameters, including diastolic wall strain (DWS), which is calculated as (LV posterior wall thickness at systole—LV posterior wall thickness at diastole)/LV posterior wall thickness at systole (28–30). Additionally, LV stiffness can be evaluated through the ratios of E/e′ to LV end-diastolic volume (LVEDV) and E/LASr to LVEDV (31).
2.7 Left atrioventricular coupling index
The LACI is defined as the ratio between the LA end-diastolic volume (LAEDV) and the LV end-diastolic volume (LVEDV). LA and LV volumes are measured at the same end-diastolic phase defined by the R wave on the ECG. LACI values are expressed as a percentage, where a higher LACI indicates a greater disproportion between LA and LV volumes at the end-diastole, reflecting a more significant impairment of LACI (17). Figure 2 provides an example of how this index is determined. The parameters LVEDV and LAEDV are also measured during the echocardiography process and are measured by an independent echocardiography specialist who is not affiliated with the research team. This specialist remains unaware of any other patient information during the procedure.
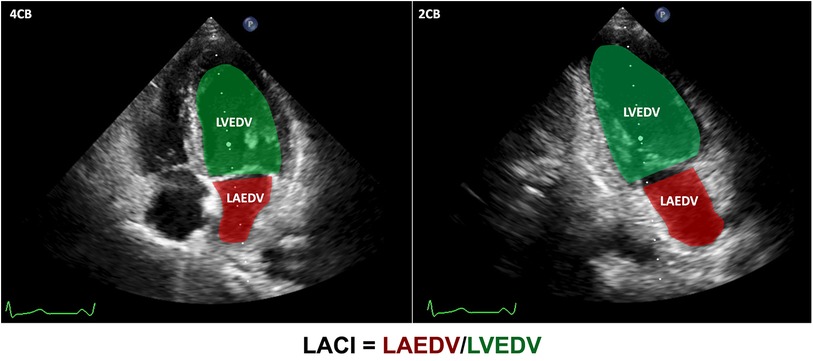
Figure 2. LACI calculation. LVEDV in green and LAEDV in red were measured in both the apical 4-chamber and 2-chamber views during the end-diastolic phase defined by the R wave on the ECG, respectively. Subsequently, the ultrasound machine automatically computed the LVEDV and LAEDV using Simpson's method. The LACI results were calculated using the formula depicted in the figure.
2.8 Statistical analysis
The normality of the data was assessed with the Kolmogorov‒Smirnov test. Normally distributed continuous variables are presented as the means ± standard deviations, while nonnormally distributed variables are expressed as medians with interquartile ranges (IQRs) = 25th–75th percentiles. Baseline characteristics were compared between individuals with type 2 DM and those without type 2 DM. Independent t tests were used for the analysis of continuous variables, and the results are reported as the means ± SDs. The Mann‒Whitney U test was applied for nonnormally distributed variables. Categorical variables are displayed as absolute numbers (percentages) and were compared using the chi-square test.
For the evaluation of LA stiffness, LV stiffness, and LACI between the type 2 DM and non-type 2 DM groups, the independent t test and Mann‒Whitney U test were used for normally and nonnormally distributed continuous variables, respectively. Pearson's correlation coefficient (r) along with its corresponding p value was used for normally distributed variables to elucidate the correlation between continuous variables, while Spearman's correlation coefficient was applied for nonnormally distributed variables. Univariate logistic regression was used to calculate odds ratios (ORs) to predict DM. In multiple logistic regression analysis, all variables with p ≤ 0.05 were included to explore the relevance of DM. All probability values were two-sided, and p values less than 0.05 were considered to indicate statistical significance. SPSS Statistics version 26 (IBM, Armonk, NY, USA) was used for all calculations.
3 Results
3.1 Clinical characteristics of the study groups
In our study, when comparing the DM group and the non-DM group, there were no significant differences in age, sex, BMI, BSA, WC, diastolic blood pressure, or alcohol consumption (p > 0.05). Moreover, the DM group had a duration of diabetes of 6.3 ± 5.4 years, and the average HbA1c concentration was 11.18% ± 2.97%. The detailed parameters are presented in the baseline demographic and clinical features section of Table 1.
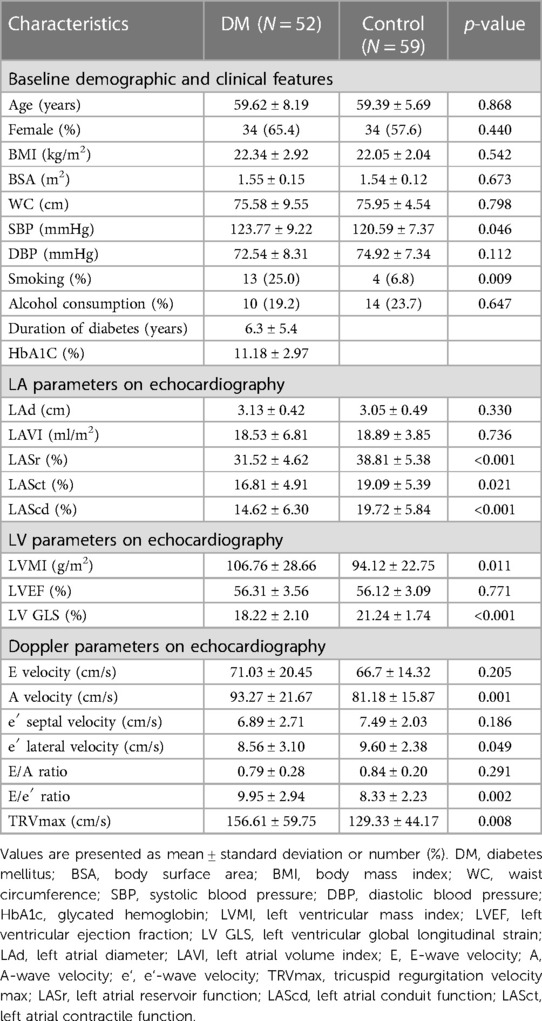
Table 1. Characteristics of DM patients vs. control group.
In the evaluation of LA morphology and functional parameters via echocardiography, we observed that the LASr, LASct, and LAScd indices were significantly lower in the DM group than in the control group. Specifically, the LASr, LASct, and LAScd indices between the DM and control groups were 31.52% ± 4.62% and 38.81% ± 5.38%, 16.81% ± 4.91% and 19.09% ± 5.39%, 14.62% ± 6.3% and 19.72% ± 5.84%, respectively. Details are shown in the LA parameters in the echocardiography section of Table 1.
The LV GLS of the DM group was lower than that of the control group. Conversely, the LVMI in the DM group was greater. This difference was statistically significant. The detailed LV parameters obtained via echocardiography are shown in the LV parameters in the echocardiography section of Table 1.
Doppler echocardiography revealed that the E/e′ ratio in the DM group was significantly greater than that in the control group (p = 0.002). Additionally, other Doppler indices are presented in the Doppler parameters in the echocardiography section of Table 1.
3.2 Comparison of LA stiffness, LV stiffness, and LACI between DM and control groups
Our study revealed greater E/e′/LASr and E/LASr ratios in the DM group than in the control group (32.27% ± 10.79% vs. 22.13% ± 7.81% and 228.23 ± 68.74% vs. 176.40% ± 52.15%, respectively), both with p < 0.001. Similarly, the E/LASr and LVEDV ratios, as well as the E/e′ and LVEDV ratios, were greater in the DM group than in the control group. Additionally, the LACI (%) in the DM group was also greater than that in the control group (17.12% ± 6.72% vs. 12.28% ± 3.96%, respectively; p < 0.001). The details are presented in Table 2 and illustrated in Figure 3.
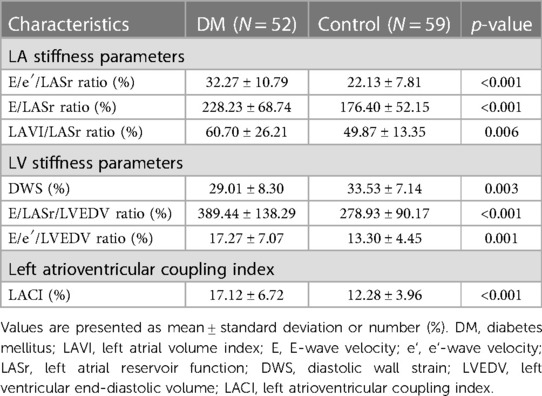
Table 2. Comparison of LA stiffness indicators, LV stiffness indicators, and LACI between DM and control groups.
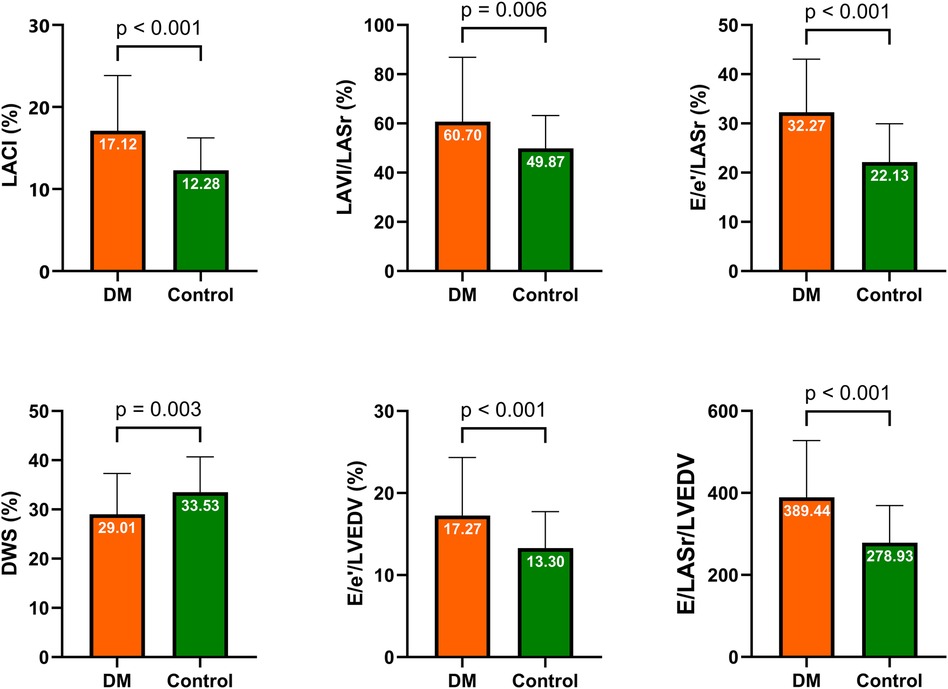
Figure 3. Comparison of LA stiffness indicators, LV stiffness indicators, and LACI between the DM and control groups. DM, diabetes mellitus; LA, left atrium; LV, left ventricular; LACI, left atrioventricular coupling index; DWS, diastolic wall strain.
3.3 Correlation analysis of ultrasound parameters in DM patients
The correlations among LA stiffness indicators, LV stiffness indicators, LACI, and LA and LV parameters in patients with DM are illustrated in Figure 4. A positive correlation was observed between E/LASr/LVEDV and E/e′/LASr (r = 0.45, p = 0.001). The E/LASr showed positive correlations with the E/A ratio (r = 0.42, p = 0.002), E/e′ ratio (r = 0.45, p = 0.001), and LV volume index (LAVI) (r = 0.49, p < 0.001). The LACI was positively correlated with the LAVI (r = 0.55, p < 0.001). The LACI is also positively correlated with indices of LA and LV stiffness. Additionally, the duration of diabetes mellitus (DM) is positively correlated with both E/e′/LASr and LAVI/LASr. Further details on the specific correlation coefficients can be found in the heatmap (Figure 4).
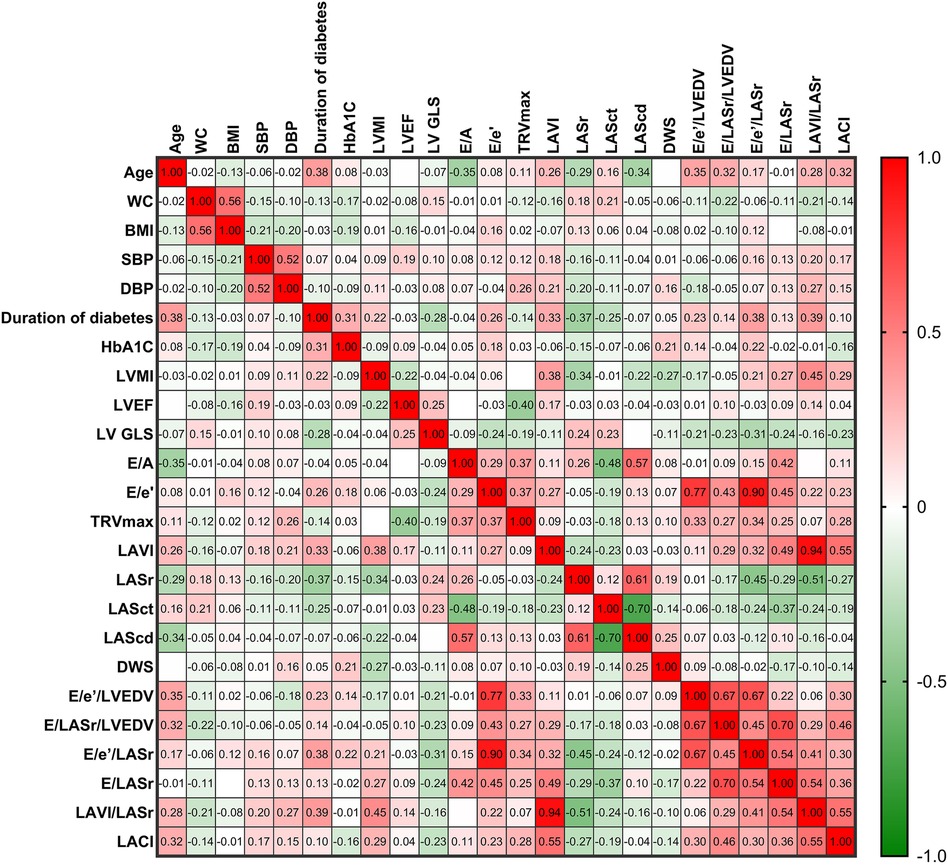
Figure 4. The heatmap illustrates the relationships between LA stiffness indicators, LV stiffness indicators, LACI, and LA and LV parameters in patients with DM. The color shading of each cell corresponds to the magnitude and direction of the correlation coefficient, with red indicating a positive correlation and green indicating a negative correlation. The numerical values within the cells represent the bivariate correlation coefficient. The abbreviations used are the same as those in Tables 1, 2.
3.4 Logistic regression analysis
Table 3 shows the results of logistic regression analyses for LASr, LV GLS, LA stiffness indicators, LV stiffness indicators, and LACI in patients with DM. Decreased levels of LV GLS, adjusted for age, sex, blood pressure, and BMI, have emerged as identified risk factors for DM. Detailed information is clearly depicted in Table 3 and Figure 5.

Table 3. Regression analysis for prediction of DM susceptibility.
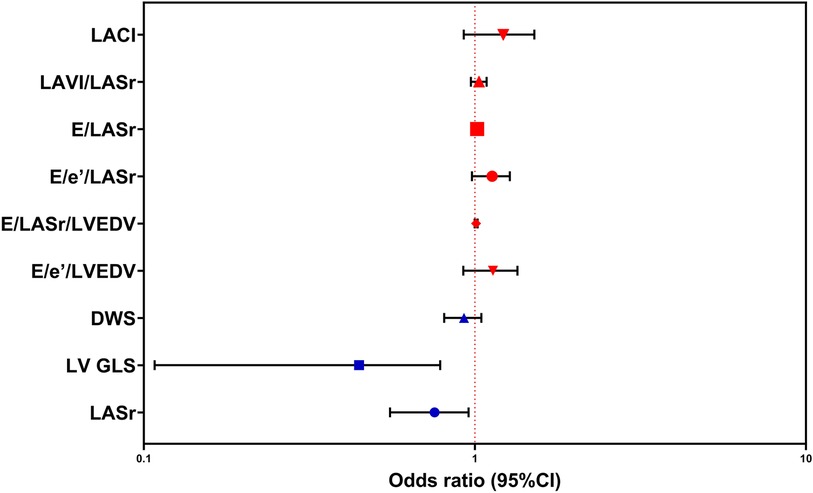
Figure 5. Logistic regression analysis was performed to predict susceptibility to DM, employing LASr, LV GLS, DWS, E/e′/LVEDV, E/LASr/LVEDV, E/e′/LASr, E/LASr, LAVI/LASr, and LACI as covariates. The abbreviations utilized are consistent with those in Tables 1–3.
4 Discussion
Our study aimed to investigate the impact of DM on LA stiffness, LV stiffness, and LACI using echocardiography. Among the 111 subjects included in the study and divided into DM and control groups, no significant differences were observed in age, sex, BMI, BSA, or WC between the two groups. This selection aimed to minimize the influence of these factors on the assessed cardiac stiffness indices. Furthermore, both the control and DM groups exhibited normal blood pressure ranges, as hypertensive subjects were excluded to eliminate their potential impact on the study (12, 32, 33). Several publications have demonstrated the influence of age and obesity on LA and LV stiffness, supporting our selection criteria (11, 17, 34, 35).
4.1 Structural and functional cardiac impairment in individuals with DM
In the comparison of LA parameters using ultrasound, our findings revealed a significant reduction in LA function assessed by STE in the DM group compared to the control group. Similar to our observations, other studies have indicated that DM significantly affects LA function, particularly LA strain (36, 37). Notably, even in patients without abnormal LAVI values, a parameter commonly used in clinical practice (21), changes in LA strain were evident.
Echocardiography of parameters related to the LV indicated a substantial decrease in the LV GLS in DM patients compared to controls. This observation aligns with previous research findings (38, 39). Interestingly, despite no significant difference in LVEF, LV GLS demonstrated alterations in DM patients. This raises questions about whether LV GLS may outperform LVEF in the early detection of LV functional changes in DM patients.
In our study, parameters such as E/e′ and TRVmax, commonly used for assessing LV diastolic function clinically, showed variations between the DM group and the control group. This result is consistent with previous publications (40, 41).
4.2 LA stiffness, LV stiffness, and LACI alterations in individuals with DM
Our study indicated that DM patients had greater LA and LV stiffness indicators than did control patients, as clearly illustrated in Table 2 and Figure 3. Various studies have highlighted the impact of DM on cardiac structure and function through multiple mechanisms. These mechanisms include impaired cardiac insulin metabolic signalling, mitochondrial dysfunction, increased oxidative stress, reduced nitric oxide bioavailability, elevated advanced glycation end products, collagen-based cardiomyocyte and extracellular matrix stiffness, impaired mitochondrial and cardiomyocyte calcium handling, inflammation, renin-angiotensin-aldosterone system activation, cardiac autonomic neuropathy, endoplasmic reticulum stress, microvascular dysfunction, and various cardiac metabolic abnormalities. The molecular mechanisms implicated in underlying pathophysiological changes include abnormalities in AMP-activated protein kinase, peroxisome proliferator-activated receptors, O-linked N-acetylglucosamine, protein kinase C, microRNA, and exosome pathways (42).
LA stiffness and LV stiffness have been demonstrated to have prognostic value in predicting cardiac events such as atrial fibrillation and heart failure (9, 43, 44). Our findings suggest that these stiffness indices change in DM patients before alterations in commonly used clinical indices such as the LAVI. This hypothesis implies that LA stiffness and LV stiffness may not only have prognostic value but also serve as early indicators of structural and functional cardiac changes in DM patients.
Despite the independent prognostic value of LA and LV parameters for cardiovascular events, recent research has suggested that incorporating LACI into risk prediction models enhances model discrimination and reclassifies cardiovascular risk. Compared with individual LA parameters, the LACI determines early LA remodelling stages and has greater prognostic value in predicting cardiac events after adjusting for traditional risk factors (17). In our study, the LACI also demonstrated significant alterations in DM patients compared to the control group. Similarly, a recent study in DM and hypertension patients showed an increase in LACI in the DM group (45). The promising prognostic and early detection capabilities of LACI, which can be easily assessed through rapid and straightforward echocardiographic measurements, offer optimistic prospects for widespread clinical application in the future.
4.3 Limitations
Despite yielding promising results, our study is not without limitations. First, as a cross-sectional investigation, its focus was on evaluating the impact of DM on LA stiffness, LV stiffness, and the LACI at a single time point. To comprehensively assess the diverse stages of DM, extended follow-up studies are essential. Furthermore, this was a single-center study with a modest sample size exclusively comprising Vietnamese subjects, which limits the generalizability of our findings and may introduce selection bias. To enhance applicability and validity, multicenter studies involving larger cohorts across diverse populations are imperative. Additionally, due to ethical considerations, patients did not cease medication use during sample collection. Moreover, considering the context at our research site, where changes in treatment medications are frequent, we did not exclude the potential influence of antidiabetic medications on cardiac function. The investigation exclusively employs a singular ultrasound machine model and software. Notably, this study did not perform a comparative analysis across different ultrasound machine manufacturers or analysis software for STE. Finally, the observational nature of our data restricts a full elucidation of the mechanisms linking DM with left atrioventricular coupling derangements. While offering valuable insights, causation cannot be inferred. Future research, incorporating experimental or interventional studies, is proposed to unravel these mechanistic associations. Addressing these limitations in subsequent research endeavors will contribute significantly to a nuanced understanding of the intricate relationship between DM and cardiac parameters in the medical field.
5 Conclusions
LA stiffness indicators, LV stiffness indicators, and LACI are greater in patients with diabetes mellitus than in healthy individuals. This finding suggests a potential link between diabetes and increased stiffness in both the atrial and ventricular components of the heart.
Data availability statement
The datasets presented in this article are not readily available because the data is unavailable due to privacy and local ethical restrictions. Requests to access the datasets should be directed to Hai Ngoc Nguyen Dang (dangnngochai@dtu.edu.vn or ngochai123dc@gmail.com).
Ethics statement
The studies involving humans were approved by the Institutional Ethics Committee of the Hue University of Medicine and Pharmacy (No: H2022/312). The studies were conducted in accordance with the local legislation and institutional requirements. The participants provided their written informed consent to participate in this study.
Author contributions
HD: Data curation, Formal Analysis, Investigation, Methodology, Project administration, Resources, Software, Supervision, Validation, Visualization, Writing – original draft, Writing – review & editing, Conceptualization, Funding acquisition. TL: Data curation, Formal Analysis, Funding acquisition, Investigation, Methodology, Project administration, Resources, Software, Supervision, Validation, Visualization, Writing – original draft, Writing – review & editing. BH: Funding acquisition, Methodology, Supervision, Validation, Visualization, Writing – original draft, Writing – review & editing.
Funding
The authors declare that no financial support was received for the research, authorship, and/or publication of this article.
Conflict of interest
The authors declare that the research was conducted in the absence of any commercial or financial relationships that could be construed as a potential conflict of interest.
Publisher's note
All claims expressed in this article are solely those of the authors and do not necessarily represent those of their affiliated organizations, or those of the publisher, the editors and the reviewers. Any product that may be evaluated in this article, or claim that may be made by its manufacturer, is not guaranteed or endorsed by the publisher.
References
1. Sun H, Saeedi P, Karuranga S, Pinkepank M, Ogurtsova K, Duncan BB, et al. IDF diabetes atlas: global, regional and country-level diabetes prevalence estimates for 2021 and projections for 2045. Diabetes Res Clin Pract. (2022) 183:109119. doi: 10.1016/j.diabres.2021.109119
2. Li W, Lou X, Zha Y, Qin Y, Zha J, Hong L, et al. Single-cell RNA-seq of heart reveals intercellular communication drivers of myocardial fibrosis in diabetic cardiomyopathy. eLife. (2023) 12:e80479. doi: 10.7554/eLife.80479
3. Spartalis M, Pantelidis P, Kontogiannis C, Paschou SA, Spartalis E, Iliopoulos DC, et al. The complex relationship between diabetes and cardiac arrhythmias: pathophysiologyand mechanisms. CPD. (2022) 28:2129–30. doi: 10.2174/1381612828666220720095433
4. Lombardi C, Spigoni V, Gorga E, Dei Cas A. Novel insight into the dangerous connection between diabetes and heart failure. Herz. (2016) 41:201–7. doi: 10.1007/s00059-016-4415-7
5. Ritchie RH, Abel ED. Basic mechanisms of diabetic heart disease. Circ Res. (2020) 126:1501–25. doi: 10.1161/CIRCRESAHA.120.315913
6. Tuleta I, Frangogiannis NG. Fibrosis of the diabetic heart: clinical significance, molecular mechanisms, and therapeutic opportunities. Adv Drug Delivery Rev. (2021) 176:113904. doi: 10.1016/j.addr.2021.113904
7. Russo V, Lovato L, Ligabue G. Cardiac MRI: technical basis. Radiol med. (2020) 125:1040–55. doi: 10.1007/s11547-020-01282-z
8. Ammar A, Bouattane O, Youssfi M. Automatic cardiac cine MRI segmentation and heart disease classification. Comput Med Imaging Graph. (2021) 88:101864. doi: 10.1016/j.compmedimag.2021.101864
9. Olsen FJ, Diederichsen SZ, Jørgensen PG, Jensen MT, Dahl A, Landler NE, et al. Potential role of conventional and speckle-tracking echocardiography in the screening of structural and functional cardiac abnormalities in elderly individuals: baseline echocardiographic findings from the LOOP study. PLoS ONE. (2022) 17:e0269475. doi: 10.1371/journal.pone.0269475
10. Arnautu D-A, Arnautu S-F, Tomescu M-C, Luca S, Luca C-T. Increased left atrial stiffness is significantly associated with paroxysmal atrial fibrillation in diabetic patients. DMSO. (2023) 16:2077–87. doi: 10.2147/DMSO.S417675
11. Cuspidi C, Giovannini R, Tadic M. Left atrial stiffness: a novel marker of hypertension-mediated organ damage on the horizon? Hypertens Res. (2021) 44:365–7. doi: 10.1038/s41440-020-00582-1
12. Singleton MJ, Nelson MB, Samuel TJ, Kitzman DW, Brubaker P, Haykowsky MJ, et al. Left atrial stiffness index independently predicts exercise intolerance and quality of life in older, obese patients with heart failure with preserved ejection fraction. J Card Fail. (2022) 28:567–75. doi: 10.1016/j.cardfail.2021.10.010
13. Wisneski JA, Bristow JD. Left ventricular stiffness. Annu Rev Med. (1978) 29:475–83. doi: 10.1146/annurev.me.29.020178.002355
14. Wang ZJ, Wang VY, Bradley CP, Nash MP, Young AA, Cao JJ. Left ventricular diastolic myocardial stiffness and end-diastolic myofibre stress in human heart failure using personalised biomechanical analysis. J of Cardiovasc Trans Res. (2018) 11:346–56. doi: 10.1007/s12265-018-9816-y
15. Pezel T, Ambale Venkatesh B, Kato Y, De Vasconcellos HD, Heckbert SR, Wu CO, et al. Left atrioventricular coupling index to predict incident heart failure: the multi-ethnic study of atherosclerosis. Front Cardiovasc Med. (2021) 8:704611. doi: 10.3389/fcvm.2021.704611
16. Leiner T. Left atrioventricular coupling for early prediction of incident atrial fibrillation. Radiology. (2022) 303:327–8. doi: 10.1148/radiol.213293
17. Pezel T, Venkatesh BA, De Vasconcellos HD, Kato Y, Shabani M, Xie E, et al. Left atrioventricular coupling index as a prognostic marker of cardiovascular events: the MESA study. Hypertension. (2021) 78:661–71. doi: 10.1161/HYPERTENSIONAHA.121.17339
18. Davies MJ, Aroda VR, Collins BS, Gabbay RA, Green J, Maruthur NM, et al. Management of hyperglycaemia in type 2 diabetes, 2022. A consensus report by the American Diabetes Association (ADA) and the European Association for the Study of Diabetes (EASD). Diabetologia. (2022) 65:1925–66. doi: 10.1007/s00125-022-05787-2
19. Khanna D, Peltzer C, Kahar P, Parmar MS. Body mass index (BMI): a screening tool analysis. Cureus. (2022) 14:e22119. doi: 10.7759/cureus.22119
20. Reading BD, Freeman B. Simple formula for the surface area of the body and a simple model for anthropometry. Clin Anat. (2005) 18:126–30. doi: 10.1002/ca.20047
21. Mitchell C, Rahko PS, Blauwet LA, Canaday B, Finstuen JA, Foster MC, et al. Guidelines for performing a comprehensive transthoracic echocardiographic examination in adults: recommendations from the American society of echocardiography. J Am Soc Echocardiogr. (2019) 32:1–64. doi: 10.1016/j.echo.2018.06.004
22. Kurt M, Wang J, Torre-Amione G, Nagueh SF. Left atrial function in diastolic heart failure. Circ Cardiovasc Imaging. (2009) 2:10–5. doi: 10.1161/CIRCIMAGING.108.813071
23. Nagueh SF. Noninvasive measurement of left atrial stiffness in patients with heart failure and preserved ejection fraction. JACC Cardiovasc Imaging. (2023) 16:446–9. doi: 10.1016/j.jcmg.2022.12.003
24. Kim D, Seo JH, Choi KH, Lee SH, Choi J-O, Jeon E-S, et al. Prognostic implications of left atrial stiffness index in heart failure patients with preserved ejection fraction. JACC Cardiovasc Imaging. (2023) 16:435–45. doi: 10.1016/j.jcmg.2022.11.002
25. Braunauer K, Düngen H-D, Belyavskiy E, Aravind-Kumar R, Frydas A, Kropf M, et al. Potential usefulness and clinical relevance of a novel left atrial filling index to estimate left ventricular filling pressures in patients with preserved left ventricular ejection fraction. Eur Heart J Cardiovasc Imaging. (2020) 21:260–9. doi: 10.1093/ehjci/jez272
26. Hsu P-C, Lee W-H, Chu C-Y, Lee H-H, Lee C-S, Yen H-W, et al. Prognostic role of left atrial strain and its combination index with transmitral E-wave velocity in patients with atrial fibrillation. Sci Rep. (2016) 6:17318. doi: 10.1038/srep17318
27. Ma C, Liao Y, Fan J, Zhao X, Su B, Zhou B. The novel left atrial strain parameters in diagnosing of heart failure with preserved ejection fraction. Echocardiography. (2022) 39:416–25. doi: 10.1111/echo.15304
28. Takeda Y, Sakata Y, Higashimori M, Mano T, Nishio M, Ohtani T, et al. Noninvasive assessment of wall distensibility with the evaluation of diastolic epicardial movement. J Card Fail. (2009) 15:68–77. doi: 10.1016/j.cardfail.2008.09.004
29. Kishima H, Mine T, Fukuhara E, Ishihara M. Left ventricular stiffness assessed by diastolic wall strain predicts asymptomatic atrial high-rate episodes in patients with pacemaker implantation. J Cardiol. (2021) 77:195–200. doi: 10.1016/j.jjcc.2020.08.002
30. Choi AW, Fong N, Li VW, Ho T, Chan EY, Ma AL, et al. Left ventricular stiffness in paediatric patients with end-stage kidney disease. Pediatr Nephrol. (2020) 35:1051–60. doi: 10.1007/s00467-020-04484-9
31. Chowdhury SM, Butts RJ, Hlavacek AM, Taylor CL, Chessa KS, Bandisode VM, et al. Echocardiographic detection of increased ventricular diastolic stiffness in pediatric heart transplant recipients: a pilot study. J Am Soc Echocardiogr. (2018) 31:342–8.e1. doi: 10.1016/j.echo.2017.11.010
32. Elsayegh AT, Mohamed Asous OM, El Misiri AM. Determinants of left atrial stiffness by reservoir strain using 2D speckle tracking echocardiography in structurally normal heart. Eur Heart J Suppl. (2023) 25:F1–2. doi: 10.1093/eurheartjsupp/suad113.003
33. Wohlfahrt P, Redfield MM, Lopez-Jimenez F, Melenovsky V, Kane GC, Rodeheffer RJ, et al. Impact of general and central adiposity on ventricular-arterial aging in women and men. JACC Heart Fail. (2014) 2:489–99. doi: 10.1016/j.jchf.2014.03.014
34. Hussein MF, Al-Mashhadani AH, Essa SI. The use of left ventricular myocardial stiffness index as a predictor of myocardial performance in patients with systemic hypertension. IJMPCERO. (2014) 03:167–75. doi: 10.4236/ijmpcero.2014.33022
35. Sun Q, Pan Y, Zhao Y, Liu Y, Jiang Y. Association of nighttime systolic blood pressure with left atrial-left ventricular–arterial coupling in hypertension. Front Cardiovasc Med. (2022) 9:814756. doi: 10.3389/fcvm.2022.814756
36. Gong M, Xu M, Meng J, Jiang S, Jiang X. Diabetic microvascular complications are associated with left atrial structural alterations in asymptomatic type 2 diabetes patients: a cross-sectional study. J Diabetes Complicat. (2023) 37:108361. doi: 10.1016/j.jdiacomp.2022.108361
37. Mondillo S, Cameli M, Caputo ML, Lisi M, Palmerini E, Padeletti M, et al. Early detection of left atrial strain abnormalities by speckle-tracking in hypertensive and diabetic patients with normal left atrial size. J Am Soc Echocardiogr. (2011) 24:898–908. doi: 10.1016/j.echo.2011.04.014
38. Flores-Ramírez R, Azpiri-López JR, González-González JG, Ordaz-Farías A, González-Carrillo LE, Carrizales-Sepúlveda EF, et al. Global longitudinal strain as a biomarker in diabetic cardiomyopathy. A comparative study with Gal-3 in patients with preserved ejection fraction. Arch Cardiol Mex. (2017) 87:278–85. doi: 10.1016/j.acmx.2016.06.002
39. Silverii GA, Toncelli L, Casatori L, Bossini R, Nannelli F, Pala L, et al. Assessment of left ventricular global longitudinal strain in patients with type 2 diabetes: relationship with microvascular damage and glycemic control. Nutr Metab Cardiovasc Dis. (2022) 32:994–1000. doi: 10.1016/j.numecd.2022.01.014
40. Tsujino T, Kawasaki D, Masuyama T. Left ventricular diastolic dysfunction in diabetic patients: pathophysiology and therapeutic implications. Am J Cardiovasc Drugs. (2006) 6:219–30. doi: 10.2165/00129784-200606040-00002
41. Hassan Ayman KM, Abdallah Mahmoud A, Abdel-Mageed Eman A, Marwa S, Soliman Mona M, Kishk Yehia T. Correlation between left ventricular diastolic dysfunction and dyslipidaemia in asymptomatic patients with new-onset type 2 diabetes mellitus. Egypt J Intern Med. (2021) 33:8. doi: 10.1186/s43162-021-00037-0
42. Jia G, Hill MA, Sowers JR. Diabetic cardiomyopathy: an update of mechanisms contributing to this clinical entity. Circ Res. (2018) 122:624–38. doi: 10.1161/CIRCRESAHA.117.311586
43. Khurram IM, Maqbool F, Berger RD, Marine JE, Spragg DD, Ashikaga H, et al. Association between left atrial stiffness index and atrial fibrillation recurrence in patients undergoing left atrial ablation. Circ Arrhythm Electrophysiol. (2016) 9:e003163. doi: 10.1161/CIRCEP.115.003163
44. Watanabe S, Shite J, Takaoka H, Shinke T, Tanino Y, Otake H, et al. Predictive importance of left ventricular myocardial stiffness for the prognosis of patients with congestive heart failure. J Cardiol. (2011) 58:245–52. doi: 10.1016/j.jjcc.2011.07.005
Keywords: speckle tracking echocardiography, left atrial stiffness, left ventricular stiffness, left atrioventricular coupling index, diabetes mellitus
Citation: Dang HNN, Luong TV and Ho BA (2024) Evaluation of the relationship between left atrial stiffness, left ventricular stiffness, and left atrioventricular coupling index in type 2 diabetes patients: a speckle tracking echocardiography study. Front. Cardiovasc. Med. 11:1372181. doi: 10.3389/fcvm.2024.1372181
Received: 17 January 2024; Accepted: 9 April 2024;
Published: 25 April 2024.
Edited by:
Kenichiro Otsuka, Osaka City University Graduate School of Medicine, JapanReviewed by:
Andrea Sonaglioni, IRCCS MultiMedica, ItalyHirotoshi Ishikawa, Kashibaseiki Hospital, Japan
© 2024 Dang, Luong and Ho. This is an open-access article distributed under the terms of the Creative Commons Attribution License (CC BY). The use, distribution or reproduction in other forums is permitted, provided the original author(s) and the copyright owner(s) are credited and that the original publication in this journal is cited, in accordance with accepted academic practice. No use, distribution or reproduction is permitted which does not comply with these terms.
*Correspondence: Thang Viet Luong lvthang@huemed-univ.edu.vn Binh Anh Ho drhoanhbinh@gmail.com