Causal role of immune cells in hypertension: a bidirectional Mendelian randomization study
 Xinhe Zhang
 Guanying Li4
 - 1Department of Cardiology, Central Hospital Affiliated to Shandong First Medical University, Jinan, China
- 2Shandong First Medical University, Jinan, China
- 3Research Center of Translational Medicine, Central Hospital Affiliated to Shandong First Medical University, Jinan, China
- 4Jinan Foreign Language School International Center, Jinan, China
- 5Department of Cardiology, Hekou District People Hospital, Dongying, China
Background: Although Hypertension (HTN) is considered to be a cardiovascular disease caused by multiple factors, the cause of it is still unknown. In this study, we aim to find out whether circulating immune cell characteristics have an impact on susceptibility to HTN.
Methods: This study employed a comprehensive two-sample Mendelian randomization (MR) analysis to investigate the causal association between immune cell characteristics and HTN. Utilizing publicly accessible genetic data, we examined the causal relationship between HTN and the susceptibility to 731 immune cell signatures. To ensure the reliability and validity of the findings, a comprehensive sensitivity analysis was conducted to assess heterogeneity, confirm the robustness of the results and evaluate the presence of horizontal pleiotropy.
Results: After FDR correction, immune phenotype had an effect on HTN. In our study, one immunophenotype was identified as being positively associated with HTN risk significance: HLA DR on CD33- HLA DR+. In addition, we examined 8 immune phenotype with no statistically significant effect of HTN, but it is worth mentioning that they had an unadjusted low P-value phenotype.
Conclusions: Our MR study by genetic means demonstrated the close relationship between HTN and immune cells, thus providing guidance for future clinical prediction and subsequent treatment of HTN.
Introduction
HTN, as well as prehypertension and other dangerous forms of HTN, is responsible for 85 million deaths worldwide from stroke, ischaemic heart disease, other vascular diseases and kidney disease (1). Between 1990 and 2019, the number of people with high blood pressure worldwide has absolutely doubled in the age group 30–79, and to this day, high blood pressure remains the leading cause of death and disability worldwide, far outweighing the influence of other occupational, environmental and lifestyle factors. Despite the availability of treatments, global blood pressure control rates are only 18%–23%, and as low as 10% in some parts of Asia and Africa. Although the low blood pressure control rates are partly due to poor treatment adherence, they also highlight that the cause of elevated blood pressure in most adults with HTN is unknown (2). However, there is no systematic study on the causal relationship between various immune cell signatures and HTN.
Cardiovascular and cerebrovascular diseases are mostly diseases with poor prognosis and relatively sudden onset, such as stroke, coronary artery disease, atrial fibrillation and peripheral vascular diseases, and HTN happens to be their main pathogenic factor (3). Recently, with the aging of the population and the acceleration of social development, the proportion of people suffering from HTN in the total population is increasing year by year and the age of disease is gradually getting younger. Moreover, because of its high prevalence, HTN is the single largest risk factor for heart failure in the population (4). And in the early stages, HTN may not be detected because it is usually asymptomatic (5). The World Health Organization (WHO) estimates that about 46% of people with HTN in the world are unaware of their condition. Therefore, there is an urgent need for an indicator that can prompt early HTN or even prehypertension.
MR was originally developed as an alternative to randomised controlled trials (RCTS) to provide reliable causal evidence between exposure and outcome through genetic variation (6). It has since evolved into an independent analytical method based on the principles of Mendelian distribution, primarily used for epidemiological etiological inference. The validity of the causal sequence in MR is of utmost importance (7, 8). It serves as the basis for natural experiments through the random allocation of alleles during meiosis cell division and conception (6, 9). Currently, MR has been widely applied in disease research, but there are no relevant reports to elucidate the causal relationship between immune cells and HTN.
In this study, a comprehensive two-sample MR Analysis was performed to determine the causal relationship between immune cell characteristics and HTN, which will provide new insights into the prevention and treatment of HTN in the future.
Materials and methods
Study design
Based on a two-sample MR analysis, we evaluated the causal relationship between 731 immune cell features (7 groups) and HTN. MR uses genetic variation to represent risk factors, therefore, effective instrumental variables in causal inference must satisfy three key assumptions (10):
1. Association hypothesis: SNPS are strongly correlated with exposure factors.
2. Independence hypothesis: SNPS are independent of confounders.
3. Exclusivity hypothesis: SNPS can only have an effect on outcomes through exposure.
The study we analyzed received approval from the relevant institutional review committee, and participants provided informed consent forms (11, 12).
Genome-wide association study (GWAS) data sources for HTN
We from Integrative Epidemiology Unit (IEU) open GWAS HTN analysis of the database access to data, the database is mainly composed of a publicly available GWAS summary data sets. We used the HTN GWAS Summary statistics from FinnGen. The GWAS consisted of 55,917 cases and 162,837 controls. This MR Study was conducted using GWAS aggregate statistics and received ethical approval from each GWAS.
Immunity-wide GWAS data sources
The GWAS catalog provides publicly accessible GWAS summary statistics for immune coverage, specifically for each immune trait (GCST0001391 to GCST0002121) (13). This study successfully identified 122 significant independent association signals at 70 locations, with 53 being previously unreported. Additionally, it elucidated the molecules and mechanisms responsible for regulating 459 cellular features related to immune function. A comprehensive analysis was conducted using flow cytometry to examine a total of 731 immunophenotypes, encompassing absolute cell counts (n = 118), median fluorescence intensity (MFI) as an indicator of surface antigen levels (n = 389), morphological parameters (MP) (n = 32), and relative cell counts (n = 192).The MFI, AC, and RC features encompass B cells, CDC, mature stage T cells, monocytes, bone marrow cells, TBNK (T cells, B cells, natural killer cells) and Treg panels, whereas the MP features consist of CDC and TBNK panels. The initial immunological profile Genome-Wide Association Study (GWAS) was carried out utilizing data from 3,757 individuals of European descent, with no cohorts overlapping. Approximately 22 million single nucleotide polymorphisms (SNPs) were genotyped using high-density arrays, utilizing a reference panel derived from Sardinian sequences. The genotyping of the samples was conducted using four Illumina arrays, namely OHTNiExpress, ImmunoChip, Cardio-MetaboChip, and ExomeChip. Subsequently, associations were examined while accounting for covariates such as sex, age (14).
Selection of instrumental variables (IVs)
According to recent studies (14, 15), the significance level of the IV for each immunological trait was set to 1 × 10⁻⁵ In order to ensure that SNP effects on each immune trait and HTN are associated with the same allele, the direction of effects needs to be coordinated. Furthermore, SNPs exhibiting linkage imbalance (with an r2 threshold of <0.001 within a 10 Mb window) were excluded from the obtained dataset, while the remaining SNPs were retained. To ensure the robustness of the exposure, any statistic with a small f-statistic (F < 10) was also eliminated from our analyses. We did the same thing with the metabolite data. Finally, we also identified 9 IVs of HTN for further reverse MR Analysis.
Statistical analysis
All analyses were performed in R 3.5.3 software (http://www.Rproject.org). This study mainly used the software package “MendelianRandomization” (version 0.4) (16) to evaluate the causal relationship between 731 immunophenotypes and HTN. It is used to perform inverse variance weighting (IVW) (17), weighted median based methods (18), and model-based methods (19). The Cochran's Q statistic and its associated p-values are employed to examine the presence of heterogeneity among the chosen independent variables (IVs). In the event that the null hypothesis is rejected, a random effect inverse variance weighting (IVW) is utilized in lieu of a fixed effect IVW (17).We used a common method, namely MR-Egger, to exclude the effect of horizontal pleiotropy. If the intercept term is significant, it indicates the presence of horizontal multiplicity. Additionally, we employed a powerful method called MR-PRESSO to exclude potential horizontal pleiotropic outliers that could significantly impact the estimated results in the MR-PRESSO package (19). Furthermore, scatter plots, funnel plots and MR leave-one-out sensitivity analysis plots are employed to analyze the data. The scatter plot provides evidence that the outcomes remain unaltered by outliers, while the funnel plot serves to illustrate the strength of the correlation and the absence of heterogeneity. The “MR leave-one-out sensitivity analysis” method refers to the gradual elimination of each SNP, the calculation of the meta effect of the remaining SNP, and the observation of whether the result changes after the elimination of each SNP. If the result changes greatly after the elimination of a SNP, it indicates that there is a SNP that has a great impact on the result, which is used to verify the sensitivity analysis. Consequently, the scatter plot reaffirms the resilience of the results against outliers.
Results
Some immune cells influence susceptibility to HTN
In order to investigate the causal impact of immunophenotypes on HTN, a two-sample MR analysis was conducted. The inverse-variance weighted (IVW) analysis was considered the most effective approach, provided that valid instrumental variables (IVs) were utilized. Additionally, when the genetic IVs exhibited no pleiotropic effects and the sample size was sufficiently large, the IVW estimate demonstrated consistency, efficiency, and proximity to the true value (20). Hence, the IVW method was selected as the primary approach for conducting MR analysis in order to investigate the causal impact of HTN on immunophenotype. Two samples were utilized for this analysis, with a particular focus on the IVW method. At a nominal significance level, we identified causal relationships between HTN and 63 immune cells. Specifically, elevated levels of 31 immune cells and reduced levels of 32 immune cells were found to be associated with an increased risk of HTN. Following multiple test adjustments using the false discovery rate (FDR) method (PFDR < 0.05), we observed that one immunophenotype exhibited a significant association with HTN risk: We observed a significant causal effect of HLA DR on CD33- HLA DR+ on HTN risk by using the Inverse variance weighted (fixed effects) (OR = 1.048, CI: 1.030–1.066, P = 6.34 × 10⁻⁸, PFDR = 4.63 × 10⁻⁵, Figure 1, Supplementary Table S1, Tables 1, 2), which is consistent with weighted mode (P = 0.0007), weighted median (P = 0.000014), MR-PRESSO (P = 0.00062), Simple mode (P = 0.027), MR Egger (P = 0.0015). It is also noteworthy that eight suggestive immunophenotypes were identified at a significance of 0.20. Four of them, respectively CD28 on activated & secreting Treg (OR = 0.978, CI: 0.964–0.993, P = 0.005, PFDR = 0.195, Figure 1, Supplementary Table S1, Tables 1, 2), CCR2 on CD14- CD16+ monocyte (OR = 0.981, CI: 0.968–0.994, P = 0.005, PFDR = 0.195, Figure 1, Supplementary Table S1, Tables 1, 2), CD3 on NKT (OR = 0.948, CI: 0.917–0.979, P = 0.001, PFDR = 0.109, Figure 1, Supplementary Table S1, Tables 1, 2), CD80 on granulocyteT (OR = 0.971, CI: 0.955–0.988, P = 0.0008, PFDR = 0.099, Figure 1, Supplementary Table S1, Tables 1, 2) and CD39+ CD8br AC (OR = 0.968, CI: 0.950–0.986, P = 0.0006, PFDR = 0.099, Figure 1, Supplementary Table S1, Tables 1, 2) have a negative effect on the incidence of HTN, whereas the remaining three, IgD- CD24- %B cell (OR = 1.035, CI: 1.014–1.056, P = 0.00097, PFDR = 0.101, Figure 1, Supplementary Table S1, Tables 1, 2), Secreting Treg %CD4 (OR = 1.020, CI: 1.006–1.033, P = 0.004, PFDR = 0.18, Figure 1, Supplementary Table S1, Tables 1, 2) and SSC-A (OR = 1.044, CI: 1.020–1.068, P = 0.0002, PFDR = 0.077, Figure 1, Supplementary Table S1, Tables 1, 2) on NK, have a positive effect on the incidence of HTN. Using the other methods and sensitivity analysis, we confirmed the robustness of the causal associations observed.
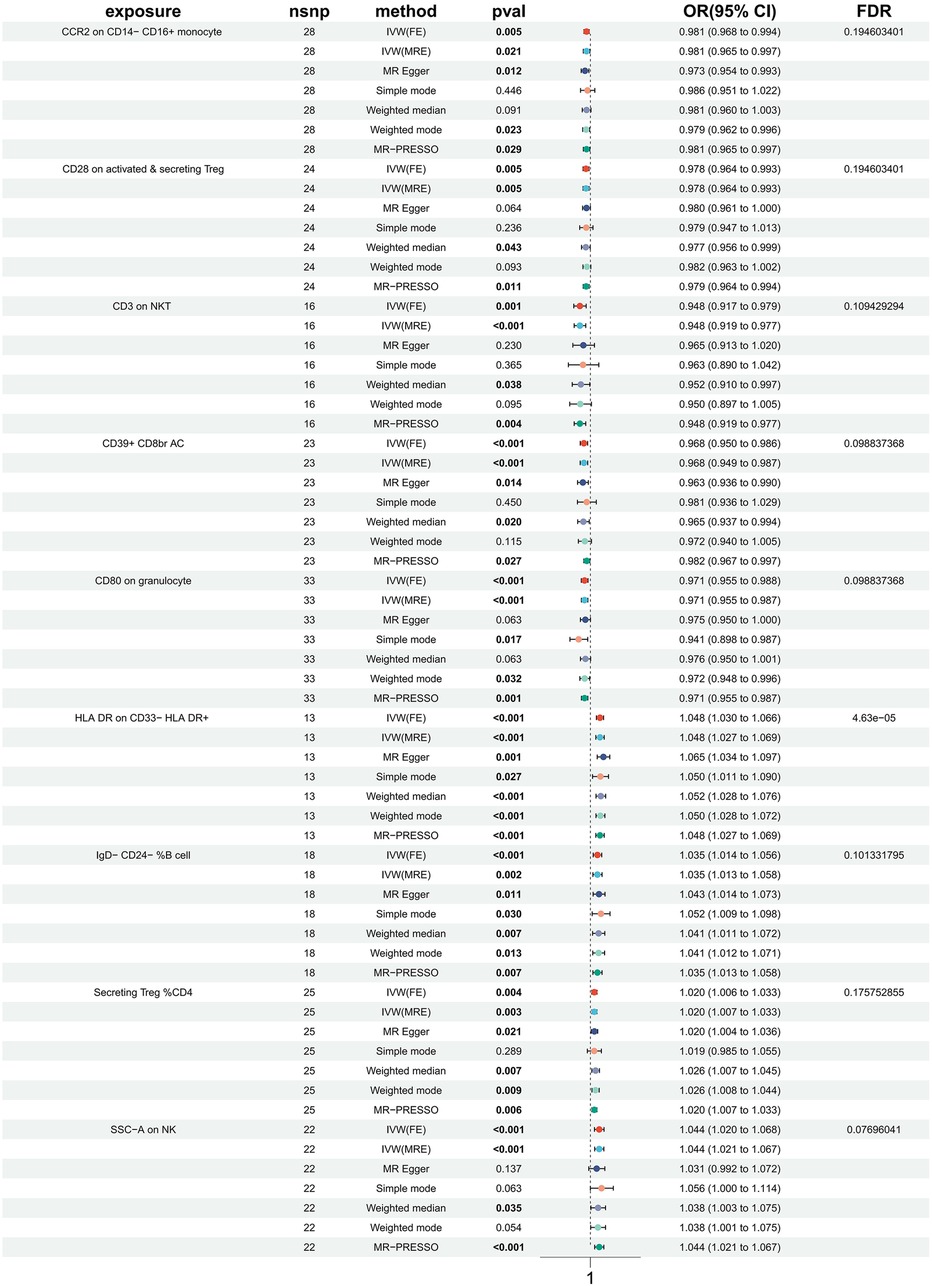
Figure 1. Forest plots showed the causal associations between immune cell and HTN.
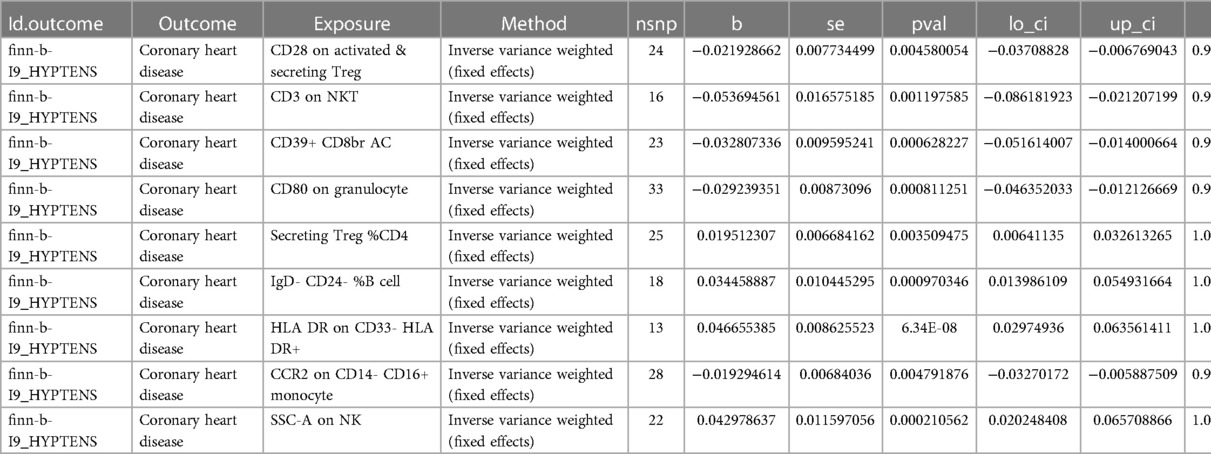
Table 1. Causal effects of immune cells on HTN.
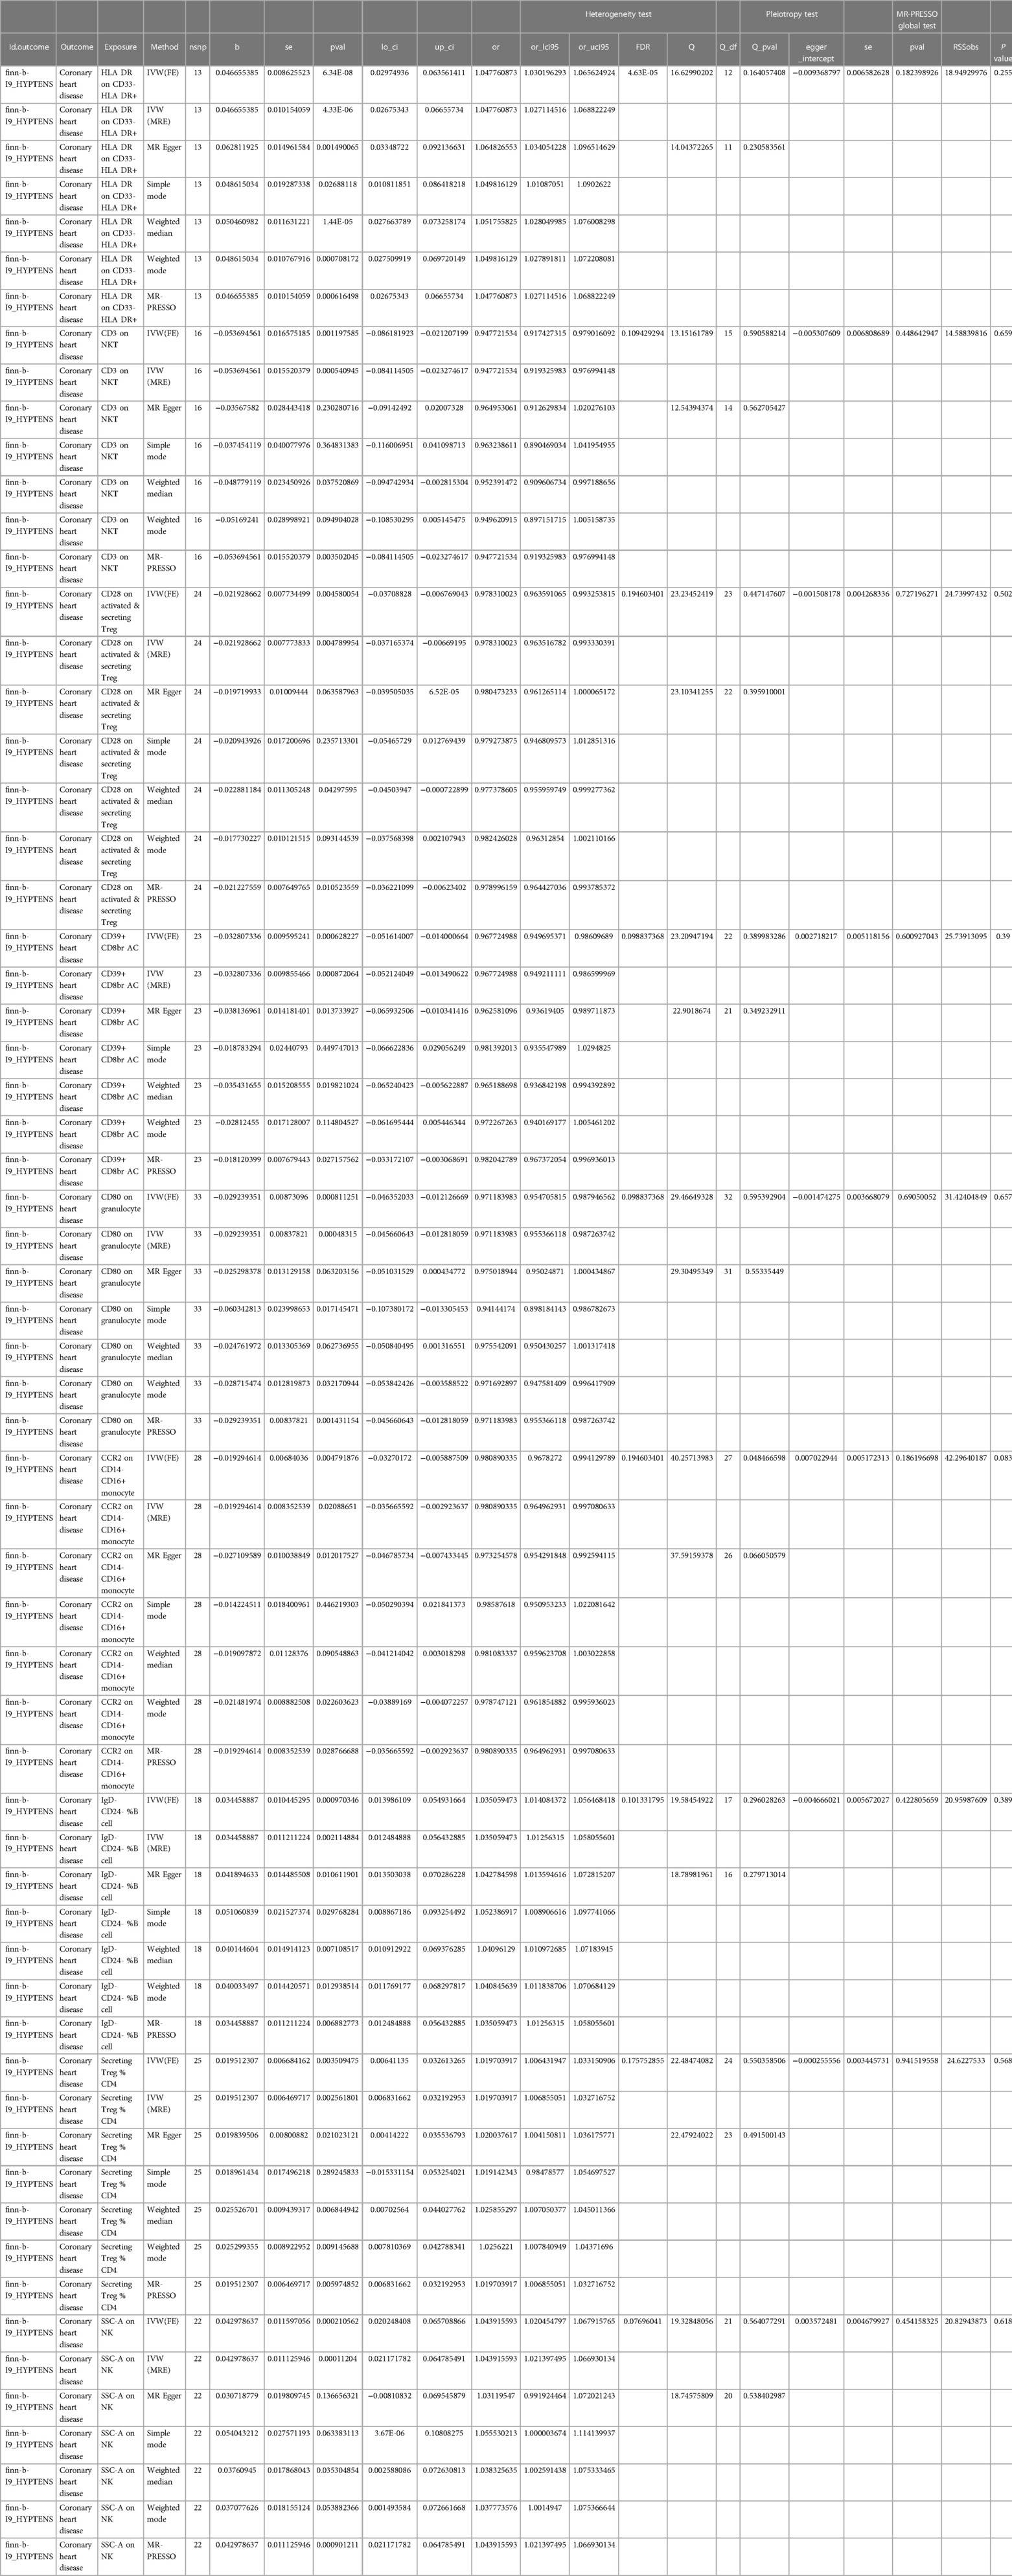
Table 2. Causal effects of immune cells on HTN.
Furthermore, the MR-Egger intercept and the global test of MR-PRESSO effectively eliminated the potential influence of horizontal pleiotropy (Supplementary Table S1). The stability of the findings was further supported by the scatter plots, funnel plots and MR leave-one-out sensitivity analysis plots (Figures 2, 3).
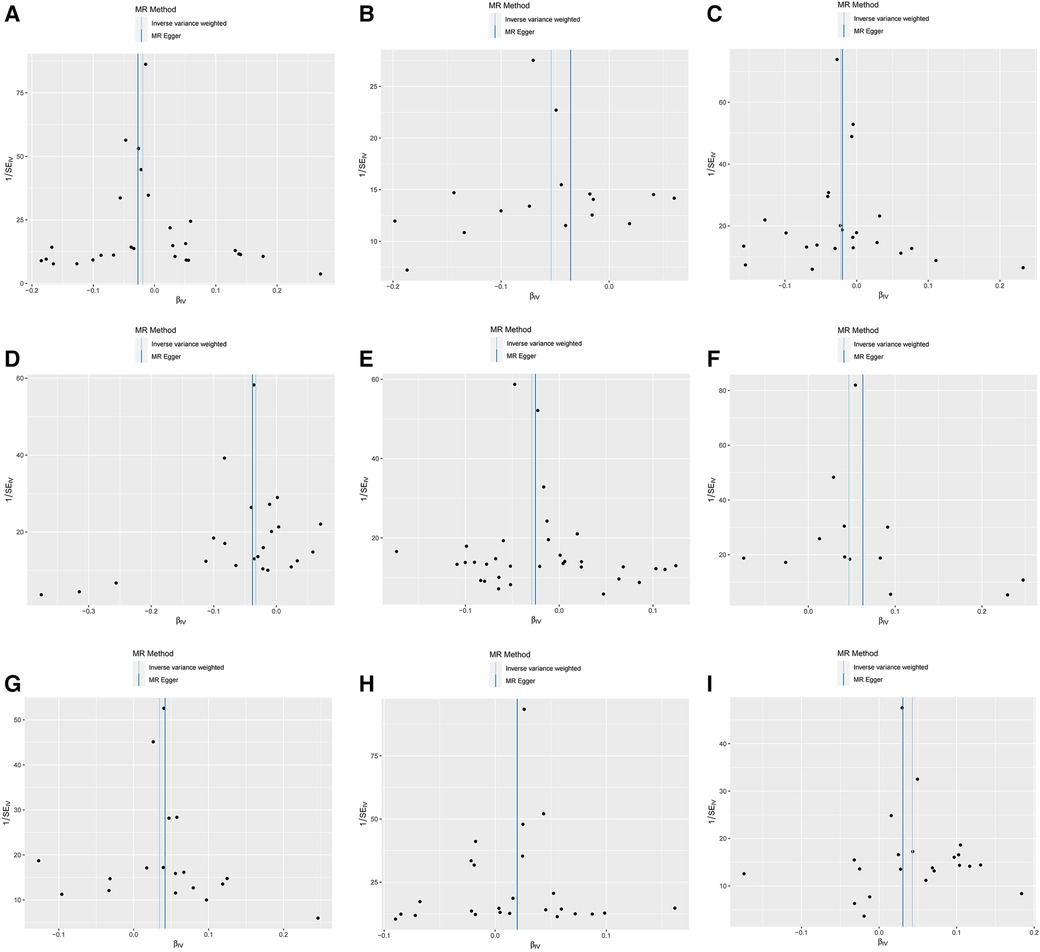
Figure 2. Scatter plots, funnel plots for casual associations between immune cell and HTN risk. (A) Funnel plots for CCR2 on CD14- CD16+ monocyte on hypertension. (B) Funnel plots for CD3 on NKT on hypertension. (C) Funnel plots for CD28 on activated & secreting Treg on hypertension. (D) Funnel plots for CD39+ CD8br AC on hypertension. (E) Funnel plots for CD80 on granulocyte on hypertension. (F) Funnel plots for HLA DR on CD33- HLA DR+ on hypertension. (G) Funnel plots for IgD- CD24- _B cell on hypertension. (H) Funnel plots for Secreting Treg _CD4 on hypertension. (I) Funnel plots for SSC-A on NKon hypertension. (J) Scatter plots for CCR2 on CD14- CD16+ monocyte on hypertension. (K) Scatter plots for CD3 on NKT on hypertension. (L) Scatter plots for CD28 on activated & secreting Treg on hypertension. (M) Scatter plots for CD39+ CD8br AC on hypertension. (N) Scatter plots for CD80 on granulocyte on hypertension. (O) Scatter plots for HLA DR on CD33- HLA DR+ on hypertension. (P) Scatter plots for IgD- CD24- _B cell on hypertension. (Q) Scatter plots for Secreting Treg _CD4 on hypertension. (R) Scatter plots for SSC-A on NK.scatter on hypertension.
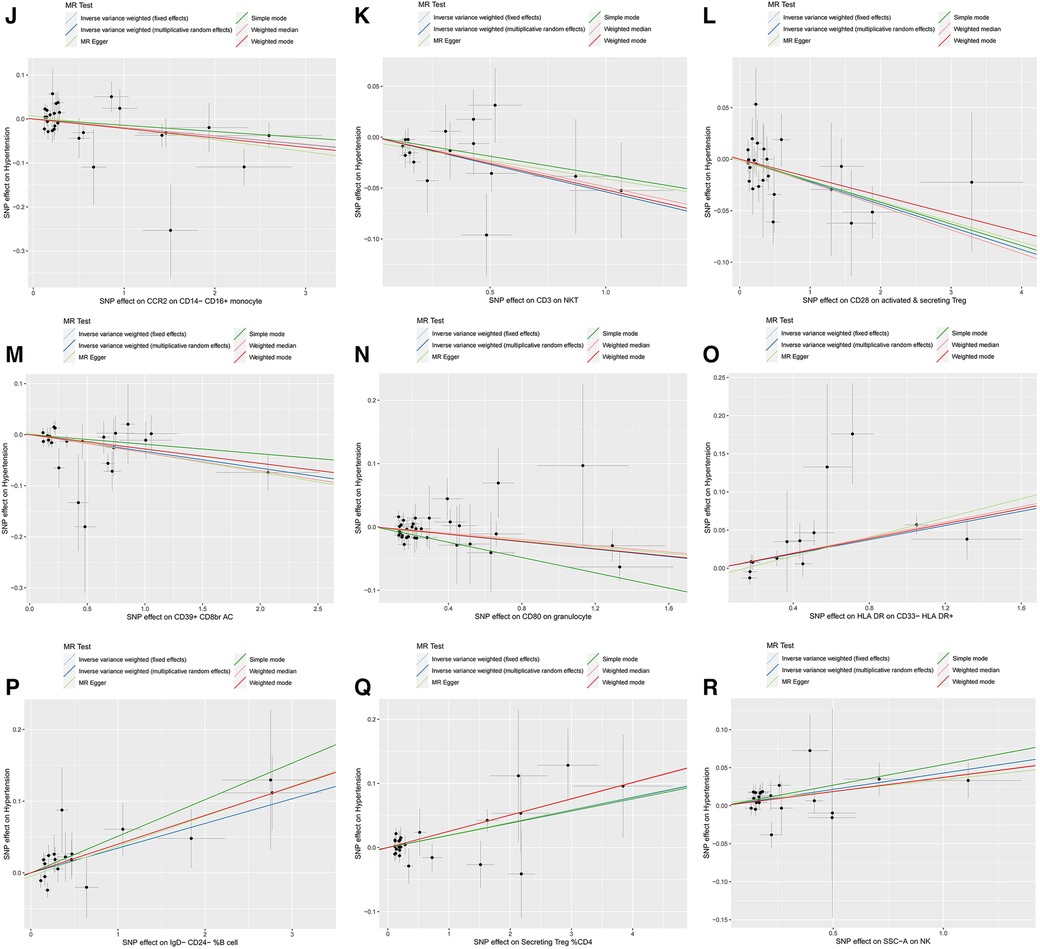
.
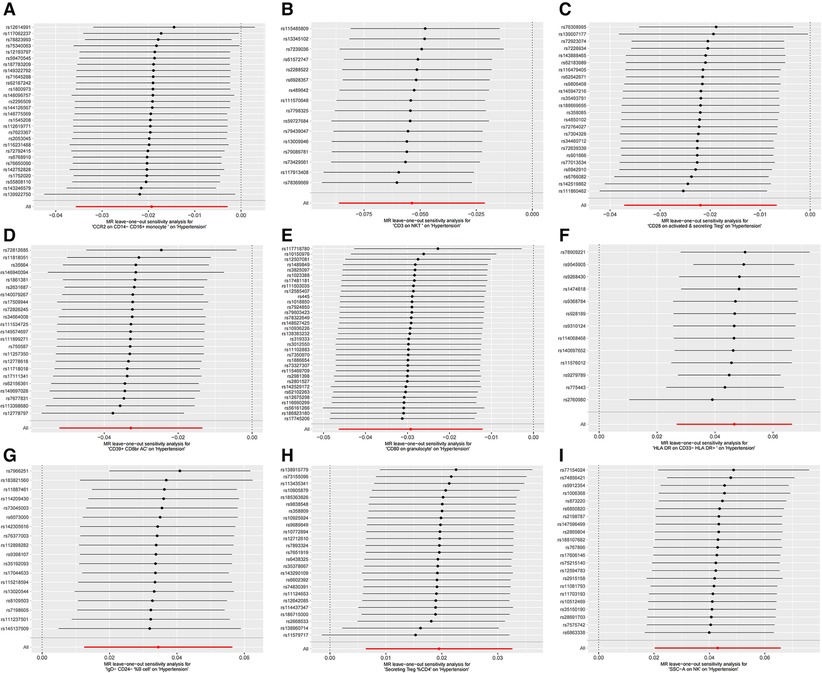
Figure 3. MR leave-one-out sensitivity analysis plots for casual associations between immune cell and HTN risk. (A) Leave-one-out plots for CCR2 on CD14- CD16+ monocyte on hypertension. (B) MR MR leave-one-out sensitivity analysis sensitivity analysis plots for CD3 on NKT on hypertension. (C) Leave-one-out plots for CD28 on activated & secreting Treg on hypertension. (D) MR leave-one-out sensitivity analysis plots for CD39+ CD8br AC on hypertension. (E) MR leave-one-out sensitivity analysis plots for CD80 on granulocyte on hypertension. (F) MR leave-one-out sensitivity analysis plots for HLA DR on CD33- HLA DR+ on hypertension. (G) MR leave-one-out sensitivity analysis plots for IgD- CD24- _B cell on hypertension. (H) MR leave-one-out sensitivity analysis plots for Secreting Treg _CD4 on hypertension. (I) MR leave-one-out sensitivity analysis plots for SSC-A on NK on hypertension.
Exploration of the causal effect of immunophenotypes on HTN
To investigate the impact of HTN on the body's immune system, we conducted an analysis using MR to explore the causal effects of HTN on immune cells. Despite applying multiple test adjustments, we did not observe a statistically significant causal relationship at a false discovery rate (FDR) significance level of 0.05. However, at the nominal significance level, we did detect causal effects of HTN on the levels of 15 immune cells. Specifically, the onset of HTN was found to increase the levels of 5 immune cells and decrease the levels of 10 immune cells. These 7 immune cells are distributed across B cells (15 cells), myeloid cells (3 cells), and TBNK cells (2 cells) (Figure 4, Table 3, Supplementary Table S2).
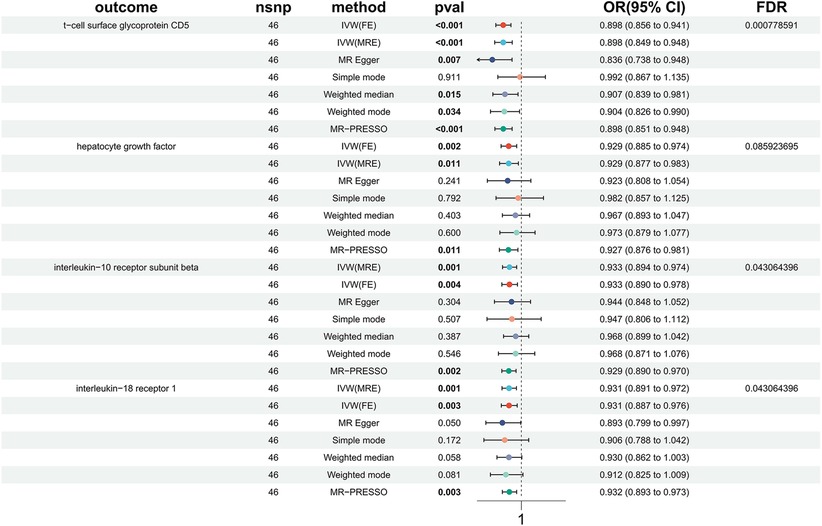
Figure 4. Forest plots of the causal associations between HTN and immune cell.
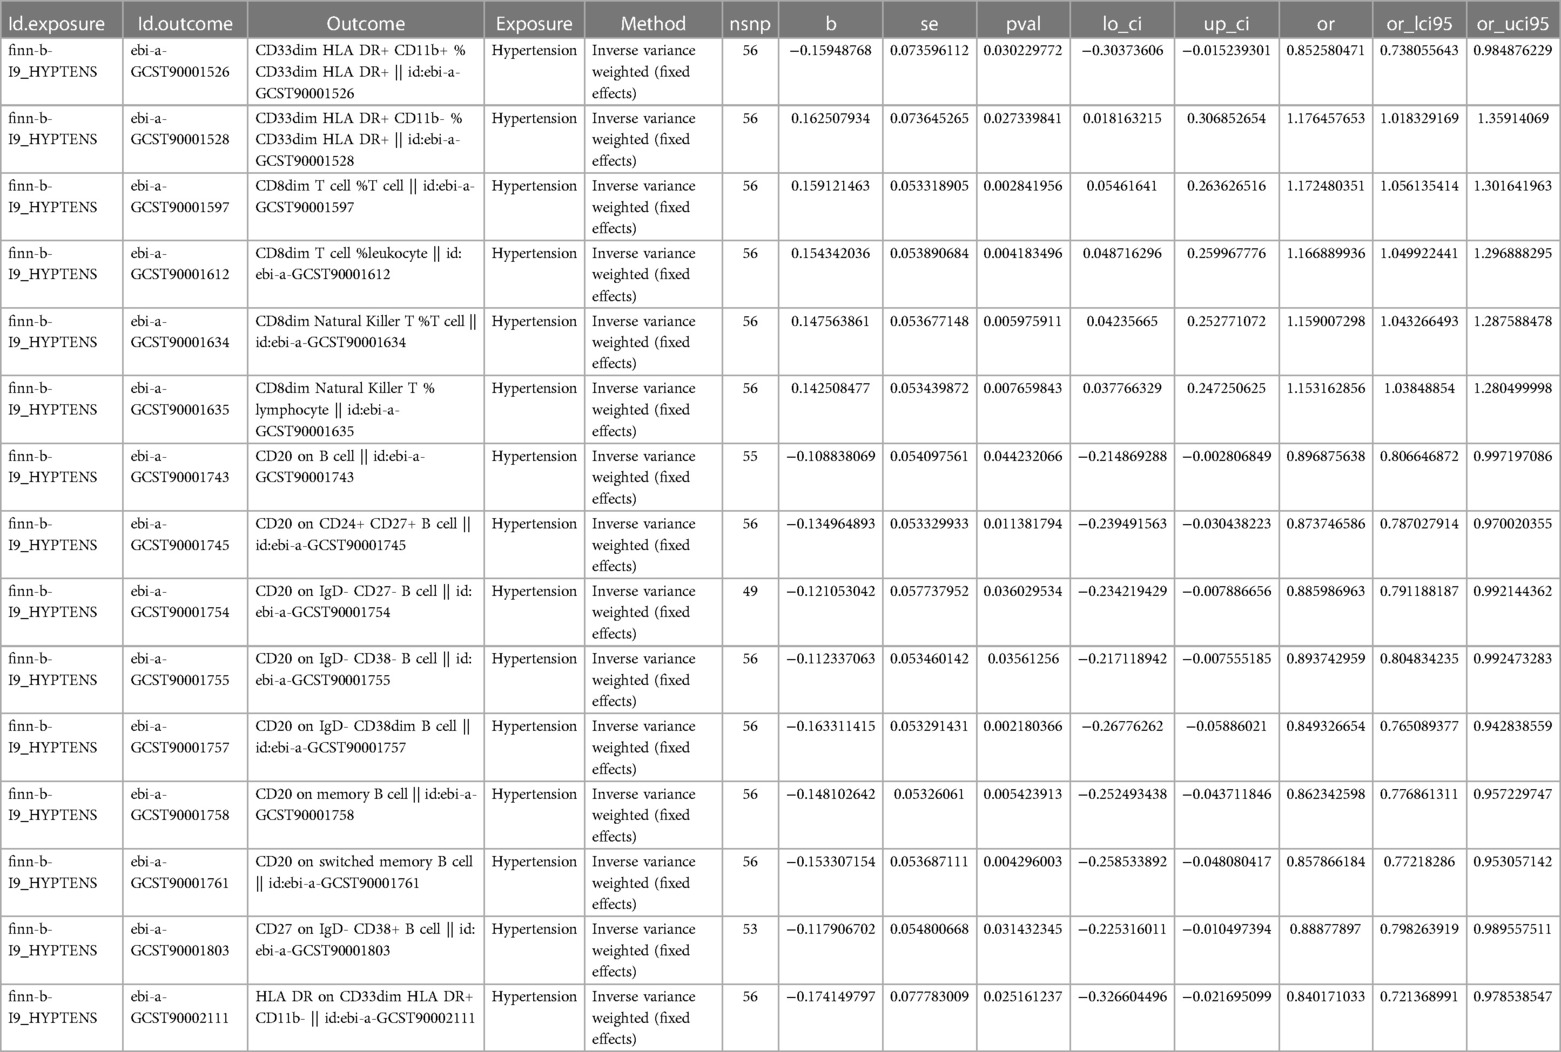
Table 3. Causal effects of immune cell on HTN.
Discussion
HTN is the leading preventable cause of premature death worldwide (21, 22). HTN constitutes a significant risk factor for both ischemic and hemorrhagic stroke, as well as coronary artery disease. Furthermore, individuals affected by HTN are susceptible to the development of kidney failure, heart failure, peripheral vascular disease, and various other medical conditions (23). Over the past twelve years, the utilization of genome-wide association studies (GWAS) and whole exome sequencing (WES) techniques has led to the identification of numerous potential pathways associated with blood pressure. However, the occurrence of consistent associations with HTN remains relatively infrequent (24). These findings are not exclusive to HTN and have been observed in other intricate chronic conditions, including anemia and diabetes, involving pathway gene variants rather than consistent disease variants (25, 26). It is indisputable that numerous countries have advocated for and implemented measures to prioritize HTN as a health concern, exemplified by the 2020 US Surgeon General's directive to regulate HTN (27–29).
With so much attention around the world, and with so many clinical trials demonstrating the efficacy of different classes of antihypertensive drugs (30), HTN is still not completely under control despite improvements in treatment. From the perspective of preventive medicine, the new treatment strategy for HTN is to intervene when blood pressure is normally high, aiming to suppress or even reverse HTN, which is worth looking forward to (31). Providing early treatment in the prehypertension stage may cause the HTN to subside (32). Once HTN occurs, depending on the cause of the disease, intermittent intensive treatment can bring the HTN into remission. We believe that early HTN is a good indication for intermittent treatment. Biomarkers are urgently needed to accurately predict natural disease history and prognosis.
Our study employs a comprehensive integration of large-scale individual and aggregated Genome-Wide Association Study (GWAS) datasets to systematically elucidate the genetic mechanism underlying the immune cell response to the occurrence and progression of HTN. To the best of our knowledge, this is the inaugural MR analysis investigating the causal relationship between multiple immunophenotypes and HTN. Among the four immune features examined in this study, namely Mean Fluorescence Intensity (MFI), Receptor Count (RC), Antibody Count (AC), and Membrane Potential (MP), we identified one immunophenotype that exhibited a significant causal effect on HTN (FDR < 0.05). Additionally, it is worth noting that eight immunophenotypes demonstrated suggestive causal effects on HTN (FDR < 0.2). HTN had suggestive causal effects on 15 immunophenotypes (P < 0.05).
Based on our comprehensive data analysis and extensive research, we have determined that the presence of HLA DR on CD33- HLA DR+ significantly augments the susceptibility to HTN. It is noteworthy that HLA-DR, an MHC class II cell surface receptor, is encoded by the human leukocyte antigen complex situated on the 6P21 region of chromosome 6 (11). There is growing evidence that HTN occurs simultaneously with, and may be caused by, changes in complement, inflammasome activation, and circulating immune cell phenotypes, particularly bone marrow cells. These inflammatory processes are interconnected and ultimately contribute to the adaptive immune system by means of oxidative stress, endogenous protein modification, and perturbed antigen processing and presentation mechanisms (33). There is growing evidence that infiltration of bone marrow cells (especially monocytes/macrophages and T cells) into the arteries and kidneys is an early marker of inflammation (34, 35), and that these cells can produce various inflammatory cytokines that contribute to HTN (36–39). There is an increasing amount of evidence suggesting that HTN is associated with and possibly caused by the activation of complement, inflammasome, and changes in the phenotype of circulating immune cells, particularly bone marrow cells. These inflammatory processes are interconnected and ultimately contribute to the adaptive immune system through oxidative stress, modification of endogenous proteins, and disrupted mechanisms of antigen processing and presentation (40). Increased inflammation within the cardiac regulatory center of the brain is associated with heightened activation of the sympathetic nervous system, leading to elevated blood pressure. Consequently, mitigating this inflammatory response can potentially ameliorate HTN (41). In addition, recent studies have demonstrated that abnormal bone marrow cells can lead to pulmonary HTN (42).
Conclusions
We conclude that immune cells are plausible causal agents of HTN based on our two-way MR analysis. These results offer valuable support to clinical decision-making regarding disease prognosis and treatment, while also guiding the exploration of novel therapeutic interventions. Moreover, they underscore the intricate nature of the interplay between the immune system and HTN. A further advantage of our study is that unavoidable confounding variables, reverse causation, and other relevant factors are effectively mitigated. Even so, it is clear that HTN is complex in its pathogenesis, and that immune cells associated with HTN exhibit clinical heterogeneity. Additionally, solitary treatments frequently fail to yield satisfactory outcomes. Consequently, further investigation is warranted to explore the interplay between innate immune cells and the interaction between innate immune cells and adaptive immune cells in individuals with HTN.
Data availability statement
The original contributions presented in the study are included in the article/Supplementary Material, further inquiries can be directed to the corresponding authors.
Ethics statement
This study was based on publicly available datasets. Ethical review and approval was not required for the study, in accordance with the local legislation and institutional requirements.
Author contributions
XZ: Writing – original draft, Writing – review & editing, Conceptualization, Data curation, Formal Analysis, Methodology, Project administration, Software, Validation, Visualization. GL: Data curation, Software, Writing – review & editing. WW: Writing – review & editing, Conceptualization, Investigation. BL: Investigation, Writing – review & editing, Conceptualization, Funding acquisition, Resources, Writing – original draft.
Funding
The author(s) declare financial support was received for the research, authorship, and/or publication of this article.
The authors received subsequent financial support for the research, authorship, and/or publication of this article from the China Postdoctoral Science Foundation (No. 2020M682119); Natural Science Foundation of Shandong Province (No. ZR2020MH026; No.ZR2021MH019); Postdoctoral Innovation Program of Shandong Province (No. 202102041); Clinical Medicine Science and Technology Innovation Program of Jinan (No. 202019045); Special fund for high-level talents in medical and health industry of Jinan City and the central government guided local special funds for scientific and technological development (YDZX2021116).
Conflict of interest
The authors declare that the research was conducted in the absence of any commercial or financial relationships that could be construed as a potential conflict of interest.
Publisher's note
All claims expressed in this article are solely those of the authors and do not necessarily represent those of their affiliated organizations, or those of the publisher, the editors and the reviewers. Any product that may be evaluated in this article, or claim that may be made by its manufacturer, is not guaranteed or endorsed by the publisher.
Supplementary material
The Supplementary Material for this article can be found online at: https://www.frontiersin.org/articles/10.3389/fcvm.2024.1375704/full#supplementary-material
References
1. NCD Risk Factor Collaboration (NCD-RisC). Worldwide trends in hypertension prevalence and progress in treatment and control from 1990 to 2019: a pooled analysis of 1201 population-representative studies with 104 million participants. Lancet. (2021) 398(10304):957–80. doi: 10.1016/S0140-6736(21)01330-1
2. Guzik TJ, Nosalski R, Maffia P, Drummond GR. Immune and inflammatory mechanisms in hypertension. Nat Rev Cardiol. (2024) 21(6):396–416. doi: 10.1038/s41569-023-00964-1
3. Slivnick J, Lampert BC. Hypertension and heart failure. Heart Fail Clin. (2019) 15(4):531–41. doi: 10.1016/j.hfc.2019.06.007
4. Levy D, Larson MG, Vasan RS, Kannel WB, Ho KK. The progression from hypertension to congestive heart failure. JAMA. (1996) 275(20):1557–62. doi: 10.1001/jama.1996.03530440037034
5. Gunnarsson GT. Hypertension, the silent killer. We can do better. Laeknabladid. (2022) 108(2):69. doi: 10.17992/lbl.2022.02.674
6. Smith GD, Ebrahim S. ‘Mendelian randomization’: can genetic epidemiology contribute to understanding environmental determinants of disease? Int J Epidemiol. (2003) 32(1):1–22. doi: 10.1093/ije/dyg070
7. Davey Smith G, Hemani G. Mendelian randomization: genetic anchors for causal inference in epidemiological studies. Hum Mol Genet. (2014) 23(R1):R89–98. doi: 10.1093/hmg/ddu328
8. Timpson NJ, Wade KH, Smith GD. Mendelian randomization: application to cardiovascular disease. Curr Hypertens Rep. (2012) 14(1):29–37. doi: 10.1007/s11906-011-0242-7
9. Smith GD, Ebrahim S. Mendelian randomization: prospects, potentials, and limitations. Int J Epidemiol. (2004) 33(1):30–42. doi: 10.1093/ije/dyh132
10. Bowden J, Holmes MV. Meta-analysis and Mendelian randomization: a review. Res Synth Methods. (2019) 10(4):486–96. doi: 10.1002/jrsm.1346
11. Wang C, Zhu D, Zhang D, Zuo X, Yao L, Liu T, et al. Causal role of immune cells in schizophrenia: Mendelian randomization (MR) study. BMC Psychiatry. (2023) 23(1):590. doi: 10.1186/s12888-023-05081-4
12. Li J, Niu Q, Wu A, Zhang Y, Hong L, Wang H. Causal relationship between circulating immune cells and the risk of type 2 diabetes: a Mendelian randomization study. Front Endocrinol (Lausanne). (2023) 14:1210415. doi: 10.3389/fendo.2023.1210415
13. Orrù V, Steri M, Sidore C, Marongiu M, Serra V, Olla S, et al. Complex genetic signatures in immune cells underlie autoimmunity and inform therapy. Nat Genet. (2020) 52(10):1036–45. doi: 10.1038/s41588-020-0684-4
14. Sidore C, Busonero F, Maschio A, Porcu E, Naitza S, Zoledziewska M, et al. Genome sequencing elucidates Sardinian genetic architecture and augments association analyses for lipid and blood inflammatory markers. Nat Genet. (2015) 47(11):1272–81. doi: 10.1038/ng.3368
15. Yu XH, Yang YQ, Cao RR, Bo L, Lei SF. The causal role of gut microbiota in development of osteoarthritis. Osteoarthritis Cartilage. (2021) 29(12):1741–50. doi: 10.1016/j.joca.2021.08.003
16. Yavorska OO, Burgess S. Mendelian randomization: an R package for performing Mendelian randomization analyses using summarized data. Int J Epidemiol. (2017) 46(6):1734–9. doi: 10.1093/ije/dyx034
17. Burgess S, Small DS, Thompson SG. A review of instrumental variable estimators for Mendelian randomization. Stat Methods Med Res. (2017) 26(5):2333–55. doi: 10.1177/0962280215597579
18. Hartwig FP, Davey Smith G, Bowden J. Robust inference in summary data Mendelian randomization via the zero modal pleiotropy assumption. Int J Epidemiol. (2017) 46(6):1985–98. doi: 10.1093/ije/dyx102
19. Verbanck M, Chen CY, Neale B, Do R. Detection of widespread horizontal pleiotropy in causal relationships inferred from Mendelian randomization between complex traits and diseases. Nat Genet. (2018) 50(5):693–8. doi: 10.1038/s41588-018-0099-7
20. Bowden J, Davey Smith G, Haycock PC, Burgess S. Consistent estimation in Mendelian randomization with some invalid instruments using a weighted median estimator. Genet Epidemiol. (2016) 40(4):304–14. doi: 10.1002/gepi.21965
21. Manosroi W, Williams GH. Genetics of human primary hypertension: focus on hormonal mechanisms. Endocr Rev. (2019) 40(3):825–56. doi: 10.1210/er.2018-00071
22. Zou Z, Cini K, Dong B, Ma Y, Ma J, Burgner DP, et al. Time trends in cardiovascular disease mortality across the BRICS: an age-period-cohort analysis of key nations with emerging economies using the global burden of disease study 2017. Circulation. (2020) 141(10):790–9. doi: 10.1161/CIRCULATIONAHA.119.042864
23. Mills KT, Bundy JD, Kelly TN, Reed JE, Kearney PM, Reynolds K, et al. Global disparities of hypertension prevalence and control: a systematic analysis of population-based studies from 90 countries. Circulation. (2016) 134(6):441–50. doi: 10.1161/CIRCULATIONAHA.115.018912
24. Warren HR, Evangelou E, Cabrera CP, Gao H, Ren M, Mifsud B, et al. Genome-wide association analysis identifies novel blood pressure loci and offers biological insights into cardiovascular risk. Nat Genet. (2017) 49(3):403–15. doi: 10.1038/ng.3768
25. Chami N, Lettre G. Lessons and implications from genome-wide association studies (GWAS) findings of blood cell phenotypes. Genes (Basel). (2014) 5(1):51–64. doi: 10.3390/genes5010051
26. Kodama S, Fujihara K, Ishiguro H, Horikawa C, Ohara N, Yachi Y, et al. Quantitative relationship between cumulative risk alleles based on genome-wide association studies and type 2 diabetes mellitus: a systematic review and meta-analysis. J Epidemiol. (2018) 28(1):3–18. doi: 10.2188/jea.JE20160151
27. Olsen MH, Angell SY, Asma S, Boutouyrie P, Burger D, Chirinos JA, et al. A call to action and a lifecourse strategy to address the global burden of raised blood pressure on current and future generations: the lancet commission on hypertension. Lancet. (2016) 388(10060):2665–712. doi: 10.1016/S0140-6736(16)31134-5
28. Substance A, Mental Health Services A, Office of the Surgeon G. Publications and Reports of the Surgeon General. The Surgeon General’s Call to Action to Control Hypertension. Washington, DC: US Department of Health and Human Services (2020).
29. Kotsis V, Jordan J, Micic D, Finer N, Leitner DR, Toplak H, et al. Obesity and cardiovascular risk: a call for action from the European society of hypertension working group of obesity, diabetes and the high-risk patient and European Association for the study of obesity: part A: mechanisms of obesity induced hypertension, diabetes and dyslipidemia and practice guidelines for treatment. J Hypertens. (2018) 36(7):1427–40. doi: 10.1097/HJH.0000000000001730
30. Pfeffer MA, McMurray JJ. Lessons in uncertainty and humility—clinical trials involving hypertension. N Engl J Med. (2016) 375(18):1756–66. doi: 10.1056/NEJMra1510067
31. Touyz RM, Schiffrin EL. A compendium on hypertension: new advances and future impact. Circ Res. (2021) 128(7):803–7. doi: 10.1161/CIRCRESAHA.121.319181
32. Kanegae H, Oikawa T, Kario K. Should pre-hypertension be treated? Curr Hypertens Rep. (2017) 19(11):91. doi: 10.1007/s11906-017-0789-z
33. Xiao L, Harrison DG. Inflammation in hypertension. Can J Cardiol. (2020) 36(5):635–47. doi: 10.1016/j.cjca.2020.01.013
34. Lin QY, Bai J, Zhang YL, Li HH. Integrin CD11b contributes to hypertension and vascular dysfunction through mediating macrophage adhesion and migration. Hypertension. (2023) 80(1):57–69. doi: 10.1161/HYPERTENSIONAHA.122.20328
35. Takebayashi S. Ultrastructural studies on glomerular lesions in experimental hypertension. Acta Pathol Jpn. (1969) 19(2):179–200. doi: 10.1111/j.1440-1827.1969.tb00701.x
36. Caillon A, Paradis P, Schiffrin EL. Role of immune cells in hypertension. Br J Pharmacol. (2019) 176(12):1818–28. doi: 10.1111/bph.14427
37. Wang L, Zhao XC, Cui W, Ma YQ, Ren HL, Zhou X, et al. Genetic and pharmacologic inhibition of the chemokine receptor CXCR2 prevents experimental hypertension and vascular dysfunction. Circulation. (2016) 134(18):1353–68. doi: 10.1161/CIRCULATIONAHA.115.020754
38. Wenzel P, Knorr M, Kossmann S, Stratmann J, Hausding M, Schuhmacher S, et al. Lysozyme M-positive monocytes mediate angiotensin II-induced arterial hypertension and vascular dysfunction. Circulation. (2011) 124(12):1370–81. doi: 10.1161/CIRCULATIONAHA.111.034470
39. Guzik TJ, Hoch NE, Brown KA, McCann LA, Rahman A, Dikalov S, et al. Role of the T cell in the genesis of angiotensin II induced hypertension and vascular dysfunction. J Exp Med. (2007) 204(10):2449–60. doi: 10.1084/jem.20070657
40. Rucker AJ, Rudemiller NP, Crowley SD. Salt, hypertension, and immunity. Annu Rev Physiol. (2018) 80:283–307. doi: 10.1146/annurev-physiol-021317-121134
41. Xue B, Thunhorst RL, Yu Y, Guo F, Beltz TG, Felder RB, et al. Central renin-angiotensin system activation and inflammation induced by high-fat diet sensitize angiotensin II-elicited hypertension. Hypertension. (2016) 67(1):163–70. doi: 10.1161/HYPERTENSIONAHA.115.06263
Keywords: Mendelian randomization, immune cell, hypertension, prehypertension, two-sample mendelian randomization
Citation: Zhang X, Li G, Wu W and Li B (2024) Causal role of immune cells in hypertension: a bidirectional Mendelian randomization study. Front. Cardiovasc. Med. 11:1375704. doi: 10.3389/fcvm.2024.1375704
Received: 24 January 2024; Accepted: 10 May 2024;
Published: 27 May 2024.
Edited by:
Aifeng Zhang, Boston Medical Center, United StatesReviewed by:
Xueying Zhao, The Second Hospital of Shandong University, ChinaChunliu Li, Yantai Affiliated Hospital of Binzhou Medical University, China
Libo Zhou, Shandong University, China
© 2024 Zhang, Li, Wu and Li. This is an open-access article distributed under the terms of the Creative Commons Attribution License (CC BY). The use, distribution or reproduction in other forums is permitted, provided the original author(s) and the copyright owner(s) are credited and that the original publication in this journal is cited, in accordance with accepted academic practice. No use, distribution or reproduction is permitted which does not comply with these terms.
*Correspondence: Bin Li, lb1205@zxyy.cn