The relative potential contribution of volume load and vascular mechanisms to hypertension in non-dialysis and dialysis chronic kidney disease patients
 Grace Tade1,† Hon-Chun Hsu1,2,† Chanel Robinson1 Noluntu Dlongolo3 Gloria Teckie4 Ahmed Solomon5
  Patrick Hector Dessein1,3,5*†
- 1Cardiovascular Pathophysiology and Genomics Research Unit, Faculty of Health Sciences, School of Physiology, University of the Witwatersrand, Johannesburg, South Africa
- 2Nephrology Unit, Milpark Hospital, Johannesburg, South Africa
- 3Rheumatology Unit, Rosebank Hospital, Johannesburg, South Africa
- 4Division of Nephrology, Department of Medicine, Chris Hani Baragwanath Hospital and Faculty of Health Sciences, University of Witwatersrand, Johannesburg, South Africa
- 5Internal Medicine Department, University of the Witwatersrand, Johannesburg, South Africa
Background: Hypertension is highly prevalent and particularly difficult to treat adequately in patients with chronic kidney disease (CKD). The relative contribution of volume overload and vascular mechanisms to blood pressure measures in CKD and whether these effects differ in non-dialysis compared to dialysis patients is unknown.
Methods: We determined the potential impact of volume load (stroke volume) and vascular mechanisms (inverse of total arterial compliance (inv TAC) and systemic vascular resistance (SVR)) on mean and brachial and aortic systolic blood pressures in 67 non-dialysis and 48 dialysis chronic kidney disease (CKD) patients. Relationships were determined in confounder adjusted regression models.
Results: Stroke volume (p value = 0.003) was more strongly associated with mean arterial pressure than SVR (p value = 0.9) (p value for difference = 0.03). When stroke volume and SVR were entered in the same regression model (model R2 = 0.324), they contributed equally to the variation in mean arterial pressure (p value for difference = 0.5). Stroke volume (p value ≤ 0.002) and inv TAC (p value ≤ 0.001) contributed equally to the variation in systolic pressures (p value for difference ≥ 0.9). When stroke volume and inv TAC were entered in the same regression model (model R2 = 0.752 to 0.765), they contributed equally to the variation in systolic blood pressures (p value for difference = 0.7). Stroke volume, TAC and SVR were similar (p value ≥ 0.5) and associated to the same extent with blood pressure measures in non-dialysis and dialysis CKD patients (p value for difference ≥ 0.1). In receiver operator characteristic curve analysis, elevated systolic blood pressure was determined by stroke volume (p value = 0.005) and inv TAC (p value = 0.03) but not SVR (p value = 0.8). The calculated power of the study was 0.999 based on α = 0.05.
Conclusions: The present investigation suggests that both volume load and vascular mechanisms should be considered in the management of hypertension among patients with CKD. The extent and relative potential impact of volume load and vascular mechanisms on blood pressure measures are as large in non-dialysis compared to dialysis CKD patients.
Introduction
Hypertension is both a major cause and consequence of chronic kidney disease (1–4). Accordingly, hypertension is known to occur in 70% of non-dialysis (5) and 60%–90% of dialysis CKD patients (6). Up to 87% of patients with CKD and hypertension experience inadequate blood pressure control (7). Hypertension in CKD patients is caused by structural changes and consequent increased sodium retention, activation of the renin-angiotensin-aldosterone and sympathetic nervous systems, endothelial dysfunction and the use of erythropoietin stimulating agents (8, 9). The contemporary view is that each of these causes engender increased blood pressure through vascular mechanisms including reduced aortic compliance and increased peripheral or systemic vascular resistance or/and extracellular fluid expansion (8–10). However, the pathophysiology of hypertension in chronic kidney disease remains markedly under investigated (11).
In population studies that were performed in high income countries, hypertension was found to be mediated by impaired vascular mechanisms rather than volume overload (12, 13). In fact, volume load is reportedly either unaltered or reduced in hypertension (10, 14). In CKD patients, marked arteriosclerosis that is particularly due to the replacement of elastin by collagen and aberrant bone mineral metabolism induced vascular calcification is highly prevalent (13). This results in substantially increased aortic stiffness (15). However, in addition to impaired vascular mechanisms, volume overload associates with blood pressure in both non-dialysis (16) and dialysis CKD patients (17). The prevalence of volume overload is ∼45% in non-dialysis (16) and 50% in dialysis CKD patients (17). Improved volume control through frequent or/and long dialysis sessions has a profound beneficial impact on hypertension in patients with end-stage renal disease or kidney failure (6, 17, 18).
Both steady state (mean arterial or distending pressure) and pulsatile (systolic, diastolic and pulse pressure) components of blood pressure impact cardiovascular risk in hypertension (10, 19–23). In patients with CKD, the most documented contributing blood pressure component to cardiovascular risk is high systolic blood pressure (24). The 2021 Kidney Disease: Improving Global Outcomes (KDIGO) guideline now recommend to target systolic blood pressure control in patients with CKD (24). Also, compared to brachial or peripheral blood pressures, aortic or central blood pressures are more strongly associated with cardiovascular events (25). Increased steady state or mean arterial pressure is particularly associated with chronic kidney disease progression (26, 27).
Improvement in our understanding of the pathophysiology of hypertension in CKD patients is needed to achieve more optimal and appropriate blood pressure control (11). In this regard, the relative contribution of volume overload and vascular mechanisms as well as their interactions to increases in blood pressure in patients with CKD is currently unknown. Also, to what extent the pathophysiology of hypertension differs in non-dialysis compared to dialysis CKD patients awaits elucidation. In the present study, we first assessed the confounder adjusted and mutually independent potential impact of volume load (stroke volume) and vascular mechanisms (total arterial compliance and systemic vascular resistance) on peripheral and central systolic blood pressure as well as mean arterial pressure in CKD patients. We subsequently determined whether the extent and potential effects of volume load and vascular mechanisms on blood pressure measures differ in non-dialysis compared to dialysis patients.
Patients and methods
Patients
The current study was performed in accordance with the Helsinki declaration as revised in 2013. The University of Witwatersrand Human (Medical) Research Committee approved the protocol (protocol number: M15-08-43). Each patient provided informed written consent prior to participation. The study design was reported previously (28–30). One hundred and fifteen patients participated. These comprised 67 non-dialysis and 48 dialysis patients. Patients with active infection or/and cancer, previously diagnosed heart failure and a Chronic Kidney Disease Epidemiology Collaboration estimated glomerular filtration rate (eGFR) of ≥60 ml/min/1.73 m2 were excluded.
Baseline recorded characteristics
Methods that were employed in this study have been reported previously (28–30). Recorded baseline characteristics comprised demographic features, anthropometric measures, major traditional cardiovascular risk factors, non-traditional or renal cardiovascular risk factors and the use of cardiovascular drugs and erythropoietin stimulating agents. Established cardiovascular disease comprised ischemic heart disease (acute myocardial infarction, percutaneous transluminal coronary angioplasty and coronary artery bypass graft), cerebrovascular disease (stroke and transient ischemic attack) and peripheral vascular disease, the presence of which was confirmed by a cardiologist, neurologist and vascular surgeon, respectively. All investigations were performed on a single day. In dialysis patients, this was done on a day prior to a haemodialysis session. Dialysis was performed thrice weekly using 4-hour sessions. Most dialysis patients (72.9%) had an arteriovenous fistula (68.7%) or arteriovenous graft (4.2%). All patients were in sinus rhythm at the time of investigation.
Hemodynamic characteristics
Mean arterial pressure for the peripheral waveform was determined electronically by the SphygmoCor device (see below) and using the formula
where T0 = start of the waveform; TF = end of the waveform; Pi = pressure points and n = number of pressure points.
Central systolic blood pressure and forward wave pressure were determined using a high-fidelity SPC-301 micromanometer (Miller instrument, Inc., Houston, Texas), interfaced with a computer using SpygmoCor software, version 9.0 (AtCor Medical Pty. Ltd., West Ryde, New South Wales, Australia), as previously reported (31, 32). After resting for 15 min in the supine position, arterial waveforms at the radial (dominant arm), carotid and femoral artery were recorded for a time period of ten consecutive waveforms (heart beats). Calibration of the pulse wave was done by manual measurement (auscultation) of the brachial blood pressure taken immediately prior to recordings. A validated generalized transfer function incorporated in the SphygmoCor software was used to convert the peripheral pressure waveform into a central aortic waveform. The results were discarded when systolic and diastolic variability of consecutive waveforms exceeded 5% or the amplitude of the pulse wave signal was less than 80 mV. All measurements were made by single experienced observer (CR) who was unaware of the cardiovascular risk factor profiles of the patients. Technically sound measurements of the central pressure wave were obtained in 109 patients. Brachial or peripheral blood pressure were recorded in all patients employing the oscillometric SunTech device (SunTech Medical, USA) (33). Recorded peripheral blood pressure in this study represents the average of ≥3 measurements taken at least 30 s apart after sitting quietly for at least five minutes. The optimal systolic blood pressure target in CKD is currently uncertain (34). In the present study, a systolic blood pressure of ≥130 mmHg was considered elevated.
Echocardiography was performed in accordance with the American Society of Echocardiography convention (35) and employing a Philips CX50 POC Compact CompactXtreme Ultrasound System [Philips Medical Systems (Pty) Ltd, USA] equipped with a 1.8–4.2 MHz probe that allowed for M-mode, 2-D and tissue Doppler measurements, as previously described (30). Patients were examined in the partial left decubitus position. We assessed left ventricular geometry and systolic (lateral s' and midwall fractional shortening as measures of longitudinal and circumferential myocardial contractility, respectively, and ejection fraction as an index of chamber or pump function) function.
Left ventricular dimensions were determined by measuring the left ventricular internal end diastolic and end systolic diameters and wall thickness (left ventricular septal and posterior wall thickness) in the parasternal long axis view by two-dimensional directed M-mode echocardiography. The Teichholz method was used to assess left ventricular end diastolic volume. Stroke volume was determined from the difference between left ventricular end diastolic and systolic volumes as evaluated upon employing the Z-derived method. Cardiac output was determined as stroke volume × heart rate. Left ventricular midwall fractional shortening was assessed using the previously reported formula as [(LVIDed + 0.5 Hed) − LVIDes + 0.5 Hes)]/LVIDed + 0.5 Hed) where LVID is left ventricular internal diameter, H is wall thickness (mean of septal + posterior wall thickness), ed is end diastole and es is end systole (36, 37). Left ventricular ejection fraction was calculated as [(left ventricular end diastolic volume − left ventricular end systolic volume)/left ventricular end diastolic volume] × 100. Systemic vascular resistance was calculated as (mean arterial pressure − right atrial pressure)/cardiac output, assuming the right arterial pressure is 0 mmHg. Heart rate was determined from the length of an averaged peripheral waveform captured over a 10 s period, using the formula: 1,000/the length of an averaged peripheral waveform captured over a 10 s period ×60. Total arterial compliance (TAC) was calculated as stroke volume/central or aortic pulse pressure.
Echocardiographic measurements were made by the same observer that performed the arterial function evaluation. Intra-observer echocardiographic measurement variability is low in our setting with Pearson's correlation coefficients and variances (mean % difference (SD)) for left ventricular end-diastolic diameter, septal wall thickness, posterior wall thickness, E and e' of 0.92, 0.72, 0.76, 0.88 and 0.93 (p < 0.0001 for all), and −0.41 (4.16), 0.45 (7.74), 1.74 (6.08), 0.16 (9.95) and −1.46 (8.58), respectively.
Data analysis
Results are expressed as mean (SD), median (interquartile range) or proportions as appropriate. Non-normally distributed variables were logarithmically transformed prior to entering them in linear multivariable regression models.
Data among subgroups including non-dialysis vs. dialysis patients and those with controlled vs. uncontrolled systolic blood pressure were compared in age, sex and black population origin adjusted models. Potential confounders for subsequent multivariate analysis were also identified in age, sex and black population origin adjusted models. Black population origin was included in regression models because the mean (SD) mean and central as well as peripheral systolic blood pressure were or tended to be consistently larger in black patients compared to those from other population origins (105 (14) mmHg vs. 100 (11) mmHg (p-Value = 0.06), 136 (22) mmHg vs. 127 (17) mm Hg (p-Value = 0.006) and 148 (24) mmHg vs. 137 (18) mmHg (p-Value = 0.004)), respectively.
Associations of stroke volume and vascular mechanisms (systemic vascular resistance and total arterial compliance) with mean and central and peripheral systolic blood pressure were assessed in confounder adjusted models. These relationships were also analysed in stratified analysis by dialysis status. They were also re-evaluated in a sensitivity analysis among patients without established cardiovascular disease. The associations of stroke volume and vascular mechanisms with elevated systolic blood pressure were determined in receiver operator characteristic (ROC) curve analysis.
As only 27.1% (n = 13) of dialysis patients did not have an arteriovenous fistula or graft, we did not compare the associations of stroke volume and vascular mechanisms with blood pressure measures in appropriately adjusted multivariate analysis between patients with and without the respective vascular access mode.
The data were analysed on IBM SPSS statistical program (version 27.0, IBM, USA) and Statistica 8.0 application package (version 14.0, TIBCO, USA). The power of this study was calculated using STATA (version 18, Stata Corp, USA).
Results
Recorded baseline characteristics in non-dialysis and dialysis patients
The baseline characteristics in non-dialysis and dialysis patients are shown in Table 1. Black patients were more frequently on dialysis, whereas white patients did more often not require dialysis. Dialysis patients exercised more frequently than their non-dialysis counterparts. Phosphate and parathyroid hormone concentrations were larger, whereas haemoglobin levels were lower in dialysis compared to non-dialysis patients. Dialysis patients used calcium channel blockers, diuretics and erythrocyte stimulating agents more often than those that were not on dialysis. Sodium-glucose cotransporter-2 inhibitors were not available in South Africa at the time of the study (2016) and hence not used in the present cohort.
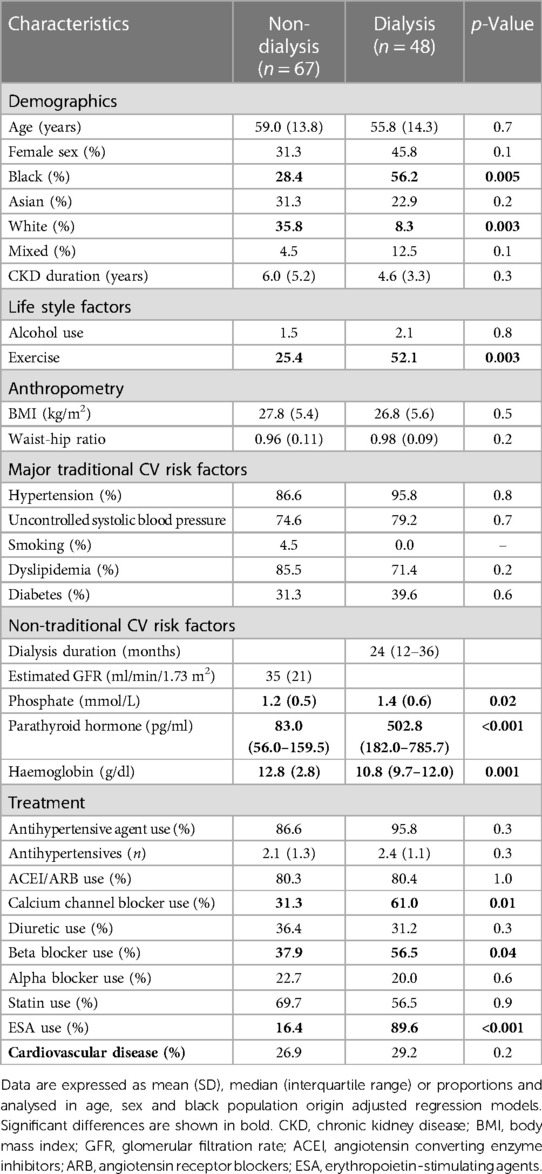
Table 1. Baseline recorded characteristics in non-dialysis and dialysis patients.
Hemodynamic characteristics in non-dialysis and dialysis patients
The hemodynamic characteristics in non-dialysis and dialysis patients are given in Table 2. Central systolic blood pressure was larger in dialysis compared to non-dialysis patients. The other recorded hemodynamic characteristics did not differ among the two groups.
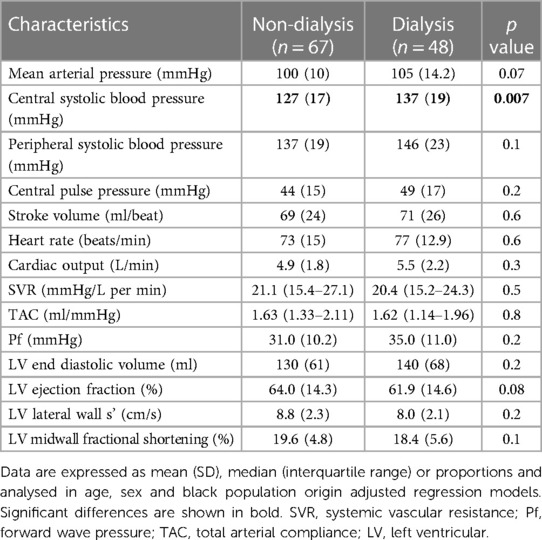
Table 2. Hemodynamic characteristics in non-dialysis and dialysis patients.
Associations of baseline characteristics with blood pressure measures at p value ≤ 0.1 in all, non-dialysis or/and dialysis patients
Data analysis aimed at identifying potential confounders for subsequent multivariate analysis was performed in all and non-dialysis as well as dialysis patients. Table 3 shows that age, sex, black population origin, exercising status, diabetes, haemoglobin levels and erythrocyte stimulating agents were each associated at p value ≤ 0.1 with one or more blood pressure measures in all, non-dialysis or/and non-dialysis patients.
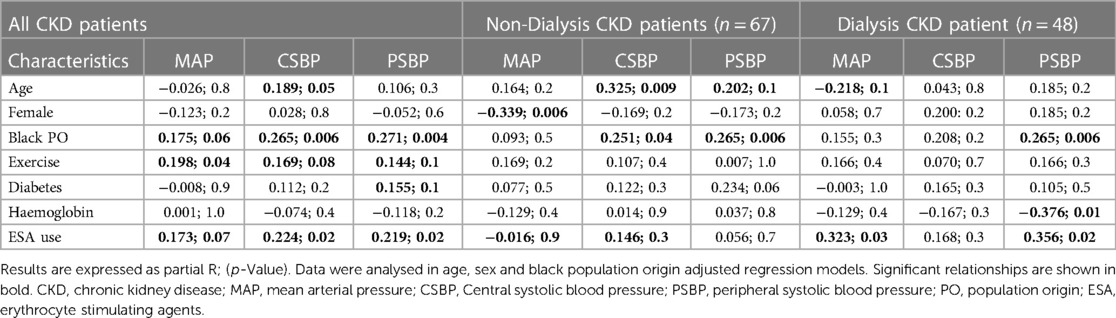
Table 3. Associations of baseline characteristics with blood pressure measures at p value ≤ 0.1.
Potential determinants of mean arterial pressure in CKD patients
Table 4 gives the relative contributions of cardiac output, stroke volume and systemic vascular resistance to the variation in mean arterial blood pressure in all included patients. None of the baseline characteristics were independently associated with mean arterial pressure (first model). Baseline characteristics explained only 10.5% (model R2 = 0.105) of the variation in mean arterial pressure. When cardiac output (second model) or stroke volume (fourth model) were added to the model, both these characteristics were independently associated with mean arterial pressure and the model R2 increased to 0.190 and 0.179, respectively. When stroke volume was replaced by stroke volume indexed to body surface area in the fourth model, the results were unaltered (model R2 = 0.190, standardised β = 0.280, p value = 0.004). By contrast, neither heart rate (third model) nor systemic vascular resistance (fifth model) was related to mean arterial pressure and, accordingly, the model R2 remained unchanged upon entering these characteristics. When systemic vascular resistance was re-calculated on the assumption that right atrial pressure was 10 mmHg (30) in the fifth model, the results were unaltered (model R2 = 110, standardised β = 0.020, p value = 0.8). When stroke volume and systemic vascular resistance were entered into the same model (sixth model), both characteristics were strongly and to a similar extent associated with mean arterial pressure. The respective model R2 increased to 0.324. In this regard, stroke volume and systemic vascular resistance were strongly interrelated (Spearman's rho = −0.797, p value < 0.001). Upon entering stroke volume x systemic vascular resistance without (seventh model) and with (eighth model) the individual interaction terms, the model R2 remained unaltered. In the latter model, only the interaction between stroke volume and systemic vascular resistance tended to be associated (p value = 0.05) with mean arterial pressure. The partial correlations (95% confidence intervals) for the relationships in Table 4 are shown in Figure 1A.
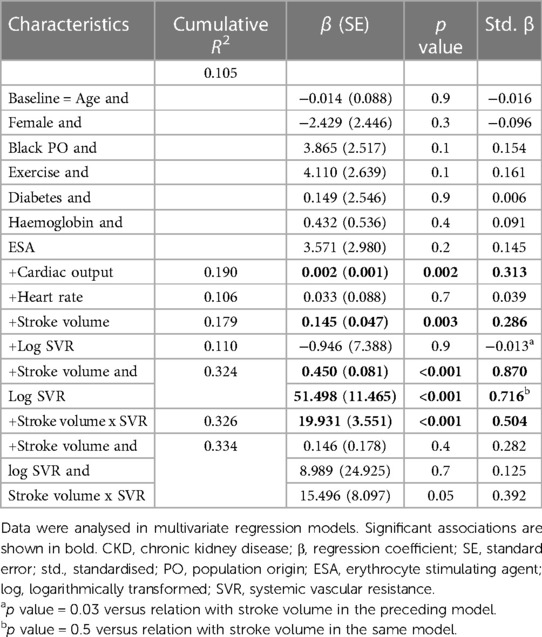
Table 4. Potential determinants of mean arterial pressure in CKD patients.
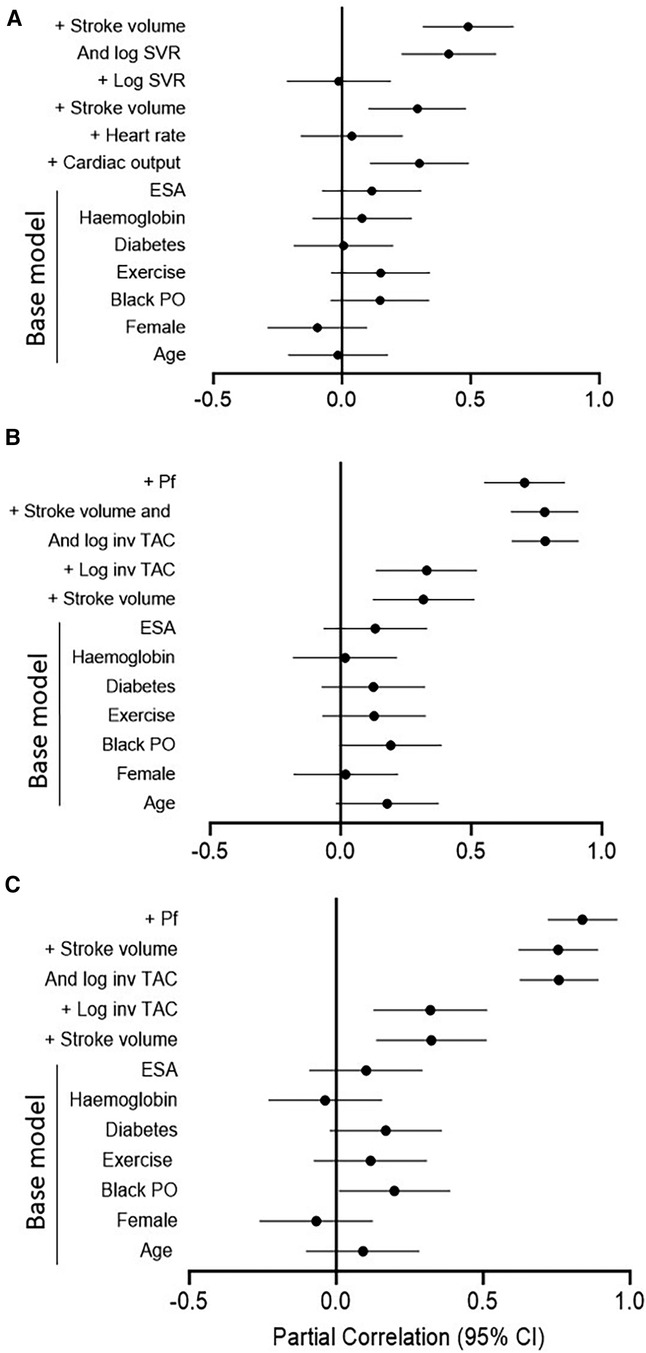
Figure 1. Partial correlations for the models in Table 4 (A) and Table 5 (B for central systolic blood pressure and C for peripheral systolic blood pressure). Log, logarithmically transformed; SVR, systemic vascular resistance; ESA, erythrocyte stimulating agents; PO, population origin; Pf, forward wave pressure; TAC, total arterial compliance.
Based on the sample size of 115 patients, α = 0.05 and 10 covariates in multiple regression models, the calculated power of the study was 0.999. This was established using the associations with mean arterial pressure.
Potential determinants of central and peripheral systolic blood pressure in CKD patients
Table 5 gives the relative contributions of stroke volume and the inverse of TAC (inv TAC) to the variation in central and peripheral systolic blood pressure in all included patients. Among the baseline characteristics, only black population origin tended to be (p value = 0.05) associated and was related to (p value = 0.04) central and systolic blood pressure, respectively. In the respective models, baseline characteristics explained ∼16% of the variation in systolic blood pressures. When stroke volume or inv TAC were added to the model, both these characteristics were independently associated with systolic blood pressures and the model R2 increased to 0.246 to 0.266. When stroke volume and inv TAC were entered into the same model, both characteristics were strongly and to a similar extent associated with systolic blood pressures. The respective model R2 increased to 0.708 for central systolic blood pressure and 0.685 for peripheral systolic blood pressure. In this regard, stroke volume and inv TAC were strongly interrelated (Spearman correlation coefficient = −0.581, p value < 0.001). Upon entering stroke volume x inv TAC without and with the individual interaction terms, the model R2 increased further from 0.752 to 0.771. In the latter models, only the interaction between stroke volume and inv TAC were associated with systolic blood pressures (p value < 0.001 for both). In parallel to these findings, Pf was strongly associated with systolic blood pressures with a model R2 of 0.910 and 0.929 for central and peripheral systolic blood pressure, respectively. The partial correlations (95% confidence intervals) for the relationships in Table 5 are shown in Figures 1B,C.
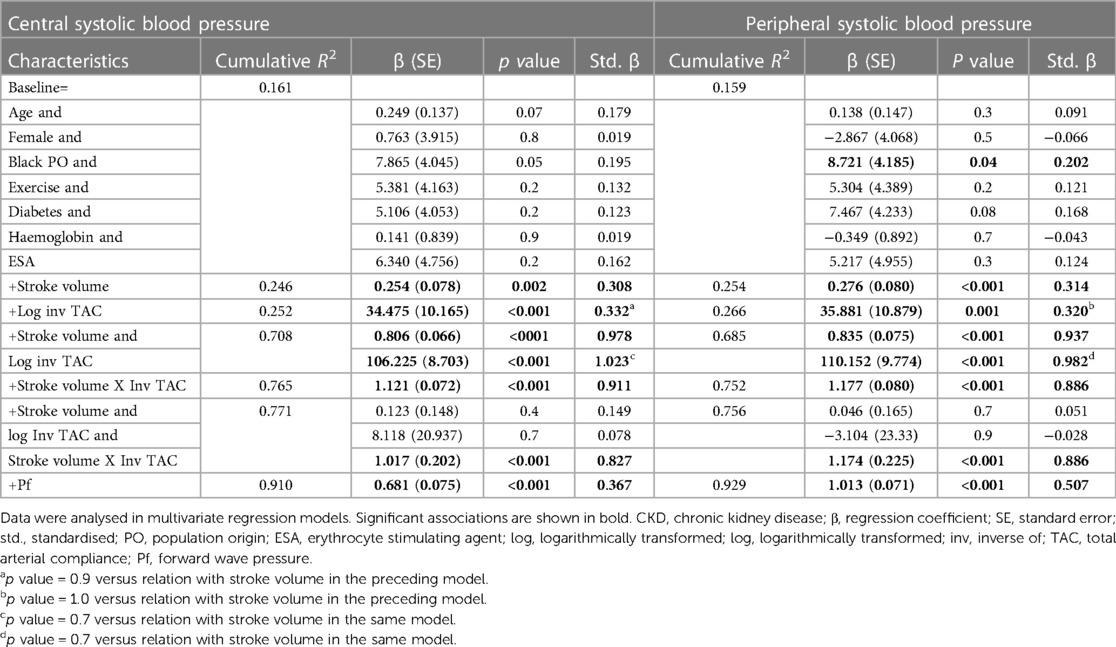
Table 5. Potential determinants of central and peripheral systolic blood pressure in CKD patients.
Based on the sample size of 115 patients, α = 0.05 and 10 covariates in multiple regression models, the calculated power was 0.999. This was established using the associations with both central and peripheral blood pressure.
Potential impact of stroke volume and vascular mechanisms on blood pressure measures in non-dialysis and dialysis patients
Table 6 gives the mutually independent impact of stroke volume and vascular mechanisms on the variation in blood pressure measures in confounder adjusted stratified analysis by dialysis status. The relative contribution of stroke volume and vascular mechanisms (systemic vascular resistance and inv TAC) to the variation in mean arterial blood pressure and central as well as peripheral systolic blood pressure were assessed in models that included both characteristics. The relative potential impact of stroke volume and vascular mechanisms on blood pressure measures was similar in each of these models. Also, the potential impact of stroke volume and vascular mechanisms on blood pressure measures was consistently similar in non-dialysis and dialysis patients. The partial correlations (95% confidence intervals) for the relationships in Table 6 are shown in Figure 2.
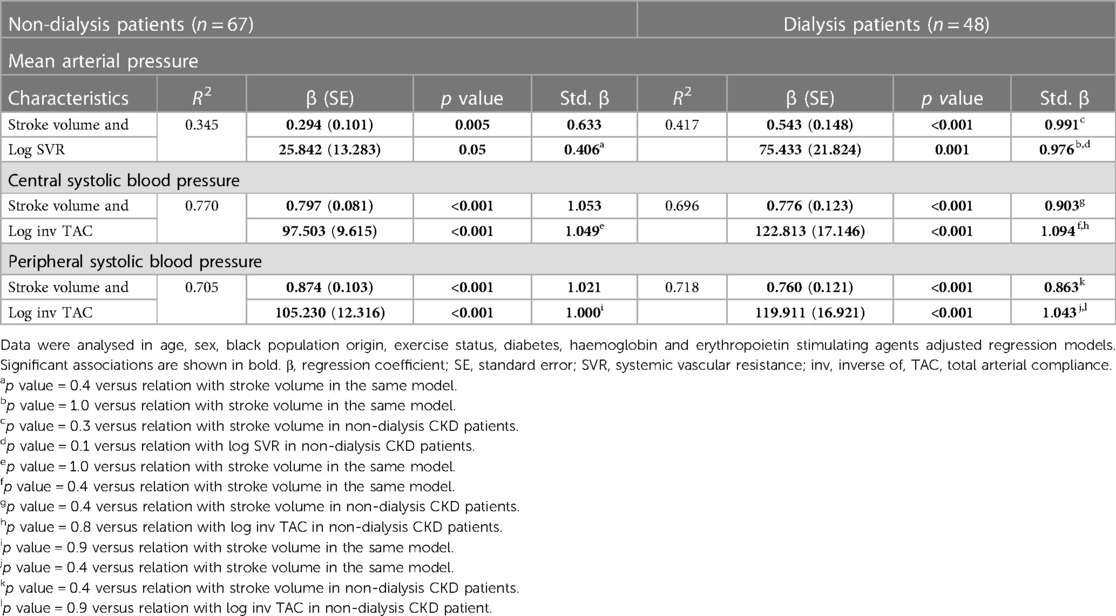
Table 6. Potential impact of stroke volume and vascular mechanisms on blood pressure measures in non-dialysis compared to dialysis patients.
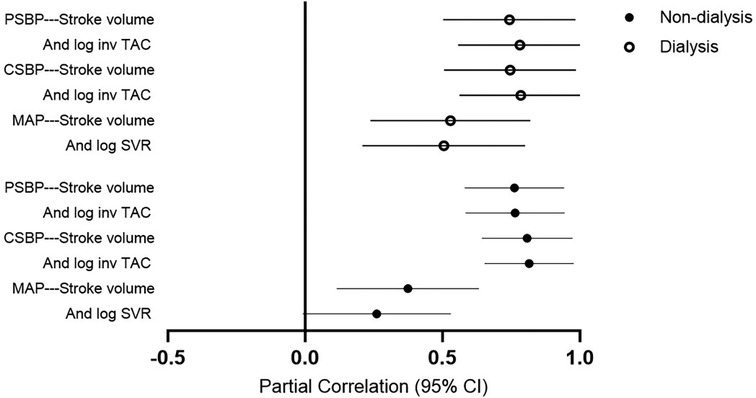
Figure 2. Partial correlations for the models in Table 6. PSBP, peripheral systolic blood pressure; log, logarithmically transformed; inv, inverse of; TAC, total arterial compliance; CSBP, central systolic blood pressure; MAP, mean arterial pressure.
Impact of stroke volume and vascular mechanisms on blood pressure measures in patients without established cardiovascular disease
Table 7 gives the mutually independent potential impact stroke volume and vascular mechanisms on blood pressure measures in confounder adjusted models among patients without established cardiovascular disease [n = 83 (72.2%)]. The relative contribution of stroke volume and vascular mechanisms (systemic vascular resistance and inv TAC) to the variation in mean arterial blood pressure and central as well as peripheral systolic blood pressure were assessed in models that included both characteristics. The respective relationships were similar to those in all patients (Tables 4, 5).
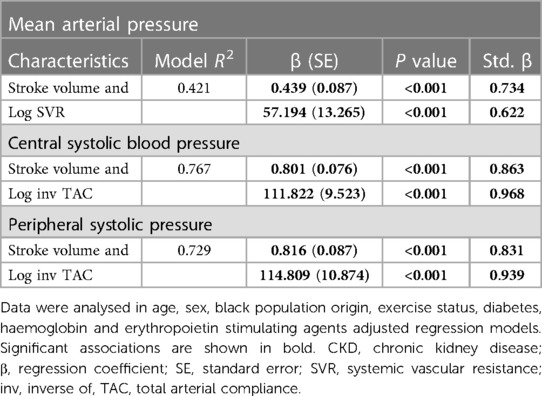
Table 7. Potential impact of stroke volume and vascular mechanisms on blood pressure measures in CKD patients without established cardiovascular disease.
Potential determinants of stroke volume
Stroke volume is a valuable marker of volume effects on systemic flow and hence volume status (38, 39). However, stroke volume is reportedly determined by not only cardiac preload (left ventricular end diastolic volume), but also left ventricular contractility and cardiac afterload (38, 39). Cardiac afterload (systemic vascular resistance and the inverse of TAC) was included in our multivariate regression models in Tables 4–7. Table 8 shows the contribution of left ventricular end diastolic volume, contractility (left ventricular midwall fractional shortening and lateral s') and pump function (ejection fraction) to the variation in stroke volume in confounder adjusted regression models. Based on the variable R2 s in the models, left ventricular end diastolic volume, midwall fractional shortening and ejection fraction explained 39.4%, 16.1% and 12.5% of the variation in stroke volume. Hence, left ventricular end diastolic volume contributed 2.4 fold more than left ventricular midwall fractional shortening and 3.1 fold more than ejection fraction to the variation in stroke volume. Left ventricular lateral s' was not associated with stroke volume.
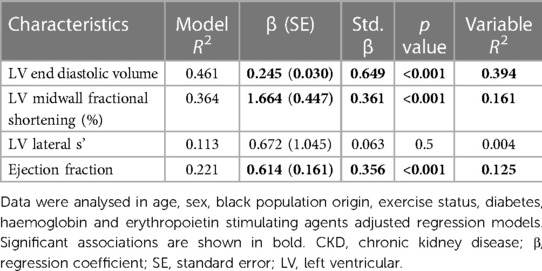
Table 8. Potential determinants of stroke volume in CKD patients.
In view of these findings and in order to confirm that the potential impact of stroke volume on blood pressure measures is not attributable to left ventricular contractility and pump function, the confounder adjusted and mutually independent relationships of stroke volume and vascular mechanisms with blood pressure parameters as given in Tables 4, 5, were re-evaluated in regression models that included left ventricular midwall fractional shortening or ejection fraction as additional potential confounders. Table 9 shows that the associations of stroke volume (as well as systemic vascular resistance and the inverse of TAC) with blood pressure parameters were unaltered and independent of left ventricular function measures.
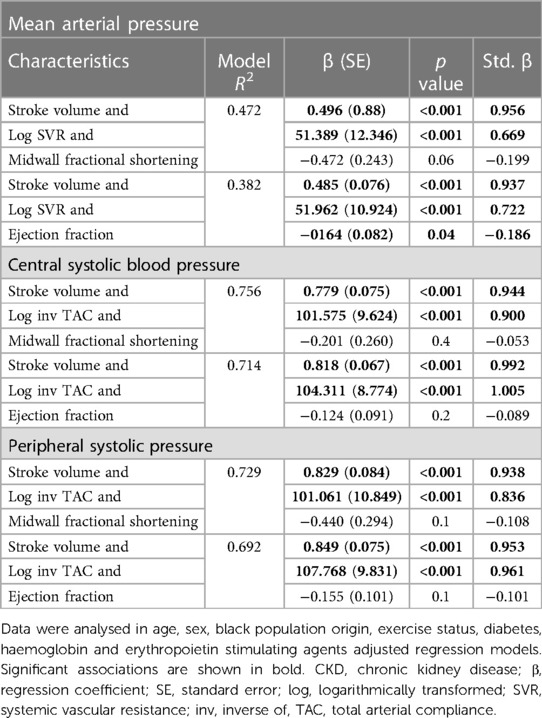
Table 9. Associations of stroke volume and vascular mechanisms with blood pressure parameters after additional adjustment for left ventricular contractility (midwall fractional shortening) and performance (ejection fraction) in CKD patients.
Baseline characteristics in patients with normal and elevated systolic blood pressure
Table 10 gives the baseline characteristics in patients with normal and elevated systolic blood pressure. Eighty-eight (76.4%) of the patients had elevated systolic blood pressure. Systolic blood pressure was below 120 mmHg in only 13 (11.3%) of study participants. Age and CKD duration were associated with elevated systolic blood pressure. Black patients experienced elevated systolic blood pressure more often, whereas the reverse applied to Asian patients. Patients who exercised had more frequently elevated systolic blood pressure. Patients with elevated systolic blood pressure used calcium channel blockers and statins more frequently and less often had established cardiovascular disease.
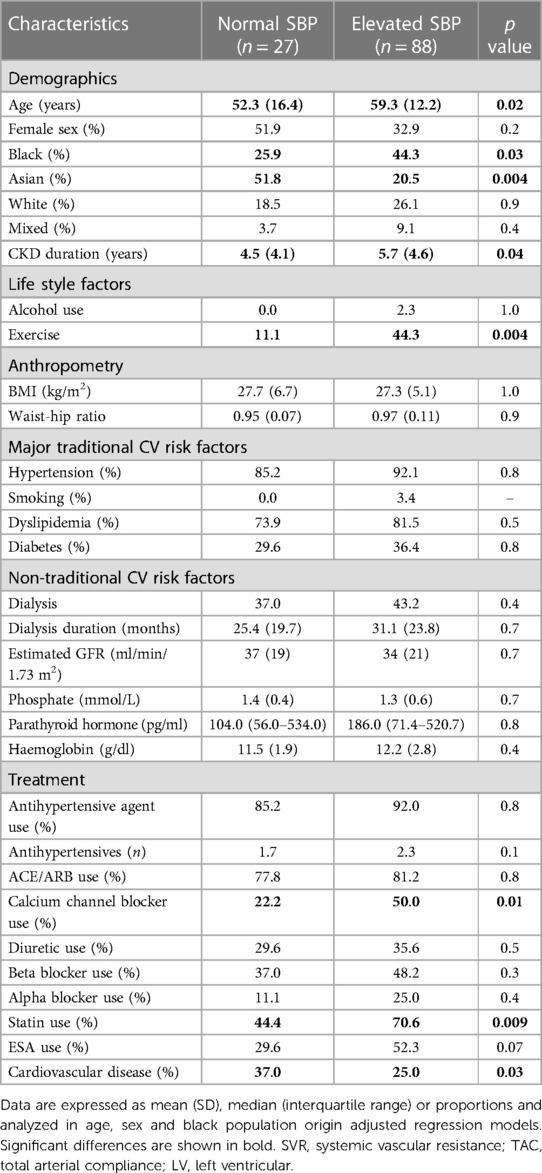
Table 10. Baseline recorded characteristics in CKD patients without and with elevated systolic blood pressure.
Hemodynamic characteristics in normal and elevated systolic blood pressure
Table 11 shows the hemodynamic characteristics in normal and elevated systolic blood pressure. As expected, all blood pressure measures were larger in patients with elevated systolic blood pressure. Stroke volume, cardiac output and left ventricular end diastolic volume were larger, whereas TAC was smaller in patients with uncontrolled elevated systolic blood pressure. By contrast, systemic vascular resistance was similar in both groups. Pf was larger in patients with uncontrolled elevated systolic blood pressure.
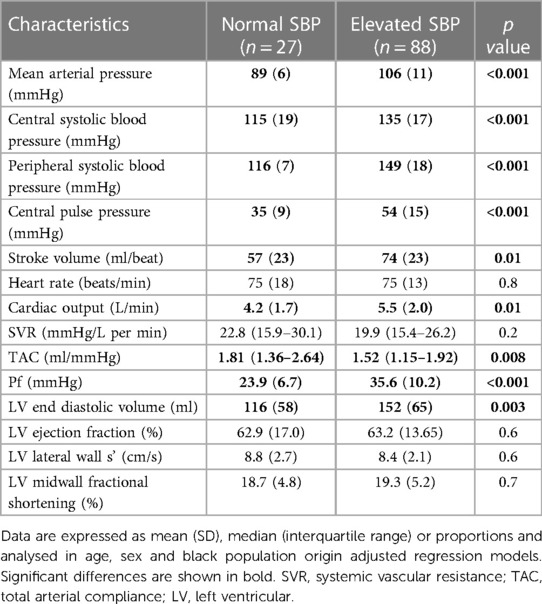
Table 11. Hemodynamic characteristics in CKD patients with and without elevated systolic blood pressure.
Hemodynamic correlates of elevated systolic blood pressure
The hemodynamic correlates of elevated systolic blood pressure were assessed in ROC curve analysis. As given in Figure 3, stroke volume (AUC (95% CI) = 0.722 (0.590–0.853)) and inv TAC (AUC (95% CI) = 0.653 (0.590–0.853)) were associated with uncontrolled elevated systolic blood pressure whereas systemic vascular resistance was not (AUC (95% CI) = 0.476 (0.317–0.635)). Compared to stroke volume x inv TAC (AUC (95% CI) = 0.901 (0.843–0.950)), stroke volume x systemic vascular resistance was more weakly related to elevated systolic blood pressure (AUC (95% CI) = 0.668 (0.539–0.796)). The stroke volume x inv TAC association with elevated systolic blood pressure was paralleled by an equally strong relationship between Pf and elevated systolic blood pressure. Table 12 shows the associations of hemodynamic characteristics with elevated systolic blood pressure in stratified analysis by dialysis status. The respective relationships were consistently similar in non-dialysis and dialysis patients.
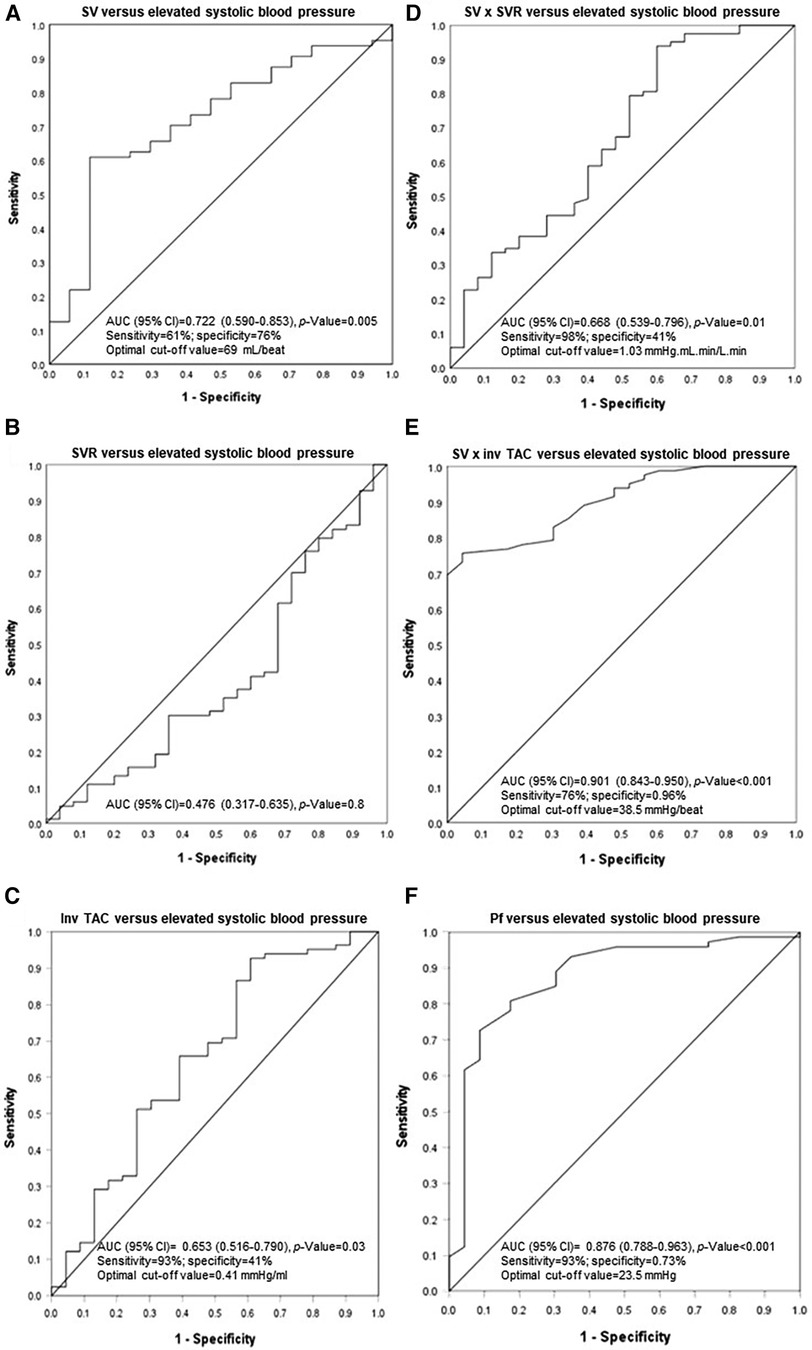
Figure 3. Associations of stroke volume and vascular mechanisms with uncontrolled systolic blood pressure. SV, stroke volume; SVR, systemic vascular resistance; inv, inverse of; TAC, total arterial compliance; Pf, forward wave pressure.
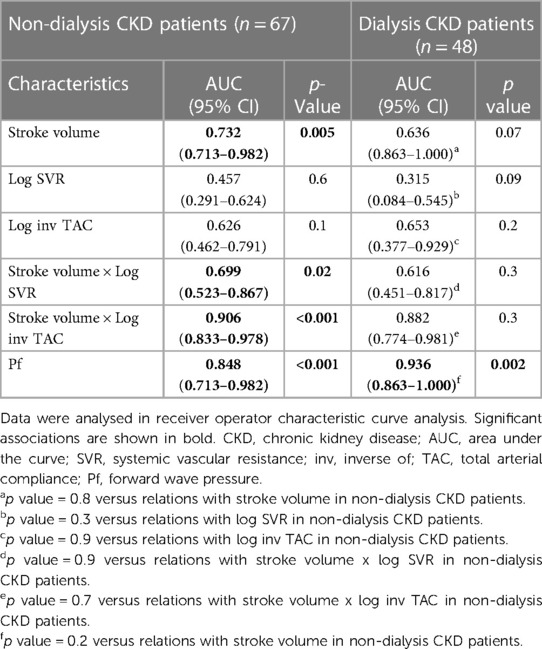
Table 12. Comparison of the associations of stroke volume and vascular mechanisms with elevated systolic blood pressure between non-dialysis and dialysis patients.
Discussion
The present multiethnic study examined for the first time the relative potential contribution of stroke volume and vascular mechanisms to mean and central as well as peripheral systolic blood pressures in non-dialysis and dialysis CKD patients. Vascular mechanisms comprised systemic vascular resistance and TAC. The hypertension burden was large in the present CKD cohort with 90.4% of study participants being affected. The main novel findings in this study are sixfold. Firstly, in fully adjusted regression models, stroke volume contributed at least as much as vascular mechanisms to the variation in mean and central and peripheral systolic blood pressures. Secondly, stroke volume, systemic vascular resistance and TAC did not differ between non-dialysis and dialysis CKD patients. Thirdly, the relative contribution of stroke volume and vascular mechanisms to variation in mean and central and peripheral systolic blood pressures were as large in non-dialysis compared to dialysis patients. Fourthly, elevated systolic blood pressure was as prevalent in non-dialysis as in dialysis CKD patients. Fifthly, in ROC curve analysis, stroke volume and the inverse of TAC were directly associated with uncontrolled systolic blood pressure; by contrast, systemic vascular resistance was not related to uncontrolled systolic blood pressure. Sixthly, the relationships of stroke volume and the inverse of TAC with uncontrolled systolic blood pressure was similar in non-dialysis and dialysis patients. The calculated power of the study was 0.999. The present findings have implications in the management of hypertension among CKD patients.
In the population at large, increased mean arterial pressure is mostly determined by elevated systemic vascular resistance whereas enhanced pulsatile pressures are generally attributable to reduced aortic elasticity (8). Stroke volume and cardiac output are typically unaltered or even reduced in primary hypertension (10, 14). However, recent studies revealed an association of volume overload with increases in blood pressure among dialysis as well as non-dialysis CKD patients (16, 17). Compared to conventional haemodialysis, frequent and prolonged haemodialysis is more effective at controlling hypertension (6, 17, 18). An interaction between volume load and vascular mechanisms and hence forward wave pressure ultimately determines pulsatile pressures (10, 12, 40). In this regard, the most striking findings in the present study were identified in multivariate regression models. In contrast to findings in the general population where vascular mechanisms mediate hypertension (12, 13), in confounder adjusted models, stroke volume contributed to the same extent as inv TAC to the variation in central and peripheral systolic blood pressures in the present CKD cohort. Stroke volume and inv TAC were inversely related. Upon entering both characteristics in the same model to determine their mutually independent potential impact, stroke volume and inv TAC contributed similarly to the variation in systolic blood pressures and the model R2 increased markedly. The latter finding suggested that stroke volume and inv TAC can interact in the mediation of systolic blood pressures. Indeed, when the interaction term stroke volume x inv TAC was entered in a separate model, the model R2 increased further and, when the individual interaction terms (stroke volume and TAC) were added as independent variables to the model, they were no longer related to systolic blood pressures. Taken together, volume load contributes as much as vascular mechanisms to systolic blood pressure in CKD patients.
Volume load and systemic vascular resistance reportedly interact upon mediating steady state or mean arterial pressure (10). In this regard, in confounder adjusted models, cardiac output and stroke volume were strongly associated with mean arterial blood pressure. By contrast, systemic vascular resistance was unrelated to mean arterial blood pressure. Stroke volume and systemic vascular resistance were inversely related. When both characteristics were entered in the same model, their contributions to the variation in mean arterial pressure were similar. This was accompanied by an increase in the model R2, which suggested that there was an interaction between both characteristics. Accordingly, the interaction term stroke volume x systemic vascular resistance explained as much as both mutually independent characteristics of the variation in mean arterial pressure and, when the individual interaction terms were entered in the same model, they were unrelated to mean arterial pressure. All in all, our results indicate that volume load contributes more or at least as much as systemic vascular resistance to the variation in mean or arterial blood pressure. In sensitivity analyses among patients without cardiovascular disease, the potential impact of stroke volume and vascular mechanisms on blood pressure measures remained consistent.
Current guidelines on the management of hypertension in CKD patients emphasize the need for adequate volume control particularly in patients on dialysis (41). Importantly in the present context, the present investigation revealed that stroke volume as a marker of volume load as well as vascular mechanisms were impaired to the same extent in non-dialysis as in dialysis patients. Equally and likely more pertinent, the potential impact of volume load and vascular mechanisms on blood pressure measures was as strong in non-dialysis as in dialysis patients. Our findings suggest that adequate volume load control through reduced salt and fluid intake is as if not more important in non-dialysis compared to dialysis patients with CKD, this particularly given that, per definition, dialysis as a measure of volume control is not used in the former group.
In this study, more than three quarters of participants had a brachial systolic blood pressure of ≥130 mmHg despite the overall use of an average of 2.2 antihypertensives. The 2021 KDIGO guideline recommends a systolic blood pressure target of below 120 mmHg (24). In the present investigation, systolic blood pressure was below 120 mmHg in only 11% of study participants. Patients with elevated systolic blood pressure had a larger volume load as represented by increased left ventricular end diastolic volume, stroke volume and cardiac output as well as more impaired TAC compared to those with normal systolic blood pressure. By contrast, systemic vascular resistance was similar in both groups. Stroke volume (AUC (95% CI) for ROC curve = 0.722 (0.590–0.853)) and inv TAC (AUC (95% CI) for ROC curve = 0.653 (0.516–0.790)) and particularly the interaction between these characteristics (AUC (95% CI) for ROC curve = 0.901 (0.843–0.950)) were strongly associated with elevated systolic blood pressure. By contrast, systemic vascular resistance was not related to elevated systolic blood pressure. These findings were similar in non-dialysis and dialysis CKD patients. The current results reiterate the critical importance of volume control in the management of hypertension in not only dialysis but also non-dialysis patients with CKD.
Intriguingly and seemingly paradoxically, in this study, patients with uncontrolled systolic blood pressure exercised more frequently and had less prevalent established cardiovascular disease compared to their controlled systolic blood pressure counterparts. However, we believe that this is due to a survival bias as patients with uncontrolled blood pressure together with comorbid cardiovascular disease or/and concurrent adverse lifestyle factors would be expected to more likely have died prior to enrolment in the study.
Overall, the prevalence of hypertension in the present study may be larger than that reported in non-dialysis (86.6% vs. 70%) (5) and dialysis CKD patients (95.8% vs. 60% to 90%) (6) that live in high income countries. This is likely due to the large proportion (40%) of CKD patients from black population origin in the current cohort (29). The present study has several limitations. Firstly, our cross-sectional study design precludes drawing inferences on the direction of causality. Secondly, we used office blood pressure measurements. Ambulatory blood pressures may be more strongly associated with incident cardiovascular disease in CKD patients (24, 41). Thirdly, peak aortic flow and aortic characteristic impedance may be more strongly implicated than stroke volume and TAC, respectively, in mediating pulsatile pressures (12, 13). However, peak aortic flow reportedly approximates stroke volume and the inverse of aortic characteristic impedance and TAC are strongly correlated (R = 0.83) (41). In line with the latter, proximal aortic stiffness that is due to the replacement of elastin by collagen and vascular calcification accounts for half of inv TAC (42, 43). Also, in a recent population study, we found that TAC was as strongly associated with pulsatile pressures as was characteristic impedance (44). Additionally, the relationships of stroke volume and proximal aortic flow with pulsatile pressures were similar (44). In the present study, together with potential confounders, stroke volume and inv TAC as well as their interaction explained between 68% and 77% of the variation in systolic blood pressures. In parallel to this, forward wave pressure together with potential confounders explained 91% to 93% of systolic blood pressures. Except for an inconsistent relationship with black population origin, the potential confounders that were entered in the respective models were not independently associated with mean arterial and systolic blood pressure. Moreover, the included potential confounders explained only 10.5% of the variation in mean arterial pressure and 15.9% to 16.1% of systolic blood pressures. Whether longitudinal investigations with the inclusion of proximal aortic flow and aortic characteristic impedance can further our understanding of the pathophysiology that underlies CKD induced hypertension merits further study. Fourthly, potentially important contributors to blood pressure measures in CKD that were not recorded in the present study also encompass sodium intake as estimated by natriuresis and, among dialysis patients, preserved urinary output and dry weight. In this investigation, weight was recorded only at the time of the study. The respective characteristics should be included in future investigations that are aimed at determining the pathophysiology of hypertension in patients with CKD. Lastly, although none of the patients had symptoms or physical signs that were attributed to heart failure by the involved nephrologist (H-C H) at the time of the study, a recent investigation revealed that heart failure with preserved ejection fraction is not only the most common (35%) but also the most frequently overlooked (69%) heart failure phenotype in patients on haemodialysis (45). Our patients all underwent a previous evaluation by cardiologists but this was not systematically done at the time of the study. Hence, it is possible if not likely that a proportion of patients with established cardiovascular disease as represented by previous myocardial infarction and coronary angioplasty or bypass grafting had heart failure with preserved ejection fraction in the present cohort. Nevertheless, in a sensitivity analysis in which patients with established cardiovascular disease were excluded, the relationships of stroke volume and vascular mechanisms with blood pressure measures were unaltered.
In conclusion, independent of one another, stroke volume contributes as much as systemic vascular resistance to the variation in mean arterial or distending pressure and as much as inv TAC to the variation in systolic blood pressures in patients with CKD. Stroke volume and vascular mechanisms may interact upon mediating blood pressure measures in CKD patients. The potential impact of stroke volume and vascular mechanisms on blood pressures is as strong in non-dialysis patients as in dialysis patients. Stroke volume and inv TAC but not systemic vascular resistance is strongly associated with elevated systolic blood pressure and this applies as much in non-dialysis as in dialysis patients. Our results suggest that both volume load and vascular mechanisms should be considered in the management of hypertension among patients with CKD. The extent and relative potential impact of volume load and vascular mechanisms on blood pressure measures are as large in non-dialysis compared to dialysis CKD patients.
Data availability statement
The original contributions presented in the study are included in the article/Supplementary Materials, further inquiries can be directed to the corresponding author.
Ethics statement
The studies involving humans were approved by The Committee for Research on Human Subjects of the University of Witwatersrand, Johannesburg, South Africa (M15-08-43). The studies were conducted in accordance with the local legislation and institutional requirements. The participants provided their written informed consent to participate in this study.
Author contributions
GT: Data curation, Formal Analysis, Methodology, Writing – original draft, Writing – review & editing, Conceptualization. HH: Conceptualization, Investigation, Methodology, Project administration, Resources, Software, Writing – review & editing. CR: Data curation, Investigation, Methodology, Writing – review & editing. ND: Validation, Writing – review & editing. GT: Validation, Writing – review & editing. AS: Validation, Writing – review & editing. PD: Conceptualization, Data curation, Formal Analysis, Funding acquisition, Methodology, Project administration, Supervision, Validation, Writing – original draft, Writing – review & editing.
Funding
The author(s) declare that financial support was received for the research, authorship, and/or publication of this article.
This study was supported by the South African National Research Foundation.
Acknowledgments
This study would not have been possible the voluntary collaboration of the participants.
Conflict of interest
The authors declare that the research was conducted in the absence of any commercial or financial relationships that could be construed as a potential conflict of interest.
Publisher's note
All claims expressed in this article are solely those of the authors and do not necessarily represent those of their affiliated organizations, or those of the publisher, the editors and the reviewers. Any product that may be evaluated in this article, or claim that may be made by its manufacturer, is not guaranteed or endorsed by the publisher.
References
1. Ameer OZ. Hypertension in chronic kidney disease: what lies behind the scene. Front Pharmacol. (2022) 13:1–28. doi: 10.3389/fphar.2022.949260
2. Hamrahian SM, Falkner B. Hypertension in chronic kidney disease. In: MDS Islam, editor. Hypertension: From Basic Research to Clinical Practice. Cham: Springer International Publishing (2016). p. 307–25. (Advances in Experimental Medicine and Biology; vol. 956). Available online at: http://link.springer.com/10.1007/5584_2016_84 (cited January 21, 2024).
3. Clemmer JS, Shafi T, Obi Y. Physiological mechanisms of hypertension and cardiovascular disease in end-stage kidney disease. Curr Hypertens Rep. (2022) 24(10):413–24. doi: 10.1007/s11906-022-01203-7
4. Sarafidis P, Schmieder R, Burnier M, Persu A, Januszewicz A, Halimi JM, et al. A European Renal Association (ERA) synopsis for nephrology practice of the 2023 European Society of Hypertension (ESH) guidelines for the management of arterial hypertension. Nephrol Dial Transplant. (2024):gfae041. doi: 10.1093/ndt/gfae041
5. Sakuma H, Matsuki M, Hasebe N, Nakagawa N. Real-world trends in pre-dialysis blood pressure levels of patients undergoing dialysis in Japan using a web-based national database. J Clin Hypertens. (2023) 25(12):1163–71. doi: 10.1111/jch.14736
6. Saad E, Charra B, Raj DSC. Hypertension control with daily dialysis. Semin Dial. (2004) 17(4):295–8. doi: 10.1111/j.0894-0959.2004.17330.x
7. Sarafidis PA, Loutradis C, Karpetas A, Tzanis G, Piperidou A, Koutroumpas G, et al. Ambulatory pulse wave velocity is a stronger predictor of cardiovascular events and all-cause mortality than office and ambulatory blood pressure in hemodialysis patients. Hypertension. (2017) 70(1):148–57. doi: 10.1161/HYPERTENSIONAHA.117.09023
8. Ku E, Lee BJ, Wei J, Weir MR. Hypertension in CKD: core curriculum 2019. Am J Kidney Dis. (2019) 74(1):120–31. doi: 10.1053/j.ajkd.2018.12.044
9. Brar SK, Perveen S, Chaudhry MR, AlBabtain S, Amreen S, Khan S. Erythropoietin-induced hypertension: a review of pathogenesis, treatment, and role of blood viscosity. Cureus. (2021) 13(1):e12804. doi: 10.7759/cureus.12804
10. Mayet J, Hughes A. Cardiac and vascular pathophysiology in hypertension. Heart. (2003) 89(9):1104–9. doi: 10.1136/heart.89.9.1104
11. Bansal N, Artinian NT, Bakris G, Chang T, Cohen J, Flythe J, et al. Hypertension in patients treated with in-center maintenance hemodialysis: current evidence and future opportunities: a scientific statement from the American heart association. Hypertension. (2023) 80(6):e112–22. doi: 10.1161/HYP.0000000000000230
12. Mitchell GF, Wang N, Palmisano JN, Larson MG, Hamburg NM, Vita JA, et al. Hemodynamic correlates of blood pressure across the adult age spectrum: noninvasive evaluation in the framingham heart study. Circulation. (2010) 122(14):1379–86. doi: 10.1161/CIRCULATIONAHA.109.914507
13. Mitchell GF, Gudnason V, Launer LJ, Aspelund T, Harris TB. Hemodynamics of increased pulse pressure in older women in the community-based age, gene/environment susceptibility–Reykjavik study. Hypertension. (2008) 51(4):1123–8. doi: 10.1161/HYPERTENSIONAHA.107.108175
14. Lund-Johansen P. The hemodynamics of the aging cardiovascular system. J Cardiovasc Pharmacol. (1988) 12(8):S20–32. doi: 10.1097/00005344-198812081-00006
15. Inserra F, Forcada P, Castellaro A, Castellaro C. Chronic kidney disease and arterial stiffness: a two-way path. Front Med. (2021) 8:765924. doi: 10.3389/fmed.2021.765924
16. Khan YH, Sarriff A, Adnan AS, Khan AH, Mallhi TH. Chronic kidney disease, fluid overload and diuretics: a complicated triangle. PLoS One. (2016) 11(7):e0159335. doi: 10.1371/journal.pone.0159335
17. Sangala N, Ficheux M, Fessi H, Borman N, Collins A. Using more frequent haemodialysis to manage volume overload in dialysis patients with heart failure, obesity or pregnancy. Nephrol Dial Transplant. (2020) 35(2):ii11–7. doi: 10.1093/ndt/gfaa020
18. Kotanko P, Garg AX, Depner T, Pierratos A, Chan CT, Levin NW, et al. Effects of frequent hemodialysis on blood pressure: results from the randomized frequent hemodialysis network trials. Hemodial Int. (2015) 19(3):386–401. doi: 10.1111/hdi.12255
19. Darne B, Girerd X, Safar M, Cambien F, Guize L. Pulsatile versus steady component of blood pressure: a cross-sectional analysis and a prospective analysis on cardiovascular mortality. Hypertension. (1989) 13(4):392–400. doi: 10.1161/01.HYP.13.4.392
20. Benetos A, Safar M, Rudnichi A, Smulyan H, Richard JL, Ducimetieère P, et al. Pulse pressure: a predictor of long-term cardiovascular mortality in a French male population. Hypertension. (1997) 30(6):1410–5. doi: 10.1161/01.HYP.30.6.1410
21. Madhavan S, Ooi WL, Cohen H, Alderman MH. Relation of pulse pressure and blood pressure reduction to the incidence of myocardial infarction. Hypertension. (1994) 23(3):395–401. doi: 10.1161/01.HYP.23.3.395
22. Mitchell GF, Moyé LA, Braunwald E, Rouleau JL, Bernstein V, Geltman EM, et al. Sphygmomanometrically determined pulse pressure is a powerful independent predictor of recurrent events after myocardial infarction in patients with impaired left ventricular function. SAVE investigators. Survival and ventricular enlargement. Circulation. (1997) 96(12):4254–60. doi: 10.1161/01.CIR.96.12.4254
23. Celis H, Fagard RH, Staessen JA, Thijs L. Systolic hypertension in Europe trial investigators. Risk and benefit of treatment of isolated systolic hypertension in the elderly: evidence from the systolic hypertension in Europe trial. Curr Opin Cardiol. (2001) 16(6):342–8. doi: 10.1097/00001573-200111000-00005
24. Kidney Disease: Improving Global Outcomes (KDIGO) Blood Pressure Work Group. KDIGO 2021 clinical practice guideline for the management of blood pressure in chronic kidney disease. Kidney Int. (2021) 99(3S):S1–87. doi: 10.1016/j.kint.2020.11.003
25. McEniery CM, Cockcroft JR, Roman MJ, Franklin SS, Wilkinson IB. Central blood pressure: current evidence and clinical importance. Eur Heart J. (2014) 35:eht565. doi: 10.1093/eurheartj/eht565
26. Dionne JM, Jiang S, Ng DK, Flynn JT, Mitsnefes MM, Furth SL, et al. Mean arterial pressure and chronic kidney disease progression in the CKiD cohort. Hypertension. (2021) 78(1):65–73. doi: 10.1161/HYPERTENSIONAHA.120.16692
27. Magriço R, Bigotte Vieira M, Viegas Dias C, Leitão L, Neves JS. BP Reduction, kidney function decline, and cardiovascular events in patients without CKD. Clin J Am Soc Nephrol. (2018) 13(1):73–80. doi: 10.2215/CJN.05510517
28. Hsu HC, Tade G, Robinson C, Dlongolo N, Teckie G, Solomon A, et al. Associations of traditionally determined left ventricular mass indices and hemodynamic and non-hemodynamic components of cardiac remodeling with diastolic and systolic function in patients with chronic kidney disease. J Clin Med. (2023) 12(13):4211. doi: 10.3390/jcm12134211
29. Hsu HC, Robinson C, Woodiwiss AJ, Norton GR, Dessein PH. Cardiovascular risk factor profiles and disease in black compared to other Africans with chronic kidney disease. Int J Nephrol. (2021) 2021:8876363. doi: 10.1155/2021/8876363
30. Tade G, Hsu HC, Woodiwiss AJ, Peters F, Robinson C, Dlongolo N, et al. Uric acid, ferritin, albumin, parathyroid hormone and gamma-glutamyl transferase concentrations are associated with uremic cardiomyopathy characteristics in non-dialysis and dialysis chronic kidney disease patients. Int J Nephrol Renovasc Dis. (2022) 15:353–69. doi: 10.2147/IJNRD.S389539
31. Gaasch WH. Diagnosis and treatment of heart failure based on left ventricular systolic or diastolic dysfunction. JAMA. (1994) 271(16):1276–80. doi: 10.1001/jama.1994.03510400062033
32. Hsu H, Norton GR, Robinson C, Woodiwiss AJ, Dessein PH. Potential determinants of the E/e′ ratio in non-dialysis compared with dialysis patients. Nephrology. (2021) 26(12):988–98. doi: 10.1111/nep.13948
33. Friz HP, Facchetti R, Primitz L, Beltrame L, Galbiati V, Ricioppo A, et al. Simultaneous validation of the SunTech 247 diagnostic station blood pressure measurement device according to the British hypertension society protocol, the international protocol and the association for the advancement of medical instrumentation standards. Blood Press Monit. (2009) 14(5):222–7. doi: 10.1097/MBP.0b013e328330c873
34. Carriazo S, Sarafidis P, Ferro CJ, Ortiz A. Blood pressure targets in CKD 2021: the never-ending guidelines debacle. Clin Kidney J. (2022) 15(5):845–51. doi: 10.1093/ckj/sfac014
35. Sahn DJ, DeMaria A, Kisslo J, Weyman A. Recommendations regarding quantitation in M-mode echocardiography: results of a survey of echocardiographic measurements. Circulation. (1978) 58(6):1072–83. doi: 10.1161/01.CIR.58.6.1072
36. Woodiwiss AJ, Libhaber CD, Libhaber E, Sareli P, Norton GR. Relationship between on-treatment decreases in inappropriate versus absolute or indexed left ventricular mass and increases in ejection fraction in hypertension. Hypertension. (2012) 60(3):810–7. doi: 10.1161/HYPERTENSIONAHA.112.197822
37. de Simone G, Devereux RB, Koren MJ, Mensah GA, Casale PN, Laragh JH. Midwall left ventricular mechanics. An independent predictor of cardiovascular risk in arterial hypertension. Circulation. (1996) 93(2):259–65. doi: 10.1161/01.CIR.93.2.259
38. Johnson A, Ahrens T. Stroke volume optimization: the new hemodynamic algorithm. Crit Care Nurse. (2015) 35(1):11–27. doi: 10.4037/ccn2015427
39. Bruss ZS, Raja A. Physiology, stroke volume. In: Okocha M, editor. StatPearls. Treasure Island (FL): StatPearls Publishing (2023). Available online at: http://www.ncbi.nlm.nih.gov/books/NBK547686/ (cited January 21, 2024).
40. Dart AM, Kingwell BA. Pulse pressure–a review of mechanisms and clinical relevance. J Am Coll Cardiol. (2001) 37(4):975–84. doi: 10.1016/S0735-1097(01)01108-1
41. Flythe JE, Chang TI, Gallagher MP, Lindley E, Madero M, Sarafidis PA, et al. Blood pressure and volume management in dialysis: conclusions from a Kidney Disease: Improving Global Outcomes (KDIGO) controversies conference. Kidney Int. (2020) 97(5):861–76. doi: 10.1016/j.kint.2020.01.046
42. Vennin S, Li Y, Willemet M, Fok H, Gu H, Charlton P, et al. Identifying hemodynamic determinants of pulse pressure: a combined numerical and physiological approach. Hypertension. (2017) 70(6):1176–82. doi: 10.1161/HYPERTENSIONAHA.117.09706
43. Mitchell GF. Impedance progress: aortic diameter rears its head again? Hypertension. (2007) 49(6):1207–9. doi: 10.1161/HYPERTENSIONAHA.107.087239
44. Woodiwiss AJ, Mmopi KN, Peterson V, Libhaber C, Bello H, Masiu M, et al. Distinct contribution of systemic blood flow to hypertension in an African population across the adult lifespan. Hypertension. (2020) 76(2):410–9. doi: 10.1161/HYPERTENSIONAHA.120.14925
45. Malik J, Valerianova A, Pesickova SS, Michalickova K, Hladinova Z, Hruskova Z, et al. Heart failure with preserved ejection fraction is the most frequent but commonly overlooked phenotype in patients on chronic hemodialysis. Front Cardiovasc Med. (2023) 10:1130618. doi: 10.3389/fcvm.2023.1130618
Keywords: chronic kidney disease, volume load, stroke volume, total arterial compliance, systemic vascular resistance, blood pressure determinants
Citation: Tade G, Hsu H-C, Robinson C, Dlongolo N, Teckie G, Solomon A and Dessein PH (2024) The relative potential contribution of volume load and vascular mechanisms to hypertension in non-dialysis and dialysis chronic kidney disease patients. Front. Cardiovasc. Med. 11:1377887. doi: 10.3389/fcvm.2024.1377887
Received: 28 January 2024; Accepted: 28 March 2024;
Published: 15 April 2024.
Edited by:
Nicola Mumoli, ASST Ovest Milanese, ItalyReviewed by:
Erietta Polychronopoulou, Valais Hospital, SwitzerlandAdalbert Schiller, Victor Babes University of Medicine and Pharmacy, Romania
© 2024 Tade, Hsu, Robinson, Dlongolo, Teckie, Solomon and Dessein. This is an open-access article distributed under the terms of the Creative Commons Attribution License (CC BY). The use, distribution or reproduction in other forums is permitted, provided the original author(s) and the copyright owner(s) are credited and that the original publication in this journal is cited, in accordance with accepted academic practice. No use, distribution or reproduction is permitted which does not comply with these terms.
*Correspondence: Patrick Hector Dessein patrick.dessein22@gmail.com
†These authors have contributed equally to this work