Short- and long-term performance of risk calculation tools for mortality in patients with acute coronary syndrome
 Takatoku Aizawa1*
  Tomoaki Nagao1 Yusuke Oda1 Suguru Nakano1 Kazuki Ito1 Yusuke Shirai1 Natsuko Hosoya1 Kohei Sawasaki1 Junji Arai1 Shinya Fujita1 Masahiro Muto1
  Teiji Oda1 Yuichiro Maekawa2
- 1Department of Cardiology, Hamamatsu Medical Center, Hamamatsu, Japan
- 2Division of Cardiology, Department of Internal Medicine Ⅲ, Hamamatsu University of Medicine, Hamamatsu, Japan
Background: The mortality rate of acute coronary syndrome (ACS) remains high. Therefore, patients with ACS should undergo early risk stratification, for which various risk calculation tools are available. However, it remains uncertain whether the predictive performance varies over time between risk calculation tools for different target periods. This study aimed to compare the predictive performance of risk calculation tools in estimating short- and long-term mortality risks in patients with ACS, while considering different observation periods using time-dependent receiver operating characteristic (ROC) analysis.
Methods: This study included 404 consecutive patients with ACS who underwent coronary angiography at our hospital from March 2017 to January 2021. The ACTION and GRACE scores for short-term risk stratification purposes and CRUSADE scores for long-term risk stratification purposes were calculated for all participants. The participants were followed up for 36 months to assess mortality. Using time-dependent ROC analysis, we evaluated the area under the curve (AUC) of the ACTION, CRUSADE, and GRACE scores at 1, 6, 12, 24, and 36 months.
Results: Sixty-six patients died during the observation periods. The AUCs at 1, 6, 12, 24, and 36 months of the ACTION score were 0.942, 0.925, 0.889, 0.856, and 0.832; those of the CRUSADE score were 0.881, 0.883, 0.862, 0.876, and 0.862; and those of the GRACE score 0.949, 0.928, 0.888, 0.875, and 0.860, respectively.
Conclusions: The ACTION and GRACE scores were excellent risk stratification tools for mortality in the short term. The prognostic performance of each risk score was almost similar in the long term, but the CRUSADE score might be a superior risk stratification tool in the longer term than 3 years.
1 Introduction
Compared with the early days, the clinical outcomes of percutaneous coronary intervention (PCI) for ischemic heart disease have seen significant improvement (1). Advancements in PCI techniques and devices have reached a mature stage (2, 3). However, the mortality rate of acute coronary syndrome (ACS) remains high, despite the era of third-generation drug-eluting stents (4, 5). Therefore, patients with ACS should undergo early risk stratification (6), for which various risk calculation tools are available (7–16). Early risk stratification helps with determining treatment strategies for ACS. The widely used risk calculation tools are the TIMI and GRACE risk scores (15, 17). While several studies have compared the performance of risk calculation tools (18–27), no consensus has been reached on which risk calculation tool is superior. One potential reason could be the difference in the observation periods of various studies. Furthermore, the risk scores for estimating short- and long-term prognosis have been proposed. Whether the predictive performance of risk calculation tools varies over the long term remains unclear.
Receiver operating characteristic (ROC) curve analysis is commonly used to evaluate the predictive performance of continuous variables for a single endpoint event. However, conventional ROC analysis cannot integrate the effects of time into the evaluation. Previous studies have relied on conventional ROC analyses to compare the predictive performance of risk calculation tools. However, the observation duration could significantly affect the study results and mortality rates. If the analysis is performed after considering the time course, dropout cases must be considered. Time-dependent ROC analysis enables the analysis of the predictive performance of independent variables for the occurrence of endpoints while considering dropout cases over time (28). Therefore, evaluating the predictive performance of independent variables for event outcomes by incorporating the time course using a time-dependent ROC analysis is meaningful.
This study aimed to compare the predictive performance of risk calculation tools to estimate short- and long-term mortality risk in patients with ACS while considering different observation periods using time-dependent ROC analysis.
2 Methods
2.1 Study population
This single-center retrospective study included consecutive patients with ACS who underwent coronary angiography at Hamamatsu Medical Center from March 2017 to January 2021. The exclusion criteria were cases with missing data for each risk calculation tool or the absence of severe stenosis or thrombus in the epicardial coronary artery on coronary angiography.
This study adhered to the principles of the Declaration of Helsinki and was approved by the Medical Ethics Committee of Hamamatsu Medical Center (2023-3-037). As this was a retrospective study, obtaining informed consent from each patient was not required. Instead, in accordance with our institution's routine ethical regulations, we posted a notice on the study design and contact information in a public location within our institution. In this public notification, we ensured that patients had the opportunity to opt out of participating in this study.
2.2 Clinical endpoints
The endpoint of this study was all-cause mortality. We evaluated the occurrence of endpoints at 1, 6, 12, 24, and 36 months after coronary angiography.
2.3 Risk calculation tools
All participants were scored using three widely used risk calculation tools: ACTION, CRUSADE, and GRACE. The ACTION risk score (range: 0–103) includes age, systolic blood pressure, creatinine clearance, cardiac arrest, shock, heart failure, heart rate, ST-segment elevation myocardial infarction (STEMI), and troponin ratio (11). The CRUSADE risk score (range: 0–142) includes age, serum creatinine level, systolic blood pressure, heart failure, heart rate, weight, prior heart failure, hematocrit level, troponin ratio, prior stroke, diabetes mellitus, sex, and history of peripheral artery disease (16). The GRACE risk score (range: 1–372) includes Killip class, systolic blood pressure, heart rate, age, serum creatinine level, cardiac arrest, ST-segment deviation, and elevated cardiac enzyme level (15).
2.4 Definitions and data collection
Myocardial infarction (MI) is associated with cardiac troponin release and is based on the third universal definition of MI (29). STEMI is defined as MI with ST-segment elevation ≥1 mm in at least two contiguous leads or a new or undetermined duration of left branch bundle block on electrocardiogram. Non-STEMI (NSTEMI) is defined as MI without the aforementioned electrocardiographic changes. Unstable angina is defined as myocardial ischemia at rest or with minimal exertion in the absence of acute cardiomyocyte injury or necrosis. Shock is defined as 90 mmHg systolic blood pressure or less at admission. Heart failure is defined as Killip class II, III, or IV on admission. The troponin ratio is calculated as the baseline troponin value divided by the local laboratory-specific upper limit of normal. The data required for the risk calculation tool were defined with reference to each study (11, 15, 16). Upon admission, all participants were subjected to medical history taking, physical examination, blood sampling, chest radiography, and electrical cardiography. Patients with STEMI underwent emergent coronary angiography, and those with non-ST-segment elevation ACS underwent emergent or elective coronary angiography, depending on the situation at admission. The decision regarding the therapeutic strategy was left to the attending physician's discretion, depending on the severity of the case. We collected data on the endpoints using information from the electronic medical records of our hospital and requests for written medical information from referral medical institutions but not by telephone contact with the patients directly. All extracted data were anonymized.
2.5 Statistical analysis
The continuous variables were expressed as mean ± standard deviation or median values with the associated range. The categorical variables were expressed as percentages. A comparison of baseline characteristics between the death and non-death groups was performed using the t-test and χ2 test for continuous and categorical variables, respectively. The Kaplan–Meier curve represented the occurrence of events after coronary angiography. Time-dependent ROC analysis was performed to evaluate the predictive performance of risk scores. Individual disease outcomes were observed and updated in the time-dependent ROC curve analysis at each time point. This curve was created using the sensitivity (t) and 1-specificity (t) obtained from various cutoff values of the independent variables at time t. Using the measured values, a time-dependent ROC curve could be drawn at any time t. The predictive ability of independent variables can be accurately evaluated by constructing ROC curves at several time points. Therefore, time-dependent ROC curve analysis is an efficient statistical method for precisely evaluating the outcomes of independent variables (28). P < 0.05 was considered statistically significant. All statistical analyses were performed using EZR (Saitama Medical Center, Jichi Medical University, Saitama, Japan), a graphical user interface for R (R Foundation for Statistical Computing, Vienna, Austria) (30). Specifically, it is a modified version of the R commander designed to add statistical functions frequently used in biostatistics. We used the Kaplan–Meier “survival ROC” package, written in R, to assess time-dependent changes in prediction performance between different risk calculation tools (28). Furthermore, we performed additional analysis using the “timeROC” package in R to evaluate the 95% confidence intervals of the area under the time-dependent ROC curves and the statistical difference between the area under the time-dependent ROC curves of risk scores (31).
3 Results
Figure 1 illustrates the patient flow diagram detailing the progression through this study. The study population consisted of 473 consecutive patients with ACS who underwent coronary angiography at Hamamatsu Medical Center from March 2017 to January 2021. Thirty cases had missing data, and 39 did not have severe stenosis or thrombus on coronary angiography. Finally, we investigated the predictive performance of the risk calculation tools for 404 cases. In total, 242 patients (60.0%) had STEMI, 130 (32.1%) had NSTEMI, and 32 (7.9%) had unstable angina. We followed up with participants for 36 months.
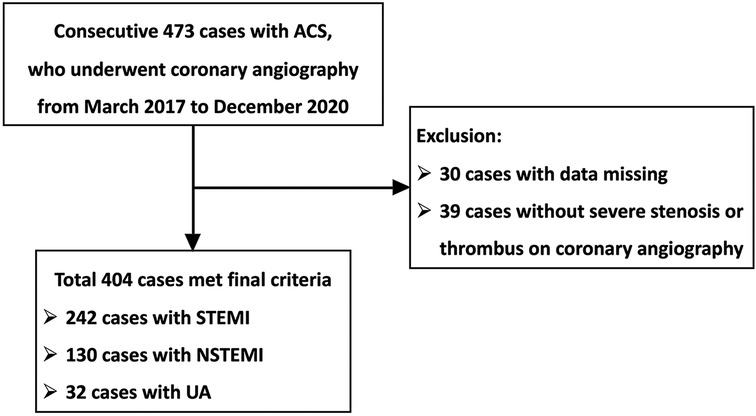
Figure 1. Flow diagram for the study population. ACS, acute coronary syndrome; STEMI, ST-segment elevation myocardial infarction; NSTEMI, non-ST-segment elevation myocardial infarction; UA, unstable angina.
3.1 Clinical characteristics
The baseline characteristics of the study population are listed in Tables 1, 2. Significant differences between most variables contributed to risk scores in the death and non-death groups. Among these variables, sex, heart rate, diagnosis of STEMI, and troponin ratio were not significantly different between the death and non-death groups.
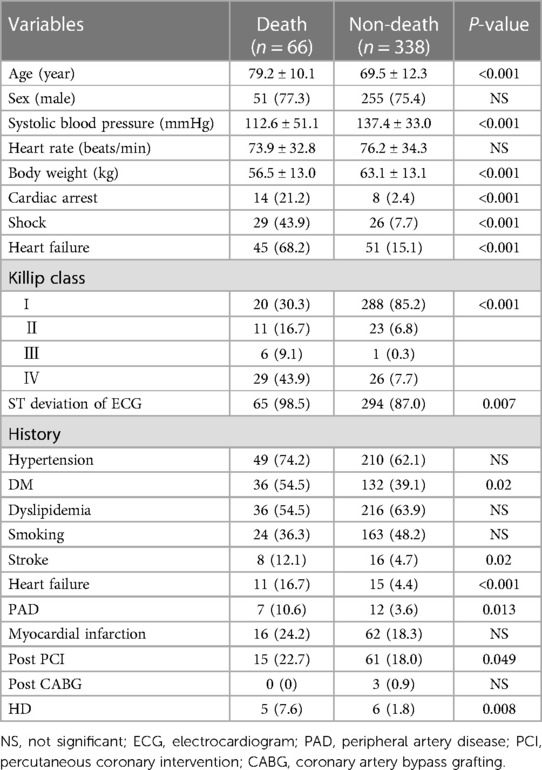
Table 1. Clinical characteristics ①.
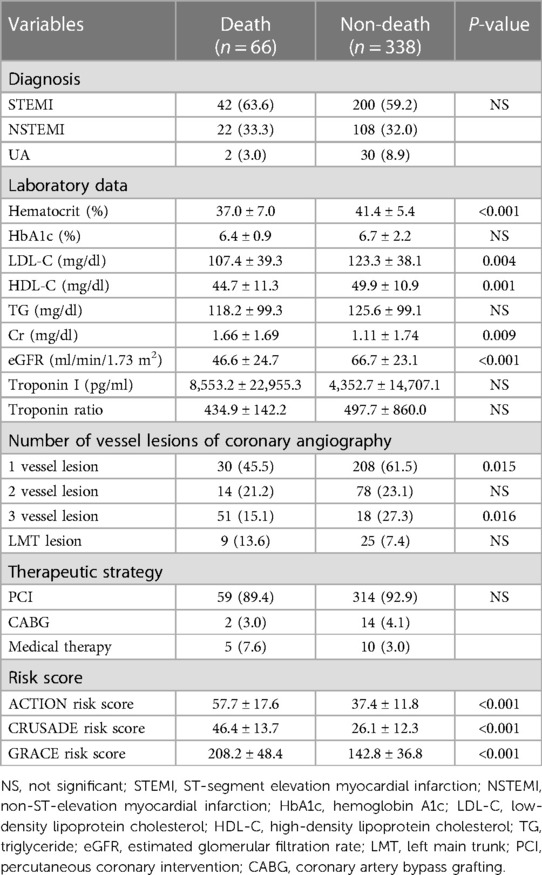
Table 2. Clinical characteristics ②.
3.2 Incidence rates of all-cause mortality
In total, 66 patients died during the 36-month follow-up period. The median follow-up period for the overall study was 1,080 days (interquartile range: 1,022–1,080). The cumulative incidence rates of all-cause mortality at 1, 6, 12, 24, and 36 months were 6.7%, 8.7%, 9.9%, 13.3%, and 16.9%, respectively (Figure 2).
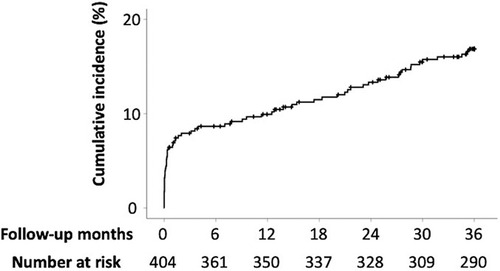
Figure 2. Incidence rates of all-cause mortality. The cumulative incidence rates for all-cause mortality at 1, 6, 12, 24, and 36 months are 6.7%, 8.7%, 9.9%, 13.3%, and 16.9%, respectively.
3.3 Time-dependent ROC curves of the ACTION, CRUSADE, and GRACE risk scores for all-cause mortality
Figure 3 illustrates the ROC curves of each risk score for all-cause mortality at 1, 6, 12, 24, and 36 months after the start of follow-up, using time-dependent ROC analysis. Table 3 compares the areas under the curve (AUCs) of risk scores for all-cause mortality. The AUCs of the ACTION risk score at 1, 6, 12, 24, and 36 months were 0.942, 0.925, 0.889, 0.856, and 0.832, respectively; those of the CRUSADE risk score were 0.881, 0.883, 0.862, 0.876, and 0.862, respectively; and those of the GRACE risk score were 0.949, 0.928, 0.888, 0.875, and 0.860, respectively.
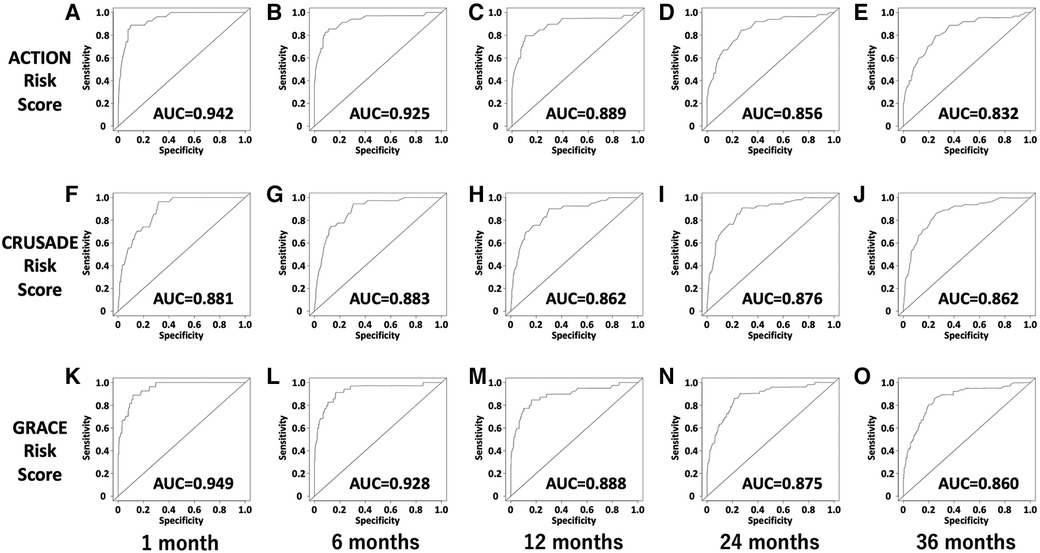
Figure 3. Time-dependent ROC curves of the ACTION, CRUSADE, and GRACE risk scores for all-cause mortality. (A) Time-dependent ROC curve of the ACTION risk score for all-cause mortality at 1 month. (B) Time-dependent ROC curve of the ACTION risk score for all-cause mortality at 6 months. (C) Time-dependent ROC curve of the ACTION risk score for all-cause mortality at 12 months. (D) Time-dependent ROC curve of the ACTION risk score for all-cause mortality at 24 months. (E) Time-dependent ROC curve of the ACTION risk score for all-cause mortality at 36 months. (F) Time-dependent ROC curve of the CRUSADE risk score for all-cause mortality at 1 month. (G) Time-dependent ROC curve of the CRUSADE risk score for all-cause mortality at 6 months. (H) Time-dependent ROC curve of the CRUSADE risk score for all-cause mortality at 12 months. (I) Time-dependent ROC curve of the CRUSADE risk score for all-cause mortality at 24 months. (J) Time-dependent ROC curve of the CRUSADE risk score for all-cause mortality at 36 months. (K) Time-dependent ROC curve of the GRACE risk score for all-cause mortality at 1 month. (L) Time-dependent ROC curve of the GRACE risk score for all-cause mortality at 6 months. (M) Time-dependent ROC curve of the GRACE risk score for all-cause mortality at 12 months. (N) Time-dependent ROC curve of the GRACE risk score for all-cause mortality at 24 months. (O) Time-dependent ROC curve of the GRACE risk score for all-cause mortality at 36 months. ACU, area under curve; ROC, receiver operating characteristics.

Table 3. Comparison between AUCs of risk scores for all-cause mortality.
3.4 Change in AUC of the ACTION, CRUSADE, and GRACE risk scores over time using time-dependent ROC analysis
Figure 4 depicts the AUC of each risk score for all-cause mortality and cardiac death plotted monthly using time-dependent ROC analysis. The AUCs of the ACTION and GRACE risk scores for all-cause mortality were higher than those of the CRUSADE score, especially in the short-term, but decreased over time. In contrast, the AUC of the CRUSADE score remained relatively constant during the observation period.
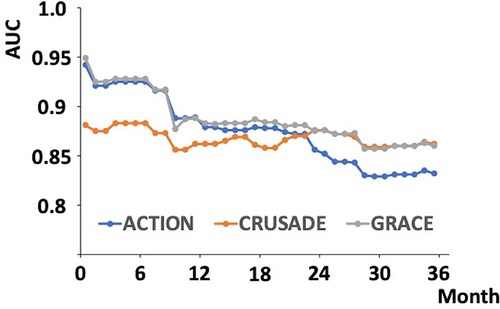
Figure 4. Change in AUC of the ACTION, CRUSADE, and GRACE risk scores over time using time-dependent ROC analysis. The AUCs of the ACTION, CRUSADE, and GRACE risks for all-cause mortality were plotted monthly from the start of follow-up to 36 months. ACU, area under curve; ROC, receiver operating characteristics.
4 Discussion
4.1 Summary of results
This study evaluated the AUCs of the ACTION, CRUSADE, and GRACE risk scores for all-cause mortality using time-dependent ROC analysis for 36 months. The AUCs of each risk score for mortality in patients with ACS remained relatively high during the observation period. The AUCs of the ACTION and GRACE scores were significantly higher than that of the CRUSADE score in the short term but decreased over time. Conversely, the AUC of the CRUSADE score remained relatively constant.
4.2 Differences in AUC trends between risk calculation tools
The AUCs of the ACTION and GRACE risk scores were higher than those of the CRUSADE risk score, especially in the short term. However, the AUCs of the ACTION and GRACE risk scores decreased over time. Nevertheless, the AUC of the CRUSADE score remained relatively constant. Among the data used to calculate risk scores, only the CRUSADE risk score included sex, weight, diabetes mellitus, prior heart failure, prior stroke, and prior peripheral artery disease. The association between diabetes and arteriosclerotic disease is widely known; however, diabetes has also been reported to be associated with cancer, which greatly affects long-term prognosis (32–34). Furthermore, diabetes affects bone metabolism, and fractures in patients with diabetes worsen prognosis (35, 36). Other data for calculating the CRUSADE risk score also affect prognosis (37–42). Systolic pressure; cardiac enzyme levels; and the presence of heart failure, cardiac arrest, and cardiac shock, which are included in the non-CRUSADE risk scores or every risk score, are strongly associated with ACS severity. The mortality rate of ACS is highest during the acute phase (43). Therefore, the AUCs of the ACTION and GRACE risk scores, which have a larger proportion of data strongly associated with ACS severity, might be higher than that of the CRUSADE risk score in the short term and may decrease over time. In contrast, the AUCs of the CRUSADE risk score might have remained constant during the observation period because the CRUSADE risk score includes several data that affect prognosis, regardless of ACS severity.
4.3 The capability of other risk scores for long-term prognosis
This study used the CRUSADE risk score as the long-term risk calculation tool. However, other tools that target long-term prognosis, such as the ACEF, LASSO, and EPICOR scores, are also available (10, 12, 13). Because of the retrospective design of this study, accurate quantitative assessment of LVEF using an ultrasound cardiogram, the use of a diuretic agent, and the timing of the diuretic agent during hospitalization, which are included in these risk scores, were unclear. The left ventricular systolic function and the presence of heart failure might significantly impact long-term prognosis. Therefore, risk scores containing these parameters might demonstrate a more excellent long-term predictive performance than the CRUSADE risk score.
4.4 Clinical implications
Only a few studies have investigated the predictive performance of risk calculation tools for >1 year in patients with ACS. This is the first study to investigate 3-year time-dependent changes in predictive performance for mortality in patients with ACS between risk calculation tools to estimate short- and long-term risk, using time-dependent ROC analysis. The AUCs of each mortality risk score in patients with ACS remained relatively high during the observation period. This study revealed excellent risk stratification performance of the ACTION and GRACE risk scores, especially in the early phase. In contrast, the AUC of the CRUSADE risk score for all-cause death was reversed from the other risk scores during the 3-year observation period; however, there was no significant difference. The difference in the AUC between the CRUSADE and other risk scores might increase by extending the observation period to 5 or 10 years. The ACTION and GRACE risk scores are risk calculation tools proposed to estimate in-hospital mortality (11, 16). Conversely, the CRUSADE risk score is a risk calculation tool proposed to estimate long-term mortality (15). This study demonstrated that each risk score was suitable for risk stratification of the original target periods and was an excellent risk calculation tool. Therefore, the results of this study may support those of previous studies.
4.5 Study limitations
This study has a few limitations. This was a single-center, retrospective study. Furthermore, the sample size was small for testing and comparing several risk scores. Multicenter prospective studies are required to confirm the findings of this study. More than 40% of the patients had multivessel lesions or left main trunk lesions on coronary angiography, but only 3.7% underwent coronary artery bypass grafting as a therapeutic strategy. The results may differ in a facility with a better environment for emergency surgery. The study population was limited to patients who had undergone coronary angiography for ACS. High-risk cases in which ACS was suspected but coronary angiography was not performed because of advanced age, frailty, or bleeding complications may have been included. Patients who did not undergo coronary angiography may have a poorer prognosis. Cases without visible thrombus or critical stenosis, which is almost equivalent to myocardial infarction with non-obstructive coronary disease (MINOCA), were excluded. The inclusion of MINOCA cases might lead to different results.
5 Conclusions
The ACTION and GRACE scores were excellent risk stratification tools for mortality in the short term. The prognostic performance of each risk score was almost similar in the long term, but the CRUSADE score might be a superior risk stratification tool in the longer term than 3 years.
Data availability statement
The datasets presented in this article are not readily available because the deidentified participant data will not be shared. Requests to access the datasets should be directed to takatokuaizawa@hmedc.or.jp.
Ethics statement
The studies involving humans were approved by The ethics committee of Hamamatsu Medical Center. The studies were conducted in accordance with the local legislation and institutional requirements. Written informed consent for participation was not required from the participants or the participants’ legal guardians/next of kin because As a retrospective study, informed consent was not obtained from each patient. Instead, in accordance with our institution's routine ethical regulations, we posted a notice on the study design and contact information in a public location within our institution. In this public notification, we ensured that patients had the opportunity to opt out of participating in this study.
Author contributions
TA: Conceptualization, Data curation, Formal Analysis, Investigation, Methodology, Project administration, Validation, Visualization, Writing – original draft, Writing – review & editing. TN: Data curation, Writing – review & editing. YO: Data curation, Writing – review & editing. SN: Data curation, Writing – review & editing. KI: Data curation, Writing – review & editing. YS: Data curation, Writing – review & editing. NH: Data curation, Writing – review & editing. KS: Data curation, Writing – review & editing. JA: Data curation, Writing – review & editing. SF: Data curation, Writing – review & editing. MM: Data curation, Writing – review & editing. TO: Supervision, Writing – review & editing. YM: Supervision, Writing – review & editing.
Funding
The authors declare that no financial support was received for the research, authorship, and/or publication of this article.
Acknowledgments
We thank all trial physicians and nurses from the participating hospitals for their important contributions to this study.
Conflict of interest
YM reports receipt of scholarship funds or donations of scholarship funds from Abbott Medical Japan LLC, Medtronic Japan Co., Ltd., and BIOTRONIK JAPAN.
The remaining authors declare that the research was conducted in the absence of any commercial or financial relationships that could be construed as a potential conflict of interest.
Publisher's note
All claims expressed in this article are solely those of the authors and do not necessarily represent those of their affiliated organizations, or those of the publisher, the editors and the reviewers. Any product that may be evaluated in this article, or claim that may be made by its manufacturer, is not guaranteed or endorsed by the publisher.
References
1. Canfield J, Totary-Jain H. 40 years of percutaneous coronary intervention: history and future directions. J Pers Med. (2018) 8:33. doi: 10.3390/jpm8040033
2. Ozaki Y, Hara H, Onuma Y, Katagiri Y, Amano T, Kobayashi Y, et al. CVIT expert consensus document on primary percutaneous coronary intervention (PCI) for acute myocardial infarction (AMI) update 2022. Cardiovasc Interv Ther. (2022) 37:1–34. doi: 10.1007/s12928-021-00829-9
3. Lawton JS, Tamis-Holland JE, Bangalore S, Bates ER, Beckie TM, Bischoff JM, et al. 2021 ACC/AHA/SCAI guideline for coronary artery revascularization: executive summary: a report of the American College of Cardiology/American Heart Association joint committee on clinical practice guidelines. J Am Coll Cardiol. (2022) 79:197–215. doi: 10.1016/j.jacc.2021.09.005
4. Bhatt DL, Lopes RD, Harrington RA. Diagnosis and treatment of acute coronary syndromes: a review. JAMA. (2022) 327:662–75. doi: 10.1001/jama.2022.0358
5. Szummer K, Wallentin L, Lindhagen L, Alfredsson J, Erlinge D, Held C, et al. Improved outcomes in patients with ST-elevation myocardial infarction during the last 20 years are related to implementation of evidence-based treatments: experiences from the SWEDEHEART registry 1995–2014. Eur Heart J. (2017) 38:3056–65. doi: 10.1093/eurheartj/ehx515
6. Byrne RA, Rossello X, Coughlan JJ, Barbato E, Berry C, Chieffo A, et al. 2023 ESC guidelines for the management of acute coronary syndromes. Eur Heart J. (2023) 44:3720–826. doi: 10.1093/eurheartj/ehad191
7. Wenzl FA, Kraler S, Ambler G, Weston C, Herzog SA, Räber L, et al. Sex-specific evaluation and redevelopment of the GRACE score in non-ST-segment elevation acute coronary syndromes in populations from the UK and Switzerland: a multinational analysis with external cohort validation. Lancet. (2022) 400:744–56. doi: 10.1016/S0140-6736(22)01483-0
8. Morrow DA, Antman EM, Giugliano RP, Cairns R, Charlesworth A, Murphy SA, et al. A simple risk index for rapid initial triage of patients with ST-elevation myocardial infarction: an InTIME II substudy. Lancet. (2001) 358:1571–5. doi: 10.1016/S0140-6736(01)06649-1
9. Eagle KA, Lim MJ, Dabbous OH, Pieper KS, Goldberg RJ, Van de Werf F, et al. A validated prediction model for all forms of acute coronary syndrome: estimating the risk of 6-month postdischarge death in an international registry. JAMA. (2004) 291:2727–33. doi: 10.1001/jama.291.22.2727
10. Li YM, Li ZL, Chen F, Liu Q, Peng Y, Chen M. A lasso-derived risk model for long-term mortality in Chinese patients with acute coronary syndrome. J Transl Med. (2020) 18:157. doi: 10.1186/s12967-020-02319-7
11. McNamara RL, Kennedy KF, Cohen DJ, Diercks DB, Moscucci M, Ramee S, et al. Predicting in-hospital mortality in patients with acute myocardial infarction. J Am Coll Cardiol. (2016) 68:626–35. doi: 10.1016/j.jacc.2016.05.049
12. Stähli BE, Wischnewsky MB, Jakob P, Klingenberg R, Obeid S, Heg D, et al. Predictive value of the age, creatinine, and ejection fraction (ACEF) score in patients with acute coronary syndromes. Int J Cardiol. (2018) 270:7–13. doi: 10.1016/j.ijcard.2018.05.134
13. Pocock S, Bueno H, Licour M, Medina J, Zhang L, Annemans L, et al. Predictors of one-year mortality at hospital discharge after acute coronary syndromes: a new risk score from the EPICOR (long-tErm follow uP of antithrombotic management patterns In acute CORonary syndrome patients) study. Eur Heart J Acute Cardiovasc Care. (2015) 4:509–17. doi: 10.1177/2048872614554198
14. Fox KAA, FitzGerald G, Puymirat E, Huang W, Carruthers K, Simon T, et al. Should patients with acute coronary disease be stratified for management according to their risk? Derivation, external validation and outcomes using the updated GRACE risk score. BMJ Open. (2014) 4:e004425. doi: 10.1136/bmjopen-2013-004425
15. Granger CB, Goldberg RJ, Dabbous O, Pieper KS, Eagle KA, Cannon CP, et al. Predictors of hospital mortality in the global registry of acute coronary events. Arch Intern Med. (2003) 163:2345–53. doi: 10.1001/archinte.163.19.2345
16. Roe MT, Chen AY, Thomas L, Wang TY, Alexander KP, Hammill BG, et al. Predicting long-term mortality in older patients after non-ST-segment elevation myocardial infarction: the CRUSADE long-term mortality model and risk score. Am Heart J. (2011) 162:875–883.e1. doi: 10.1016/j.ahj.2011.08.010
17. Antman EM, Cohen M, Bernink PJ, McCabe CH, Horacek T, Papuchis G, et al. The TIMI risk score for unstable angina/non-ST elevation MI: a method for prognostication and therapeutic decision making. JAMA. (2000) 284:835–42. doi: 10.1001/jama.284.7.835
18. Choi SY, Kim MH, Serebruany V. Comparison of ACUITY, CRUSADE, and GRACE risk scales for predicting clinical outcomes in patients treated with dual-antiplatelet therapy. TH Open. (2018) 2:e399–406. doi: 10.1055/s-0038-1675576
19. Méndez-Eirín E, Flores-Ríos X, García-López F, Pérez-Pérez AJ, Estévez-Loureiro R, Piñón-Esteban P, et al. Comparison of the prognostic predictive value of the TIMI, PAMI, Cadillac, and GRACE risk scores in STEACS undergoing primary or rescue PCI. Rev Esp Cardiol (Engl Ed). (2012) 65:227–33. doi: 10.1016/j.recesp.2011.10.019
20. Aragam KG, Tamhane UU, Kline-Rogers E, Li J, Fox KAA, Goodman SG, et al. Does simplicity compromise accuracy in ACS risk prediction? A retrospective analysis of the TIMI and GRACE risk scores. PLoS One. (2009) 4:e7947. doi: 10.1371/journal.pone.0007947
21. Huang J, Wei X, Wang Y, Jiang M, Lin Y, Su Z, et al. Comparison of prognostic value among 4 risk scores in patients with acute coronary syndrome: findings from the improving care for cardiovascular disease in China-ACS (CCC-ACS) project. Med Sci Monit. (2021) 27:e928863. doi: 10.12659/MSM.928863
22. Scruth EA, Cheng E, Worrall-Carter L. Risk score comparison of outcomes in patients presenting with ST-elevation myocardial infarction treated with percutaneous coronary intervention. Eur J Cardiovasc Nurs. (2013) 12:330–6. doi: 10.1177/1474515112449412
23. Gonçalves P dA, Ferreira J, Aguiar C, Seabra-Gomes R. TIMI, PURSUIT, and GRACE risk scores: sustained prognostic value and interaction with revascularization in NSTE-ACS. Eur Heart J. (2005) 26:865–72. doi: 10.1093/eurheartj/ehi187
24. Jakimov T, Mrdović I, Filipović B, Zdravković M, Djoković A, Hinić S, et al. Comparison of RISK-PCI, GRACE, TIMI risk scores for prediction of major adverse cardiac events in patients with acute coronary syndrome. Croat Med J. (2017) 58:406–15. doi: 10.3325/cmj.2017.58.406
25. Kristić I, Crnčević N, Runjić F, Čapkun V, Polašek O, Matetic A, et al. ACEF performed better than other risk scores in non-ST-elevation acute coronary syndrome during long term follow-up. BMC Cardiovasc Disord. (2021) 21:70. doi: 10.1186/s12872-020-01841-2
26. Bekler A, Altun B, Gazi E, Temiz A, Barutçu A, Güngör Ö, et al. Comparison of the GRACE risk score and the TIMI risk index in predicting the extent and severity of coronary artery disease in patients with acute coronary syndrome. Anatol J Cardiol. (2015) 15:801–6. doi: 10.5152/akd.2014.5802
27. Lev EI, Kornowski R, Vaknin-Assa H, Porter A, Teplitsky I, Ben-Dor I, et al. Comparison of the predictive value of four different risk scores for outcomes of patients with ST-elevation acute myocardial infarction undergoing primary percutaneous coronary intervention. Am J Cardiol. (2008) 102:6–11. doi: 10.1016/j.amjcard.2008.02.088
28. Heagerty PJ, Lumley T, Pepe MS. Time-dependent ROC curves for censored survival data and a diagnostic marker. Biometrics. (2000) 56:337–44. doi: 10.1111/j.0006-341x.2000.00337.x
29. Thygesen K, Alpert JS, Jaffe AS, Simoons ML, Chaitman BR, White HD, et al. Third universal definition of myocardial infarction. J Am Coll Cardiol. (2012) 60:1581–98. doi: 10.1016/j.jacc.2012.08.001
30. Kanda Y. Investigation of the freely available easy-to-use software “EZR” for medical statistics. Bone Marrow Transplant. (2013) 48:452–8. doi: 10.1038/bmt.2012.244
31. Blanche P, Dartigues JF, Jacqmin-Gadda H. Estimating and comparing time-dependent areas under receiver operating characteristic curves for censored event times with competing risks. Stat Med. (2013) 32:5381–97. doi: 10.1002/sim.5958
32. Larsson SC, Orsini N, Wolk A. Diabetes mellitus and risk of colorectal cancer: a meta-analysis. J Natl Cancer Inst. (2005) 97:1679–87. doi: 10.1093/jnci/dji375
33. Larsson SC, Orsini N, Brismar K, Wolk A. Diabetes mellitus and risk of bladder cancer: a meta-analysis. Diabetologia. (2006) 49:2819–23. doi: 10.1007/s00125-006-0468-0
34. Giovannucci E, Harlan DM, Archer MC, Bergenstal RM, Gapstur SM, Habel LA, et al. Diabetes and cancer: a consensus report. CA Cancer J Clin. (2010) 60:207–21. doi: 10.3322/caac.20078
35. Janghorbani M, Van Dam RM, Willett WC, Hu FB. Systematic review of type 1 and type 2 diabetes mellitus and risk of fracture. Am J Epidemiol. (2007) 166:495–505. doi: 10.1093/aje/kwm106
36. Miyake H, Kanazawa I, Sugimoto T. Association of bone mineral density, bone turnover markers, and vertebral fractures with all-cause mortality in type 2 diabetes mellitus. Calcif Tissue Int. (2018) 102:1–13. doi: 10.1007/s00223-017-0324-x
37. Groenveld HF, Januzzi JL, Damman K, van Wijngaarden J, Hillege HL, van Veldhuisen DJ, et al. Anemia and mortality in heart failure patients a systematic review and meta-analysis. J Am Coll Cardiol. (2008) 52:818–27. doi: 10.1016/j.jacc.2008.04.061
38. Sasazuki S, Inoue M, Tsuji I, Sugawara Y, Tamakoshi A, Matsuo K, et al. Body mass index and mortality from all causes and major causes in Japanese: results of a pooled analysis of 7 large-scale cohort studies. J Epidemiol. (2011) 21:417–30. doi: 10.2188/jea.je20100180
39. Ushigome R, Sakata Y, Nochioka K, Miyata S, Miura M, Tadaki S, et al. Temporal trends in clinical characteristics, management and prognosis of patients with symptomatic heart failure in Japan—report from the CHART studies. Circ J. (2015) 79:2396–407. doi: 10.1253/circj.CJ-15-0514
40. Hirsch AT, Haskal ZJ, Hertzer NR, Bakal CW, Creager MA, Halperin JL, et al. ACC/AHA. 2005 guidelines for the management of patients with peripheral arterial disease (lower extremity, renal, mesenteric, and abdominal aortic): executive summary a collaborative report from the American Association for Vascular Surgery/Society for Vascular Surgery, Society for Cardiovascular Angiography and Interventions, Society for Vascular Medicine and Biology, and the ACC/AHA task force on practice guidelines. Society of Interventional Radiology (Writing Committee to Develop Guidelines for the Management of Patients with Peripheral Arterial Disease) endorsed by the American Association of Cardiovascular and Pulmonary Rehabilitation; National Heart, Lung, and Blood Institute; Society for Vascular Nursing; TransAtlantic Inter-Society Consensus; and Vascular Disease Foundation. J Am Coll Cardiol. (2006) 47:1239–312. doi: 10.1016/j.jacc.2005.10.009
41. Miyachi H, Takagi A, Miyauchi K, Yamasaki M, Tanaka H, Yoshikawa M, et al. Current characteristics and management of ST elevation and non-ST elevation myocardial infarction in the Tokyo metropolitan area: from the Tokyo CCU network registered cohort. Heart Vessels. (2016) 31:1740–51. doi: 10.1007/s00380-015-0791-9
42. Shavelle RM, Brooks JC, Strauss DJ, Turner-Stokes L. Life expectancy after stroke based on age, sex, and Rankin grade of disability: a synthesis. J Stroke Cerebrovasc Dis. (2019) 28:104450. doi: 10.1016/j.jstrokecerebrovasdis.2019.104450
Keywords: time-dependent receiver operating characteristic analysis, mortality, risk calculation tool, ACTION score, CRUSADE score, GRACE score, acute coronary syndrome, predictive performance
Citation: Aizawa T, Nagao T, Oda Y, Nakano S, Ito K, Shirai Y, Hosoya N, Sawasaki K, Arai J, Fujita S, Muto M, Oda T and Maekawa Y (2024) Short- and long-term performance of risk calculation tools for mortality in patients with acute coronary syndrome. Front. Cardiovasc. Med. 11:1388686. doi: 10.3389/fcvm.2024.1388686
Received: 20 February 2024; Accepted: 13 May 2024;
Published: 28 May 2024.
Edited by:
Turgay Celik, Wake Forest Baptist Medical Center, United StatesReviewed by:
Flavio Giuseppe Biccirè, Sapienza University of Rome, ItalyIvan Ilić, Institute for Cardiovascular Diseases Dedinje, Serbia
© 2024 Aizawa, Nagao, Oda, Nakano, Ito, Shirai, Hosoya, Sawasaki, Arai, Fujita, Muto, Oda and Maekawa. This is an open-access article distributed under the terms of the Creative Commons Attribution License (CC BY). The use, distribution or reproduction in other forums is permitted, provided the original author(s) and the copyright owner(s) are credited and that the original publication in this journal is cited, in accordance with accepted academic practice. No use, distribution or reproduction is permitted which does not comply with these terms.
*Correspondence: Takatoku Aizawa, takatokuaizawa@hmedc.or.jp