Lyophilization process engineering and thermostability of ID93 + GLA-SE, a single-vial adjuvanted subunit tuberculosis vaccine candidate for use in clinical studies
 Timothy S. Dutill1 Michelle C. Archer2 Joseph McCollum2 Chris Press2 Lisa McNeill2 Linda Hawkins2 Tony Phan2 Erik D. Laursen2 Richard Cabullos2 Lisa Bouchard2 Regie J. Castro2 Mong-Wu Lin2 Jeralyn Roco2 Cecile Blois2
  Babatunde A. Adeagbo2,3 Jeffrey A. Guderian2 Alana Gerhardt2 Anna Marie Beckmann2 Edward H. Trappler1 Ryan M. Kramer2
  Christopher B. Fox2,4*
- 1Lyophilization Technology, Inc., Warminster, PA, United States
- 2Access to Advanced Health Institute (AAHI; Formerly Infectious Disease Research Institute), Seattle, WA, United States
- 3Department of Pharmaceutical Chemistry, Obafemi Awolowo University, Ile-Ife, Nigeria
- 4Department of Global Health, University of Washington, Seattle, WA, United States
Promising clinical efficacy results have generated considerable enthusiasm for the potential impact of adjuvant-containing subunit tuberculosis vaccines. The development of a thermostable tuberculosis vaccine formulation could have significant benefits on both the cost and feasibility of global vaccine distribution. The tuberculosis vaccine candidate ID93 + GLA-SE has reached Phase 2 clinical testing, demonstrating safety and immunogenicity as a two-vial point-of-care mixture. Earlier publications have detailed efforts to develop a lead candidate single-vial lyophilized thermostable ID93 + GLA-SE vaccine formulation. The present report describes the lyophilization process development and scale-up of the lead candidate thermostable ID93 + GLA-SE composition. The manufacture of three full-scale engineering batches was followed by one batch made and released under current Good Manufacturing Practices (cGMP). Up to 4.5 years of stability data were collected. The cGMP lyophilized ID93 + GLA-SE passed all manufacturing release test criteria and maintained stability for at least 3 months when stored at 37°C and up to 24 months when stored at 5°C. This work represents the first advancement of a thermostable adjuvant-containing subunit tuberculosis vaccine to clinical testing readiness.
1 Introduction
Until the onset of the COVID-19 pandemic, tuberculosis was responsible for more annual deaths worldwide than any other infectious disease (Author Anonymous, 2021). While recent progress in tuberculosis vaccine development is encouraging (Tait et al., 2019), additional effort is needed to advance vaccine candidates through the clinical pipeline while also maximizing their suitability for distribution in resource-poor environments. In particular, an effective tuberculosis vaccine that could be stored outside the cold chain, even for a limited time, could provide substantial advantages for global vaccine delivery (Lee et al., 2017). Indeed, multiple reports indicate various technologies can be employed to increase the thermostability of vaccine candidates for tuberculosis or other indications (Preston and Randolph, 2021; Qi and Fox, 2021; Kumar et al., 2022).
Despite advancements in improving vaccine thermostability, few thermostable vaccine candidates have progressed to clinical studies and licensure. In addition, unique challenges are associated with adapting thermostable technologies for vaccines containing adjuvants (Qi and Fox, 2021). Moreover, the complex pathway from preclinical proof-of-concept demonstration to manufacturing under current Good Manufacturing Practices (cGMP) for clinical testing is often not well described in the scientific literature. This omission prevents the dissemination of the lessons learned and thus hampers the ability of other product candidates to advance from the bench to the clinic.
Previously, we described the preclinical development including excipient screening and formulation development of a thermostable lyophilized tuberculosis vaccine candidate containing ID93 (a recombinant subunit antigen) and GLA-SE (a squalene emulsion containing the synthetic Toll-like receptor 4 agonist glucopyranosyl lipid adjuvant [GLA]) (Orr et al., 2014; Barnes V et al., 2017; Kramer et al., 2018). Here, we detail the process engineering and scale-up of the lyophilization procedure as well as the cGMP manufacture and stability characterization of the ID93 + GLA-SE thermostable vaccine candidate in preparation for Phase 1 clinical testing. We also describe challenges encountered and lessons learned, with the objective of providing potentially beneficial know-how to other entities endeavoring to advance thermostable vaccine candidates to the Phase 1 clinical evaluation stage.
The development procedure consisted of first characterizing the thermal properties of the vaccine formulation to identify target temperature thresholds for subsequent lyophilization process engineering studies. Small-scale (≤200 vials) lyophilization process studies involved sequentially assessing the impact of shelf temperature, chamber pressure, primary drying time, and secondary drying time on lyophilization performance, enabling the identification of critical process parameters. Next, a small-scale batch was lyophilized using the target parameters and compared to batches made with systematically altered shelf temperature and chamber pressure parameters to establish the robustness of the lyophilization process around the target parameters. The final lyophilization process suitability was then verified at full scale (≥2,600 vials) by lyophilizing three engineering batches. Following the successful lyophilization of the engineering batches, a cGMP batch was manufactured. Finally, cGMP and engineering batches were monitored for accelerated and long-term stability performance.
2 Materials and methods
2.1 Lyophilization process development
2.1.1 Raw materials and compounding
Research-grade ID93 (1 mg/ml) in 20 mM Tris buffer (pH 8.0) bulk was manufactured in-house essentially as previously described (Bertholet et al., 2010), and cGMP ID93 (0.5 mg/ml in 20 mM Tris buffer at pH 8.0) was manufactured by the Center for Biocatalysis and Bioprocessing at the University of Iowa (Coralville). ID93 was stored at ≤−65°C until use. Research-grade and cGMP GLA-SE (50 μg/ml GLA with 10% v/v squalene) were manufactured in-house essentially as previously described (Misquith et al., 2014) except, to simplify subsequent compounding prior to lyophilization, no glycerol or buffer was employed. With the exception of the small-scale cycle development studies, GLA-SE contained 0.5% w/v α-tocopherol as an antioxidant. GLA-SE was stored at 5°C ± 3°C until use. The following materials were purchased for compounding: tromethamine (Tris) (Spectrum Chemical, New Brunswick, NJ, or J.T.Baker, Phillipsburg, NJ), D-(+)-trehalose dihydrate (Spectrum Chemical or Pfanstiehl, Waukegan, IL), and hydrochloric acid (Spectrum Chemical or Fisher Scientific, Waltham, MA). Glass vials (Type I, 3-ml) and FluroTec-coated chlorobutyl stoppers were acquired from Kimble (Vineland, NJ), West Pharmaceutical Services (Exton, PA), or Schott (Mainz, Germany). Immediately prior to use, ID93 was thawed and diluted, if needed depending on stock concentration, in 25 mM Tris buffer (pH 7.5) and combined with a concentrated solution of trehalose in 25 mM Tris buffer and GLA-SE to achieve target concentrations of 4 μg/ml ID93, 10 μg/ml GLA, 2% v/v SE, 100 mg/ml trehalose, and 20 mM Tris buffer (pH 7.5). Except for the initial small-scale cycle development studies, the pre-lyophilization compounded bulk preparation was filtered through a 0.22-µm or a 0.8/0.2-µm polyethersulfone filter.
2.1.2 Pre-lyophilization thermal analysis
Electrical resistance (ER), freeze-drying microscopy (FDM), and low-temperature differential scanning calorimetry (LT-DSC) measurements were performed on bulk formulations prior to lyophilization.
2.1.2.1 Electrical resistance
ER was measured on approximately 1.8 ml of sample in a 20-mm glass tube using a 0–20 MΩ resistance instrument and a ceramic resistance probe consisting of two parallel gold strips on a ceramic plate. Temperature was measured using a 32-gauge type-T thermocouple located at the ceramic probe on the opposite side of the gold plates. The sample was cooled and warmed at an average rate of 0.5°C/min at atmospheric conditions, with the warming ramp paused for 2 h at −35°C to mimic the FDM conditions (below). A deviation in resistance was used to determine the onset of the phase transition upon cooling or warming. A Kaye Validator instrument with associated Collect software (St. Marys, PA) recorded temperature measurements every 10 s.
2.1.2.2 Freeze-drying microscopy
For FDM analysis, approximately 0.15 ml of sample was dispensed into a glass cell, which was then placed on a temperature-controlled stage. The sample cell was outfitted with two 32-gauge type-T thermocouples placed directly into the material at the bottom center and side center of the cell to monitor sample temperatures. The sample was cooled at a rate of 0.5°C/min to a target setpoint of ≤−45°C. Upon completion of freezing, the stage chamber was evacuated to initiate the sublimation of ice. The stage was warmed at a rate of 0.5°C/min, with a pause at −35°C for 2 h to allow a clear sublimation front to form. The sample was observed during freezing and drying using an InfiniVar microscope (Bioimager, Vaughan, Canada) coupled to a Super WDR CCD camera (Sony Electronics, San Diego, CA). A Kaye Validator instrument with the Collect software recorded temperature measurements every 10 s.
2.1.2.3 Low-temperature differential scanning calorimetry
Modulated LT-DSC analysis followed the United States Pharmacopeia (USP) <891> guidance for thermal analysis and was performed using a Q200 DSC (TA Instruments, New Castle, DE) operated with a refrigerated cooling system and Advantage v5.0.4 and Universal Analysis v4.5A software (TA Instruments). Approximately 20.3 mg of sample was placed in an aluminum pan with a lid crimped in place. Filtered nitrogen purged the sample continuously at a flow rate of 50 ml/min. Following sample freezing at −65°C, a warming scan rate of 2°C/min was employed with a sinusoidal modulation of ±0.32°C occurring every 60 s.
2.1.3 Lyophilization process
Lyophilization was performed using 8FS12C (process engineering and boundary batches), 8FS15C (target and full-scale engineering batches), and 8FS15-SS20C (cGMP batch) freeze dryers (SP Hull, Warminster, PA). Each lyophilizer has 4 shelves, with each shelf having a capacity of 740 3-ml vials. The vaccine composition was filled into Type I 3-ml glass tubing vials at the specified fill amounts for each batch as described in the results section [either 0.90 g (0.87 ml) or 1.03 g (1.0 ml)]. The number of vials filled for each batch ranged from 25 to 2,836 as described in the results section. The remainder of the vials in all trays were filled with alternative formulations or placebo buffer. Single-vented FluroTec-coated chlorobutyl stoppers were partially inserted into the filled vials. In selected batches, some vials were removed prior to lyophilization for comparison to lyophilized material. Shelf temperature was cooled to the indicated target setpoint for the freezing step at the designated average controlled rate. The condenser was chilled to <−40°C, and the lyophilization chamber was evacuated to the target pressure. Using a 0.2-µm filtered nitrogen, USP bleed, the chamber pressure was controlled at a target setpoint to maintain the product temperature below the critical threshold temperature determined by low-temperature thermal analysis. Shelf temperature was then warmed at an average controlled rate of 0.5°C/min until reaching the target setpoint for the primary drying step after which the temperature was maintained until completion of sublimation. Shelf temperature was then warmed to a target setpoint for secondary drying at the indicated average controlled rate. Finally, the chamber pressure was raised to 14.7 ± 0.7 PSIA by introducing a 0.2-µm filtered nitrogen, USP bleed into the lyophilizer, and the vials were stoppered.
2.1.4 In-process monitoring
Thermocouples placed in the bottom of up to ten product vials located near the center or the edge of the tray were used to monitor product temperature at various locations. Shelf temperature and chamber pressure were also monitored throughout the lyophilization process. In addition, a thermocouple vacuum gauge (Teledyne Hastings, Hampton, VA) and a residual gas quadrupole mass spectrophotometer (Microvision Plus, MKS Instruments, Andover, MA) were employed to monitor the gas environment within the lyophilization chamber in selected batches.
2.2 Post-lyophilization analytical characterization
2.2.1 Characterization by Lyophilization Technology Inc
2.2.1.1 Visual inspection
Physical inspection of 100% of the vials evaluated uniformity of product appearance in color, texture, shape, and structure. Each product vial was viewed at the bottom, sides, and top of the cake while rotating the container to view all sides, and images were recorded by photographing the vials at different viewing angles.
2.2.1.2 Reconstitution time
Reconstitution time was evaluated by adding purified water as diluent to the center of the dried cake and determining the length of time (at 5-s intervals) for the material to form an opaque, white emulsion with no visible particulates.
2.2.1.3 pH
Reconstituted product pH was measured per USP <791> after standardization with two or three pH buffers bracketing the expected sample range. Product from three reconstituted vials was pooled to obtain sufficient volume to cover the pH probe. The measurement value was allowed to stabilize for at least 15 s before recording.
2.2.1.4 Residual moisture
Residual moisture testing was performed per USP <921>. Briefly, the lyophilized product and container were first weighed. Then, 2 ml of anhydrous methanol was added to the lyophilized product to suspend or dissolve the dried cake for at least 1 h. A 1-ml aliquot was removed and injected into the reaction vessel of a coulometric Karl Fischer (KF) titration instrument (Metrohm, Riverview, FL). Upon completion of the automatic titration, a water content value was obtained from the instrument. The product vial and stopper were then cleaned, dried, and weighed. The empty product container weight was subtracted from the lyophilized product vial weight to calculate the dried product content, and the percentage residual moisture was then calculated using the measured water content value.
2.2.1.5 High-temperature differential scanning calorimetry
High-temperature differential scanning calorimetry (HT-DSC) and high-temperature modulated differential scanning calorimetry (HT-MDSC) were used to determine the glass transition of solid materials per USP <891> using a Q200 DSC and Universal Analysis v4.5A software. Approximately 2–13 mg of dried product was placed in an aluminum sample pan with a vented lid. Filtered nitrogen purged the sample continuously at a flow rate of 20 ml/min. The sample was heated from 20°C to 180°C at 10°C/min for HT-DSC or 2°C/min for MDSC (with a modulation of 0.32°C every 60 s).
2.2.2 Characterization and stability testing by AAHI
2.2.2.1 Process development and engineering batch characterization and stability
For development and/or engineering vaccine formulation batches, the following techniques were employed in AAHI’s research laboratory. For analytical and stability characterization, lyophilized vaccine product was reconstituted back to the initial component concentrations by adding 0.8 ml freshly dispensed Milli-Q water (MilliporeSigma, Burlington, MA) to the dried cake to form an opaque, white emulsion with no visible particulates.
2.2.2.1.1 Particle diameter
Average hydrodynamic diameter (Z-ave) was measured using dynamic light scattering with a Zetasizer APS (Malvern Panalytical, Malvern, United Kingdom) as previously described (Chan et al., 2017). One replicate of each sample was diluted 10-fold in freshly dispensed Milli-Q water and measured three times.
2.2.2.1.2 Gel electrophoresis
Reducing sodium dodecyl sulfate–polyacrylamide gel electrophoresis (SDS-PAGE) was used to detect the presence of the ID93 protein in reconstituted samples essentially as described previously (Schwartz et al., 2017). Briefly, samples were prepared with 4X LDS buffer (Thermo Fisher Scientific, Waltham, MA) spiked with 5% v/v β-mercaptoethanol, heated to 90°C for 15 min, cooled, spun down, briefly vortexed, and then 24 ng of ID93 was loaded into a Tris-glycine 4–20% gradient gel. Gels were run at 180 V for 65 min using Tris-glycine SDS running buffer and stained using a protein silver-staining kit according to manufacturer’s instructions (ProteoSilver, Sigma-Aldrich, St. Louis, MO). Stained gels were imaged using a gel imaging system (AlphaImager EC, ProteinSimple, San Jose, CA).
2.2.2.1.3 ID93 content
An ELISA measured ID93 antigen content. This method used direct capture and indirect detection. A high-binding, flat-bottom 96-well plate was coated directly with sample containing ID93 and subsequently blocked with 1% bovine serum albumin-phosphate-buffered saline-Tween (BSA-PBS-T). Samples were probed using a mouse ID93-specific monoclonal primary antibody followed by washing with PBS-T after incubation. A goat anti-mouse IgG horseradish peroxidase (HRP)-conjugated antibody, dissolved in PBS, was used for detection followed by washing with PBS-T after incubation. The substrate 3,3′,5,5′-tetramethylbenzidine (TMB) was used for development, and development was stopped with 1 N sulfuric acid. Absorbance was read at 570 nm using a plate reader (Synergy 2, BioTek Instruments, Winooski, VT) within 30 min of stopping development. ID93 content in each sample was interpolated from a 4-parameter sigmoidal standard curve of ID93. A freshly admixed internal control was included on each 96-well plate to ensure accurate interpolation.
2.2.2.1.4 GLA content
GLA concentration was measured by reversed-phase high-performance liquid chromatography (HPLC) using a C18 Atlantis T3 reversed-phase column (Waters, Milford, MA) and a Corona Charged Aerosol Detector (CAD) (ESA Biosciences, Chelmsford, MA) essentially as described previously (Kramer et al., 2018) except that the mobile phase gradient was 18 min and duplicates of each sample were diluted 10-fold in mobile phase B prior to injection.
2.2.2.1.5 pH
The pH of the stored product after reconstitution at each time point was measured using an Orion ROSS Ultra Semi-micro pH Electrode (Thermo Fisher Scientific, Waltham, MA) on aliquots of ≥100 µl. Unless otherwise noted, pH measurements of the reconstituted samples were performed on one vial from each batch at each time point.
2.2.2.1.6 Residual moisture
Residual moisture of the stored product was measured using volumetric KF titration essentially as described above except that 1 ml of anhydrous methanol was used to dissolve the dried cake, and the sample was then injected into the reaction chamber of a V30 Volumetric KF Titrator (Mettler Toledo, Columbus, OH). Unless otherwise noted, residual moisture measurements were performed on one vial from each batch for the indicated time point.
2.2.2.2 cGMP batch characterization and stability
For release and stability testing of the cGMP batch of vaccine formulation, the following analytical techniques were employed by AAHI’s cGMP Quality Control (QC) laboratory. Additional release test methods are provided in Supplementary Material. Lyophilized vaccine product was reconstituted back to the initial component concentrations by adding 0.8 ml sterile water for injection (WFI) to the dried cake to form an opaque, white emulsion with no visible particulates.
2.2.2.2.1 Visual inspection
Test product vials were visually inspected for the appearance of the lyophilized cake and again after reconstitution. The reconstituted product was assessed for foreign matter, contamination, and particulates per USP <790>.
2.2.2.2.2 Particle diameter
Particle mean hydrodynamic diameter was measured using the Zetasizer Nano S (Malvern Panalytical) in conjunction with the Dispersion Technology Software (Malvern Panalytical). Product particle size was measured when the reconstituted product was diluted at 1:100 in sterile WFI.
2.2.2.2.3 ID93 content
ID93 content was measured by ELISA essentially as described above except that the plates were read using a calibrated SpectraMax Plus 384 Microplate Reader (Molecular Devices, San Jose, CA), with background signal at 650 nm subtracted from the test signal at 450 nm. Data were analyzed and the sample concentration was calculated using a 4-parameter curve fit in SoftMax Pro Software v5.4.1 (Molecular Devices). Method suitability testing using the target product composition indicated that the method was specific for ID93, calibration curve had an R2 ≥ 0.99, ID93 recovery was 97–116% (accuracy), absorbance response was 1.5–8.5% coefficient of variation (CV) across six replicate wells (repeatability), and day-to-day absorbance response was 4% CV with operator-to-operator absorbance response of 17% CV (intermediate precision).
ID93 content was also quantified by SDS-PAGE. Samples, references, and blanks were prepared with Novex 2X Tris-Glycine SDS Sample Buffer (Thermo Fisher Scientific), NuPAGE Sample Reducing Agent (Thermo Fisher Scientific), and 2-mercaptoethanol (MP Biomedicals, Irvine, CA), and heated in a dry bath at 90°C for 15 min. All preparations were loaded on Novex WedgeWell 4–20% Tris-Glycine 1 mm, 15-well Mini Gels (Thermo Fisher Scientific), and run with Novex Tris-Glycine SDS Running Buffer (Thermo Fisher Scientific) at a constant 225 V. Gels for SDS-PAGE were stained using SYPRO Ruby Protein Gel Stain (Thermo Fisher Scientific). Densitometry was performed using the FluorChem Imaging System (Alphas Innotech, San Jose, CA).
2.2.2.2.4 GLA content
Reversed-phase HPLC analysis of GLA content with fluorescence detection (HPLC-FLD) was performed on an Agilent 1260 Infinity Fluorescence Detector (Agilent Technologies). Samples were prepared utilizing a solid-phase extraction via Sep-Pak Accell Plus QMA 6 cc Vac cartridges (Waters), derivatized pre-column with dansylhydrazine (Sigma-Aldrich), and detected by fluorescence. Separation was performed using a Nova-Pak C18 3.9 × 300 mm 4 µm column (Waters) with a gradient over 75 min. Mobile phase A contained 5 mM tetrabutylammonium phosphate (TBAP) in 95% acetonitrile, and mobile phase B contained 5 mM TBAP in 95% isopropanol. Column temperature was held constant at 50°C, and GLA was detected with the fluorescence detector. A set of neat triplicate samples and a set of triplicate samples spiked with GLA standard were analyzed using a 5-point GLA standard curve prepared in mobile phase A. The peak areas from the standards were determined by integration using OpenLab ChemStation software and a linear curve fit. GLA content of the samples was calculated by interpolation. Method suitability testing using the target product composition indicated GLA recovery of 88–112% (accuracy), 0.05% relative standard deviation (RSD) of retention time (injection repeatability), 6.4% RSD of peak area response and 19.2% RSD of GLA concentration (intra-assay precision), 1.8–9.8% RSD of peak area response (day-to-day intermediate precision), calibration curve with R2 ≥ 0.999 (linearity), limit of detection (LOD) of 1.0 μg/ml, and limit of quantitation (LOQ) of 3.1 μg/ml.
2.2.2.2.5 pH
pH measurements were made potentiometrically per USP <791> using an Accumet XL15 benchtop pH meter and a refillable, glass-body accumet accuCap capillary junction pH combination electrode (Fisher Scientific).
2.2.2.2.6 Residual moisture
Residual moisture testing was performed using a coulometric KF titrator (Denver Instrument, Bohemia, NY). Briefly, the lyophilized product vial was first weighed. Then, HYDRANAL-Coulomat AG reagent (Honeywell, Charlotte, NC) was used to suspend or dissolve the dried cake. Upon completion of the automatic titration, a water content value was obtained from the instrument.
2.2.2.2.7 Potency
The biological activity, or potency, of the product was assessed via an ID93 antigen immunogenicity assay performed in mice. C57BL/6 mice were injected subcutaneously with a 200-µL vaccine dose containing 1.6 µg ID93 and 4 μg GLA, and blood was collected 7 days after injection via cardiac puncture. Anti-ID93 IgG2c was analyzed in a single endpoint titer sandwich ELISA using naïve sera collected from either the retro-orbital or submandibular route from the same mice as controls. All mouse work was performed by a contract laboratory, Pacific BioLabs, under their Institutional Animal Care and Use Committee (IACUC) guidelines. The serum was separated and stored at ≤−65°C until ELISA analysis. Immulon flat-bottom 96-well microtiter plates were coated with ID93 antigen at 2 μg/ml in 1X coating solution (Kirkegaard and Perry Laboratories). After washing with 1X wash solution (Kirkegaard and Perry Laboratories), plates were blocked overnight using 1% BSA Diluent/Blocking Solution (Kirkegaard and Perry Laboratories). Plates were washed again, and test sample sera were serially diluted and applied to the plates. Plates were washed and incubated in goat anti-mouse IgG2c-HRP antibody (SouthernBiotech, Birmingham, AL) diluted 1:5,000 in 1% blocking solution diluted 1:10 in 1X wash solution. Plates were washed, and substrate solution (TMB, Kirkegaard and Perry Laboratories) was added to develop color. The color reaction was stopped with 1 N sulfuric acid, and plates were read within 20 min using a calibrated SpectraMax Plus384 Microplate Reader. Background signal at 650 nm was subtracted from test signal at 450 nm. SoftMax Pro Software was used to analyze data and calculate the endpoint titer, defined as the reciprocal serum dilution resulting in an optical density (OD) of 0.1 using a 4-parameter curve fit.
2.2.3 Statistical analysis
Statistical analysis of stability data was performed using GraphPad Prism v9.4.1 (San Diego, CA). Unpaired parametric t tests comparing the cGMP batch to the engineering batches at shared temperatures and time points were performed assuming Gaussian data distribution and a single pooled variance (i.e., that all samples were from populations with the same standard deviation). However, due to the limited number of samples, it was not possible to verify these assumptions. The t tests were corrected for multiple comparisons using Holm-Sidak’s method, and the statistical significance threshold α was set as p < 0.05.
3 Results
3.1 Lyophilization process development
To enable development of an effective and robust lyophilization process, thermal analysis was performed on the bulk liquid ID93 + GLA-SE vaccine composition to identify the appropriate threshold processing parameters for freezing and freeze-drying. As described in our previous work (Kramer et al., 2018), the lead candidate vaccine composition consisted of 4 μg/ml ID93 subunit antigen, 10 μg/ml GLA, 2% v/v stable emulsion (SE), 100 mg/ml trehalose, and 20 mM Tris buffer (pH 7.5). Thermal analysis of the bulk formulation consisted of ER, FDM, and LT-DSC. The ER measurements suggested the sample supercooled to −8°C prior to the nucleation of ice and a phase transition occurred at −18°C, regardless of whether the sample was being cooled or warmed (Figure 1). However, FDM observations indicated a temperature below at least −11.3°C was required for nucleation of ice and below at least −26.9°C was required to achieve complete solidification (Figure 2). Furthermore, the warming phase of FDM analysis revealed void formation beginning at −27.4°C with the coincident sublimation of ice. Finally, LT-DSC performed during warming of the product indicated a glass transition having an onset of −31.58°C and −29.56°C as a point of inflection with a 0.3709 J/g enthalpy change and a second endothermic event representing melting of ice at 0.8°C (293.8 J/g enthalpy change), reflected in the analysis by reversing heat flow (Figure 3). Conditions for the primary drying process during lyophilization should provide a margin of safety. Therefore, based on the combined thermal analysis data, a temperature range of −32°C to −30°C was selected as the critical threshold temperature. This target threshold product temperature (Tp) during the sublimation of ice in primary drying was selected to achieve a dried product that retains the structure established during freezing. Such an approach is proposed to prevent void formation and thus reduce the risk of undesirable product appearance, high residual moisture levels, extended reconstitution time, and product degradation. Moreover, since the target product temperature range determined for primary drying is below the temperature required to achieve complete solidification during freezing, a temperature of <−30°C was determined as the target product freezing temperature (Tf).
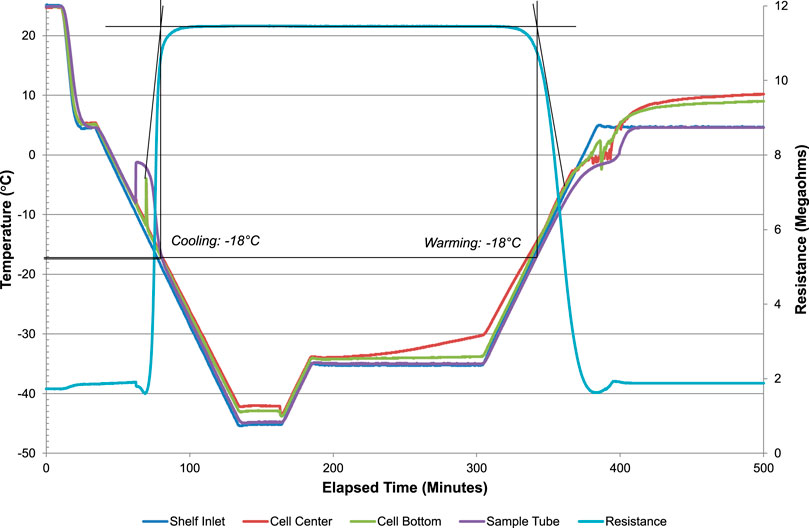
FIGURE 1. Electrical resistance thermal analysis of bulk liquid ID93 + GLA-SE vaccine formulation prior to lyophilization. Electrical resistance measurements were collected at a scanning rate of every 10 s with ramping the sample at 0.5°C/min for both cooling and warming. Phase transitions are indicated by a significant change in resistance. Temperature was monitored at the same time interval using a type-T thermocouple adjacent to the sample cell.
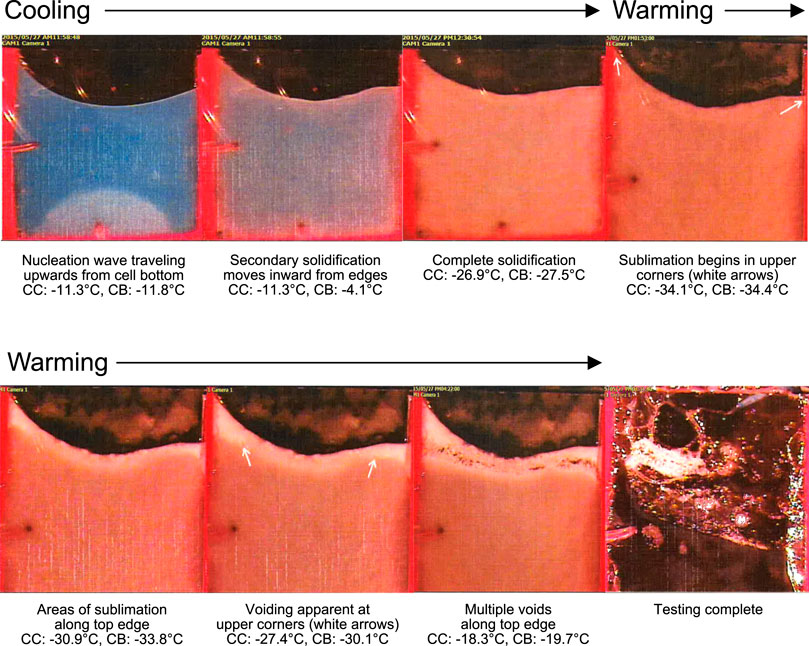
FIGURE 2. Freeze-drying microscopy thermal analysis of bulk liquid ID93 + GLA-SE vaccine formulation prior to lyophilization. Freeze-drying microscopy analysis was conducted with temperature measurements of the cell side center and cell bottom center using 32-gauge type-T thermocouples at 0.5°C/min cooling and warming ramps, with a 2-h pause at −35°C upon warming to allow a clear sublimation front to form. Temperature was recorded every 10 s at the side center (CC) and bottom (CB) of the cell.
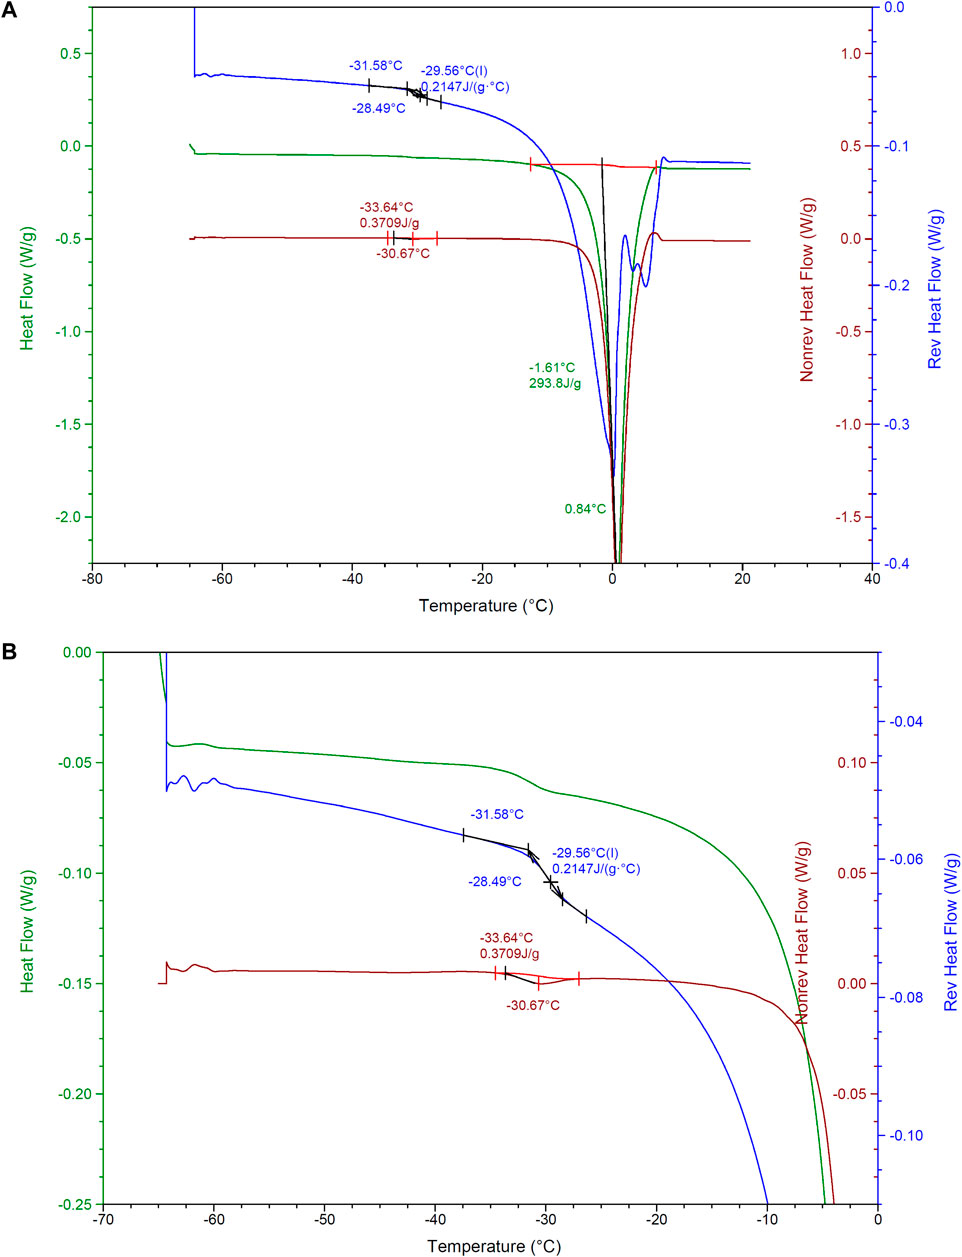
FIGURE 3. Differential scanning calorimetry thermal analysis of bulk liquid ID93 + GLA-SE vaccine formulation prior to lyophilization. (A) Modulating LT-DSC was conducted on samples frozen to −65°C and warmed at 2°C/min with a sinusoidal modulation of ±0.32°C every 60 s, allowing identification of the reversing heat flow (heat capacity component) and the non-reversing heat flow (kinetic component). The glass transition is detected in the reversing heat flow component, whereas the melting transition can be represented in both components. Line colors correspond to the y-axes. (B) Magnified section of panel (A) to highlight the glass transition behavior.
To achieve the product parameters defined above, initial lyophilization process development studies were designed to evaluate the effect of different shelf temperatures and chamber pressures on product temperature during primary drying (Table 1). For both studies, the bulk liquid formulation was prepared (pH 7.6) and dispensed at a target weight of 1.03 g (corresponding to a 1-ml volume, with an allowable range of 1.00–1.07 g) into 25 glass 3-ml vials located near the center of the lyophilizer tray, with three vials containing 32-gauge type-T thermocouples to monitor the product temperature. The shelf temperature was lowered from 5°C to −40°C at a rate of 0.5°C/min and maintained at −40°C for 14 h to complete an overnight freeze. At the end of freezing, the product temperature was confirmed to be below the maximum recommended freezing temperature of −30°C. This allowed for making direct product physical observations during primary drying for the early process engineering efforts. The following morning, the chamber was evacuated to the target chamber pressure, controlled with a filtered nitrogen, USP bleed. Shelf temperature and chamber pressure were evaluated as described below, and finished product attributes were assessed based on a target product profile (TPP) for a lyophilized preparation, including physical appearance (target: elegant white cake), reconstitution time (target: ≤1 min), reconstituted product appearance (target: uniform, milky-white, opaque emulsion), pH (target: 7.5–8.5), residual moisture (target: ≤2% w/w or as low as possible), and thermal analysis [target: glass transition temperature (Tg) as high as possible].
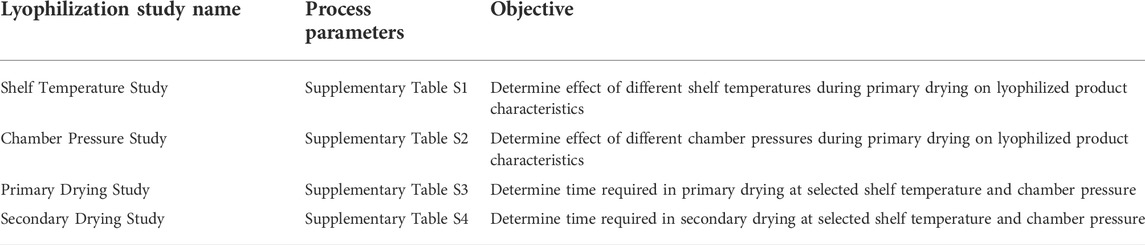
TABLE 1. Lyophilization process development study design.
For the shelf temperature study, the primary drying shelf temperature was held at −25°C for 3 h and increased at 3°C intervals every 2 h to a final target temperature of -13°C (Supplementary Table S1). The magnitude of the effect of the shelf temperature on the product temperature decreased with increasing temperature until the sublimation front began to proceed further down the vial, after which the shelf temperature effect on product temperature increased, suggesting the dried layer presented a significant resistance to mass transfer (Supplementary Table S1). Product “break” temperatures were denoted by a rapid increase in product temperature and indicated the end of evaporative cooling (i.e., sublimation of ice). The average product break temperature for the shelf temperature study was −27.5°C. Several of the product vial temperatures measured in the shelf temperature study (Table 2) were above the recommended range (−32°C to −30°C) determined by low-temperature thermal analysis of the pre-lyophilized bulk formulation as described above. Finished product characterization (Table 2) indicated prominent hexagonal cake shrinkage on the sides and bottom (Supplementary Figure S1A), fast reconstitution time (≤30 s), minor change in pH from the pre-lyophilization value of 7.6, low residual moisture (1.1% w/w), and a glass transition temperature of 114°C. Thus, the shelf temperature study results directed the use of lower shelf temperatures (<−25°C) in subsequent studies for maintenance of product temperature within the recommended range.
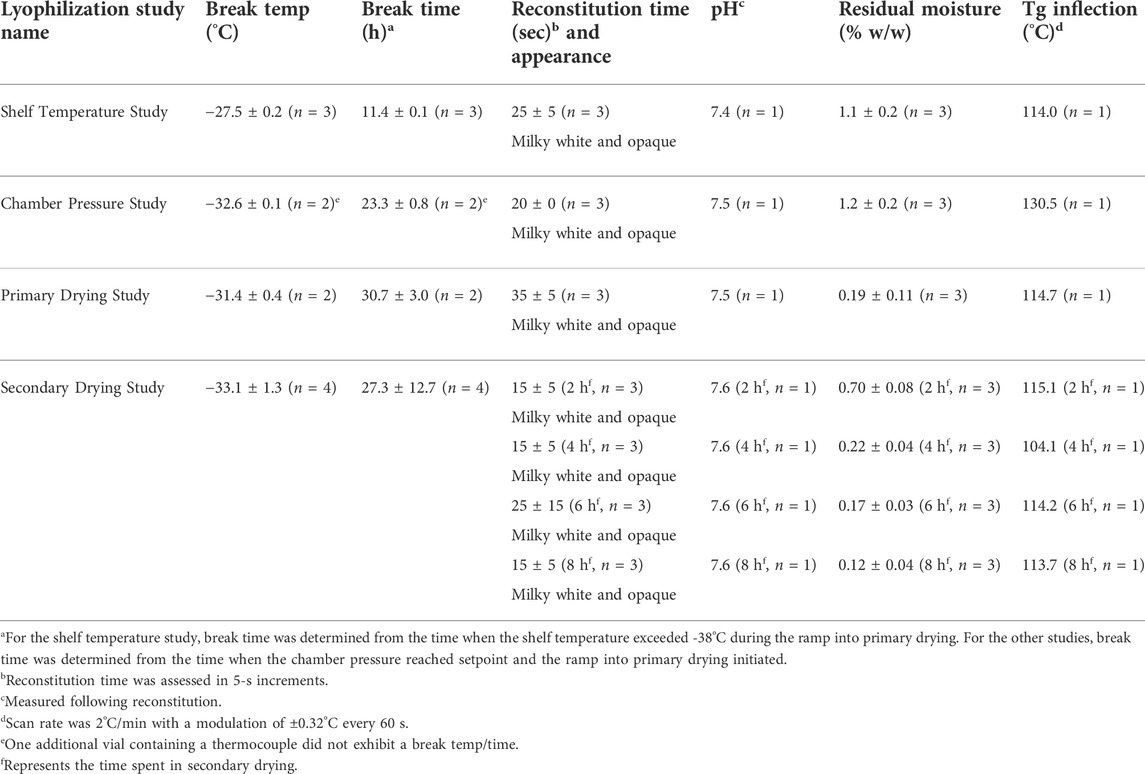
TABLE 2. Lyophilization process development product characterization.
For the chamber pressure study, shelf temperature was increased at a rate of 0.5°C/min from −40°C to a target setpoint of −24°C, where it was held for a total of 11.4 h and then decreased to −27°C for an additional 14.6 h while the chamber pressure was adjusted from 40 to 50 and then 60 µmHg (Supplementary Table S2). The effect of chamber pressure on product temperature was a ∼0.6°C increase for each 10-µmHg increase in chamber pressure (Supplementary Table S2). The average product break temperature for the chamber pressure study was −32.6°C; however, one of the three monitored product vials did not exhibit a temperature break and some vials exhibited extensive cake collapse, indicating the sublimation of ice had not been completed for all vials prior to beginning the ramp into secondary drying. While the measured product temperatures during processing were equal to or below the maximum recommended product temperature range (−32°C to −30°C), the primary drying step was not long enough to complete drying of the product, leading to notable cake shrinkage on the sides and bottom of all vials (Supplementary Figure S1B) and potential meltback of ice in some vials. Other finished product characterization indicated fast reconstitution time (≤20 s), a pH value of 7.5, low residual moisture (1.2% w/w), and a glass transition temperature of 131°C (Table 2). The chamber pressure study directed potential critical process parameters for subsequent studies regarding the required chamber pressure (≤60 µmHg) to maintain product temperature below the recommended range.
The primary drying time required at the selected shelf temperature and chamber pressure was evaluated in the subsequent study. The bulk liquid formulation was prepared as before (pH 7.5) and filled to a target of 1.04 g into 25 glass 3-ml vials, with three vials containing thermocouples. Freezing was performed at −40°C similar to the batches described above (Supplementary Table S3). Primary drying was performed by increasing the shelf temperature initially to −27°C while decreasing the chamber pressure to 50 µmHg; however, the temperature was subsequently decreased to -30°C since product temperatures were warming above the desired safe range at that point in primary drying (Supplementary Table S3). The average product break occurred at 30.7 h at a temperature of −31.4°C (Table 2), which was within the recommended product temperature range (−32°C to −30°C). Visual inspection revealed slight and uniform cake shrinkage of ∼1–2 mm around the sides and from the top (Supplementary Figure S1C). Reconstitution times were ≤40 s (Table 2). The pH remained at 7.5, the residual moisture was extremely low (0.19% w/w), and the glass transition temperature was 115°C (Table 2). The primary drying time study indicated that a primary drying time of ≥48 h was sufficient when the chamber pressure was set to 50 µmHg. However, since chamber pressure values of ≤50 µmHg may begin to significantly inhibit heat transfer, a conservative chamber pressure target of 60 µmHg was set for subsequent batches.
Finally, the effect of secondary drying parameters on product characteristics was assessed. The bulk liquid formulation was prepared as before (pH 7.5) and filled at a target of 1.03 g into 100 glass 3-ml vials, which were then separated into groups of 25 vials on four trays. Primary drying and secondary drying occurred at shelf temperatures of −30°C and 25°C, respectively (Supplementary Table S4). The primary drying temperature was held for 124.5 h to allow for scheduling of sequential stoppering of each tray associated with one of four different secondary drying times, with sequential stoppering of product vials at 2, 4, 6, and 8 h. The chamber was controlled at a target pressure of 60 µmHg throughout primary and secondary drying. Average product break temperature and time were −33.1°C and 27.3 h, respectively (Table 2). Visual appearance was similar to previous observations and did not change with different secondary drying times (Supplementary Figure S1D,E). Reconstitution times remained ≤40 s and pH was 7.6, with neither value showing any impact from different secondary drying times (Table 2). In contrast, residual moisture levels decreased with increasing secondary drying time, particularly between 2 and 4 h (Table 2). Nevertheless, average residual moisture values were all ≤0.7% w/w, indicating that a brief time in secondary drying is sufficient to achieve low residual moisture. Moreover, glass transition temperatures did not seem to correlate with time in secondary drying, suggesting thermal stability was not increased with increasing secondary drying time due to the very low residual moisture levels. Based on these results, a conservative secondary drying time of 6 h was selected for future studies to ensure a robust lyophilization process.
Using the combined results from the pre-lyophilization thermal analysis and lyophilization process engineering studies described above, a safe, effective, and sufficiently robust lyophilization process was designed to reproducibly yield dried product with the consistent desired critical quality attributes (CQA) (Table 3). In the above lyophilization process engineering studies, a pre-lyophilization fill weight of 1.03 g (corresponding to a 1-ml vaccine formulation) and a reconstitution volume of 1 ml were employed. Nevertheless, this approach did not take into account the volume occupied by the dried solids, resulting in some dilution of vaccine formulation components following reconstitution. The dried solids occupied a volume of ∼8%, meaning a pre-lyophilization fill volume of 1.09 ml would be required to enable a post-lyophilization reconstitution volume of 1 ml without dilution of the vaccine. However, a higher pre-lyophilization fill volume could require extended lyophilization processing time compared to the conditions engineered above using a 1-ml pre-lyophilization fill volume. Moreover, U.S. Food and Drug Administration (FDA) and USP guidance recommends filling single-dose drug products with only enough excess volume or “overfill” sufficient to permit withdrawal of the intended administration volume, and the remaining volume should not be enough to enable withdrawal of an additional dose (FDA, 2015; United States Pharmacopeia, 2021). The intended administration volume of the reconstituted ID93 + GLA-SE vaccine candidate was 0.5 ml. Based on these practical considerations, it was determined that a reasonable hold-back volume that may not be withdrawn warrants a desirable pre-lyophilization theoretical fill volume target of 0.87 ml (corresponding to an in-process weight target of 0.90 g, with an allowable range of 0.87–0.93 g) with a corresponding post-lyophilization reconstitution volume of 0.80 ml.
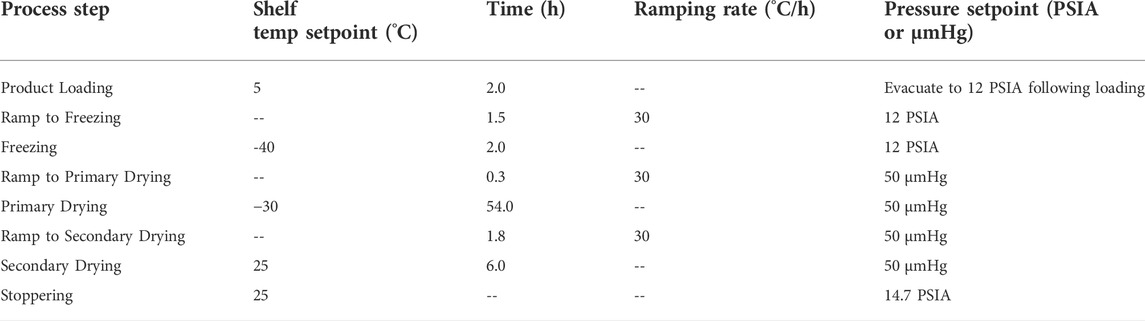
TABLE 3. Final lyophilization process.
3.2 Lyophilization at target and boundary process parameters
To assess the suitability of the designed lyophilization process (Table 3) for a 0.90-g (0.87-ml) pre-lyophilization vial content, an expanded batch size of 200 vials was lyophilized and the finished product was characterized. Thermocouples were placed in vials located near the center as well as vials located at the edge of the tray to account for any edge effect along the perimeter of the shelf within the lyophilizer. Product temperatures remained within or slightly below the values recommended by the low-temperature thermal analysis described above. Product break temperatures ranged from -34.9°C to −32.1°C and break times ranged from 27.8 to 37.3 h (Table 4, Supplementary Figure S2A). Edge vials exhibited slightly warmer temperatures and faster break times compared to the center vials. The product temperatures showed a smooth curve during the entire ramp from primary to secondary drying, indicating no collapse or other anomalies (Supplementary Figure S2B); likewise, residual gas analysis using a quadrupole mass spectrophotometer confirmed the level of water vapor in the lyophilization chamber began to decrease shortly after reaching the primary drying target shelf temperature and reached minimum levels for the presence of water vapor and maximum levels for nitrogen after approximately 35 h in primary drying (Supplementary Figure S2C). Visual inspection of vials revealed a uniform white cake with nominal shrinkage (Supplementary Figure S1F). Reconstitution time with 0.8 ml water was ≤30 s, residual moisture was 0.4% w/w, visual appearance of the reconstituted emulsion was acceptable, and pH was close to the target value of 7.5 (Table 4). Measured values for emulsion droplet diameter and GLA content following reconstitution were also close to the target values of 120 nm and 10 μg/ml, respectively. Although a fully quantitative ID93 assay had not been developed at this stage in development, the expected silver-stained SDS-PAGE profile of the antigen was evident (Table 4). Overall, the results suggested the designed lyophilization process was suitable for lyophilizing ID93 + GLA-SE vaccine at the 0.87-ml pre-lyophilization fill volume at the 200-vial scale.
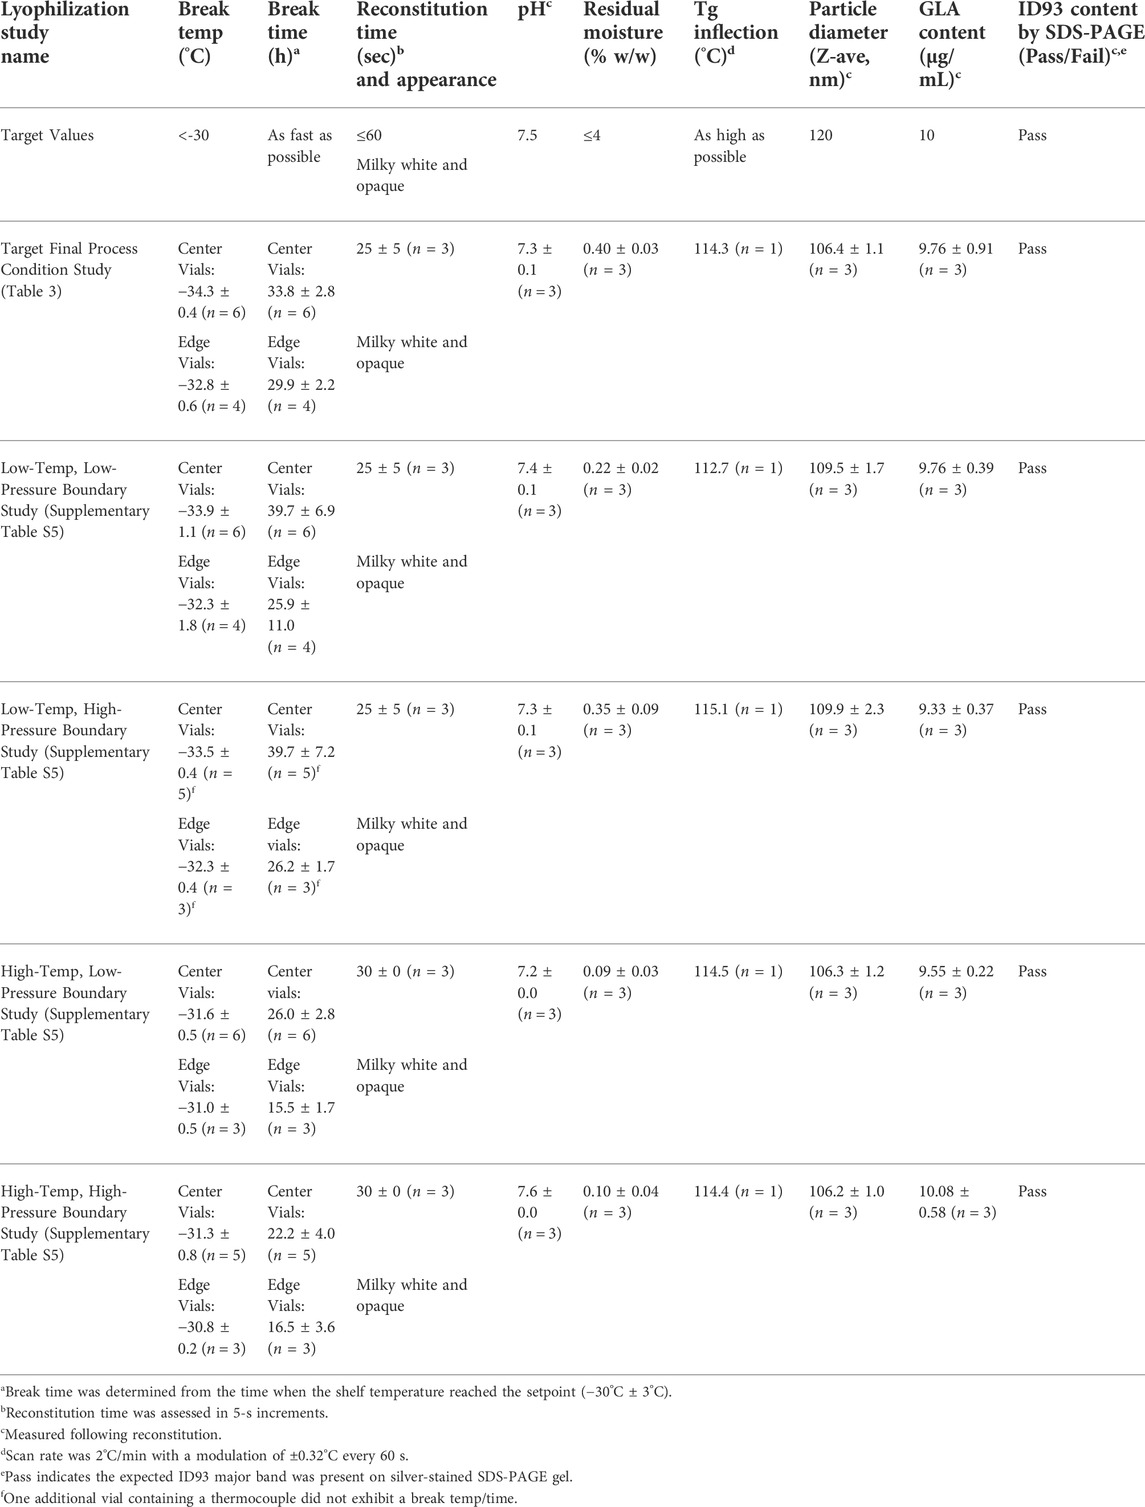
TABLE 4. Target and boundary condition lyophilization product characterization.
To establish a proven acceptable range around the critical process parameters, indicate process robustness, and inform subsequent process scale-up efforts, further process studies at four “boundary” conditions were conducted according to the intended target critical process parameters in Table 3 but with systematic alterations to the parameters. The alterations selected were 3°C above and below the target shelf temperature and 10 µmHg above and below the target chamber pressure as outlined in Supplementary Table S5, reflecting a statistically based two-factorial design. Note that alterations in time or ramp rates were not included as time was well controlled and unlikely to introduce significant variation. The boundary studies were produced at the 200-vial scale using a pre-lyophilization fill weight of 0.90 g (corresponding to a volume of 0.87 ml) with a post-lyophilization reconstitution volume of 0.80 ml. In all four boundary studies, product temperature remained below or within the recommended temperature range, the visual appearance of the lyophilized vials was pharmaceutically elegant, reconstitution times were ≤30 s, pH values were close to the target of 7.5, and residual moisture was ≤0.45% w/w for all tested vials (Table 4, Supplementary Figure S1G–J, Supplementary Figure S3A–D). Moreover, emulsion droplet diameter, GLA content, and ID93 SDS-PAGE profile were close to targets and consistent between the four boundary batches and the batch processed at the intended target critical process parameters (Table 4 and Supplementary Figure S4).
Despite the acceptable product characterization results in the boundary condition batches, two thermocouple-containing vials in the low-temperature, high-pressure boundary batch did not exhibit a product break, and discontinuities in the temperature profiles of these vials during the ramp to secondary drying indicated sublimation was not complete for some vials in this boundary condition study. Other findings were as expected including that edge vials exhibited warmer break temperatures and faster break times than center vials for all four boundary condition studies and that the high-temperature boundary conditions also exhibited warmer break temperatures and faster break times compared to the low-temperature boundary conditions (Table 4). However, they all still remained below the critical threshold temperature indicated during the low-temperature thermal analysis described above. Thus, the four boundary batches confirmed the intended lyophilization critical process parameters yielded a robust process while also identifying a limitation of incomplete sublimation when employing low-temperature combined with high-pressure boundary conditions.
3.3 Full-scale engineering and cGMP batches
In preparation for subsequent manufacturing of the final drug product under cGMP conditions, three full-scale (approximately 2,800 vials with 0.90-g target fill weight, with an allowable range of 0.87–0.93 g) engineering batches were processed at the target critical process parameters. Acceptable product break temperatures (−32.6°C, −32.8°C, and −32.7°C) and break times (25.1 h, 27.8 h, and 25.4 h) were achieved for all three engineering batches (Table 5 and Figure 4). Visual inspection of all vials from the three engineering batches found that the resulting product cake appearance was pharmaceutically elegant (Supplementary Figure S1K–M). The engineering batches had reconstitution times of ≤35 s, pH values close to the target of 8.0, and residual moisture of ≤0.39% w/w (Table 5). Emulsion droplet diameter and ID93 content were within 10% of the target values of 120 nm and 4 μg/ml, respectively. However, GLA content was lower than the target value of 10 μg/ml. Upon further investigation, the low GLA content was attributed to potential limitations of the HPLC method employed in the research lab since the qualified HPLC method employed in the cGMP lab produced approximately 27% higher values (Supplementary Table S6). Thus, the engineering batches indicated the compounding and lyophilization process for ID93 + GLA-SE could be successfully executed at larger scale.
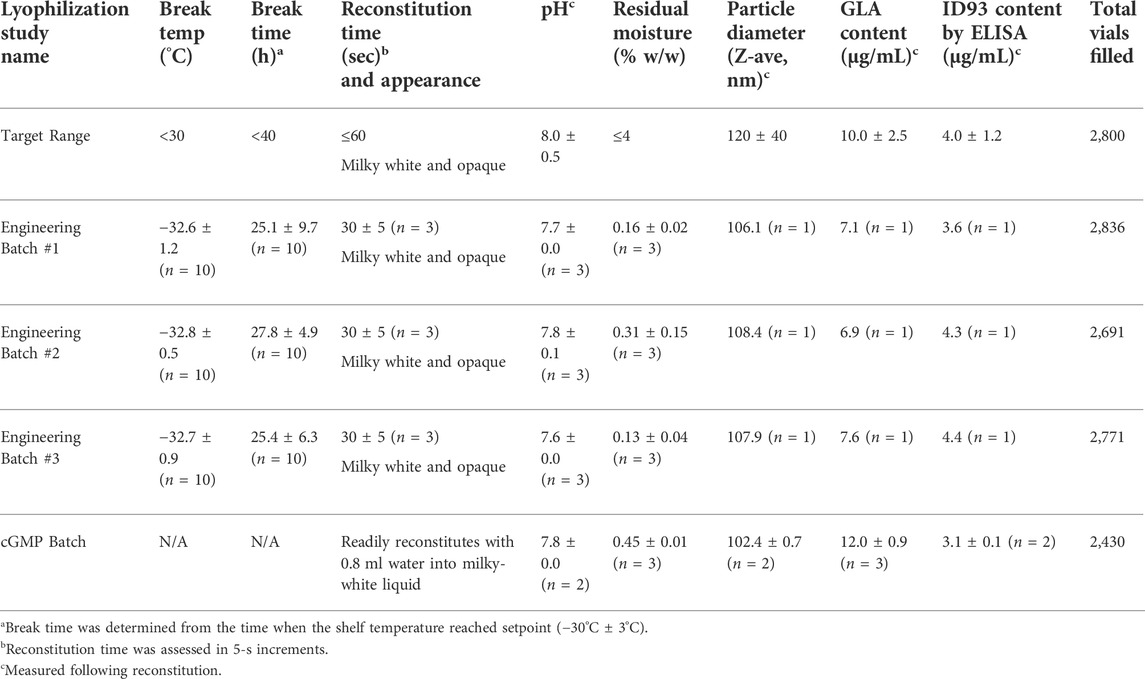
TABLE 5. Full-scale engineering and cGMP batch characterization.
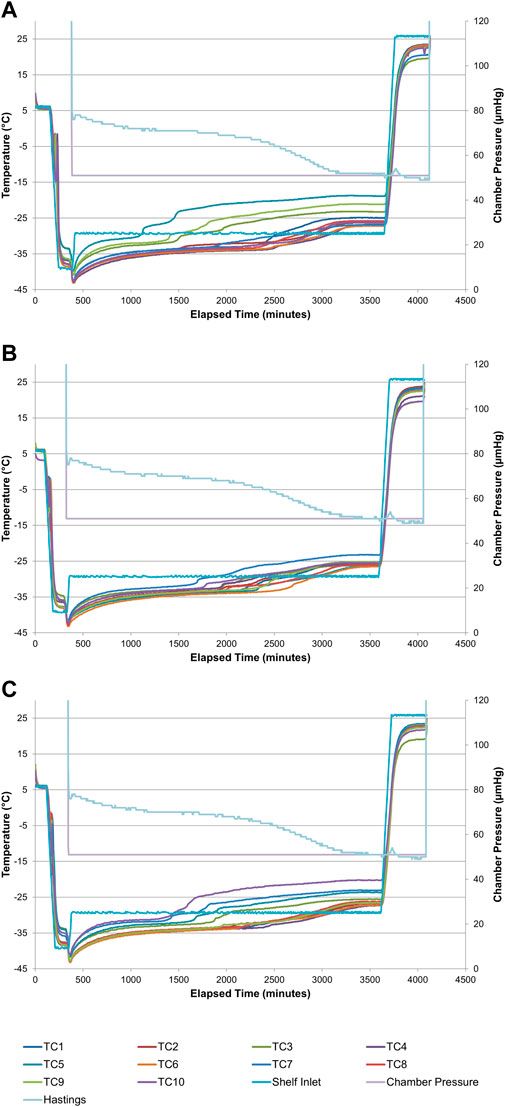
FIGURE 4. Lyophilization process diagrams for full-scale engineering batches of ID93 + GLA-SE vaccine. (A) Engineering batch #1, (B) engineering batch #2, (C) engineering batch #3. Thermocouples (TCs) placed in ten separate vials for each batch are indicated by different lines. The Hastings line represents the thermocouple vacuum gauge. Refer to Table 5.
Following completion of the engineering batches, the cGMP batch was manufactured to prepare ID93 + GLA-SE for clinical use. The final process flow diagram is shown in Supplementary Figure S5. In preparation for manufacture of the cGMP batch, multiple QC assays were developed, adapted, and/or qualified to enable full characterization of the product including quantitation of active ingredients and excipients, potency, sterility, pyrogenicity, particulate matter, and visual appearance of dried and reconstituted vials. Bulk drug substance antigen (ID93) and bulk drug substance adjuvant (GLA-SE) were prepared separately under cGMP conditions prior to compounding and lyophilization of the final drug product (ID93 + GLA-SE). A total of 2,430 vials were filled at a target weight of 0.90 g prior to lyophilization. To maintain aseptic processing of the cGMP batch, thermocouple data were less informative due to the focus on aseptic technique and the resulting limitations on the placement of the thermocouples (Supplementary Figure S6). Therefore, specific break time and break temperature values were not reported for the cGMP batch but were expected to mimic the values obtained in the engineering batches. Visual appearance of dried and reconstituted vials, reconstitution time, pH, residual moisture, emulsion droplet diameter, and ID93 content of the cGMP batch were generally consistent with the engineering batches although some of the language describing visual appearance differed based on the annotations of the lab performing the release characterization (Table 5). GLA content was higher in the cGMP batch than in the engineering batches, but as discussed above, this disparity was attributed to the different HPLC methods employed. The complete analysis of the final drug product including all tests and their specifications is shown in Supplementary Table S7. All release test results were within established specifications.
3.4 Stability monitoring of engineering and cGMP batches
The engineering batches and the cGMP batch were placed on long-term stability monitoring programs. The engineering batches were monitored in the research lab for 4 years, with vials stored at −20°C, 5°C, 25°C, 40°C, or 50°C. The cGMP batch was monitored in the cGMP QC lab for 30 months using qualified assays, with vials stored initially at 5°C only. Six months following manufacture of the cGMP batch, some vials were removed from storage at 5°C and placed in storage at 37°C as an elevated temperature stress condition consistent with the World Health Organization’s vaccine vial monitor system (World Health Organization, 2020). To conserve vials for clinical use, additional storage temperature conditions were not evaluated for the cGMP batch. Statistical comparison between the cGMP batch and the engineering batch at each time point when stored at the same temperature (5°C) was conducted by t tests corrected for multiple comparisons.
The physical stability of the engineering and cGMP batches, represented by reconstituted particle size, was remarkably stable at all temperatures for the duration of the stability monitoring period of up to 48 months (Figure 5A). Although the cGMP batch particle diameter was statistically smaller than the particle diameter of the engineering batches, it is unlikely that this is a meaningful difference since it is probably attributable to the different dynamic light scattering instruments used to characterize the batches. Likewise, although only measured at selected temperatures and time points up to 30 months, little or no change in residual moisture was evident in the engineering or cGMP batches (Figure 5B). The pH values for all batches also remained within specification for up to 48 months, although pH values trended lower in the engineering batches after storage at higher temperatures and for the cGMP batch after 30 months at 5°C (Figure 5C). GLA content remained stable for 48 months in the engineering batches when stored at 25°C or below, whereas higher temperatures elicited a notable drop in GLA content at the 6-month time point, followed by gradual decline at later time points (Figure 5D). In the cGMP batch, GLA content fell below the specification range at the 6-month time point for the 37°C storage condition and at the 30-month time point for the 5°C storage condition and was statistically lower than the GLA content in the engineering batches stored at 5°C at the 24-month time point. The engineering batches did not indicate susceptibility to ID93 degradation at the temperatures tested during the 4.5 years of stability monitoring, but it was noted that the research lab ELISA exhibited substantial variation across time points, potentially due to interference from the formulation matrix. However, using the qualified ELISA in the QC lab, ID93 content in the cGMP batch gradually declined over time and fell below the specification range at the 6-month time point for the 37°C storage condition and at the 24-month time point for the 5°C storage condition, and was statistically lower than the ID93 content in the engineering batches stored at 5°C as early as the 12-month time point (Figure 5E). An alternative ID93 content assay based on fluorescent-stain SDS-PAGE indicated ID93 content was still within the specification range at 24 months with a value of 3.2 μg/ml; however, both methods confirmed ID93 content was below the specification range by the 30-month time point (Supplementary Table S8). Interestingly, despite the decreased ID93 content, no decrease in vaccine potency was apparent, even at the 36-month time point (Figure 5F). Additional stability readouts—including squalene content, DMPC content, osmolality, visual appearance, particulate matter, purity, identity, and sterility—in engineering and/or cGMP batches indicated little or no change over time (data not shown). In summary, the cGMP lyophilized ID93 + GLA-SE vaccine candidate remained stable for use after storage for 3 months at 37°C or up to 24 months at 5°C.
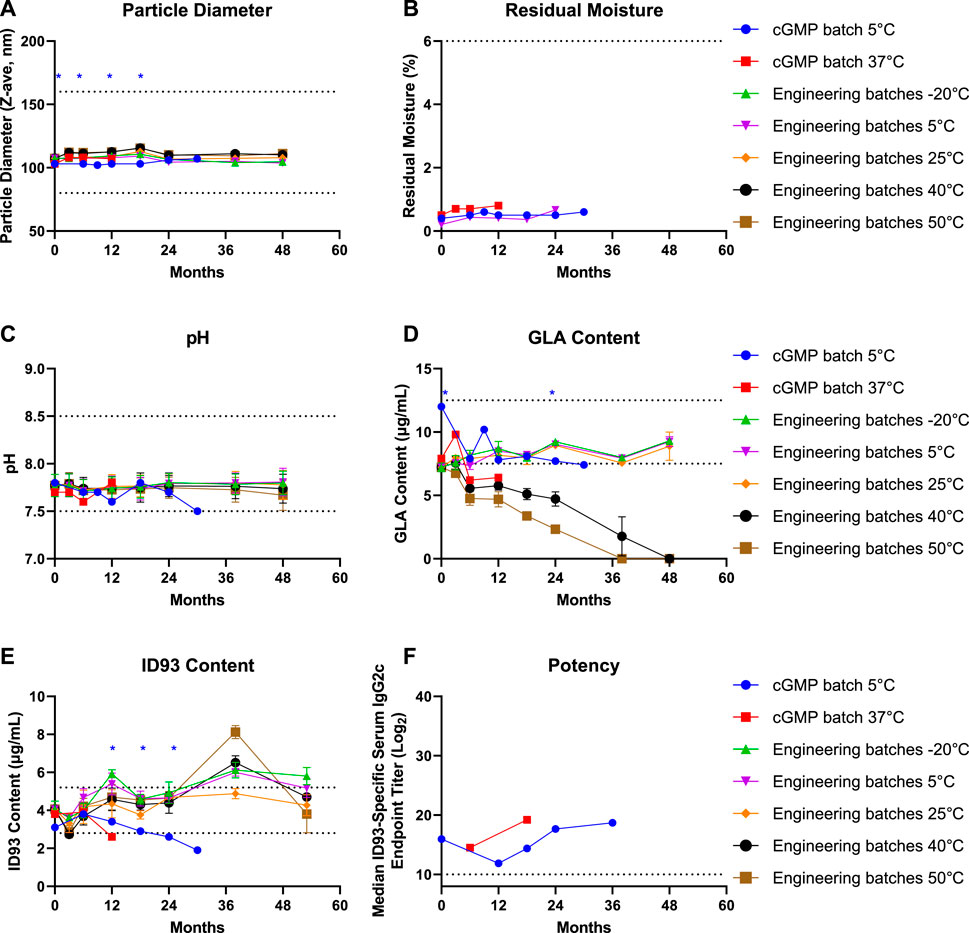
FIGURE 5. Stability of engineering and cGMP batches of lyophilized ID93 + GLA-SE vaccine. Key stability measures of batches stored at different temperatures and sampled at indicated time points included (A) reconstituted emulsion particle diameter by dynamic light scattering, (B) residual moisture by Karl Fischer, (C) pH, (D) GLA content by HPLC, (E) ID93 content by ELISA, and (F) potency by serum IgG2c titer in immunized mice. Dotted lines show acceptable specification range for each attribute. Unpaired parametric t tests corrected for multiple comparisons were employed to compare stability results between the cGMP and engineering batches stored at the same temperature (5°C). Blue asterisks indicate that the cGMP batch value at the indicated time point is significantly different from the engineering batch value.
4 Discussion
Translation of a promising preclinical thermostable vaccine formulation into a cGMP product suitable for Phase 1 clinical testing was achieved through systematic lyophilization process engineering and scale-up activities. The thermostability of the cGMP batch was demonstrated by maintaining all of the critical quality attributes after 3 months storage at 37°C. Prior to storage at 37°C, the product vials had been stored for 6 months at 5°C. Although this delay in initiating the high-temperature storage condition was unplanned due to an incubator issue, it may approximate a relevant field use scenario where cold-chain capabilities are initially available at central and regional storage facilities but not at local health posts (Karp et al., 2015). Notably, the lyophilized vaccine was also stable when stored frozen (−20°C), a major advantage considering the substantial wastage of vaccines that are not stable to freezing occurring in the field (Hanson et al., 2017; Das et al., 2020).
To our knowledge, this study represents the first report of the successful lyophilization of a thermostable subunit vaccine candidate containing an emulsion-based adjuvant under cGMP conditions. Other adjuvant-containing vaccine candidates demonstrating thermostable properties that have reached clinical trials or licensure stage include aluminum-containing liquid formulations, aluminum-containing lyophilized formulations, and an emulsion-containing liquid formulation (Qi and Fox, 2021). However, in many cases, complete physicochemical stability was either not reported or not measured, and only a few adjuvant-containing vaccine candidates are qualified for cold-chain temperature excursions of relatively short duration of a few days or weeks. Moreover, while a few other squalene-based emulsions have been lyophilized in preclinical settings, their thermostability profiles were not evaluated (Ivins et al., 1995; Iyer et al., 2017).
Despite demonstrating an impressive thermostability profile at 37°C, an unexpected finding was the stability failure of the cGMP batch at the 5°C storage condition at the 24-month time point according to ID93 content measured by ELISA and at the 30-month time point according to GLA content measured by HPLC. In contrast, potency testing demonstrated that vaccine immunogenicity was maintained for at least 36 months, indicating that the changes in ID93 and GLA content were not biologically meaningful in terms of impacting antigen-specific serum antibody response in the mouse model. Nevertheless, several potential factors should be explored in understanding the reduced stability in the cGMP batch as compared to the engineering batches. As the product is in the early clinical development phase, the CQAs and specification ranges cannot be refined in the absence of assessing the longer-term biochemical and clinical significance. For instance, the specification range for active ingredients such as ID93 was established around the theoretical target value (4 μg/ml) rather than around actual values achieved in research and engineering batches which were generally somewhat lower than the target values. Alternatively, specification ranges could be refined based on correlations with impacts on biological activity. However, this is a non-trivial endeavor since no consensus correlate of immunity has been established for protection against TB. Moreover, though scientifically sound and qualified, analytical methods need additional refinement to improve level of detection, sensitivity, and robustness. In particular, such refinement needs to address the challenge of quantitating very low amounts of active ingredients in a complex background matrix. For example, quantitating ID93 and GLA components was extremely challenging since they were present in very low concentrations (4 μg/ml and 10 μg/ml, respectively) in the presence of a complex matrix (oil, emulsifiers, and multiple other excipients) that could potentially interfere with assay sensitivity and variability since each of the background components also undergoes stresses associated with lyophilization and storage at the various temperatures. Indeed, employing appropriate background matrix controls that have experienced the same lyophilization and storage conditions as the final drug product should help reduce potential analytical variability. Finally, it is possible that differences between the research lab and the QC lab generated some inconsistencies in results in some cases between the engineering batches (monitored by the research lab) compared to the cGMP batch (monitored by the QC lab). Ideally, a single lab should monitor all batches using a single set of assays to reduce risk.
Notwithstanding these limitations, the strengths of these studies include rational process design based on characterization of pre-lyophilization thermal properties, thorough process engineering and scale-up studies to ensure a robust process for manufacturing, and a comprehensive suite of physicochemical characteristics monitored to present a complete assessment of stability performance. As further processing experience is gained, additional enhancements in processing procedures, such as handling the bulk, compounding, and fill/finish activities, also need to be considered. Besides extending stability performance at the 5°C storage condition, characterization at 25°C for cGMP vaccine vials would be a desirable stability condition to monitor in the future.
The successful cGMP manufacture of a lyophilized subunit tuberculosis vaccine containing adjuvant that is stable for 3 months at 37°C represents a significant advance in the field. Alternative thermostable presentations under development include spray-dried formulations of ID93 + GLA-SE for injectable or inhalable delivery, although vaccine thermostability performance was not improved compared to the lyophilized presentation described here (Gomez et al., 2021a; Gomez et al., 2021b; Gomez et al., 2021c; Gomez et al., 2022). Other recombinant tuberculosis vaccine candidates containing adjuvants have been spray-dried, although thermostability was not assessed (Ingvarsson et al., 2013; Tyne et al., 2013; Thakur et al., 2018). An alternative stabilization approach, ensilication, has been reported with a tuberculosis vaccine candidate conjugated to a protein-based adjuvant (Wahid et al., 2019). Nevertheless, no thermostable subunit tuberculosis vaccine has reached clinical evaluation stage to date. The lyophilized thermostable ID93 + GLA-SE vaccine has now completed evaluation for safety and immunogenicity in a Phase 1 clinical trial (Clinicaltrials, 2020), and a manuscript reporting the results is under preparation.
Potential limitations associated with thermostable vaccine approaches have been mentioned previously (Kumar et al., 2022). For instance, lyophilized vaccine candidates such as the one developed here require reconstitution with sterile water prior to administration. Furthermore, there may be increased manufacturing costs associated with additional excipients and lyophilization processing time. Nevertheless, an effective thermostable tuberculosis vaccine would be a major contribution to prophylactic therapy with global health impact.
5 Conclusion
Practical challenges in the development of a thermostable vaccine candidate including process engineering, scale-up, and comprehensive stability monitoring are rarely discussed in detail in the literature. Here, we described the systematic lyophilization process development of the lyophilized ID93 + GLA-SE vaccine candidate that led to the manufacture of three full-scale engineering batches and one cGMP batch, followed by up to 4.5 years of stability monitoring. Although some differences in stability performance were noted between the engineering and cGMP batches, the cGMP vaccine candidate successfully completed release testing and maintained stability for at least 3 months at 37°C. Safety and immunogenicity performance of thermostable ID93 + GLA-SE in a Phase 1 clinical study will be reported in a subsequent manuscript. Anticipated future development aspects include advanced clinical testing and further scale-up in preparation for commercial manufacturing.
Data availability statement
The raw data supporting the conclusions of this article will be made available by the authors, without undue reservation.
Ethics statement
The animal study was reviewed and approved by Institutional Animal Care and Use Committee (IACUC) at Pacific BioLabs.
Author contributions
CF, ET, MA, RK, and TD conceived the study. AB, CF, EL, ET, LB, LH, LM, MA, RK, and TD supervised the research. AB, CF, LH, RK, and TD administered the project. EL and RC provided resources. CF, ET, RK, and TD acquired funding. BA, CB, JG, JR, ML, RJC, RC, and TP contributed to the investigation. BA, CB, CF, CP, ET, JG, JM, LM, MA, RC, RK, and TD contributed to methodology. AG, CF, CP, EL, JM, LH, LB, LM, MA, RK, and TD curated the data. CF and LM analyzed the data. CF, ET, and TD visualized the data. CF and TD wrote the first draft of the manuscript. AG, ET, JM, LM, MA, RK, and TD reviewed and edited the manuscript.
Funding
This work was supported by federal funds from the National Institute of Allergy and Infectious Diseases, National Institutes of Health, Department of Health and Human Services, under Contract #HHSN272201400041C.
Acknowledgments
The authors thank Prerana Ranjitkar and Elyse Beebe for project management activities; Valerie Soza, Alison Mutchler, and Jason Angstadt for scientific editing and preparation of figures; and Daniel Stoughton, Steve Huang, and Larry Wolfraim for thorough proofreading and insightful comments.
Conflict of interest
CF and RK are co-inventors on patents claiming priority to WO/2015/103167, “Single Vial Vaccines,” and WO/2013/119856, “Improved Adjuvant Formulations Constituting TLR4 Agonists and Methods of Using Same.” TD and ET were employed by Lyophilization Technology, Inc., during this work.
The remaining authors declare that the research was conducted in the absence of any commercial or financial relationships that could be construed as a potential conflict of interest.
Publisher’s note
All claims expressed in this article are solely those of the authors and do not necessarily represent those of their affiliated organizations, or those of the publisher, the editors and the reviewers. Any product that may be evaluated in this article, or claim that may be made by its manufacturer, is not guaranteed or endorsed by the publisher.
Supplementary material
The Supplementary Material for this article can be found online at: https://www.frontiersin.org/articles/10.3389/fddev.2022.1043756/full#supplementary-material
References
Author Anonymous, (2021). The COVID pandemic must lead to tuberculosis vaccines. Nature 598 (7882), 540. doi:10.1038/d41586-021-02892-x
Barnes, V. L., Fedor, D. M., Williams, S., Dowling, Q. M., Archer, M. C., Cloutier, S., et al. (2017). Lyophilization of an adjuvanted Mycobacterium tuberculosis vaccine in a single-chamber pharmaceutical cartridge. AAPS PharmSciTech 18 (6), 2077–2084. doi:10.1208/s12249-016-0688-7
Bertholet, S., Ireton, G. C., Ordway, D. J., Windish, H. P., Pine, S. O., Kahn, M., et al. (2010). A defined tuberculosis vaccine candidate boosts BCG and protects against multidrug-resistant Mycobacterium tuberculosis. Sci. Transl. Med. 2, 53ra74. doi:10.1126/scitranslmed.3001094
Chan, M. Y., Dowling, Q. M., Sivananthan, S. J., and Kramer, R. M. (2017). Particle sizing of nanoparticle adjuvant formulations by dynamic light scattering (DLS) and nanoparticle tracking analysis (NTA). Methods Mol. Biol. 1494, 239–252. doi:10.1007/978-1-4939-6445-1_17
Clinicaltrials (2020). Phase 1 clinical trial of single-vial ID93 + GLA-SE in healthy adults. NCT03722472.
Das, M. K., Arora, N. K., Mathew, T., Vyas, B., Devi, S. K., and Yadav, A. (2020). Temperature integrity and exposure of vaccines to suboptimal temperatures in cold chain devices at different levels in three states of India. Trop. Dis. Travel Med. Vaccines 6, 8. doi:10.1186/s40794-020-00109-z
FDA (2015). Allowable excess volume and labeled vial fill size in injectable drug and biological products. Guidance for Industry Available at: https://www.fda.gov/regulatory-information/search-fda-guidance-documents/allowable-excess-volume-and-labeled-vial-fill-size-injectable-drug-and-biological-products
Gomez, M., Ahmed, M., Das, S., McCollum, J., Mellett, L., Swanson, R., et al. (2022). Development and testing of a spray-dried tuberculosis vaccine candidate in a mouse model. Front. Pharmacol. 12, 799034. doi:10.3389/fphar.2021.799034
Gomez, M., Archer, M., Barona, D., Wang, H., Ordoubadi, M., Karim, S. B., et al. (2021a). Microparticle encapsulation of a tuberculosis subunit vaccine candidate containing a nanoemulsion adjuvant via spray drying. Eur. J. Pharm. Biopharm. 163, 23–37. doi:10.1016/j.ejpb.2021.03.007
Gomez, M., McCollum, J., Wang, H., Bachchhav, S., Tetreau, I., Gerhardt, A., et al. (2021b). Evaluation of the stability of a spray-dried tuberculosis vaccine candidate designed for dry powder respiratory delivery. Vaccine 39 (35), 5025–5036. doi:10.1016/j.vaccine.2021.07.002
Gomez, M., McCollum, J., Wang, H., Ordoubadi, M., Jar, C., Carrigy, N. B., et al. (2021c). Development of a formulation platform for a spray-dried, inhalable tuberculosis vaccine candidate. Int. J. Pharm. 593, 120121. doi:10.1016/j.ijpharm.2020.120121
Hanson, C. M., George, A. M., Sawadogo, A., and Schreiber, B. (2017). Is freezing in the vaccine cold chain an ongoing issue? A literature review. Vaccine 35 (17), 2127–2133. doi:10.1016/j.vaccine.2016.09.070
Ingvarsson, P. T., Schmidt, S. T., Christensen, D., Larsen, N. B., Hinrichs, W. L. J., Andersen, P., et al. (2013). Designing CAF-adjuvanted dry powder vaccines: Spray drying preserves the adjuvant activity of CAF01. J. Control. Release 167 (3), 256–264. doi:10.1016/j.jconrel.2013.01.031
Ivins, B., Fellows, P., Pitt, L., Estep, J., Farchaus, J., Friedlander, A., et al. (1995). Experimental anthrax vaccines: efficacy of adjuvants combined with protective antigen against an aerosol Bacillus anthracis spore challenge in guinea pigs. Vaccine 13 (18), 1779–1784. doi:10.1016/0264-410x(95)00139-r
Iyer, V., Cayatte, C., Marshall, J. D., Sun, J., Schneider-Ohrum, K., Maynard, S. K., et al. (2017). Feasibility of freeze-drying oil-in-water emulsion adjuvants and subunit proteins to enable single-vial vaccine drug products. J. Pharm. Sci. 106 (6), 1490–1498. doi:10.1016/j.xphs.2017.02.024
Karp, C. L., Lans, D., Esparza, J., Edson, E. B., Owen, K. E., Wilson, C. B., et al. (2015). Evaluating the value proposition for improving vaccine thermostability to increase vaccine impact in low and middle-income countries. Vaccine 33 (30), 3471–3479. doi:10.1016/j.vaccine.2015.05.071
Kramer, R. M., Archer, M. C., Orr, M. T., Dubois Cauwelaert, N., Beebe, E. A., Huang, P. D., et al. (2018). Development of a thermostable nanoemulsion adjuvanted vaccine against tuberculosis using a design-of-experiments approach. Int. J. Nanomedicine 13, 3689–3711. doi:10.2147/IJN.S159839
Kumar, R., Srivastava, V., Baindara, P., and Ahmad, A. (2022). Thermostable vaccines: an innovative concept in vaccine development. Expert Rev. Vaccines 21, 811–824. doi:10.1080/14760584.2022.2053678
Lee, B. Y., Wedlock, P. T., Haidari, L. A., Elder, K., Potet, J., Manring, R., et al. (2017). Economic impact of thermostable vaccines. Vaccine 35 (23), 3135–3142. doi:10.1016/j.vaccine.2017.03.081
Misquith, A., Fung, M., Dowling, Q. M., Guderian, J. A., Vedvick, T. S., and Fox, C. B. (2014). In vitro evaluation of TLR4 agonist activity: formulation effects. Colloids Surf. B Biointerfaces 113, 312–319. doi:10.1016/j.colsurfb.2013.09.006
Orr, M. T., Kramer, R. M., Barnes, V. L., Dowling, Q. M., Desbien, A. L., Beebe, E. A., et al. (2014). Elimination of the cold-chain dependence of a nanoemulsion adjuvanted vaccine against tuberculosis by lyophilization. J. Control. Release 177 (0), 20–26. doi:10.1016/j.jconrel.2013.12.025
Preston, K. B., and Randolph, T. W. (2021). Stability of lyophilized and spray dried vaccine formulations. Adv. Drug Deliv. Rev. 171, 50–61. doi:10.1016/j.addr.2021.01.016
Qi, Y., and Fox, C. B. (2021). Development of thermostable vaccine adjuvants. Expert Rev. Vaccines 20 (5), 497–517. doi:10.1080/14760584.2021.1902314
Schwartz, A. M., Chan, M. Y., Fedor, D. M., Sivananthan, S. J., and Kramer, R. M. (2017). “Staining and transfer techniques for SDS-PAGE gels to minimize oil-in-water emulsion adjuvant interference,” in Vaccine adjuvants: Methods and protocols. Editor C. B. Fox (New York, NY: Springer New York), 273–283.
Tait, D. R., Hatherill, M., Van Der Meeren, O., Ginsberg, A. M., Van Brakel, E., Salaun, B., et al. (2019). Final analysis of a trial of M72/AS01(E) vaccine to prevent tuberculosis. N. Engl. J. Med. 381 (25), 2429–2439. doi:10.1056/NEJMoa1909953
Thakur, A., Ingvarsson, P. T., Schmidt, S. T., Rose, F., Andersen, P., Christensen, D., et al. (2018). Immunological and physical evaluation of the multistage tuberculosis subunit vaccine candidate H56/CAF01 formulated as a spray-dried powder. Vaccine 36 (23), 3331–3339. doi:10.1016/j.vaccine.2018.04.055
Tyne, A. S., Chan, J. G., Shanahan, E. R., Atmosukarto, I., Chan, H. K., Britton, W. J., et al. (2013). TLR2-targeted secreted proteins from Mycobacterium tuberculosis are protective as powdered pulmonary vaccines. Vaccine 31 (40), 4322–4329. doi:10.1016/j.vaccine.2013.07.022
Wahid, A. A., Doekhie, A., Sartbaeva, A., and van den Elsen, J. M. H. (2019). Ensilication improves the thermal stability of the tuberculosis antigen Ag85b and an sbi-Ag85b vaccine conjugate. Sci. Rep. 9 (1), 11409. doi:10.1038/s41598-019-47657-9
Keywords: tuberculosis vaccine, recombinant subunit antigen, adjuvant-containing vaccine, thermostable, ID93, GLA-SE, lyophilization, cGMP
Citation: Dutill TS, Archer MC, McCollum J, Press C, McNeill L, Hawkins L, Phan T, Laursen ED, Cabullos R, Bouchard L, Castro RJ, Lin M-W, Roco J, Blois C, Adeagbo BA, Guderian JA, Gerhardt A, Beckmann AM, Trappler EH, Kramer RM and Fox CB (2022) Lyophilization process engineering and thermostability of ID93 + GLA-SE, a single-vial adjuvanted subunit tuberculosis vaccine candidate for use in clinical studies. Front. Drug. Deliv. 2:1043756. doi: 10.3389/fddev.2022.1043756
Received: 14 September 2022; Accepted: 17 October 2022;
Published: 08 November 2022.
Edited by:
Nghia Truong Phuoc, Monash University, AustraliaReviewed by:
Piyush Baindara, University of Missouri, United StatesBasanth Babu Eedara, Florida International University, United States
Rachel Yoon Chang, AcuraBio, Australia
Copyright © 2022 Dutill, Archer, McCollum, Press, McNeill, Hawkins, Phan, Laursen, Cabullos, Bouchard, Castro, Lin, Roco, Blois, Adeagbo, Guderian, Gerhardt, Beckmann, Trappler, Kramer and Fox. This is an open-access article distributed under the terms of the Creative Commons Attribution License (CC BY). The use, distribution or reproduction in other forums is permitted, provided the original author(s) and the copyright owner(s) are credited and that the original publication in this journal is cited, in accordance with accepted academic practice. No use, distribution or reproduction is permitted which does not comply with these terms.
*Correspondence: Christopher B. Fox, christopher.fox@aahi.org