Putting external validation performance of major bleeding risk models into context
 Clair Blacketer
 Jenna M. Reps
 Lu Wang1
 - 1Janssen Research and Development, Titusville, NJ, United States
- 2Department of Medical Informatics, Erasmus University Medical Center, Rotterdam, Netherlands
- 3Department of Biomedical Informatics, Columbia University, New York, NY, United States
When developing predictive models, model simplicity and performance often need to be balanced. We propose a novel methodology to put the performance of bleeding risk prediction models ORBIT, ATRIA, HAS-BLED, CHADS2, and CHA2DS2-VASc into perspective. Instead of comparing the existing models’ performance against the 0.5–1 AUROC scale, we suggest estimating a prediction task specific AUROC scale, lower bound AUROC (lbAUROC) and upper bound AUROC (ubAUROC), to help assess the balance between model simplicity and performance and determine whether more complex models could significantly improve the ability to predict the outcome. We validate the existing bleeding risk prediction models by applying them to a cohort of new users of warfarin and a cohort of new users of direct oral anticoagulants (DOACs) separately, across a set of four observational databases. Then, we develop the lbAUROC-ubAUROC scale by using the validation data to train regularized logistic regression models. The internal validation AUROC of the model that includes only age and gender variables was used to estimate the lbAUROC. The internal validation AUROC of the model that includes thousands of candidate variables was used to estimate the ubAUROC. The age and gender only models achieved AUROCs between 0.50 and 0.56 (lower bound) and the large-scale models achieved AUROCs between 0.67 and 0.72 and between 0.70 and 0.77 (upper bound) within the target cohorts of warfarin new users and DOACs new users, respectively. The AUROC of existing bleeding risk prediction models fall between the upper-bound and lower-bound of predictive models. Our study showed that this context of the predictability of the outcome is essential when evaluating risk prediction models to be administered in actual practice.
1 Introduction
Atrial fibrillation (AF) is the most common cardiac arrhythmia. Without proper anticoagulant management, patients with AF have an increased risk of stroke by 5-fold (Mant and Edwards, 2010). Vitamin K antagonists (e.g., warfarin) have been the mainstream of prophylactic therapy in reducing the risk of stroke among patients with AF for many decades. While warfarin is highly efficacious, achieving the desired therapeutic effect in routine clinical practice remains challenging because of its highly variable dose response among individuals, drug-drug interactions, and narrow therapeutic window which requires frequent monitoring of coagulation tests (INR) (Lee and Klein, 2013). These challenges in part led to the development of new antithrombotic therapies, also known as direct oral anticoagulants (DOACs).
Based on the pharmacologic mechanism of action, antithrombotic therapies are associated with increased risk of bleeding. In the contemporary clinical trials that investigated DOACs versus warfarin for stroke prevention in patients with AF, the rates of major bleeding (MB) for patients treated with warfarin ranged from 3.1 to 3.4 per 100 person years whereas the rates of MB for patients treated with DOACs therapies had a wider range from 1.6 to 3.6 per 100 person-years, which may be in part due to the difference in patient population and therapeutic dose level (Connolly et al., 2009; Granger et al., 2011; Patel et al., 2011; Giugliano et al., 2013). Several score systems have been developed to predict a patient’s risk of bleeding after anticoagulant use, including ORBIT, ATRIA, and HAS-BLED, with HAS-BLED widely recommended for use in clinical practice (Pisters et al., 2010; Fang et al., 2011; O’Brien et al., 2015). In addition, studies have shown that the CHADS2 and CHA2DS2-VASc score systems, originally used to predict risk of stroke, are also predictive of risk of MB (Gage et al., 2001; Lip et al., 2011). These existing bleeding risk score systems are simple algorithms containing 5–10 predictors, easily implemented in a clinical setting. Higher scores are associated with a higher risk of future bleeding.
A predictive score’s performance is typically assessed by its discriminative ability and calibration. Discrimination is commonly determined by measuring the area under the receiver operating characteristic (AUROC) curve, a value between 0.5 and 1, where 0.5 corresponds to no discrimination (i.e., a model that randomly predicts risk) and a value of 1 corresponds to perfect discrimination (i.e., a model that assigns a higher score to all patients who subsequently experience the outcome compared to those who do not). Calibration is a metric that determines how accurate the model’s predicted risks are. For example, if a correctly calibrated model predicts a risk of 10% for an outcome of interest, we would expect one out of 10 persons will experience the outcome.
When developing predictive models, simplicity and performance often need to be balanced. The existing bleeding risk scores are relatively simple models with limited numbers of predictors. These models have been evaluated across various patient populations and the AUROCs values were moderate, ranging from 0.60–0.69 (Lip et al., 2011; Goodman et al., 2014; O’Brien et al., 2015; Yao et al., 2017). It is unclear whether the models’ simplicity limited the discriminative ability of these scores and if more complex models, though harder to implement into clinical practice, would significantly improve discriminative ability.
In this study we applied a novel methodology to put the performance of the bleeding risk prediction models into perspective. Instead of comparing the existing models’ discriminations against the 0.5–1 AUROC scale, we estimated a prediction task specific AUROC scale, lower-bound AUROC (lbAUROC) and upper-bound AUROC (ubAUROC), to help assess the balance between model simplicity and discrimination and determine whether the development of more complex models could significantly improve the ability to predict the outcome. We examined whether this novel methodology can be used in validation of predictive models for stroke outcome among patients treated with warfarin and DOACS.
2 Materials and methods
We first validated the existing bleeding risk prediction models by applying them to a set of four databases as listed in Section 2.1. We then estimated the lbAUROC by using the validation data to train a regularized logistic regression that includes only age and gender variables, with the internal validation AUROC becoming the lbAUROC. Similarly, the ubAUROC is estimated by using the validation data to train a regularized logistic regression that includes thousands of candidate variables. If the models’ AUROCs are closer to the ubAUROC than the lbAUROC, it indicates a more performant model in terms of discrimination.
2.1 Datasets
The databases used in this study are described in Table 1. All four databases have been standardized into the Observational Medical Outcomes Partnership (OMOP) Common Data Model (CDM), which includes a standard representation of health care experiences (such as information related to drug utilization and condition occurrence), as well as common vocabularies for coding clinical concepts and enables consistent application of analyses across multiple disparate data source (Voss et al., 2015; OMOP, 2021). Complete specifications for the extract, transform, and load (ETL) process for each database is available at: https://ohdsi.github.io/ETL-LambdaBuilder/.
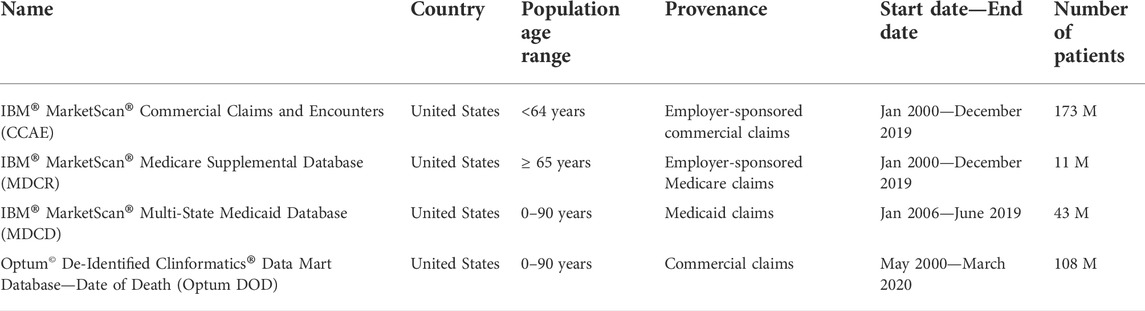
TABLE 1. Description of databases used in the study of AF patients.
The use of IBM MarketScan and Optum databases was reviewed by the New England Institutional Review Board (IRB) and were determined to be exempt from study-specific IRB approval.
2.2 Prediction task
The aim of all predictive models in this study is to identify, among new users of warfarin or new users of DOACs with prior history of AF, the patients who will develop a MB event within 1–365 days after the first recorded dispensing of the medication of interest (i.e., the index date) (see Figure 1).
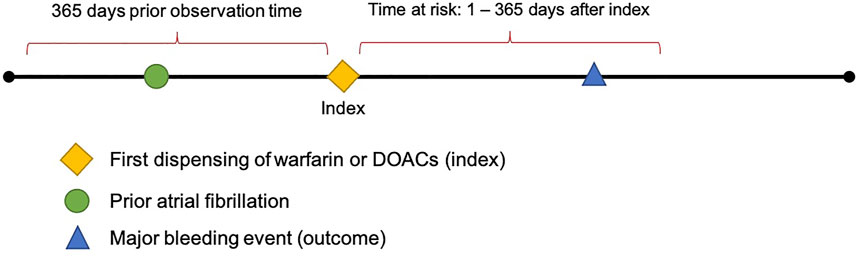
FIGURE 1. Diagram depicting the prediction of major bleeding events 1–365 days after index in patients with prior AF.
2.2.1 Target populations
The target populations used in this study consist of patients with a prior diagnosis of AF and no prior history of mitral valve stenosis.
Target population 1 is new users of warfarin, including patients aged 18 years and older with new exposure to warfarin (1st date of dispensing was considered the index date) and at least 365 days database observation time prior to the index date, at tion 2 are provided as supplementary material and thee index date. The codes used for defining target population 1 are provided as supplementary material and theattrition tables are shown attrition tables are shown in Table A1.
Target population 2 is new users of DOACs, including patients aged 18 years and older with new exposure to a DOAC (1st date of dispensing was considered index date) and at least 365 days database observation time prior to the index date, at least one prior diagnosis of AF, no prior mitral valve stenosis, and no exposure to warfarin all time prior to index date. The codes used for defining target population 2 are provided as supplementary material and the attrition tables are shown in Table A2.
2.2.2 Outcome definition
Major bleeding (MB) is the outcome of interest for this study; a clinical event of MB was mainly ascertained based on the Cunningham algorithm, which has been widely used in previous works (Cunningham et al., 2011; Graham et al., 2015). Briefly, occurrence of a MB event was defined as.
1) a primary condition occurrence of definite bleeding during an inpatient visit, OR.
2) a primary condition occurrence of excessive and frequent menstruation during an inpatient visit with a secondary condition occurrence of anemia or syncope during the same visit, OR.
3) a primary condition occurrence of possible bleeding during an inpatient visit
With a secondary condition occurrence of definite bleeding during the same visit.
Upon identifying potential qualifying events, they must also comply with the following criteria to be considered outcome events:
1) no trauma conditions, procedures, or observations during the same visit as the initial event. AND.
2) have one of the following:
a Death within 7 days following the index date,
b At least 1 condition occurrence of a bleeding at a critical site during the same visit as the initial event
c Any transfusion code during the same visit as the initial event
The time-at-risk for MB events was from 1 day until 365 days after the new exposure to either warfarin (in target population 1) or a DOAC (in target population 2).
2.3 Validation of existing major bleeding prediction models
In the current study, we first evaluated 5 existing MB prediction models: ORBIT, ATRIA, HAS-BLED, CHADS2, and CHA2DS2-VASc using the databases described in Section 2.1.
The existing models all include a limited number of covariates, summarized in Table 2. Although the internal validation AUROC for some of the models was as high as 0.8, previous external validation of these models tends to achieve an AUROC between 0.6 and 0.7.
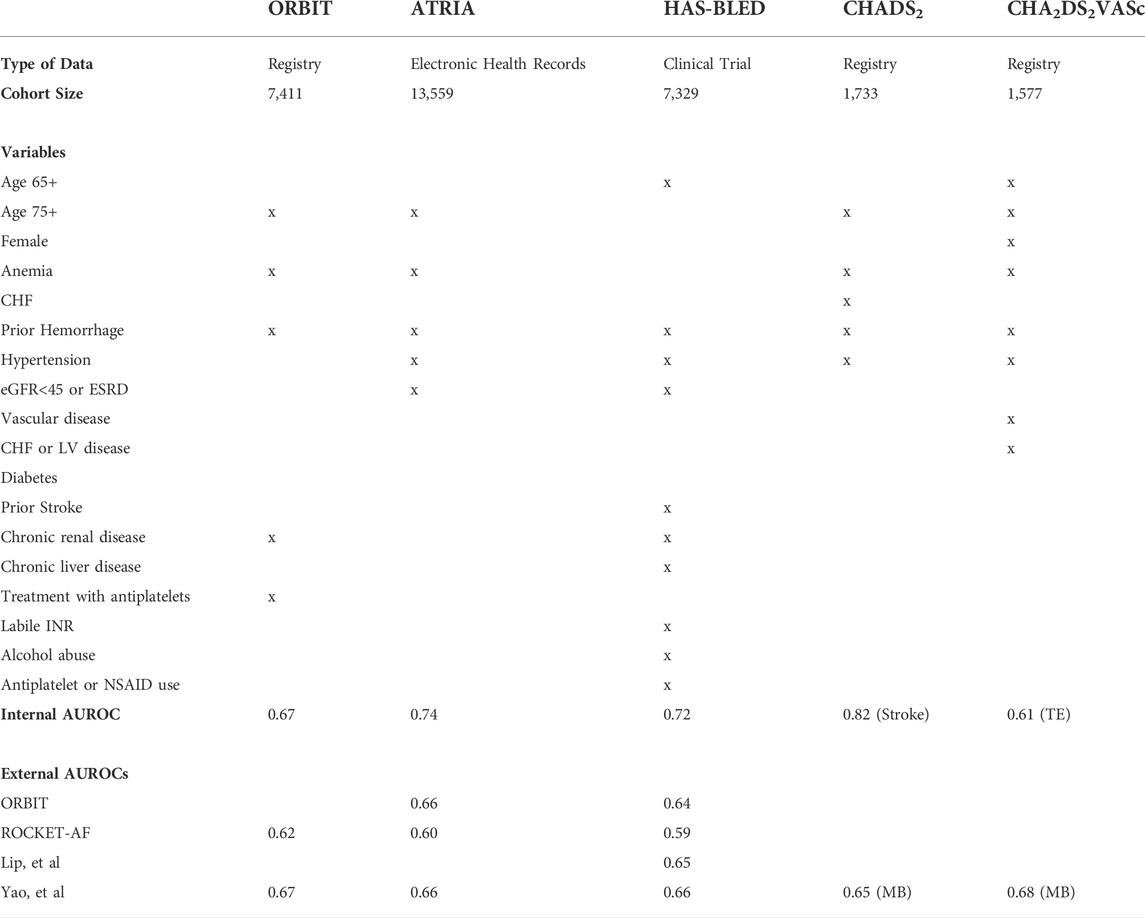
TABLE 2. Existing models for predicting major bleeding risk.
The complete definitions for each variable (sets of SNOMED-CT or RxNorm codes) are provided in the study package available on GitHub (https://github.com/ohdsi-studies/validationInContext).
2.4 Development of models used for upper and lower-bound AUROC estimation
We applied the Observational Healthcare and Data Science Informatics (OHDSI) Patient Level Prediction framework to develop and validate the age/gender only models (hypothetical lower-bound AUROC) and large-scale LASSO regularized regression models with thousands of candidate predictors (hypothetical upper bound AUROC) (Reps et al., 2018). The framework is available as an open-source R package and implements a process for developing patient-level prediction models while addressing existing best practices towards ensuring models are clinically useful and transparent.
The benchmark age/gender models (hypothetical lower-bound AUROC) only used the covariates age (in 5-years groups) and sex.
The large-scale models (hypothetical upper-bound AUROC) are comprised of more than 30-thousand baseline covariates, including.
Age in 5-years groups (e.g., 0–5, 5–10).
Sex.
Conditions (grouped using vocabulary hierarchy).
Drugs (grouped into ingredients),
Procedures.
Measurements.
Observations,
And use of Devices all-time prior to the index date. The models’ calibration-in-the-large values are presented in Table A3. None of the existing models were well calibrated.
Models were trained on each of the four databases, which was split into a training set (75% of the data) and a testing set (25% of the data) to perform internal validation. Two models were created per database, one for each target population (warfarin new users or DOACs new users), resulting in a total of 8 models: 2 target cohorts x 4 databases. The chosen classifier was a regularized logistic regression with Least Absolute Shrinkage and Selection Operator (LASSO) regularization and the hyper-parameter controlling the amount of regularization. Models were developed an adaptive search and 10-fold cross validation on the training set (Suchard et al., 2013).
To internally evaluate the models, the model discrimination on the test set was assessed using the AUROC and the model calibration was assessed by inspecting a calibration plot generated by binning the patients into 10 groups based on their predicted MB risk and comparing the observed fraction of the group with a MB record by the end of observation vs. the mean predicted MB risk for the group.
All code used to develop and train all models in this study are provided in the study package available on GitHub (https://github.com/ohdsi-studies/validationInContext).
3 Results
The discriminative ability of the five existing models, the large-scale models, and age/gender only models on predicting the MB events across the four datasets are presented in Table 3. For both cohorts of warfarin new users and DOACs new users, within any database investigated, the performance of all existing models did not differ substantially. The existing models achieved AUROC values between 0.6–0.7 across databases, generally on the lower end, though the values varied by database. The large-scale models performed better than the existing models with AUROCs in the low 0.7 s and the age/gender only models performed the worst, only predicting slightly better than random guessing (with all AUROC <0.6). The best performing existing models, based on AUROC, differed across databases. Compared to other models, CHADS2 and CHA2DS2VASc performed relatively better in CCAE (AUROCs 0.65–0.67) but worse in MDCD (AUROCs 0.54–0.61). In MDCR and Optum DOD, the existing models performed similarly. The ROC plots for the large-scale models (hypothetical upper bound AUROC), the existing models, and age/gender only models (hypothetical lower bound AUROC) are presented in Figure 2. As expected, the existing models’ performance fell somewhere between the hypothetical upper and lower bounds AUROC.
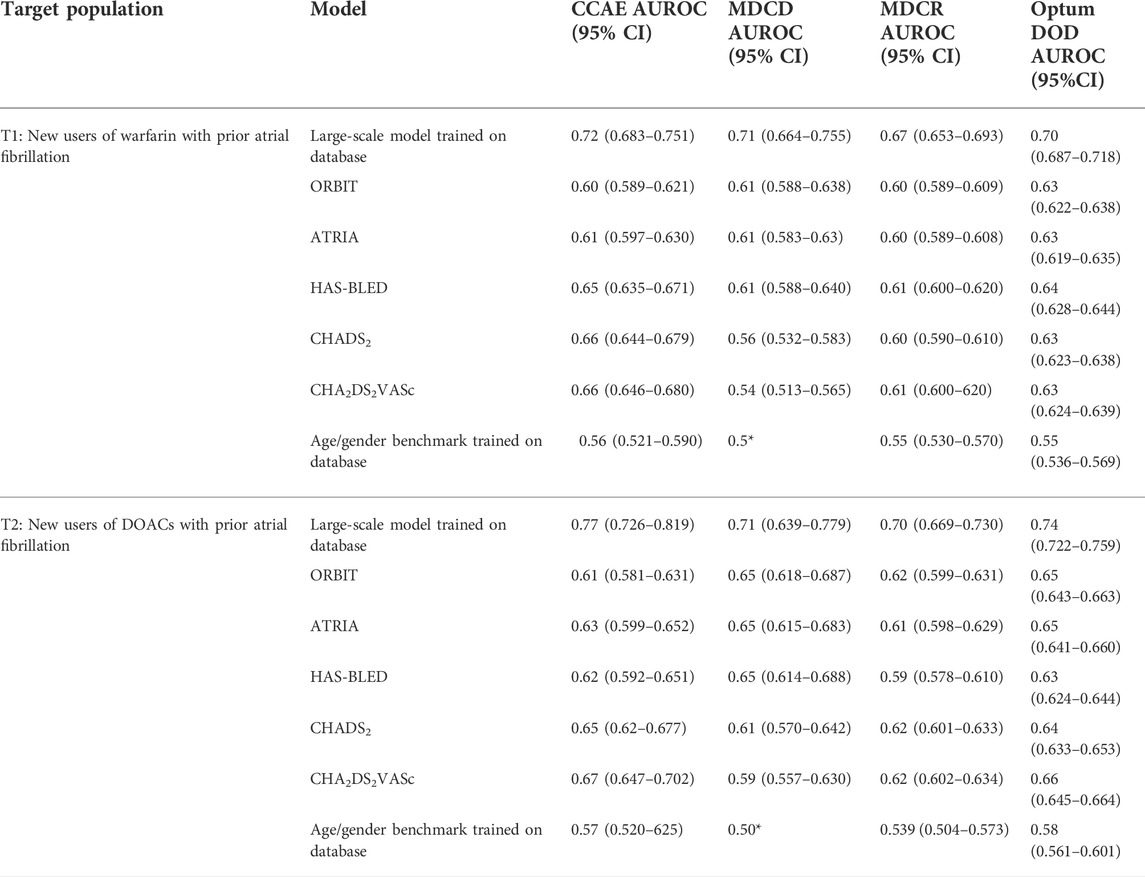
TABLE 3. Discriminative ability of the five existing bleeding risk prediction models, the LASSO logistic regression models, and age/gender model across four databases. * indicates that no covariates were picked in the model resulting in everyone being assigned the same risk.
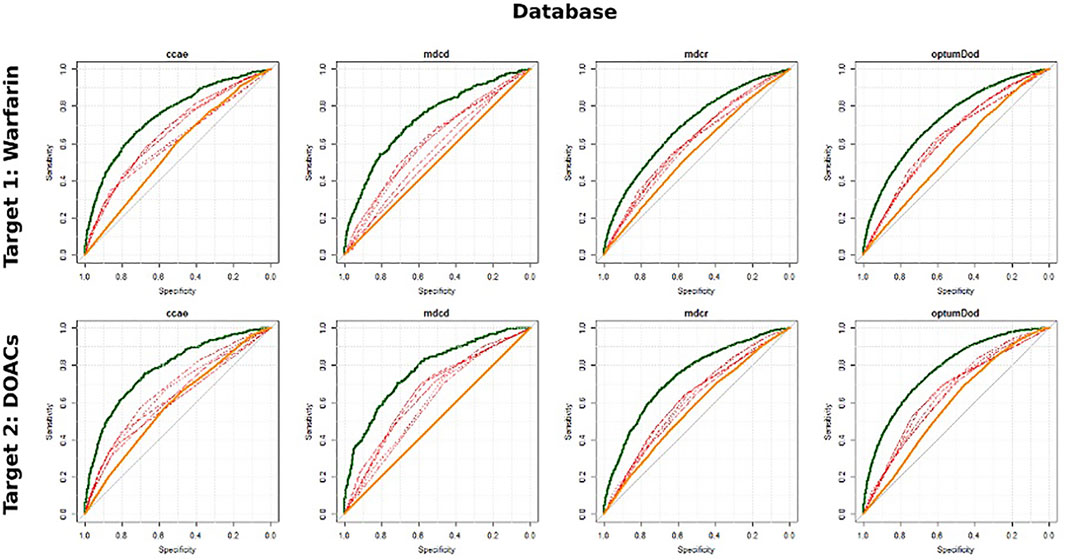
FIGURE 2. ROC plots for the large-scale model (bold green), simple existing models (red) and age/gender benchmark model (bold orange).
The models’ calibration-in-the-large values are presented in Table A2. None of the existing models were well calibrated.
4 Discussion
In this study, we developed benchmark models with age and gender only and large-scale regularized logistic regression models in 4 observational databases. These models are developed to predict the risk of a MB event within 1–365 days after the first use of warfarin or DOACs in patients with AF. We also externally validated the ORBIT, ATRIA, HAS-BLED, CHADS2, and CHA2DS2-VASc scores in the same databases and compared the results of the validation to the upper bound (large-scale regularized logistic regression) and lower bound (age and gender only) of prediction models AUROC. All the existing models’ performance fell somewhere between the hypothetical upper and lower bounds of AUROC.
In the development of patient-level prediction models, the discriminative capability of a model is typically compared to the theoretical maximum AUROC of 1 (those who ultimately experience the outcome always have a higher predicted risk than those who do not experience the outcome) and the theoretical minimum AUROC of 0.5 (those who experience the outcome have the same predicted risk as those who do not experience the outcome). Generally, the higher the C-statistic or AUROC of the model, the more predictive and potentially useful it is to physicians for individual patient management and to sponsors for potential new drug development for high-risk population.
One challenge in predictive model development is the tradeoff between simplicity and predictive performance. The complex, more discriminative models tend to have many covariates, and thus are inherently difficult to implement in actual practice, whereas the simple models (such as ATRIA, ORBIT, HAS-BLED, CHADS2, and CHA2DS2-VASc) are less discriminative but relatively easier to use. A risk score with an AUROC of 0.66 may be used more often than the model with an AUROC of 0.75 because it is much easier to evaluate 7 risk factors rather than 107 comorbid conditions in a patient. What is interesting to note is that both the simple and complex models are typically compared against the theoretical 0.5 to 1 AUROC range to determine their discriminative ability. However, some outcomes are less predictable, particularly in observational health databases, because not all predictive risk factors can be fully captured. In other words, there is only a certain level of risk we can predict based on the covariates available in the data. When a large number of covariates are required to achieve an AUROC of 0.75, it could be argued that some portion of the outcome cannot be predicted with the limited data at hand. In such cases, we should consider the discriminative capability of the large-scale regularized regression model as the upper-bound for how predictable the outcome is, rather than the theoretical AUROC of 1. Similarly, a model generated using only the age and gender of the person to predict the outcome can be used as the lower-bound of the predictability of the outcome rather than the theoretical AUROC of 0.5.
The age and gender only models were not very discriminative when predicting MB in new users of warfarin or DOACs. This is well expected, because even though age is associated with many disease outcomes, other risk factors have not been captured by this single measure. The large-scale models all achieved AUROCs around 0.7, outperforming the age and gender only models by about 20%, findings with align with the results of the Yao, et al. study. In comparison, the existing bleeding risk prediction models performed only moderately worse than the large-scale models. Upon investigation of the covariates chosen by the LASSO logistic regression, there were no specific covariates that presented a highly predictive value outside of what was already included in ORBIT, ATRIA, HAS-BLED, CHADS2, and CHA2DS2-VASc.
4.1 Limitations
This study has several limitations; it is inherently difficult to exactly replicate existing models as many studies do not publish full specifications of variable definitions and code lists. We used the existing model’s variable definitions where available but developed our own alternative definitions for those that were unavailable. Additionally, it is impossible to fully validate each prediction model in each of the databases included. This is due to the heterogeneity in the underlying populations and the availability of data points in each database, with the latter particularly relevant because the nature and availability of data could be substantially different across clinical trials, prospective registries, and retrospective observational databases. Some databases may not contain the information needed to identify the patients of interest (e.g., if the target cohort required specific measurements such as vital signs and lab results) or there may not be sufficient observation time (longitudinal data) to capture the outcomes during long-term follow-up. Notably, all databases used in this analysis are United States administrative claims that often do not represent the nuance of a patient’s chart as seen in the EHR record, which could explain the covariates availability and the performance of the models. In addition, the treatment duration among these patients are relatively short, which may not reflect chronic prophylactic therapy required for the condition.
4.2 Strengths
This analysis was conducted across four large databases, which lends credibility to the outcome as they all agree in terms of the performance of the existing risk scores in comparison with the age and gender only models and the large-scale models. Unlike some prior modeling research that might have focused on a limited or preselected set of covariates, the use of the LASSO-logistic regression technique also reduced the injection of bias into the study. This technique returns to the investigator the most predictive covariates rather than the conventional approach of investigator choosing a predetermined list of covariates to include in the risk prediction model. Furthermore, the study code is fully and freely available which makes this study highly repeatable and reproducible. Finally, our approach using testing and validating, as well as application across multiple databases made our findings more robust than other studies.
5 Conclusion
Findings from this study suggest that, for validation of existing risk prediction models or development of new predictive models, it is important to put the model performance into context by calculating the lower and upper bounds of potential prediction performance in a comparable clinical setting. Comparing against the theoretical 0.5–1 AUROC range may not provide a reasonable assessment to the model. Low discriminative performance may be due to the limited data availability or difficulty in outcome ascertainment rather than the design of the model. We recommend as a best practice that age/gender only models and large-scale models are developed to estimate the lower and upper bounds of possible predictive model performance, which allows more objective evaluation of the risk prediction models.
Data availability statement
The data analyzed in this study is subject to the following licenses/restrictions: Based on the data use agreements between data vendors and Janssen Research and Development, data used to generate the analysis in this study cannot be shared, though the results are publicly available. Requests to access these datasets should be directed to https://github.com/ohdsi-studies/validationInContext.
Ethics statement
The use of IBM MarketScan and Optum databases was reviewed by the New England Institutional Review Board (IRB) and were determined to be exempt from study-specific IRB approval.
Author contributions
Conception and design—all authors, collection and assembly of data—all authors but primarily CB and JR, data analysis and interpretation—all authors but primarily JR and CB, manuscript writing—all authors, and final approval of manuscript—all authors.
Funding
This study is considered being funded by Janssen Research and Development, LLC., because all authors are salaried employees of the company. The funder was not involved in the study design, collection, analysis, interpretation of data, the writing of this article or the decision to submit it for publication.
Conflict of interest
All authors are employees of Janssen Research and Development and hold stock and stock options.
Publisher’s note
All claims expressed in this article are solely those of the authors and do not necessarily represent those of their affiliated organizations, or those of the publisher, the editors and the reviewers. Any product that may be evaluated in this article, or claim that may be made by its manufacturer, is not guaranteed or endorsed by the publisher.
Supplementary material
The Supplementary Material for this article can be found online at: https://www.frontiersin.org/articles/10.3389/fdsfr.2022.1034677/full#supplementary-material
References
Connolly, S. J., Ezekowitz, M. D., Yusuf, S., Eikelboom, J., Oldgren, J., Parekh, A., et al. (2009). Dabigatran versus warfarin in patients with atrial fibrillation. N. Engl. J. Med. 361 (12), 1139–1151. doi:10.1056/NEJMoa0905561
Cunningham, A., Stein, C. M., Chung, C. P., Daugherty, J. R., Smalley, W. E., and Ray, W. A. (2011). An automated database case definition for serious bleeding related to oral anticoagulant use. Pharmacoepidemiol. Drug Saf. 20 (6), 560–566. doi:10.1002/pds.2109
Fang, M. C., Go, A. S., Chang, Y., Borowsky, L. H., Pomernacki, N. K., Udaltsova, N., et al. (2011). A new risk scheme to predict warfarin-associated hemorrhage: The ATRIA (Anticoagulation and Risk Factors in Atrial Fibrillation) Study. J. Am. Coll. Cardiol. 58 (4), 395–401. doi:10.1016/j.jacc.2011.03.031
Gage, B. F., Waterman, A. D., Shannon, W., Boechler, M., Rich, M. W., and Radford, M. J. (2001). Validation of clinical classification schemes for predicting stroke: Results from the national registry of atrial fibrillation. JAMA 285 (22), 2864–2870. doi:10.1001/jama.285.22.2864
Giugliano, R. P., Ruff, C. T., Braunwald, E., Murphy, S. A., Wiviott, S. D., Halperin, J. L., et al. (2013). Edoxaban versus warfarin in patients with atrial fibrillation. N. Engl. J. Med. 369 (22), 2093–2104. doi:10.1056/NEJMoa1310907
Goodman, S. G., Wojdyla, D. M., Piccini, J. P., White, H. D., Paolini, J. F., Nessel, C. C., et al. (2014). Factors associated with major bleeding events: Insights from the ROCKET AF trial (rivaroxaban once-daily oral direct factor xa inhibition compared with vitamin K antagonism for prevention of stroke and embolism trial in atrial fibrillation). J. Am. Coll. Cardiol. 63 (9), 891–900. doi:10.1016/j.jacc.2013.11.013
Graham, D. J., Reichman, M. E., Wernecke, M., Zhang, R., Southworth, M. R., Levenson, M., et al. (2015). Cardiovascular, bleeding, and mortality risks in elderly Medicare patients treated with dabigatran or warfarin for nonvalvular atrial fibrillation. Circulation 131 (2), 157–164. doi:10.1161/CIRCULATIONAHA.114.012061
Granger, C. B., Alexander, J. H., McMurray, J. J. V., Lopes, R. D., Hylek, E. M., Hanna, M., et al. (2011). Apixaban versus warfarin in patients with atrial fibrillation. N. Engl. J. Med. 365 (11), 981–992. doi:10.1056/NEJMoa1107039
Lee, M. T. M., and Klein, T. E. (2013). Pharmacogenetics of warfarin: Challenges and opportunities. J. Hum. Genet. 58 (6), 334–338. doi:10.1038/jhg.2013.40
Lip, G. Y. H., Frison, L., Halperin, J. L., and Lane, D. A. (2011). Comparative validation of a novel risk score for predicting bleeding risk in anticoagulated patients with atrial fibrillation: The HAS-BLED (hypertension, abnormal renal/liver function, stroke, bleeding history or predisposition, labile INR, elderly, drugs/alcohol concomitantly) score. J. Am. Coll. Cardiol. 57 (2), 173–180. doi:10.1016/j.jacc.2010.09.024
Mant, J., and Edwards, D. (2010). Stroke prevention in atrial fibrillation: Putting the guidelines into practice. Drugs Aging 27 (11), 859–870. doi:10.2165/11538620-000000000-00000
O’Brien, E. C., Simon, D. N., Thomas, L. E., Hylek, E. M., Gersh, B. J., Ansell, J. E., et al. (2015). The ORBIT bleeding score: A simple bedside score to assess bleeding risk in atrial fibrillation. Eur. Heart J. 36 (46), 3258–3264. doi:10.1093/eurheartj/ehv476
OMOP (2021). OMOP common data model. Available from: http://ohdsi.github.io/CommonDataModel/.
Patel, M. R., Mahaffey, K. W., Garg, J., Pan, G., Singer, D. E., Hacke, W., et al. (2011). Rivaroxaban versus warfarin in nonvalvular atrial fibrillation. N. Engl. J. Med. 365 (10), 883–891. doi:10.1056/NEJMoa1009638
Pisters, R., Lane, D. A., Nieuwlaat, R., de Vos, C. B., Crijns, H. J. G. M., and Lip, G. Y. H. (2010). A novel user-friendly score (HAS-BLED) to assess 1-year risk of major bleeding in patients with atrial fibrillation: The euro heart survey. Chest 138 (5), 1093–1100. doi:10.1378/chest.10-0134
Reps, J. M., Schuemie, M. J., Suchard, M. A., Ryan, P. B., and Rijnbeek, P. R. (2018). Design and implementation of a standardized framework to generate and evaluate patient-level prediction models using observational healthcare data. J. Am. Med. Inf. Assoc. 25 (8), 969–975. doi:10.1093/jamia/ocy032
Suchard, M. A., Simpson, S. E., Zorych, I., Ryan, P., and Madigan, D. (2013). Massive parallelization of serial inference algorithms for a complex generalized linear model. ACM Trans. Model. Comput. Simul. 23 (1)–17. doi:10.1145/2414416.2414791
Voss, E. A., Ma, Q., and Ryan, P. B. (2015). The impact of standardizing the definition of visits on the consistency of multi-database observational health research. BMC Med. Res. Methodol. 15, 13. doi:10.1186/s12874-015-0001-6
Yao, X., Gersh, B. J., Sangaralingham, L. R., Kent, D. M., Shah, N. D., Abraham, N. S., et al. (2017). Comparison of the CHA2DS2-VASc, CHADS2, HAS-BLED, ORBIT, and ATRIA risk scores in predicting non-vitamin K antagonist oral anticoagulants-associated bleeding in patients with atrial fibrillation. Am. J. Cardiol. 120 (9), 1549–1556. doi:10.1016/j.amjcard.2017.07.051
Appendix
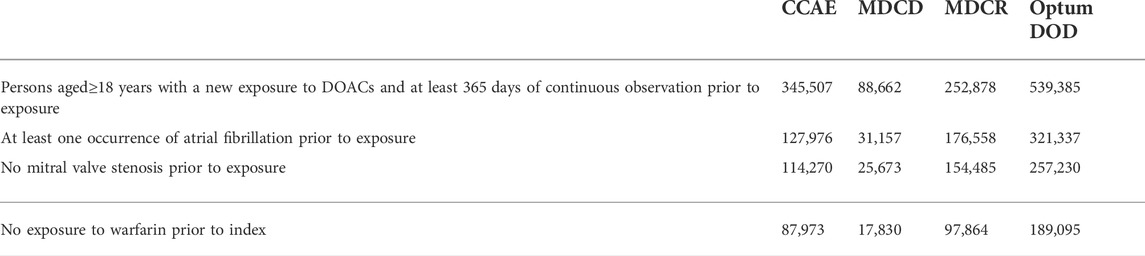
TABLE A1. Target Population 1: Patients aged 18 years and older with new exposure to warfarin (1st date of dispensing was considered index date), at least one prior diagnosis of atrial fibrillation, no prior mitral valve stenosis, no exposure to DOACs all time prior to index date and at least 365 days database observation time prior to the index date.
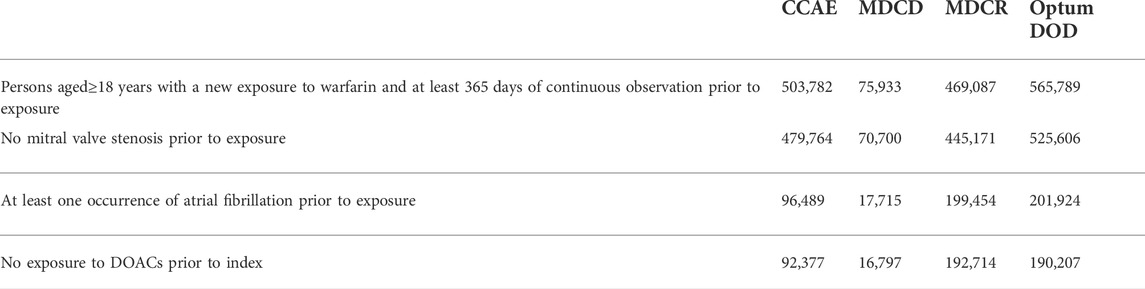
TABLE A2. Target population 2: Patients aged 18 years and older with new exposure to a DOAC (1st date of dispensing was considered index date), at least one prior diagnosis of atrial fibrillation, no prior mitral valve stenosis, no exposure to warfarin all time prior to index date and at least 365 days database observation time prior to the index date.
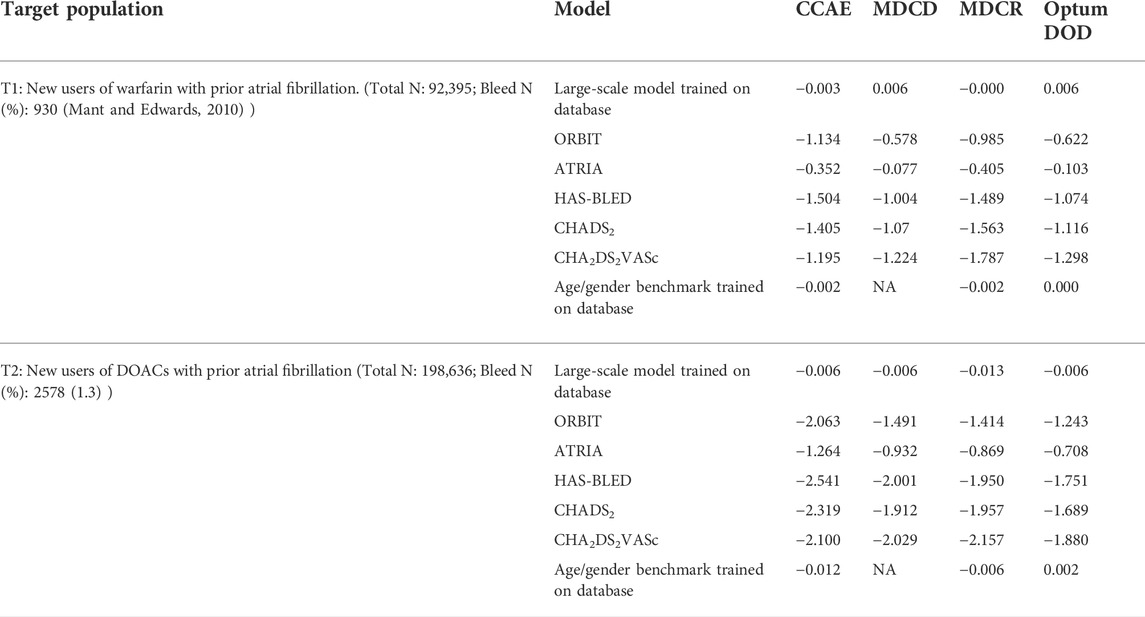
TABLE A3. Calibration-in-the-large using the intercept with the gradient set to 1 for the existing bleeding risk prediction models, large-scale models, and the age/gender model.
Keywords: prediction model, bleeding, Atrial Fibrillation, OMOP CDM, validation
Citation: Blacketer C, Reps JM, Wang L, Ryan PB and Yuan Z (2022) Putting external validation performance of major bleeding risk models into context. Front. Drug. Saf. Regul. 2:1034677. doi: 10.3389/fdsfr.2022.1034677
Received: 01 September 2022; Accepted: 22 September 2022;
Published: 19 October 2022.
Edited by:
Igor Diemberger, University of Bologna, ItalyReviewed by:
Guillermo Alberto Keller, Universidad de Buenos Aires, ArgentinaBidita Khandelwal, Sikkim Manipal University, India
Copyright © 2022 Blacketer, Reps, Wang, Ryan and Yuan. This is an open-access article distributed under the terms of the Creative Commons Attribution License (CC BY). The use, distribution or reproduction in other forums is permitted, provided the original author(s) and the copyright owner(s) are credited and that the original publication in this journal is cited, in accordance with accepted academic practice. No use, distribution or reproduction is permitted which does not comply with these terms.
*Correspondence: Clair Blacketer, mblacke@its.jnj.com