Analysis of Dynamic Recrystallization of Ice from EBSD Orientation Mapping
 Maurine Montagnat1*
  Thomas Chauve1
  Fabrice Barou2
  Andrea Tommasi2
  Benoît Beausir3
  Claude Fressengeas3
- 1Centre National de la Recherche Scientifique/University of Grenoble Alpes, LGGE, Grenoble, France
- 2Geosciences Montpellier, University of Montpellier/Centre National de la Recherche Scientifique, Montpellier, France
- 3Laboratoire d'Etude des Microstructures et de Mécanique des Matériaux, Université de Lorraine/Centre National de la Recherche Scientifique, Metz, France
We present high resolution observations of microstructure and texture evolution during dynamic recrystallization (DRX) of ice polycrystals deformed in the laboratory at high temperature (≈0.98Tm). Ice possesses a significant viscoplastic anisotropy that induces strong strain heterogeneities, which result in an early occurrence of DRX mechanisms. It is therefore a model material to explore these mechanisms. High resolution c-axis measurements at sample scale by optical techniques and full crystallographic orientation measurements by cryo-Electron Back Scattering Diffraction (EBSD) provide a solid database for analyzing the relative impact of the macroscopic imposed stress vs. the local and internal stress fields on DRX mechanisms. Analysis of misorientation gradients in the EBSD data highlights a heterogeneous dislocation distribution, which is quantified by the Nye tensor estimation. Joint analyses of the dislocation density maps and microstructural observations highlight spatial correlation between high dislocation density sites and the onset of nucleation taking place by grain-boundary bulging, subgrain rotation or by the formation of kink-bands.
1. Introduction
Dynamic recrystallization (DRX) strongly affects the evolution of microstructure (grain size and shape) and texture (crystal preferred orientation) during deformation at high temperature. Since texturing leads to anisotropic physical properties, understanding the effects of DRX in metals is essential for industrial applications, in rocks, for interpreting geophysical data and modeling geodynamic flows and in ice, for predicting ice sheet flow and hence coupled evolution of climate and cryosphere.
Along ice cores, evidence for DRX has been observed in terms of microstructure and texture evolution with depth (Thorsteinsson et al., 1997; de la Chapelle et al., 1998). Two DRX regimes are classically suggested to account for this evolution (see Duval and Castelnau, 1995; de la Chapelle et al., 1998, for instance). The first one, characterized by progressive polygonization and slow grain boundary migration rates (Duval and Castelnau, 1995; de la Chapelle et al., 1998) is referred to as “continuous" dynamic recrystallization (CDRX), or “rotation” recrystallization (Humphreys and Hatherly, 2004). In domains where pure shear or compression dominate, this recrystallization regime has relatively low impact on preferred orientations but tends to slow down texture strengthening compared to what would be expected without continuous recrystallization based on modeling estimations (Castelnau et al., 1996; Thorsteinsson, 2002; Montagnat et al., 2012). The second regime is generally referred to as “discontinuous” dynamic recrystallization (DDRX) or “migration” recrystallization. It is associated with faster grain boundary migration rates (higher temperatures and/or higher strain), which induce the emergence of large grains with irregular shapes and produces textures markedly different from the ones expected from deformation without recrystallization (Thorsteinsson et al., 1997; de la Chapelle et al., 1998; Diprinzio et al., 2005).
Although the second regime (DDRX) was shown not to dominate along ice cores (Alley et al., 1995; de la Chapelle et al., 1998; Montagnat et al., 2012), its impact on the net flow of an ice sheet could be significant because (i) it predominates at the bottom of the ice sheet where most of the flow occurs (due to temperatures close to the melting temperature Tm, and increased shear stress due to basal conditions; Cuffey and Paterson, 2010), and (ii) the texture modification associated with DDRX induces an abrupt change in viscosity that is not yet fully considered in ice flow models (Gillet-Chaulet et al., 2006). While deformation induced texture evolves progressively with strain, DDRX textures are supposed to adapt rapidly to changes in the stress state and therefore reflect the stress state. Deformation conditions in most areas of an ice sheet are characterized by low strain rates (≤ 10−10s−1) and low deviatoric stresses (≤ 0.1 MPa) that, when reproduced in the laboratory, would lead to unreasonably long durations for experiments trying to deform samples to strains of the order of 1% or more.
Duval (1979), Jacka (1984), and Jacka and Maccagnan (1984) provided complete analyses of the effect of DRX on texture and microstructure during creep tests performed in the laboratory. They showed that DRX induces the initiation of tertiary creep at 1–2% strain in the range of laboratory test conditions (10−6s−1 10−8s−1, 0.1 MPa ≤ σ ≤ 2.5 MPa for reasonable experiment durations at temperatures between −2 and −32°C). The resulting microstructures are characterized by interlocked grains and have an average grain size that depends on the applied stress (Jacka and Li, 1994). In compression, at the higher strain studied, the c-axes tend to organize in the form of a girdle that forms an angle of about 30° from the compression axis (Jacka and Maccagnan, 1984).
More generally, recrystallization mechanisms in plastically deforming materials are associated with a reduction of strain energy (energy accumulated during deformation) that is caused by the nucleation of new grains and grain boundary migration (Humphreys and Hatherly, 2004). The strain energy is linked to the heterogeneity of dislocation density and dislocation arrangements within the polycrystal and depends on the loading path, annealing conditions, and thermo-mechanical history.
Continuous and discontinuous dynamic recrystallization are classically distinguished both by the type of nucleation mechanisms and by the regime of grain boundary migration (Drury and Urai, 1990). Nucleation during CDRX is supposed to proceed mainly by continuous arrangement of dislocations into subgrain boundaries, which results in the formation of high angle boundaries, which delimit new grains (also called “polygonization”). During DDRX, strain induced grain boundary migration or bulging is usually considered as the dominant nucleation mechanism (Drury and Humphreys, 1986; Humphreys, 2004), especially at low strain and/or at high temperature, in aluminum and steel for instance (Humphreys and Hatherly, 2004). New grains are expected to have an orientation close to the parent grains. In a recent review, Sakai et al. (2014) mentioned the role of fluctuations in boundary shape produced by straining, which take the form of corrugations or serrations, and which can act as nucleation sites. In some cases, bulging is accompanied by the presence of nearby subgrain boundaries (see Wusatowska-Sarnek et al., 2002, for instance). Twinning can also play a significant role in DRX nucleation, as has been observed in magnesium (Al-Samman and Gottstein, 2008) and copper (Miura et al., 2007).
Ice has a hexagonal crystallographic structure, and its viscoplastic anisotropy is known to be strong, with dislocations gliding mostly on the basal plane with three equivalent Burgers vector directions (Hondoh, 2000). This viscoplastic anisotropy induces strong interactions between neighboring grains and highly heterogeneous strain and stress fields in the grain boundary regions (Duval et al., 1983). These heterogeneities have recently been evidenced by Digital Image Correlation (DIC) measurements on columnar ice samples (Grennerat et al., 2012). Since strain heterogeneities are precursors of the recrystallization mechanisms, recrystallization is expected to be more efficient in ice than in less anisotropic materials, as evidenced by the low finite strain level (1%) required for recrystallization to impact the macroscopic response (Duval, 1979; Jacka, 1984).
In addition, Duval et al. (2012) showed the impact of long-range internal stresses on grain nucleation during dynamic recrystallization in ice. They highlighted the role of dislocation pile-up relaxation as an additional driving force behind “spontaneous” grain nucleation. Although dislocation pile-ups remain difficult to observe directly, Electron Back Scattering Diffraction (EBSD) techniques now enable the detection of local lattice misorientations at grain boundaries and triple junctions that could result from dislocation accumulations (see among many others, Piazolo et al., 2008, 2015; Mishra et al., 2009; Dillien et al., 2010; Wheeler et al., 2011; Al-Samman et al., 2012; Yamasaki et al., 2013). However, as EBSD images the planar surfaces of samples, the resulting data are two-dimensional (2D) and hence must be interpreted with care for infering 3D mechanisms such as nucleation (Borthwick et al., 2012). EBSD data can nevertheless provide useful statistical data and local observations that inform our understanding of strain heterogeneities, grain boundary migration, and their impacts on the macroscopic behavior.
The aim of the present work is to provide new insights on DRX mechanisms in ice at high temperature from high resolution measurements of lattice orientations. We use microstructure observations at the sample scale made by optical methods with a higher resolution than previously available, and EBSD measurements at a fine length-scale that completely characterize all grain orientations and local misorientations related to dislocation substructures. Using these observations we will analyze the correlation between strain heterogeneities and DRX mechanisms.
The manuscript is organized as follows. Section 2 describes the experimental procedures. Section 3 presents the microstructure and texture measurements, as well as an analysis of the misorientation gradients, which provide a proxy of dislocation density via the Nye tensor estimation. These results are discussed in Section 4 in terms of the contrasting impact of macroscopic stress and local (and internal) stress on DRX mechanisms and on texture development. The role of frequently-observed kink bands and subgrain boundaries in nucleation are examined.
2. Methods
Creep tests were performed on cylindrical samples of polycrystalline ice made in the laboratory. The ice polycrystals were made from sieved seeds within a controlled size range, in a mold from which air was removed by pumping before adding distilled dionized and degassed water. Ice was gently frozen under a controlled temperature gradient and was kept at −5°C for more than 24 h to relax the microstructure after removal from the mold. Remaining bubbles were small and hardly visible. The samples were machined to cylinders about 8 cm long and 4 cm in diameter. The initial average grain area was 1–4 mm2.
The experimental set up is a classical creep apparatus, placed in a cold room, with the load applied via a level arm in order to impose low levels of stress. Two Teflon sheets were placed between the sample and the press in order to minimize friction at the specimen contact surfaces. At the end of the test, samples were still cylindrical, with no apparent shear localization. Constant stress of 0.7, 0.75, or 0.8 MPa was applied under temperatures of −5°C or −7°C ± 0.1°C (0.98 or 0.97Tm). Similar results were obtained for both temperature conditions. Ten tests were performed up to finite strains of 2–18%, with the larger strain implying 10-day long experiments. The minimum strain rates are close to 10−7 s−1, in a range where cracks are not expected to occur (Schulson and Duval, 2009), and indeed no crack was observed. Optical fabric analyses were performed at −15°C immediately at the end of the tests, and samples were maintained at −40°C prior to EBSD observations to limit the effect of post-dynamic recrystallization or annealing.
The c-axis (or optical axis) orientations were first measured using the optical Automatic Ice Texture Analyzer (AITA; Russell-Head and Wilson, 2001; Peternell et al., 2011) on a thin section of each sample (about 8 × 3 cm2) cut parallel to the cylindrical axis. In the chosen configuration, the analyzer provides the c-axis (< 0001>) orientations with a spatial resolution of 20 μm and an angular resolution of about 3°. Grain boundary extraction was performed on these measurements to measure grain area.
Full lattice orientations were obtained using EBSD on the Crystal Probe Scanning Electron Microscope of Geosciences Montpellier (CNRS, University of Montpellier) mounted with a GATAN cold stage modulus. The operating conditions were a 15 kV accelerating voltage, a probe current of about 3 nA and a working distance of 25 mm. EBSD patterns were indexed automatically using the Channel5 software package from Oxford Instruments HKL and processed by using the MTEX free software (Bachmann et al., 2010; Mainprice et al., 2014). EBSD patterns were taken with a resolution of 336 × 256. The number of detected bands was between 6 and 8 and the number of reflectors taken into account was 70. An angular resolution of about 0.7° is expected (Randle, 1992) and this was verified on non deformed grains. Resolution can degrade slightly after prolonged scans (over 4–5 h) but remains of the order of a degree.
Sample surfaces used for EBSD scanning were prepared by careful shaving of the samples in a freezer at −40°C just before the analyses. High quality patterns having indexation rates higher than 85% at 50 μm resolution, and over surfaces of up to 20 × 10 mm2 in area, were enabled by suitable adjustment of the vacuum and temperature (1Pa, −110°C) following the practice of Weikusat et al. (2011a). Frost and sublimation remained negligible on the sample surface during the analyses.
3. Microstructure and Texture Evolution During DRX
3.1. Optical Observations at the Sample Scale
Creep curves obtained from the different tests are presented in Figure 1. All curves are similar to those measured by Jacka and Maccagnan (1984), with the strain rate decreasing during primary creep, up to about 1% strain (when the minimum strain rate is reached), beyond which the strain rate increases to reach tertiary creep. After about 8% strain, a hardening stage is observed, whose evolution could not be followed further. This hardening is probably related to the development of the DDRX texture, which tends to strengthen the sample in axial compression conditions (texture-induced mechanical anisotropy).
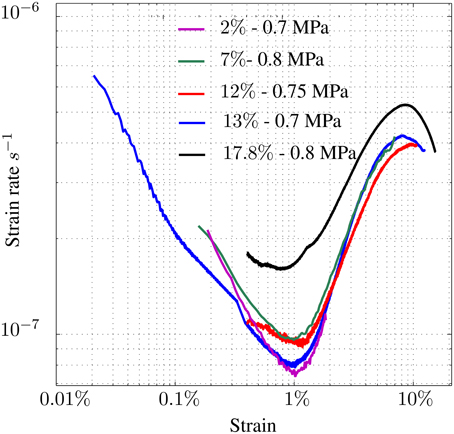
Figure 1. Strain rate vs. strain plots for the different tests performed. Imposed stress varied between 0.7 and 0.8 MPa. Temperature was −5°C ± 0.5°C. Strain data were acquired by Digital Image Correlation method (DIC) or using a Low Voltage Displacement Transducer (LVDT).
Figure 2 presents the evolution of c-axis orientations, as measured by the AITA (see Section 2), for the tests performed at −5°C up to 2, 7, 12, 13, and 17.8% of strain. Since ice has a hexagonal crystallographic structure, each grain's orientation is characterized by the orientation of the long axis of the hexagonal cell, the < 0001> c-axis, and by the orientation of one of the three a-axes, which lie at 120° from each other.
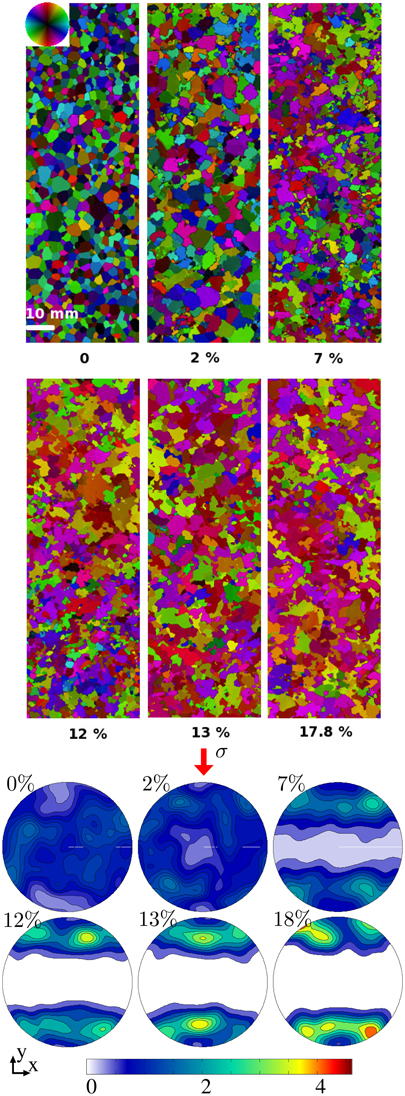
Figure 2. Evolution of microstructures and textures (c-axis orientations, represented by pole figures, with a color scale corresponding to the relative number of pixels plotted) during creep tests on ice polycrystals that have been deformed to different strains (as indicated by the percentage). The direction of compression is vertical. Data are obtained from the AITA, with a c-axis orientation color-scale given by the color-wheel. The resolution is the same for all figures.
At both experimental temperatures (−7°C and −5°C), the texture evolves toward a multi-maxima type texture (Figure 2). The c-axes rapidly cluster into multiple maxima that further evolve with strain toward a girdle at ca. 35° from the compression direction. It is worth noting that grains oriented with their c-axes roughly normal to the compression direction are absent after 12% strain at −5°C, while some grains with their c-axes parallel to the compression direction remain.
The grains were defined as continuous domains surrounded by grain boundaries well detected by the analyzer. Grain boundaries were detected by using Matlab morphological operations to skeletonize based on color change detection. Any correction to skeleton images obtained was made visually by tracing the loci of discernible misorientations (shown by color changes) and by linking together coherently-shaped microstructural contacts. This procedure allowed us to distinguish triple junctions between grain boundaries (GBs) from intersections between GB and subgrain boundaries (SGB). We therefore hope to distinguish highly misoriented subgrains from closely oriented grains. Since AITA provides c-axis orientations only, we cannot use an absolute criterion to distinguish low angle grain boundaries (LAGB) from high angle ones (HAGB) as can be done on EBSD observations. Manual corrections are therefore operator dependent, and we took care to have them performed by only one person for consistency. The data thus obtained enabled to perform comparisons between the samples at different strain levels.
The grain area distribution and its evolution with strain are presented in Figure 3. Except for the non-deformed microstructure which is characterized by nearly equiaxed grains, the distributions are not normal but bimodal. The evolution of grain area with deformation is therefore described by the median and the first and third quartiles (Figure 3). Similar distributions are found at different non-zero strains.
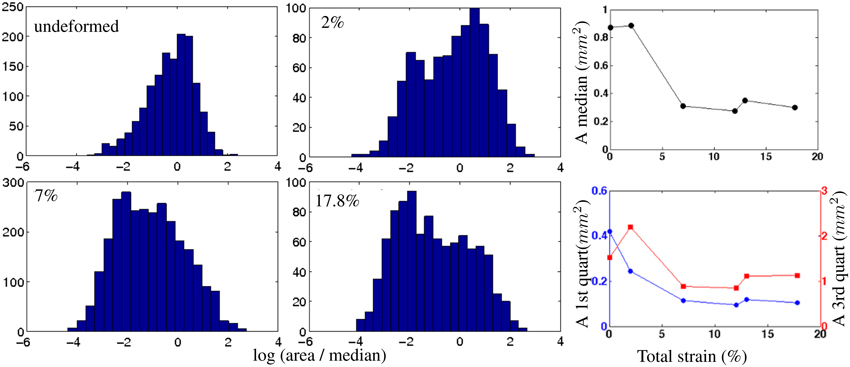
Figure 3. Left: Distributions of grain area in logarithmic scale, for the undeformed sample and samples deformed to 2, 7, and 17.8% strain. Not all distributions are shown for clarity purpose. Right: 2D grain area (A) evolution with strain, determined from the AITA microstructure measurements. Median (top) and first- and third- quartiles (bottom) grain areas are represented.
With increasing strain, grain shapes become more and more interlocked (e.g., Figure 2 top), even though serrated grain boundaries occur at any non-zero level of strain. This grain shape evolution is represented in Figure 4 by using a grain shape factor described in Heilbronner and Barrett (2014), called PARIS, which is defined to be = 2 × (P−PE)/PE × 100%, where P is the perimeter and PE the perimeter of the convex hull. This shape factor is able to distinguish between elongated grains (PARIS = 0) and interlocked grains (PARIS > 1). We observe that the PARIS parameter increases rapidly at the early stage of deformation, and its mean remains nearly constant for higher strain levels. This tendency is biased by the fact that the microstructure evolves toward a bimodal distribution, with large grains being under-represented due to sectioning effects. A greater abundance of small grains compared to large grains at large strains may be due to an increasing 2D sectioning effect on more interlocked grains.
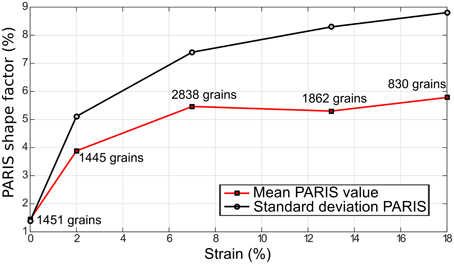
Figure 4. Evolution of the PARIS shape factor (%) with deformation for the tests performed at −5°C, evaluated as the mean over all grains. The curve of the standard deviation is also shown (black).
Indeed, such an interlocked microstructure in 3D cannot be fully characterized based on 2D observations. We therefore interpret the evolving 2D grain area and shape data in Figure 4 as qualitative indicators of the microstructure evolution with strain.
3.2. EBSD Characterizations
For each sample, two areas were analyzed by EBSD at 50 μm resolution to increase the robustness of statistical parameters. Contrary to what was done in Piazolo et al. (2008) with the same technique, here we could observe and characterize the substructures over the entire surface of EBSD samples, thanks to stability of their surface state. Several additional (smaller) areas were analyzed at 5 or 10 μm resolution to provide higher resolution analyses of subgrain boundaries and dislocation substructures.
Figure 5 shows EBSD maps and pole figure representations of full crystallographic orientations obtained on the samples deformed at −5°C, up to 2, 7, and 13% strain. Both low angles (in gray, between 1 and 5°) and high angle grain boundaries (in black, >5°) are shown. The 5° value chosen following Weikusat et al. (2011b) tends to under-detect boundaries between grains that have close orientations (especially at higher strains when the texture is strong). Still, this choice appears to be appropriate, as justified by our analysis of the distribution of misorientations (later in this Section).
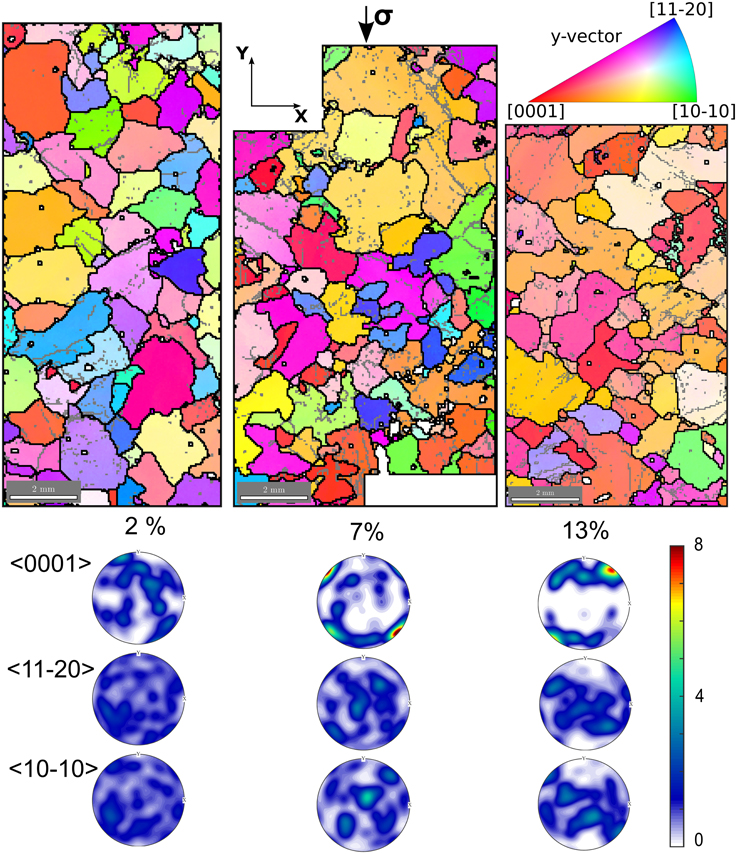
Figure 5. Top: EBSD patterns and pole figures obtained after 2% strain (left), 7% strain (center), and 13% strain (right), at −5°C. Coloring represents the orientation of the compression direction (y-vector) relative to the crystals' axes accordingly to the inverse pole figure scheme displayed on the top right. Red crystals have < 0001> parallel to the compression direction, blue ones have parallel to the compression axis, and green ones, . Boundaries with more than 5° misorientation are depicted as black lines, boundaries with misorientations between 1 and 5° as gray lines. Bottom: pole figures representing the orientation of the < 0001>, , crystal axes relative to the compression direction, which is vertical in these lower hemisphere stereographic projections.
Despite the limited number of grains on the EBSD maps (Figure 5), the c-axis pole figures (Figure 5 bottom panel) match well those obtained on the whole sample section by AITA measurements (Figure 2). The multi maxima clustering of c-axes in a girdle, and strengthening of the texture with increasing strain, are both clearly visible. We also observe a multi-maxima clustering of the a-axes, in a wide girdle at a high angle to the compression direction.
Both low resolution (Figure 5) and high resolution EBSD measurements (Figures 6, 7) allow us to characterize the subgrain boundary configurations and dislocation substructures; they highlight two particular features. First, we observe highly serrated grain boundaries at different length scales (Figures 5, 6). Second, the grains show strong local misorientations that take the form of (i) tilt boundaries (with the c-axis parallel to the subgrain boundary trace, and a rotation around either an a-axis or a m-axis (), or a combination), (ii) kink bands composed by two opposite tilt boundaries, and (iii) more complex local subgrain structures close to GBs and triple junctions, such as the ones observed in Mansuy et al. (2000), Hamann et al. (2007), Piazolo et al. (2008), Montagnat et al. (2011), Piazolo et al. (2015) (Figures 6, 7). The likely nature of the subgrain boundaries (tilt boundaries, kink bands) were determined following the methods of Piazolo et al. (2008), which are based on Prior et al. (2002). A strong heterogeneity in local misorientations is well illustrated by the example in Figure 7, where two subgrain boundaries with perpendicular traces are found inside a single grain. Analysis of the misorientations across these two subgrain boundaries points to rotation around an a-axis or a combination of a- and m-axis. In this example (Figure 7), SGB1 is likely to be a tilt band with a boundary plane perpendicular to the sample surface (see boundary trace in red, and interpreted SGB plane in gray). The low misorientation accommodated by SGB 2 renders the discrimination of the rotation axis more difficult, but a likely explanation is that this SGB is a tilt band with a plane nearly parallel to the sample surface plane. Another remarkable observation is that serrated GB and subgrain boundaries are often linked spatially with each other, as has been pointed out by Weikusat et al. (2009). Subgrain boundaries or kink bands often appear close to a step, spike or sharp turn, in the boundary (Figures 5, 6). These features suggest the possibility of pinning of migrating boundaries by subgrain boundaries and kink bands.
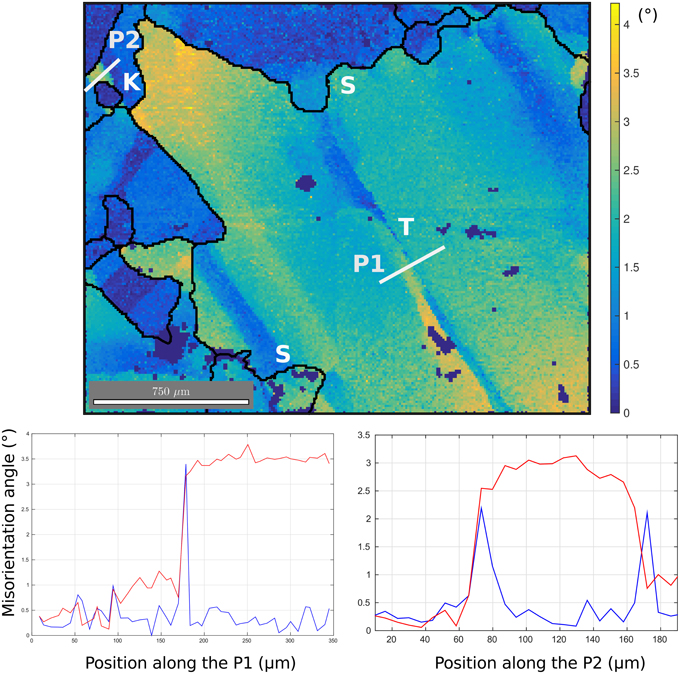
Figure 6. Top: High resolution (5 μm) observation of lattice misorientations at a triple junction in the sample deformed at 7% strain. Misorientation amplitudes compared to the average orientation of the grain (Mis2mean) are given by the color-scales in °. The white lines are profiles across subgrain boundaries. Bottom: Misorientation along the two profiles P1 (left) and P2 (right). P1 represents a typical tilt band, while P2 is a kink band formed of two opposite tilt bands. “S” stands for “Serrated GB,” “K” for “kink band” and “T” for tilt band.
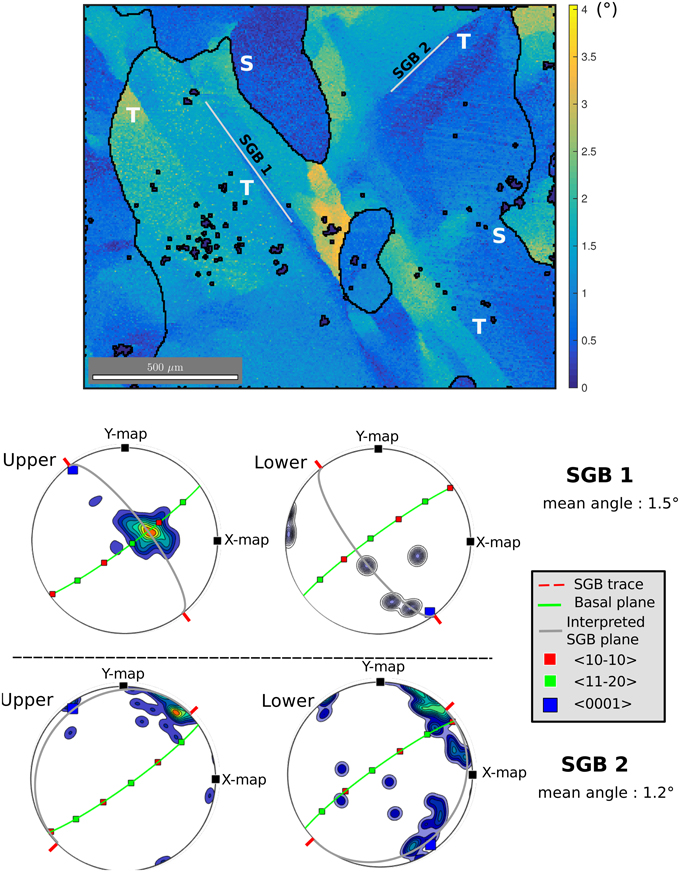
Figure 7. Top: High resolution (5 μm) observation of lattice misorientations at a triple junction in the sample deformed at 13% strain. Misorientation amplitudes compared to the average orientation of the grain (Mis2mean) are given by the color-scales in °. The white lines indicate two perpendicular subgrain boundaries (SGB1 and SGB2). Bottom: Axis of rotation of the misorientation measured side by side of each subgrain boundary (SGB1 and SGB2). Rotation axes are a combination of m- and a-axes for SGB1 (top), a-axis with a slight component of c-axis for SGB2 (bottom). The boundary plane traces are marked in red. Tilt bands would require the boundary to be perpendicular to the sample surface for SGB1 (marked in gray), and nearly parallel to this surface for SGB2. “S” stands for “Serrated GB” and “T” for tilt band.
EBSD analyses also provide statistical information on the evolution of orientation relations both within and between adjacent grains. The histograms of Figure 8 present the distribution of angle of misorientations between adjacent pixels from the 50 μm resolution images (super-imposing data from the two areas of each sample analyzed for each level of strain), in the misorientation range 1–10°. The range 0–1° falls within the measurement accuracy and is considered as noise. The dashed line represents the expected histogram for a uniform spatial distribution of misorientations taken in the range of misorientations considered here (1–10°). At 2% strain, the distribution already shows a high density of low-angle misorientations. This density increases with strain until about 13% strain and decreases after. Most misorientations occur in the range 1–4°. In this range of misorientations, the distribution strongly differs from the uniform spatial distribution (dashed line) and from the distribution obtained for undeformed samples. For misorientation values above 5–6°, the distribution approaches the uniform distribution, and the one observed for undeformed samples. This finding validates the choice of using 5° to demarcate the transition between low and high angle grain boundaries.
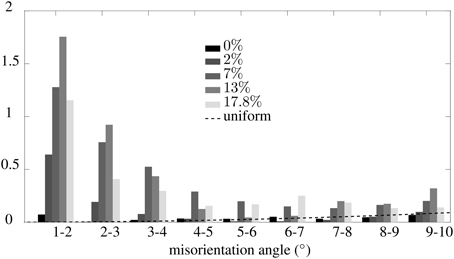
Figure 8. Distribution of misorientations measured between adjacent pixels, extracted from the 50 μm resolution EBSD data from Figure 5, for the tests performed up to 2, 7, 13, and 17.8% strain. The dash line provides the case of a uniform distribution of misorientations in the considered range. The y-axis scales as the density normalized such that sum over densities = 100 over the full range of misorientations considered (0–93°)
Note that, due to the 2D character of the EBSD images, new grains produced by DRX-nucleation mechanisms or “nucleus” cannot be directly discriminated in the present experiments performed on granular ice because any apparent small grain seen on an image could instead result from a cross-sectional cut taken across a part of a large irregular grain.
3.3. Estimation of Dislocation Density from EBSD Maps
In the theory of dislocations, the dislocation density tensor α (Nye's tensor, Nye, 1953) is defined as:
where Ue is the elastic distortion tensor. A non-zero value of α means that Ue is incompatible and consequently that the elastic displacement is multiple-valued (has a discontinuity) along some surface in the lattice, which reveals the presence of dislocations. By decomposing Ue into its symmetric part ϵe (i.e., the elastic strain tensor) and its skew-symmetric part ωe (the elastic rotation tensor) α may be expressed as:
By introducing the elastic curvature tensor κe = gradΩe, with Ωe as the elastic rotation vector associated with ωe, the curlωe part can be written as , where tr(A) and At denote respectively the trace and transpose of tensor A, and I is the identity tensor. Equation (2) then becomes
The elastic curvature tensor κe may be partially recovered from a crystal orientation map obtained by EBSD. By additionally recovering the elastic strain field, one can experimentally infer the dislocation density tensor α from Equation (3). Such information may be obtained from analysing the shift of electron diffraction patterns (Wilkinson et al., 2006; Kacher et al., 2009; Villert et al., 2009), but most often the curl term is neglected (El-Dasher et al., 2003; Field et al., 2005; Pantleon, 2008; Beausir and Fressengeas, 2013) and Equation (3) is reduced to Equation (4),
As a rule of thumb, the error committed in this approximation may be estimated to be of the order of 10% of the actual value. It is insignificant if strain gradients are small.
Let us denote the components of Ωe as: θi(i = 1, 2, 3) in the sample reference frame, as measured along a square grid on the sample surface. The disorientation vector between two neighboring points in this grid has components Δθi(i = 1, 2, 3) in this frame. From the disorientation between neighboring points separated by Δxj(j = 1, 2), only six components of the elastic curvature tensor:
can be captured, because differences along the direction normal to the surface are not available. Using this result, it is shown from Equation (4) that five components of the Nye tensor can be recovered, namely (α12, α13, α21, α23, α33) in the sample reference frame (Pantleon, 2008). The measured elastic curvatures, and hence the dislocation densities derived from these measurements using Equation (5), depend on the characteristic grid size, i.e., on the resolution of the data. This resolution was kept constant and equal to Δx = 50 μm throughout our measurements. Therefore, the data can be used to document the evolution with strain of the dislocation density field.
Figure 9 shows a map of the norm of the observable Nye tensor:
for samples deformed at −5°C, at 2, 7, and 13 % strain. These maps highlight areas of high dislocation density, in particular tilt boundaries, kink bands, or local subgrain structures close to GB and triple junctions. The average of the norm of the observable Nye tensor was calculated as , over the whole sample surface S.
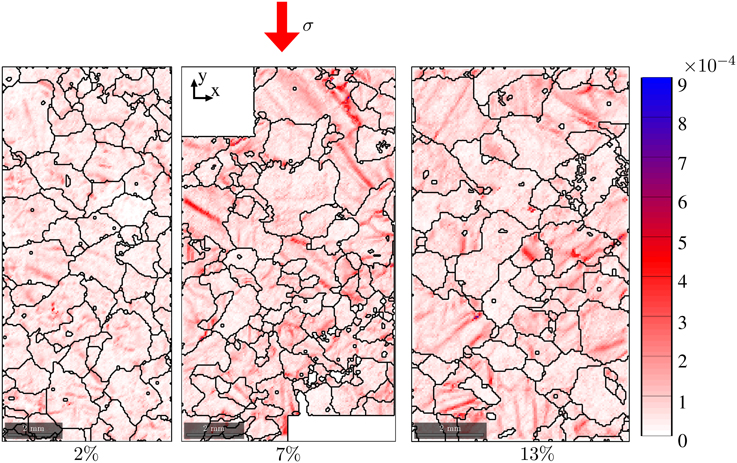
Figure 9. Map of the norm of the Nye tensor (rad.μm−1) after 2, 7, and 13% strain, at −5°C, as obtained from the 50 μm resolution EBSD data.
Figure 10 represents the evolution of the averaged norm of the observable Nye tensor with strain, for both temperature conditions. A sharp increase of the average norm is observed during the first 2–5% for both −5 and −7°C experiments. It stabilizes in a broad peak around twice of the initial value measured on the undeformed samples, and then, after the peak, slightly decreases with strain. At low strain, values of the average norm of the Nye tensor measured at −7°C are 20–25% higher than the ones measured at −5°C, but the two values become similar after about 12% strain. A higher frequency sampling would be necessary to provide more accurate observations of this tendency.
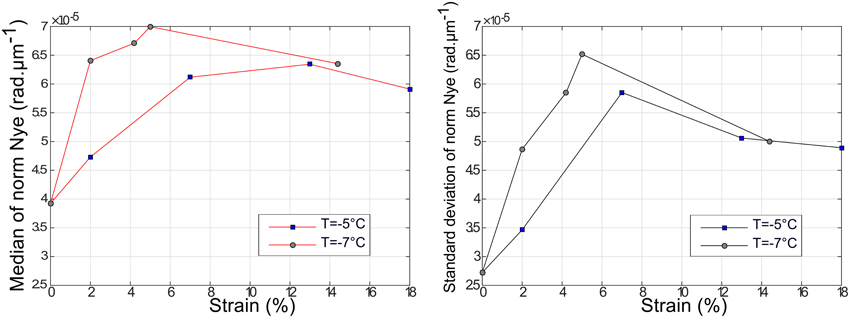
Figure 10. Evolution with deformation of averaged observable norm of the Nye tensor (rad.μm−1) and its standard deviation, for the two temperature conditions.
4. Discussion
The compressive creep tests performed in this work display all three creep stages usually observed in polycrystalline ice deformed in the laboratory. The sharp strain-rate decrease during transient creep is followed by a minimum strain-rate of secondary creep at 1% strain. We interpret that activation of DRX mechanisms explains the observed transition to tertiary creep and the associated weakening after only 1% strain (Figure 1), the observed texture evolution toward a girdle of c-axes at about 35° from the compression direction, and a constant median grain size at a given stress. These results are in good agreement with previous observations of DRX in ice (Jacka, 1984; Jacka and Maccagnan, 1984; Ashby and Duval, 1985; Jacka and Li, 1994).
The experiments presented here were performed at high homologous temperatures, in conditions where grain boundary migration is classically supposed to dominate DRX mechanisms (Humphreys and Hatherly, 2004). The observed evolution of grain area and shape is in good agreement with this assumption, and grain boundaries are found to become serrated after only 2% strain (Figures 2, 5). That the shape parameter increases with strain (Figure 4) reflects the evolution of strong spatial heterogeneity in GB migration rates.
Although GB migration appears to be efficient (as indicated by the presence of highly interlocked grains and a broad grain size distribution), we observe strong substructures such as tilt boundaries, kink bands, and subgrain boundaries close to triple junctions, with similar abundance of these substructures at different non-zero strain levels. In the substructure areas, the dislocation field shows heterogeneities that we quantified by estimating the Nye tensor distribution from EBSD measurements (Figure 9). Although the dislocation density at the sample scale (inferred from the average Nye tensor norm) is highly heterogeneous, its mean value remains similar across the range of strain from 2 to 18% (Figure 10).
Subgrain boundaries and kink bands appear to interact with GBs. They may play a role in causing GB to become serrated and to bulge, since stable tilt bands may pin a moving GB. Locally GBs may also migrate toward such dislocation substructures due to a favorable or enhanced driving force (stemming from a difference in dislocation stored energy).
Although nuclei cannot be directly identified from the 2D observations available, given our findings on the misorientation distribution and grain size evolution (bimodal distribution, and decrease of median grain size after 2% strain, see Figure 3), we hypothesize that nucleation contributed to the accommodation of local strain field heterogeneities. Duval et al. (2012) demonstrated the effect of long-range internal stresses created by dislocation pile-ups at GB on nucleation in ice. They showed that pile-ups provide an additional driving force resulting in a drastic decrease of both nucleation critical radius and saddle point energy, and therefore cause a “spontaneous” grain nucleation. Our observations of highly misoriented areas close to GBs and triple junctions show that dislocation fields remain highly heterogeneous during DRX at high temperature and could result in a strong internal stress field. Although the precise nucleation mechanism cannot be discriminated here, nor in any post-mortem experiments, “spontaneous" grain nucleation is expected in these regions. Rapid growth of some nuclei might have played a significant role in determining the final observed textures.
The macroscopic rheology exhibits softening between 1 and 10% strain but the local strain and stress states remain heterogeneous enough to activate accommodation mechanisms such as tilt and kink bands and to induce strong dislocation accumulations close to GBs and triple junctions (Figures 6, 7, 9). These sub-structures are frequently observed during transient creep of ice (Mansuy et al., 2002; Montagnat et al., 2011), prior to DRX. The strong viscoplastic anisotropy of ice ensures a continuous production of these substructures by generating strain incompatibilities between grains, which (in the present experiments) cannot be efficiently relaxed despite the presence of effective GB migration.
Or high resolution mapping by EBSD (5 and 10 μm) provides a detailed characterization of lattice misorientations induced by strain heterogeneities (Figures 6, 7). For instance, we find an example where two nearby subgrain boundaries with rotation axes perpendicular to each other co-exist within the same grain (Figure 7). We suggest that these sub-structures, which can facilitate dislocation slip locally (Piazolo et al., 2015), can act as nucleation precursors. From our observations (Figures 6, 7, 9), we interpret that nucleation can occur by polygonization from highly misoriented subgrain boundaries and/or by bulging due to strain induced grain boundary migration (SIGBM; Humphreys and Hatherly, 2004). Neither of these nucleation mechanisms, that result from local stress field configurations, is expected to cause the resultant nucleus to be strongly misoriented from the parent grains.
In the range of strains studied here, the developing texture tends to stabilize toward a multi-maxima girdle oriented close to 35° from the compression direction (Figure 2). The experimental textures observed at all non-zero strains differ from the textures observed along ice cores, where the vertical compression takes place at low stress and low temperature (Azuma, 1994; Castelnau et al., 1996; Montagnat et al., 2012). The textures in ice cores, characterized by a single-maximum parallel to the compression direction have been attributed to deformation by dislocation slip on basal planes with no DRX mechanisms (Alley, 1988; Castelnau and Duval, 1994). Recrystallization textures are, however, observed in the bottom of deep ice cores, where the temperature approaches the melting point (de la Chapelle et al., 1998), and at isolated depths where the accumulated strain is locally elevated (Montagnat et al., 2012). These textures differ drastically from deformation textures observed in the shallower parts of ice cores and are similar to textures observed in our experiments as they show orientations clustered at 30–50° from the vertical. Few such orientations exist at shallower depth of ice cores where the textures primarily reflect the vertical compression (see for instance, Thorsteinsson et al., 1997; de la Chapelle et al., 1998; Diprinzio et al., 2005). “Oriented” nucleation has been often proposed to account for these textures which show orientations at 30–50° from the vertical. GB migration favoring “well oriented” grains could also be responsible for these natural textures.
The orientation measurements performed here evidence a multi-maxima clustering of both c- and a-axes that was not obvious in previous laboratory studies. This clustering presumably reflects the impact of DRX nucleation mechanisms described in Section 3, in relation with the impact of strain heterogeneities, on texture evolution at a local scale. Bulging and polygonization induced nucleation should result in strong correlation between nucleus and parent grain in terms of orientations. The clustering, i.e., the fact that some of these orientations strengthen with time, could result from long range strain field heterogeneities. As observed by Grennerat et al. (2012) in ice, and also in zirconium (Doumalin et al., 2003; Héripré et al., 2007) or copper (Delaire et al., 2000) for instance, strain localizes into bands whose length is close to the sample dimensions, and thus larger than the grain size. Deformation bands of high strain amplitude could be favorable sites for recrystallization. This localized recrystallization would result into the measured clustering of orientations.
In the recrystallized textures measured after about 10% strain (Figures 2, 5) there remain a few orientations with c-axes close to the compression direction and no orientation perpendicular to this direction; both orientations are highly unfavorable to dislocation slip. Deformation produced by dislocation slip on the basal plane leads to the rotation of grains toward orientations with c-axes close to the compression direction (Alley, 1988). The textures measured in this study after 10% strain would therefore result from a combination of the grain rotation due to dislocation slip (“deformation textures,” controlled by the macroscopic imposed stress), and the re-orientation of grains by nucleation and grain boundary migration, i.e., DRX mechanisms (“recrystallization textures,” more dependent on the local stress state).
Our new observations highlight the fact that both the local stress field resulting from grain incompatibilities (Lebensohn et al., 2009; Grennerat et al., 2012) and the macroscopic stress play an essential role in determining the microstructure and texture evolution during DRX of ice. The latter induces a texture macroscopically favorable to the imposed stress (with c-axis orientations close to 45° from the compression axis), and the former induces nucleation and serrated GB migration in strain localization areas, therefore resulting in crystallographic axis clustering.
Observations at both local and macroscopic scales are therefore necessary to understand the effect of DRX mechanisms on the mechanical response of polycrystalline ice. Higher resolution and 3D observations (made by Diffraction Contrast Tomography (Ludwig et al., 2008; Rolland du Roscoat et al., 2011) for instance) will be necessary to better understand the role of nucleation on the texture development during DRX of ice.
5. Conclusions
High resolution observations of texture and microstructure evolution during dynamic recrystallization were performed on ice deformed in the laboratory at high homologous temperature. Macroscopic response and texture evolution are similar to previous observations by Duval (1979), Jacka (1984), and Jacka and Maccagnan (1984). Textures evolve toward a girdle at about 35° from the compression axis, and grain size distribution stabilizes after about 7% strain.
EBSD observations of crystallographic orientations in the deformed ice samples reveal the multi-maxima character of both c- and a-axis distributions. We also observe serrations induced by spatially non uniform grain boundary migration rates resulting from strain heterogeneities at grain boundaries and triple junctions. The associated dislocation field was characterized by using the EBSD observations to estimate the Nye tensor at the same resolution. The dislocation pattern is already heterogeneous after 2% strain, and remains similar across the higher strain levels explored here.
GB migration, which has been supposed to dominate DRX at high temperature, does not appear to be sufficient to relax local strain heterogeneities in such a highly anisotropic material as ice. We therefore suggest that local dislocation substructures such as kink bands and subgrain boundaries also contribute to the relaxation of the local internal stress field. These substructures as well as bulges in grain boundaries may be nucleation precursors. Our study provides evidence that under the conditions explored in the experiments, nucleation occurs by both subgrain boundary misorientation and bulging (SIGBM nucleation). The microstructural observations also indicate that both processes are active simultaneously. However, the relative contribution of these two nucleation processes to the development of DRX textures remains unconstrained.
The microstructural and textural observations indicate that DRX mechanisms are driven by the joint effect of the macroscopic imposed stress and the local stress field induced by strain incompatibilities between grains. Both scales must therefore be examined to understand and model the effect of DRX on the mechanical response of ice polycrystals.
Conflict of Interest Statement
The authors declare that the research was conducted in the absence of any commercial or financial relationships that could be construed as a potential conflict of interest.
Acknowledgments
Many thanks to Paul Duval for long-term useful discussions and comments. Financial support by the French “Agence Nationale de la Recherche” is acknowledged (project DREAM, #ANR-13-BS09-0001-01). This work benefited from support from institutes INSIS and INSU of CNRS. It has been supported by a grant from Labex OSUG@2020 (ANR10 LABX56). The authors gratefully acknowledge support by the ESF Research Networking Programme Micro-Dynamics of Ice (MicroDIce).
References
Al-Samman, T., and Gottstein, G. (2008). Dynamic recrystallization during high temperature deformation of magnesium. Mater. Sci. Eng. 490, 411–420. doi: 10.1016/j.msea.2008.02.004
Al-Samman, T., Molodov, K. D., Molodov, D. A., Gottstein, G., and Suwas, S. (2012). Softening and dynamic recrystallization in magnesium single crystals during c-axis compression. Acta Mater. 60, 537–545. doi: 10.1016/j.actamat.2011.10.013
Alley, R. B. (1988). Fabrics in polar ice sheets - development and prediction. Science 240, 493–495. doi: 10.1126/science.240.4851.493
Alley, R. B., Gow, A. J., and Meese, D. A. (1995). Mapping c-axis fabrics to study physical processes in ice. J. Glaciol. 41, 197–203.
Ashby, M. F., and Duval, P. (1985). The creep of polycrystalline ice. Cold Reg. Sci. Technol. 11, 285–300.
Azuma, N. (1994). A flow law for anisotropic ice and its application to ice sheets. Earth Planetary Sci. Lett. 128, 601–614. doi: 10.1016/0165-232X(85)90052-7
Bachmann, F., Hielscher, R., and Schaeben, H. (2010). Texture analysis with mtex – free and open source software toolbox. Solid State Phenomena 160, 63–68. doi: 10.4028/www.scientific.net/SSP.160.63
Beausir, B., and Fressengeas, C. (2013). Disclination densities from EBSD orientation mapping. Int. J. Solids Struct. 50, 137–146. doi: 10.1016/j.ijsolstr.2012.09.016
Borthwick, V. E., Schmidt, S., Piazolo, S., and Gundlach, C. (2012). Quantification of mineral behavior in four dimensions: grain boundary and substructure dynamics in salt. Geochem. Geophys. Geosyst. 13:Q05005. doi: 10.1029/2012gc004057
Castelnau, O., and Duval, P. (1994). Simulations of anisotropy and fabric development in polar ices. Ann. Glaciol. 20, 277–282. doi: 10.3189/172756494794587384
Castelnau, O., Thorsteinsson, T., Kipfstuhl, J., Duval, P., and Canova, G. R. (1996). Modelling fabric development along the GRIP ice core, central Greenland. Ann. Glaciol. 23, 194–201.
Cuffey, K. M., and Paterson, W. S. B. (2010). The Physics of Glaciers, 4th Edn. Amsterdam: Academic.
de la Chapelle, S., Castelnau, O., Lipenkov, V., and Duval, P. (1998). Dynamic recrystallization and texture development in ice as revealed by the study of deep ice cores in Antarctica and Greenland. J. Geophys. Res. 103, 5091–5105. doi: 10.1029/97JB02621
Delaire, F., Raphanel, J. L., and Rey, C. (2000). Plastic heterogeneities of a copper multicrystal deformed in uniaxial tension: experimental study and finite element simulations. Acta Mater. 48, 1075–1087. doi: 10.1016/S1359-6454(99)00408-5
Dillien, S., Seefeldt, M., Allain, S., Bouaziz, O., and Houtte, P. V. (2010). EBSD study of the substructure development with cold deformation of dual phase steel. Mater. Sci. Eng. 527, 947–953. doi: 10.1016/j.msea.2009.09.009
Diprinzio, C. L., Wilen, L. A., Alley, R. B., Fitzpatrick, J. J., Spencer, M. K., and Gow, A. J. (2005). Fabric and texture at Siple Dome, Antarctica. J. Glaciol. 51, 281–290. doi: 10.3189/172756505781829359
Doumalin, P., Bornert, M., and Crépin, J. (2003). Characterisation of the strain distribution in heterogeneous materials. Mécanique et Industries 4, 607–617. doi: 10.1016/j.mecind.2003.09.002
Drury, M., and Humphreys, F. (1986). The development of microstructure in Al-5% Mg during high temperature deformation. Acta Metallurgica 34, 2259–2271. doi: 10.1016/0001-6160(86)90171-9
Drury, M., and Urai, J. (1990). Deformation-related recrystallization processes. Tectonophysics 172, 235–253. doi: 10.1016/0040-1951(90)90033-5
Duval, P., Ashby, M., and Anderman, I. (1983). Rate controlling processes in the creep of polycrystalline ice. J. Phys. Chem. 87, 4066–4074. doi: 10.1021/j100244a014
Duval, P., and Castelnau, O. (1995). Dynamic recrystallization of ice in polar ice sheets. J. Phys. 5, 197–205. doi: 10.1051/jp4:1995317
Duval, P., Louchet, F., Weiss, J., and Montagnat, M. (2012). On the role of long-range internal stresses on grain nucleation during dynamic discontinuous recrystallization. Mater. Sci. Eng. 546, 207–211. doi: 10.1016/j.msea.2012.03.052
El-Dasher, B. S., Adams, B. L., and Rollett, A. D. (2003). Viewpoint: experimental recovery of geometrically necessary dislocation density in polycrystals. Scr. Mater. 48, 141–145. doi: 10.1016/S1359-6462(02)00340-8
Field, D. P., Trivedi, P. B., Wright, S. I., and Kumar, M. (2005). Analysis of local orientation gradients in deformed single crystals. Ultramicroscopy 103, 33–39. doi: 10.1016/j.ultramic.2004.11.016
Gillet-Chaulet, F., Gagliardini, O., Meyssonnier, J., Zwinger, T., and Ruokolainen, J. (2006). Flow-induced anisotropy in polar ice and related ice-sheet flow modelling. J. Non-Newtonian Fluid Mech. 134, 33–43. doi: 10.1016/j.jnnfm.2005.11.005
Grennerat, F., Montagnat, M., Castelnau, O., Vacher, P., Moulinec, H., Suquet, P., et al. (2012). Experimental characterization of the intragranular strain field in columnar ice during transient creep. Acta Mater. 60, 3655–3666. doi: 10.1016/j.actamat.2012.03.025
Hamann, I., Weikusat, C., Azuma, N., and Kipfstuhl, S. (2007). Evolution of crystal microstructure during creep experiments. J. Glaciol. 53, 479–489. doi: 10.3189/002214307783258341
Heilbronner, R., and Barrett, S. (2014). Image Analysis in Earth Sciences. Berlin; Heidelberg: Springer.
Héripré, E., Dexet, M., Crépin, J., Gélébart, L., Roos, A., Bornert, M., et al. (2007). Coupling between experimental measurements and polycrystal finite element calculations for micromechanical study of metallic materials. Int. J. Plast. 23, 1512–1539. doi: 10.1016/j.ijplas.2007.01.009
Hondoh, T. (2000). “Nature and behavior of dislocations in ice,” in Physics of Ice Core Records, ed. T. Hondoh (Sapporo: Hokkaido University Press), 2–34.
Humphreys, F. (2004). Nucleation in recrystallization. Mater. Sci. Forum 467–470, 107–116. doi: 10.4028/www.scientific.net/MSF.467-470.107
Humphreys, F. J., and Hatherly, M. (2004). Recrystallization and Related Annealing Phenomena, 2nd Edn. Pergamon: Oxford.
Jacka, T. H. (1984). The time and strain required for development of minimum strain rates in ice. Cold Reg. Sci. Technol. 3, 261–268. doi: 10.1016/0165-232X(84)90057-0
Jacka, T. H., and Li, J. (1994). The steady-state crystal size of deforming ice. Ann. Glaciol. 20, 13–18. doi: 10.3189/172756494794587230
Jacka, T. H., and Maccagnan, M. (1984). Ice crystallographic and strain rate changes with strain in compression and extension. Cold Reg. Sci. Technol. 8, 269–286. doi: 10.1016/0165-232X(84)90058-2
Kacher, J., Landon, C., Adams, B. L., and Fullwood, D. (2009). Bragg's law diffraction simulations for electron backscatter diffraction analysis. Ultramicroscopy 109, 1148–1156. doi: 10.1016/j.ultramic.2009.04.007
Lebensohn, R. A., Montagnat, M., Mansuy, P., Duval, P., Meyssonnier, J., and Philip, A. (2009). Modeling viscoplastic behavior and heterogeneous intracrystalline deformation of columnar ice polycrystals. Acta Mater. 57, 1405–1415. doi: 10.1016/j.actamat.2008.10.057
Ludwig, W., Schmidt, S., Lauridsen, E. M., and Poulsen, H. F. (2008). X-ray diffraction contrast tomography: a novel technique for three-dimensional grain mapping of polycrystals. I. Direct beam case. J. Appl. Crystallogr. 41, 302–309. doi: 10.1107/S0021889808001684
Mainprice, D., Bachmann, F., Hielscher, R., and Schaeben, H. (2014). Descriptive tools for the analysis of texture projects with large datasets using MTEX: strength, symmetry and components. Geol. Soc. Lond. Spec. Publ. 409:SP409.8. doi: 10.1144/SP409.8
Mansuy, P., Meyssonnier, J., and Philip, A. (2002). Localization of deformation in polycrystalline ice: experiments and numerical simulations with a simple grain model. Comput. Mater. Sci. 25, 142–150. doi: 10.1016/S0927-0256(02)00258-6
Mansuy, P., Philip, A., and Meyssonnier, J. (2000). Identification of strain heterogeneities arising during deformation of ice. Ann. Glaciol. 30, 121–126. doi: 10.3189/172756400781820651
Mishra, S., Pant, P., Narasimhan, K., Rollett, A., and Samajdar, I. (2009). On the widths of orientation gradient zones adjacent to grain boundaries. Scr. Mater. 61, 273–276. doi: 10.1016/j.scriptamat.2009.03.062
Miura, H., Sakai, T., Mogawa, R., and Jonas, J. J. (2007). Nucleation of dynamic recrystallization at the grain boundaries of copper bicrystals. Mat. Sci. Forum 558, 457–464. doi: 10.4028/www.scientific.net/msf.558-559.457
Montagnat, M., Blackford, J. R., Piazolo, S., Arnaud, L., and Lebensohn, R. A. (2011). Measurements and full-field predictions of deformation heterogeneities in ice. Earth Planetary Sci. Lett. 305, 153–160. doi: 10.1016/j.epsl.2011.02.050
Montagnat, M., Buiron, D., Arnaud, L., Broquet, A., Schlitz, P., Jacob, R., et al. (2012). Measurements and numerical simulation of fabric evolution along the Talos Dome ice core, Antarctica. Earth Planetary Sci. Lett. 357–358, 168–178. doi: 10.1016/j.epsl.2012.09.025
Nye, J. (1953). Some geometrical relations in dislocated crystals. Acta Mater. 1, 153–162. doi: 10.1016/0001-6160(53)90054-6
Pantleon, W. (2008). Resolving the geometrically necessary dislocation content by conventional electron backscattering diffraction. Scr. Mater. 58, 994–997. doi: 10.1016/j.scriptamat.2008.01.050
Peternell, M., Russell-Head, D., and Wilson, C. (2011). A technique for recording polycrystalline structure and orientation during in situ deformation cycles of rock analogues using an automated fabric analyser. J. Microsc. 242, 181–188. doi: 10.1111/j.1365-2818.2010.03456.x
Piazolo, S., Montagnat, M., and Blackford, J. R. (2008). Sub-structure characterization of experimentally and naturally deformed ice using cryo-EBSD. J. Microsc. 230, 509–519. doi: 10.1111/j.1365-2818.2008.02014.x
Piazolo, S., Montagnat, M., Grennerat, F., Moulinec, H., and Wheeler, J. (2015). Effect of local stress heterogeneities on dislocation fields: Examples from transient creep in polycrystalline ice. Acta Mater. 90, 303–309. doi: 10.1016/j.actamat.2015.02.046
Prior, D. J., Wheeler, J., Peruzzo, L., Spiess, R., and Storey, C. (2002). Some garnet microstructures: an illustration of the potential of orientation maps and misorientation analysis in microstructural studies. J. Struct. Geol. 24, 999–1011. doi: 10.1016/S0191-8141(01)00087-6
Randle, V. (1992). Microtexture Determination and Its Applications. London: The Institute of Materials.
Rolland du Roscoat, S., King, A., Philip, A., Reischig, P., Ludwig, W., Flin, F., et al. (2011). Analysis of snow microstructure by means of x-ray diffraction contrast tomography. Adv. Eng. Mater. 13, 128–135. doi: 10.1002/adem.201000221
Russell-Head, D. S., and Wilson, C. J. L. (2001). Automated fabric analyser system for quartz and ice. J. Glaciol. 24, 117–130.
Sakai, T., Belyakov, A., Kaibyshev, R., Miura, H., and Jonas, J. J. (2014). Dynamic and post-dynamic recrystallization under hot, cold and severe plastic deformation conditions. Prog. Mater. Sci. 60, 130–207. doi: 10.1016/j.pmatsci.2013.09.002
Schulson, E. M., and Duval, P. (2009). Creep and Fracture of Ice. Cambridge: Cambridge University Press.
Thorsteinsson, T. (2002). Fabric development with nearest-neighbor interaction and dynamic recrystallization. J. Geophys. Res. 107, 1–13. doi: 10.1029/2001JB000244
Thorsteinsson, T., Kipfstuhl, J., and Miller, H. (1997). Textures and fabrics in the GRIP ice core. J. Geophys. Res. 102, 26583–26600. doi: 10.1029/97jc00161
Villert, S., Maurice, C., Wyon, C., and Fortunier, R. (2009). Accuracy assessment of elastic strain measurement by EBSD. J. Microsc. 233, 290–301. doi: 10.1111/j.1365-2818.2009.03120.x
Weikusat, I., De Winter, D. A. M., Pennock, G. M., Hayles, M., Schneijdenberg, C. T. W. M., and Drury, M. R. (2011a). Cryogenic EBSD on ice: preserving a stable surface in a low pressure SEM. J. Microsc. 242, 295–310. doi: 10.1111/j.1365-2818.2010.03471.x
Weikusat, I., Kipfstuhl, S., Faria, S. H., Azuma, N., and Miyamoto, A. (2009). Subgrain boundaries and related microstructural features in EDML (Antarctica) deep ice cores. J. Glaciol. 55, 461–472. doi: 10.3189/002214309788816614
Weikusat, I., Miyamoto, A., Faria, S. H., Kipfstuhl, S., Azuma, N., and Hondoh, T. (2011b). Subgrain boundaries in antarctic ice quantified by x-ray laue diffraction. J. Glaciol. 57, 111–120. doi: 10.3189/002214311795306628
Wheeler, J., Cross, A., Drury, M., Hough, R., Mariani, E., Piazolo, S., et al. (2011). Time-lapse misorientation maps for the analysis of electron backscatter diffraction data from evolving microstructures. Scr. Mater. 65, 600–603. doi: 10.1016/j.scriptamat.2011.06.035
Wilkinson, A. J., Meaden, G., and Dingley, D. J. (2006). High-resolution elastic strain measurement from electron backscatter diffraction patterns: new levels of sensitivity. Ultramicroscopy 106, 307–313. doi: 10.1016/j.ultramic.2005.10.001
Wusatowska-Sarnek, A., Miura, H., and Sakai, T. (2002). Nucleation and microtexture development under dynamic recrystallization of copper. Mater. Sci. Eng. 323, 177–186. doi: 10.1016/S0921-5093(01)01336-3
Keywords: dynamic recrystallization, cryo-EBSD, dislocation field, polycrystalline ice, strain heterogeneities
Citation: Montagnat M, Chauve T, Barou F, Tommasi A, Beausir B and Fressengeas C (2015) Analysis of Dynamic Recrystallization of Ice from EBSD Orientation Mapping. Front. Earth Sci. 3:81. doi: 10.3389/feart.2015.00081
Received: 21 July 2015; Accepted: 24 November 2015;
Published: 17 December 2015.
Edited by:
Felix Ng, University of Sheffield, UKReviewed by:
Evgeny Andreevich Podolskiy, Hokkaido University, JapanIlka Weikusat, Alfred-Wegener-Institut für Polar- und Meeresforschung, Germany
Copyright © 2015 Montagnat, Chauve, Barou, Tommasi, Beausir and Fressengeas. This is an open-access article distributed under the terms of the Creative Commons Attribution License (CC BY). The use, distribution or reproduction in other forums is permitted, provided the original author(s) or licensor are credited and that the original publication in this journal is cited, in accordance with accepted academic practice. No use, distribution or reproduction is permitted which does not comply with these terms.
*Correspondence: Maurine Montagnat, montagnat@lgge.obs.ujf-grenoble.fr