Influence of the Details of Topography on Weather Forecast – Evaluation of HARMONIE Experiments in the Sochi Olympics Domain over the Caucasian Mountains
 Laura Rontu
 Clemens Wastl
 Sami Niemelä
- 1Finnish Meteorological Institute, Helsinki, Finland
- 2Zentralanstalt für Meteorologie und Geodynamik, Vienna, Austria
New fine-resolution surface elevation data was implemented into HARMONIE-AROME-SURFEX Numerical Weather Prediction (NWP) system. The grid-scale mean orography, used as a basis of the model's terrain-following vertical coordinate, as well as variables for suggested new parameterizations of radiation and momentum fluxes were derived. Validation against the surface observations from the Sochi Winter Olympic Games 2014, provided by the WMO FROST-2014 program at the Caucasian mountains, showed minor degradation of the screen-level temperature forecast when only the source orography was updated. Implementation of the orographic radiation parameterizations allowed to alleviate the degradation of scores. Detailed sensitivity studies, done by using three-dimensional and single-column experiments, showed that substantial and physically realistic changes in the downweling short- and long-wave radiation fluxes took place locally. However, their influence on the the simulated screen-level temperature remained small. Comparison of the simulated and observed radiation fluxes would offer a reliable alternative for validation of NWP models. Unfortunately, surface-level radiation observations were not made during the Sochi Olympics.
1. Introduction
As the resolution of the NWP models improves toward the kilometer-scale, simulation of the local effects, in particular those related to mountains, becomes increasingly important. On the other hand, new sources of high resolution orography, such as SRTM (Shuttle Radar Topography Mission, Jarvis et al., 2008) offer possibilities to improve the description of the orography features and thus the treatment of all scales of orographic effects also in the finest-resolution NWP models. This study reports implementation and testing of a new fine-resolution orography and parameterizations of orographic effects on radiation in SURFEX, which is an externalized surface parametrization and data assimilation system for NWP and climate models (Masson et al., 2013). SURFEX is coupled to the HARMONIE-AROME forecast system (Seity et al., 2011). The suggested parameterizations have been developed earlier and applied to the operational weather forecast model HIRLAM (Undén et al., 2002).
Accounting for the variability of downweling short- and long-wave radiation fluxes due to the slopes, shadowing obstacles and limited sky view has been shown important for a correct local temperature forecast. For example, verification of the fine-resolution operational NWP models of the Austrian meteorological service has indicated systematic errors of the screen-level temperature up to 2° during the morning hours in narrow Alpine valleys when shadowing effects are not taken into account. Since the pioneering work by Kondratyev (1977), parameterizations of orographic effects on radiation have been developed for NWP and climate models by Müller and Scherer (2005), Senkova et al. (2007), Manners et al. (2012), Helbig and Löwe (2012, 2014) and applied in WRF, HIRLAM, UKMO, and COSMO models.
The location of this study was chosen over Caucasian mountains near the city of Sochi, Russia. The 2014 winter Olympic games were held in Sochi on 8–23 February 2014. As a part of the event, the World Meteorological Organization (WMO) organized both research development and forecast demonstration projects. The FROST-2014 (Forecast and Research: the Olympic Sochi Testbed) project focused in particular on the development and demonstration of modern short-term NWP and nowcasting systems over mountainous regions in winter-time conditions and on the assessment of practical use of this information. In order to do so, the project deployed several additional observation sites in the area. Temperature measurements provided by these automatic meteorological station (AMS) observations were used for comparison and validation in our study.
To understand how the choice of basic orography influences the model results, we first rerun HARMONIE Sochi Olympic forecasts using the default input data for calculation of the grid-scale surface elevation. We then replaced the default source by finer-resolution surface elevation data and compared the results of experiments which used the horizontal resolution of 1.5 km, applying the standard verification methods and using the extended observations provided by FROST-2014. Next, we implemented new orographic radiation parameterizations to HARMONIE and derived the needed orographic variables from the fine-resolution surface elevation data. Our aim was to study the overall impact of the parameterizations and to test alternative formulations related to the view of the sky. For this purpose, we performed three-dimensional and single-column model simulations during February 2014 and evaluated the results in terms of the predicted radiation fluxes and near-surface temperatures. We also compared the three-dimensional experiment results to the AMS screen-level temperature observations. The aim was to reveal the differences and also to evaluate how suitable and sufficient the available observations were for this kind of validation.
The rest of this study is organized as follows: Section 2 introduces HARMONIE NWP system and the suggested orographic radiation parameterizations. Section 3 presents the source data and preparation of orography-related variables for the model. Special attention is paid to the definition of sky view factor for the radiation parameterizations. Section 4 defines the numerical experiments and Section 5 introduces the observations and validation methods. Results of the three-dimensional and single-column experiments are presented and discussed in Section 6. Conclusions and outlook in Section 7 finish the study.
2. Models and Methods
2.1. HARMONIE-AROME-SURFEX
We focus on development and testing of orographic radiation parameterizations in the framework of HIRLAM-ALADIN Regional Mesoscale Operational NWP In Europe (HARMONIE) system. The HARMONIE NWP system combines elements from the global IFS/Arpege model (Déqué et al., 1994) with the ALADIN non-hydrostatic dynamics (Bénard et al., 2010) and physical parameterizations of AROME (Seity et al., 2011) and HIRLAM (Undén et al., 2002). Surface-related processes are treated by the externalized parametrization and data assimilation system SURFEX (Masson et al., 2013). In this study we implemented new schemes for parametrization of the orographic radiation fluxes into SURFEX, testing them in the full HARMONIE-AROME.
2.2. Parametrization of Orographic Effects on Radiation
A parametrization scheme for orographic effects on radiation (hereafter referred to as ororad) was introduced to HARMONIE-AROME following Senkova et al. (2007) (hereafter referred to as SRS7). Slope (δsl) and shadow (δsh) factors (see Section 3.2) were derived and applied to modify downweling shortwave radiation (SWD) flux at the surface level. These factors modify the direct SWD by taking into account the different slope angles and directions with respect to the current solar position and estimate the relief shadows due to the neighboring obstacles. Restricted visibility of the sky is described by the sky-view factor (δsv), which is applied to modify the diffuse SWD and downweling longwave radiation (LWD) fluxes.
An essential feature of the SRS7 approach, different from the approach by e.g., Müller and Scherer (2005) and the recent Manners et al. (2012), is the derivation of these orographic factors from the most detailed subgrid-scale surface elevation information independently of the grid-scale mean orography. In the parametrization, radiation fluxes should be averaged, not the orography. Directional slopes and their fractions as well as directional local horizon angles were defined for every NWP model gridpoint. In this way, the parameterizations become scale-independent, flexibly adapting to any NWP model domain, space and time resolution, which is important for the operational usage.
Ororad parametrization was originally developed for the synoptic-scale HIRLAM with a typical horizontal resolution of 10–20 km. Application of the methods in the kilometer-resolution HARMONIE NWP system required derivation of the needed orographic parameters from fine resolution SRTM (Shuttle Radar Topography Mission, Jarvis et al., 2008) data, see Section 3.1 for the details.
In the current HARMONIE (version 38h1), the default atmospheric radiation scheme is based on the radiative transfer code in the Integrated Forecast System (IFS cycle 25R1, European Centre for Medium-Range Weather Forecast implementation in 2002), see ECMWF (2012) and Mascart and Bougeault (2011). An alternative radiation scheme originates in ALADIN, Mašek et al. (2015). The radiation scheme of HIRLAM, based on Savijärvi (1990), see also Nielsen et al. (2014), is available for experimentation. The suggested ororad parameterizations are applicable for preparation of the downweling solar and terrestrial radiation fluxes for SURFEX independently of the atmospheric radiation scheme. Without loss of generality, we limit the testing of ororad to the case of IFS scheme.
3. Orography Data and Model Variables
3.1. Fine Resolution Data on Surface Elevation
Grid-scale and subgrid-scale orography variables for the new 1.5-km resolution experiments were derived from 3-arc-second resolution Shuttle Radar Topography Mission surface elevation data (SRTM 3″, Jarvis et al., 2008). In our experiments, surface elevation from SRTM 3″ replaced that from GTOPO30 (USGS, 1998), used by default in SURFEX. The horizontal resolution of 3″ corresponds to ca. 90 m at the Equator, while one GTOPO30 pixel represents a size of ca. 900 m. Figure 1 illustrates different resolution grids in the surroundings of the highest peak of Europe Mt. Elbrus (43.355 N, 42.439 E, 5642 m), located on the Caucasian mountains, in a rectangle of ~15 km width, laid over a map based on Google Earth (Wikipedia, 2012). The rectangle would represent a typical resolution of a synoptic scale NWP model with only one gridbox over the area in Figure 1A. Figure 1B shows 1 km resolution, corresponding e.g., the GTOPO30 data or the finest resolution Olympic HARMONIE grid. Figures 1C,D represent roughly the resolutions of the Global Multi-resolution Terrain Elevation 7.5-arc-second data (GMTED2010, USGS (2010)) and SRTM 3″ data, respectively. GTOPO30, SRTM and GMTED2010 are all used as fine-resolution source data for derivation of surface-elevation dependent variables in various NWP models. GTOPO30 would provide a synoptic-scale model with more than two hundred pixels for calculation of subgrid-scale statistics within each gridcell. SRTM 3″ resolution is needed to acquire the same amount of source pixels for our 1.5-km resolution experiments.
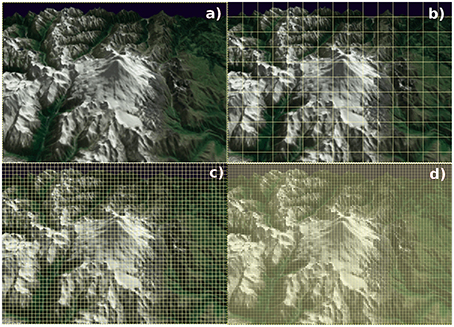
Figure 1. Schematic illustration of grids of different resolutions laid over a Mt. Elbrus map: (A) 15 km, (B) 1 km, (C) 250 m, (D) 100 m.
3.2. Orography Variables in the Model Grid
Mean surface elevation for the forecast model and data assimilation as well as various subgrid-scale orography parameters for radiation and momentum flux parameterizations (Table 1) were derived from the fine-resolution source orography (Section 3.1) for a Lambert conical conformal projection grid with horizontal resolutions from 1 to 2.5 km. Calculations were done within the SURFEX framework by using its physiography definition (PGD) subroutines.
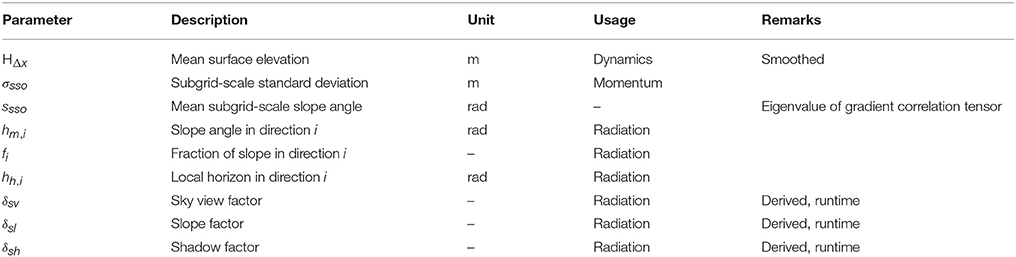
Table 1. Orography-related parameters within grid resolution.
The difference between the average surface elevation HΔx derived from GTOPO30 and SRTM 3″ for the 1.5-km resolution experiments is shown in Figure 2. The local differences vary from −386 to +453 m, but the average difference is small, +3 m. The maximum grid-average surface elevation over the area was 5040 or 5050 m, in both cases about 600 m lower than the top of Mt.Elbrus according the fine-resolution SRTM 3″ estimate. As calculated from SRTM 3″ to the 1.5 km grid, the mean σsso over the land area of the Caucasian domain was 44 m, with maxima of 350 m (not shown). The corresponding values based on GTOPO30 were 33 and 482 m. Due to the coarse resolution of the GTOPO30 data with respect to the chosen model grid, σsso values look somewhat random (see also Table 3 for selected locations). The standard deviation over each gridpoint area was based only on ca. 5 GTOPO30 elevation values.
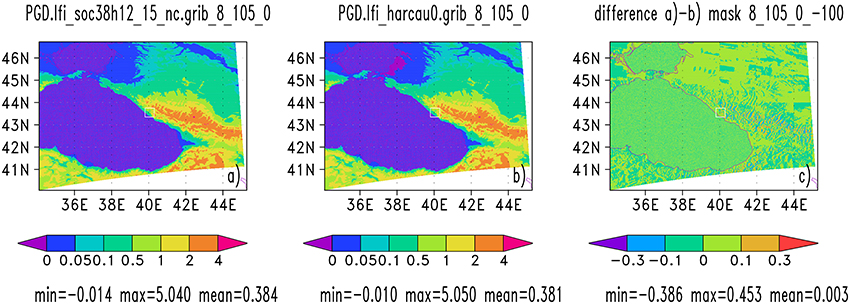
Figure 2. Average grid-scale elevation (km) for experiments with 1500 m resolution, based on (A) GTOPO30 and (B) SRTM 3″ data, (C) their difference. Color scales are given in the legend. The small white box indicates the location of Olympic venue, see Figure 5 for detailed orography contours there.
Preprocessing of the SRTM 3″ surface elevation data was necessary for derivation of the constant-in-time variables for orographic radiation parameterizations (For the operational NWP, this preprocessing will be replaced by processing within the SURFEX PGD system - Alexandre Mary, personal communication). Preprocessing was done in the SRTM 3″ latitude-longitude grid. Slope angle and direction were calculated by using Geospatial Data Abstraction Library software (GDAL, 2014). Treatment of the local horizon and sky view was modified as compared to the original SRS7 method, and is documented in the next section.
3.3. Local Horizon and Sky View
Following the method suggested by SRS7, the local horizon angle hh, i, defined as a height angle from the surface, was estimated at each SRTM 3″ gridpoint from the difference between the surface elevation at the point and its 50 neighbors (i.e., within a distance < 5 km) in each 1° sector. These 1° hh, i values were averaged over eight directional sectors, each representing 45° centered at N, NE, E, SE, S, SW, W, NW directions.
Originally, the elevation differences within each 1° sector around a central point were weighted according to the squared distance from the center and a mean value obtained. Based on comparison of observed and calculated local horizon angles around several Alpine stations, we omitted the weighting and used instead the maximum local horizon angle. For example, the Alpine station St. Leonhard/Pitztal (47.027 N, 10.865 E) lies in a very narrow south-north oriented valley in Tyrol, Western Austria, and suffers from significant shadowing by surrounding mountains. Figure 3 shows a comparison between the observed horizon and the two different methods for calculation of the local horizon angle. The blue dots, which refer to the updated method, are clearly closer to the observations than the red dots, which refer to the weighted angles as suggested by SRS7. The result shown in Figure 3 represents the local horizon at the station location on the SRTM 3″ grid.
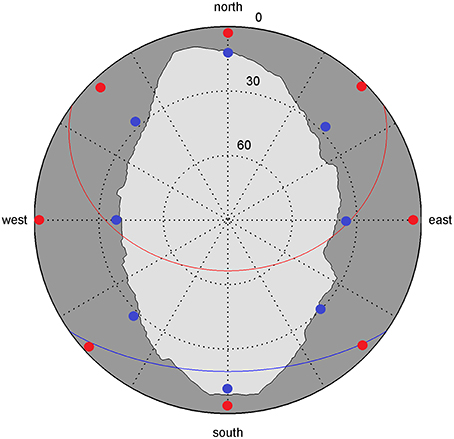
Figure 3. Observed horizon (gray shaded area) and calculated local horizon angles (blue dots: without weighting, red dots: weighted) around the Alpine station St. Leonhard/Pitztal, Austria. Red and blue lines show the path of the sun at the winter (blue) and summer (red) solstice.
The sky view factor δsv was calculated by averaging the local horizon angle over all directions (360°). A definition of δsv as the average of 1 − sin(hh, i) was suggested by Müller and Scherer (2005) and applied by SRS7. Following SRS7, we calculated δsv at each fine resolution source grid point during the preprocessing. A different approach for calculation of the sky factor was suggested by Manners et al. (2012), based on Helbig et al. (2009). Manners et al. (2012) derived and applied an equation in the NWP model grid (their Equation 14, see also their Figure 5; note that their horizon angle is defined from zenith toward the obstacles). The aim was to approximate the proportion of radiant flux from the visible sky falling on the inclined surface as a fraction of the flux that would have been received from an unobstructed hemisphere.
We tested the Manners et al. (2012) formulation but adapted the method to the subgrid-scale statistical approach by SRS7. A modified was obtained by summation of the sectorial mean hh, i values during the aggregation of the values to the NWP grid. The mean directional slope hm, i in each of the eight directional sectors and the directional fraction of the slopes fi in each model gridsquare were taken into account:
Here we assumed implicitly that it is sufficient to account for the local horizon hh, i in the same direction where a portion fi of the slopes hm, i is facing to. Including scaling with the slope cos(hm, i) when calculating allowed to avoid scaling by the ambiguous grid-average slope during the actual forecast run. (However, usage of during runtime leads to a slight inconsistency in calculation of a second-order term related to the reflection of shortwave radiation by the surrounding terrain.) The modified was calculated by using the SURFEX PGD tools during the aggregation, while the original δsv was obtained in the fine-resolution SRTM 3″ grid and only averaged during aggregation. By modifying Equation (1) further, it is possible to apply it also to approximation of δsv as an average of the sectorial 1 − sin(hh, i) values suggested by SRS7. There exist even more possible ways to approximate the sky view factor at the source level, during aggregation or in the model grid, all based on the local horizon angle calculated in the source grid.
We compared four approximations, which led to somewhat different grid-scale sky-view factor values. As illustrated by Figure 4, the overall distributions of δsv, estimated by the different methods, look fairly similar, but the minimum values and local features can be significantly different. The maps represent the Sochi Olympic venue in the model grid of 1.5-km resolution (area shown in Figure 5). The area-mean of based on Equation (1) over the Olympic venue was the smallest, 0.87 (87%; Figure 4C), while the values for the SRTM-level (Figure 4B) and aggregation-level (Figure 4D) SRS7 δsv were 0.90 and 0.91, correspondingly. These numbers can be compared to the evidently overestimated average δsv = 0.98, derived from the original weighted hh, i (Figure 4A). Over the flat areas, the sky view factor is defined to be unity (100%), and all values were included in the calculation of the area means. Spatial correlations of δsv were 0.88 between the SRTM-level SRS7 and Equation (1), 0.92 between the aggregation-level SRS7 and Equation (1), 0.91 between the SRTM-level and aggregation-level SRS7. The influence of the δsv differences in the parameterized long-wave and diffuse short-wave radiation fluxes will be discussed in Section 6.
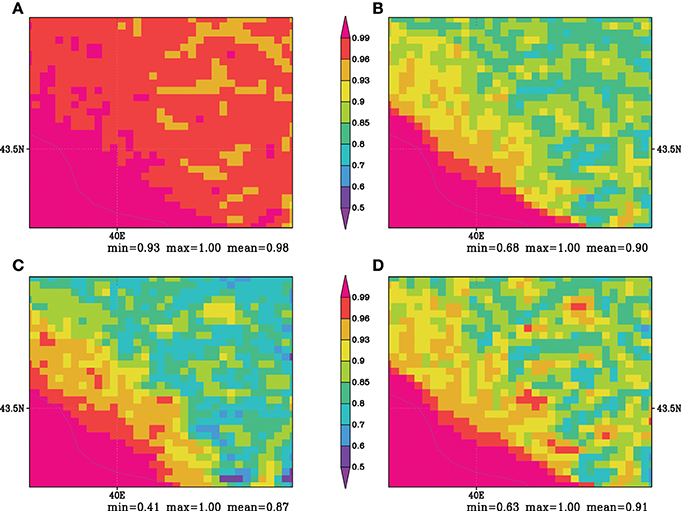
Figure 4. Sky view factor δsv (fraction from 0 to 1 shown by the color scale) zoomed to the Olympic venue: (A) based on local horizon angle obtained with the distance-dependent weighting, (B) STRM-level estimate without weighting of the horizon angle, (C) estimated from Equation (1), (D) aggregation-level estimate according to SRS7 definition. The approximate coastline is indicated in the lower left part of the figures, latitude 43.5N and longitude 40E are marked into the maps.
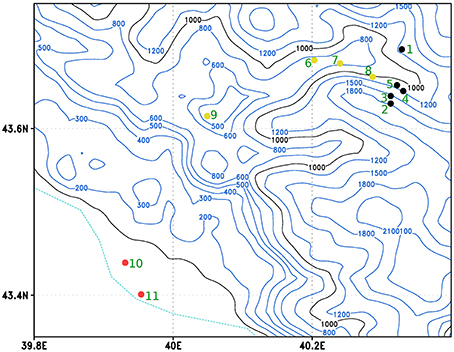
Figure 5. Location of the observation sites. Mountain, valley, and coastal stations are marked with black, yellow, and red dots, respectively. Green numbers refer to the list of stations in Table 3. The contours represent average orographic height (meters) in Harmonie model with 1.5 km grid size, based on SRTM 3″ data. Dashed cyan line on the lower left denotes coastline.
4. Definition of HARMONIE Experiments
Two series of three-dimensional HARMONIE experiments were designed (Table 2) for the purpose of examining the influence of different parameterizations and the introduction of the SRTM 3″-based surface elevation. For the reference, the series of Olympic experiments (soc38h12) was set up similar to the real-time forecast applied by the Finnish Meteorological Institute during the Sochi Olympic games 2014. Here, three different model domains with the horizontal resolution of 2500, 1500, and 1000 m and 65 levels in vertical (65L) were defined over a Caucasian–Black Sea domain, shown by the full area of Figure 2 for the main 1500 m experiments. As the number of gridpoints was kept constant (640 × 500), the domain covered by the 2500 m (1000 m)-resolution experiment was larger (smaller) than this. Above the surface, the lowest model level was centered at the elevation of ca. 14 m. GTOPO30 (USGS, 1998) 30″ resolution data set was used as a source for surface elevation in all control experiments. No orography-related parameterizations for radiation or momentum fluxes were applied. A multilayer parametrization for the natural and urban canopy (so-called CANOPY scheme, Masson and Seity, 2009) was applied for treatment of the turbulent momentum fluxes in all but one of the reference experiments.
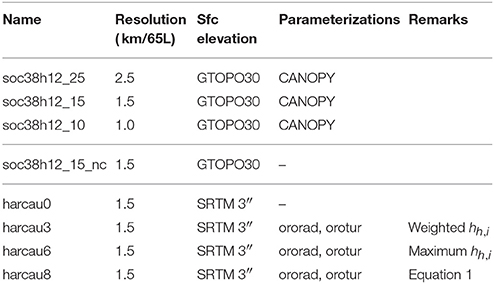
Table 2. Three-dimensional HARMONIE experiments.
The second series of experiments (harcau) was designed to test the orographic parameterizations. These experiments were defined using 1500 m/65L resolution and based on the SRTM 3″ surface elevation data. A control experiment harcau0 introduced the SRTM 3″ elevation for calculation of the grid-scale mean orography and its variance only, without application of the orography-related parameterizations. This experiment is comparable to the Olympic experiment soc38h12_15_nc, because the only difference between them is the source of the fine resolution orography.
Preliminary experiments were run separately with orographic parameterizations only for radiation and only for momentum fluxes. They showed that the two parameterizations in practice acted independently, i.e., the radiation parameterizations did not influence wind and momentum fluxes and the (weak) momentum flux parameterizations did not influence the temperature and radiation fluxes. Consequently, experiments harcau3, harcau6, and harcau8 were defined, containing both parameterizations and only differing with respect to the calculation of local horizon angle and sky view factor (see Section 3.2). Further we will focus on the evaluation of the radiation parameterizations.
In all experiments, HARMONIE version 38h1.2 was applied with assimilation of near-surface (SYNOP) observations only. Horizontal boundary data were obtained from European Centre for Medium Range Weather Forecasts (ECMWF). Boundary data was used also as the initial state for the atmospheric variables. Default options for fine-scale dynamics and physical parameterizations were used, except those described above. The analysis-forecast cycles with forecast lead time up to +27 h were initiated at 00, 06, 12, and 18 UTC for February 2014.
5. Diagnostics and Validation
5.1. Observations
The Sochi Olympic area was located on the eastern coast of the Black Sea. The events took place in two specific areas, in the coastal and mountain clusters. The coastal cluster hosted indoor sports, whereas all the weather-dependent events, such as ski jumping, cross-country, and alpine skiing, took place in the mountain cluster. Therefore, most of the new observations were deployed in the mountain cluster. The distance from the mountain cluster to the coast of Black sea was about 40 km along the road following a 3–6 km wide valley, surrounded by high mountains peaking ~2000–2500 m from the sea surface.
The main village in the mountain cluster was Krasnaya Polyana, which is located in the valley about 550 m above the sea surface. The sport events were organized in a close vicinity at the nearby mountains on both sides of the valley. The ski stadium, alpine skiing and ski jumping venues were at the heights of 1400, 2200, and 600 m above the sea surface, respectively. An official WMO SYNOP weather station (37107) provides regular near-surface weather observations in Krasnaya Polyana together with the coastal Adler station (37171). All sporting venues were equipped with several AMS measuring basic meteorological variables such as the screen-level temperature and relative humidity and anemometer-level wind speed/direction.
The placement of the AMS observations allowed estimation of the temperature differences between the northern and southern side of the valley and within the valley itself. However, radiation measurements were not made and are not, to our knowledge, available elsewhere over the Caucasian mountains. Table 3 summarizes the observations used in this study. The dataset was divided into three categories based on the geographical location: mountain, valley and coastal stations. Figure 5 shows the location of the stations. Most of the mountain stations were located in the southern side of the valley (north-facing slope), whereas one station (39043) was located on a south-facing slope. All valley stations were distributed along the valley from the mountain cluster to the coast of Black Sea. Note that in some cases, the elevation of the station differs significantly from the 1.5-km resolution grid-average model surface elevation because of the unresolved orography features.
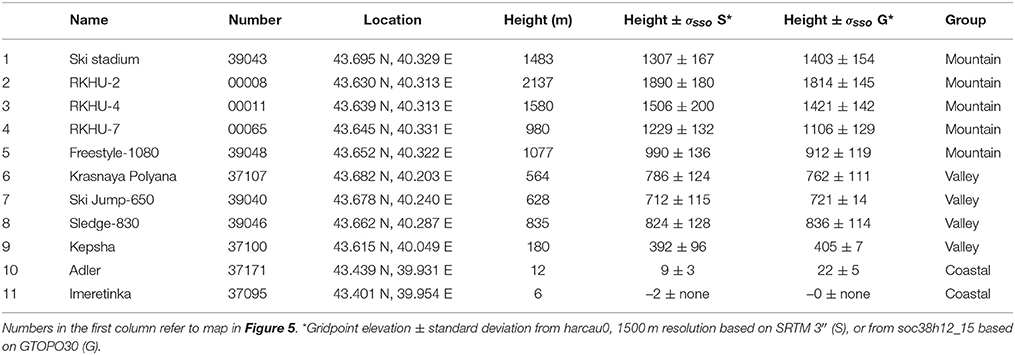
Table 3. Summary of the observation sites used in the study.
5.2. HARMONIE Station Verification
The two series of experiments (Table 2) were first validated using the HARMONIE standard station verification system and the Olympic surface-based observations (Section 5.1). In HARMONIE station verification, values from the closest gridpoints are bilinearly interpolated to station locations. For the screen-level temperature, it is also possible to take into account in the verification the difference between the grid-scale mean elevation and the elevation reported by each station by assuming moist adiabatic lapse rate between these levels. This is only a rough estimate. Interpolations of the temperature and surface elevation as well as the height adjustment depend on the grid-scale mean surface elevation and on the model's horizontal and vertical resolution, which brings some ambiguity to the validation process over the complex topography. Validation over the Olympic venue was done separately for the mountain, valley and coastal clusters during February 2014. In addition, the experiments were validated against all SYNOP station measurements available over the whole Caucasian model domain (39–51 measurements, depending on the observed variable and time of the day). We will focus on the screen-level temperature and mention also the 10-m wind verification (Section 6.1).
5.3. Intercomparison of Model Variables at Selected Locations
To see more local details of the radiation fluxes and temperatures, values of selected predicted model variables were picked from +6-h forecasts of the SRTM 3″-based experiments at the observation locations (Table 3). Results will be presented in Section 6.2. Every day, all four forecasts initialized at 00, 06, 12, and 18 UTC were included. The nearest gridpoint values were selected without interpolation to observation locations in order to minimize uncertainties related to interpolation over the complex topography. Screen-level temperatures with hourly interval were available for comparison. For the other variables like radiation fluxes and surface temperature, the different experiments were intercompared without observations.
5.4. Sensitivity Experiments with the Single-Column Model
MUSC, the single column version of HARMONIE, based on Malardel et al. (2006), was used for testing of sensitivity of the predicted radiation fluxes and the near-surface temperature to the ororad parameterizations. The atmospheric profiles, near-surface initial data and the surface properties for MUSC experiments were selected from the three-dimensional experiments for chosen locations and short experiments run up to 1 day. A vertical resolution of 65 pressure-based hybrid coordinate levels was used, corresponding to that in the full model.
The single-column model offers a tool to analyze the behavior of the full three-dimensional experiments in a controllable environment. In the single-column framework, any of the orographic variables (see Section 3.2) can be modified for a selected location. Different formulations of the physical parameterizations can be tested. However, the single-column experiment results are not directly comparable with observations, mainly because the model three-dimensional dynamics is not included in the setup. In the present experiments, the atmospheric initial state was kept unchanged during the single-column runs but the surface state was updated by the surface-related parameterizations. These experiments were performed in order to understand the interactions in the model and roughly estimate the effects caused either by the different surface properties or by modifications of the physical parameterizations.
6. Results and Discussion
6.1. Validation of Screen-Level Temperature and Anemometer-Level Wind against SYNOP Observations
The first validations of the real-time Olympic HARMONIE forecasts revealed a problem of nighttime screen-level temperatures: in some situations they were strongly underestimated (Niemelä et al., 2014). The finest-resolution experiments seemed to suffer from this problem most. This can be clearly seen also in the verification time-series which compare the reference Olympic experiments, run for the present study, with the observations of the mountain cluster during the first week of February 2014 (Figure 6). This figure even indicates the reason and solution of the problem as one of the reference experiments, the one without the surface sublayer (CANOPY) parameterizations, compares to the observations clearly better than the others. It was found that the scheme, which treats turbulence in the surface layer based on Masson and Seity (2009), may in clear and calm nights result in decoupling of the atmosphere from the surface. Hence, in the second series of experiments used for testing the fine-resolution surface orography and the proposed orographic parameterizations, the surface sublayer scheme was excluded. A similar comparison of the time-series by these experiments (not shown) confirms that this particular temperature problem was solved in all of them.
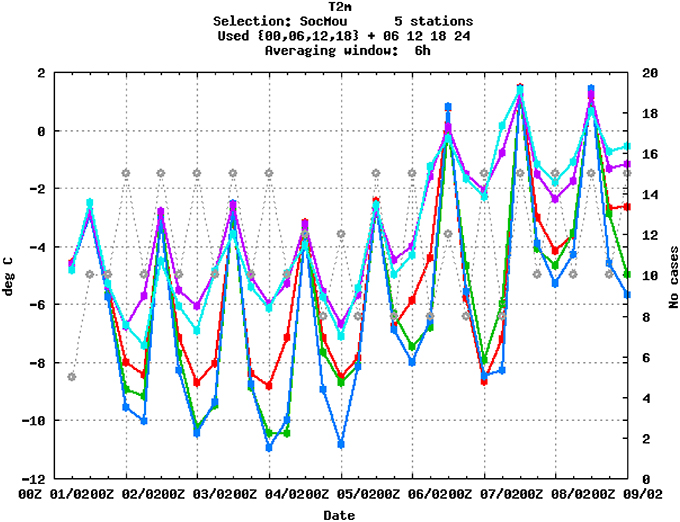
Figure 6. Comparison of screen-level temperatures over the Olympic mountain cluster stations during the first week of February 2014: observed (light blue), the reference Olympic experiments with 2500 m (red), 1500 m (green), 1000 m (dark blue) resolution and 1500 m without surface sublayer scheme (violet). Number of cases (model-observation pairs) used for validation are shown with gray dots.
All HARMONIE experiments of the second series, which relied on SRTM 3″ source orography and used 1500 m resolution, showed a negative bias of T2m especially during day. Experiment soc38h12_15_nc, based on GTOPO30 source orography, showed the smallest bias of (height-adjusted) T2m. In verification against all Sochi AMS observations, the experiment harcau0 showed 0.3–0.4° larger bias than soc38h12_15_n. The corresponding difference was 0.1–0.2° when validated against the regular SYNOP station observations over the whole Caucasian domain in February 2014. The verification result of the height-adjusted T2m is illustrated for the Olympic valley cluster by Figure 7. The experiments harcau3 (not shown), harcau6 and harcau8, which included orographic parameterizations, were consistently but very little better than harcau0.
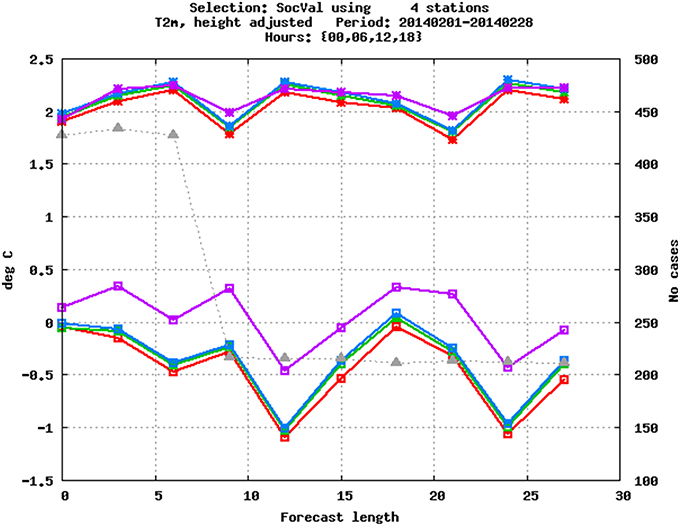
Figure 7. Standard deviation (upper curves) and bias (lower curves) of the height-adjusted screen-level temperatures T2m as a function of forecast length (hours) against observations of the Olympic valley stations during February 2014: harcau0 (red), harcau6 (green), harcau8 (dark blue), soc38h12_15_nc (violet), number of cases (gray triangles).
In the valley, the height adjustment only influenced the magnitude of the screen-level temperature bias but not the relations between the experiments. In the mountain cluster, the adjustment increased the negative bias of soc38h12_15_nc T2m to the same level (ca. −1° for all forecast lead times) as that of the harcau experiments. All the valley stations were located somewhat lower than indicated by the mean elevation of the corresponding gridpoint, based on both SRTM 3″ and GTOPO30. The situation was the opposite in the mountain cluster where only one station lay lower in the model than in the nature (Table 3). This is because the orography details were not fully resolved even within the 1500 m model resolution. We will continue analysing the differences in Section 6.2.
Wind observations over the Olympic venue and also over the whole Caucasian experiment domain indicated weak winds during February 2014. In particular, the Olympic observations often reported zero winds, which are never predicted by the model. In these conditions, wind speeds were overestimated by the model as compared to the observations, typically up to 1 m/s over the whole Caucasian area and by 0.5–1 m/s over the Olympic mountain and valley clusters (not shown). Orographic momentum flux parameterizations led to a slight decrease of this positive bias as compared to the default setup where these were not applied. Nevertheless, the Olympic wind speed observations, set up to serve the Olympic competitions, were found insufficiently representative for the validation of orographic parameterizations and will not be discussed further in this study.
6.2. Comparison of Three-Dimensional Model Experiments
Monthly mean values of predicted downweling shortwave radiation (SWD = global radiation, i.e., the sum of direct and diffuse components) and longwave (LWD) radiation fluxes with and without (experiments harcau6 and harcau0) ororad parameterizations are shown in Figure 8. The average fluxes were calculated from +24 h forecasts starting at 00 UTC. Differences up to ± 50 Wm−2 of SWD can be found around the mountain ridge in the NW part of the Olympic venue while the average difference harcau6 − harcau0 was only −2 Wm−2. The local differences in LWD were smaller, between −3 and 20 Wm−2 but the area-averaged LWD of harcau6 was by 8 Wm−2 larger than that of harcau0. The monthly mean SWD fluxes were typically less than half of the LWD fluxes, about 120 vs. 260 Wm−2. Length of day from sunrise to sunset in February in this location is ~10 h. February 2014 was predominantly cloud-free over the Olympic venue.
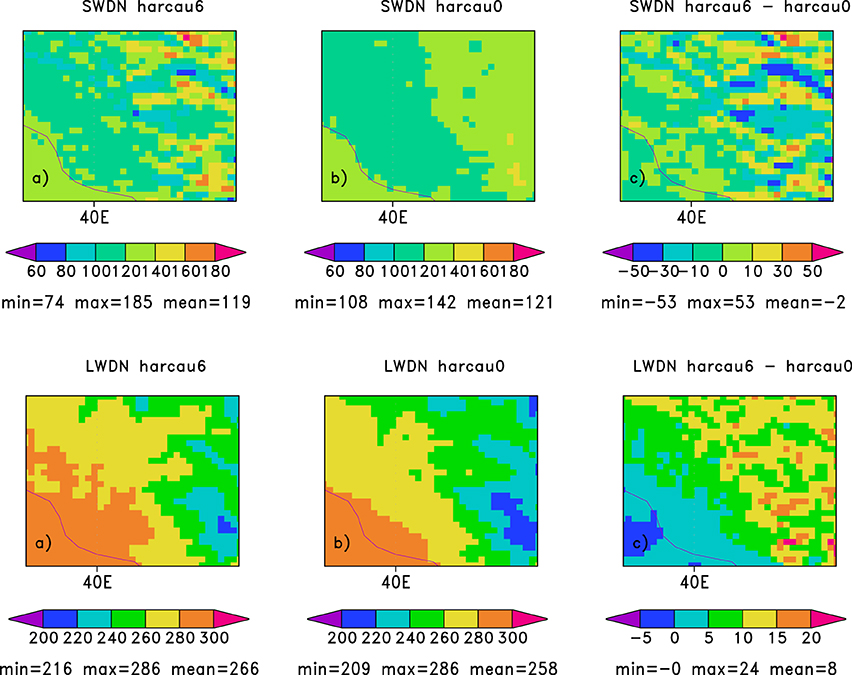
Figure 8. Monthly average SWD (upper panel) and LWD (lower panel), unit: Wm−2, based on accumulated fluxes from 00 UTC + 24 h forecasts 1–28 February 2014 with and without ororad parameterizations: (A) harcau6, (B) harcau0, and (C) their difference, map zoomed to the Olympic venue area. Color scales are shown in the figures. See Table 2 for the experiment definitions and Figure 5 for the surface elevation contour map of the Olympic venue area.
Downweling radiation fluxes influence the surface energy budget over different surface types, from which the grid-average surface (skin) temperature Ts is calculated by SURFEX. Thus, Ts should show the impact of the radiation parameterizations, although it is not directly comparable to available observations (because only T2m was observed). Figure 9 shows the difference between harcau6 and harcau0 in terms of the monthly-mean nighttime and daytime land surface temperatures, based on +24 h forecasts starting at 00 and 12 UTC, respectively. The difference between the colder northern and warmer southern slopes shows up when comparing the daytime Ts values. The maximum differences varied from −3 to +2° in NW part of the venue, where also the maximum differences in SWD fluxes were seen. The average Ts at 12 UTC over the Olympic venue area was 0.3° larger in harcau6 than in harcau0.
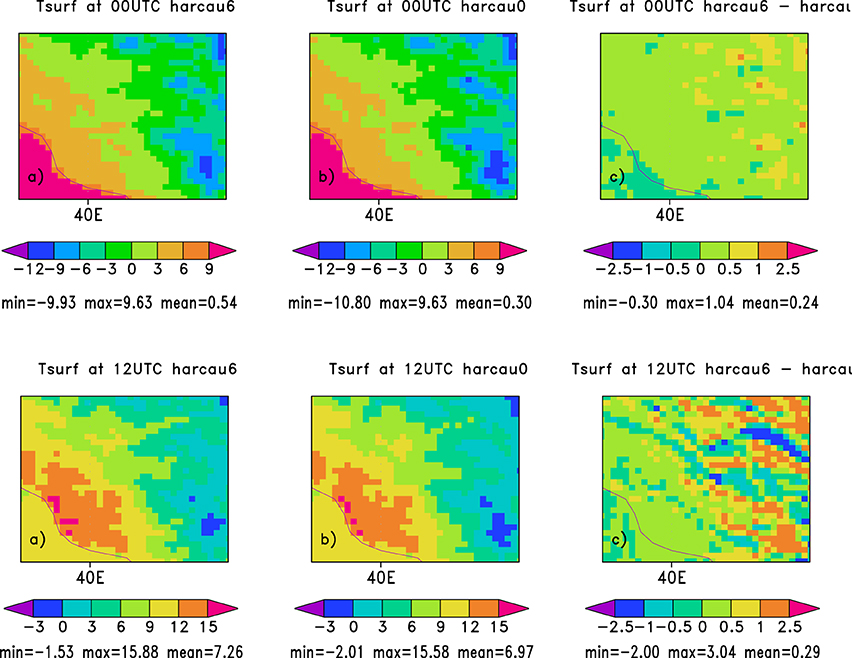
Figure 9. Monthly average nighttime (upper panel) and daytime Ts (lower panel), unit: °C as given by the 00 UTC + 24 h (night) and 12 UTC + 24 h (day) forecasts, otherwise as for Figure 8.
During night, the experiment harcau6 with ororad parameterizations showed up to 1° warmer surface temperatures in valleys with limited sky view (see distribution of δsv in Figure 4) and corresponding larger LWD flux (Figure 8), as compared to the reference experiment harcau0. The average Ts at 00 UTC over the Olympic venue was 0.2° higher in harcau6 than in harcau0. The corresponding maximum difference of Ts at 00 UTC between the experiments harcau8 and harcau6, that used different approximations for calculation of δsv, was also 1°, and on the average harcau8 was < 0.1° warmer than harcau6 (not shown). This difference was due to the smaller mean sky view factor in harcau8 (0.87) compared to harcau6 (0.90; see Section 3.3).
The systematic increase of the area mean daytime and nighttime Ts in harcau6 and harcau8 compared to harcau0 might be interpreted to be mainly due to the systematic increase of LWD as the average SWD change was small. During daytime, the surface temperature differences between harcau3 and harcau0 were similar to the difference between harcau6 and harcau0 but clearly smaller during night (not shown) because of the open sky views in harcau3, where the average δsv was 0.98.
In HARMONIE, the screen-level temperature T2m, which was verified against observations in Section 6.1, is diagnosed from the lowest model layer temperature Tnlev (at ca. 14 m according to the 65 level configuration of the present experiments) and from the surface temperature Ts by applying interpolation which takes into account the surface layer stability. Thus, T2m is not a direct prognostic variable in the model. The lowest model level temperature Tnlev depends mainly on the large-scale atmospheric flow, and is less influenced by the local conditions. The observed T2m showed more local variability and typically clearly higher maximum values than any of the HARMONIE experiments. This underestimation of the daytime screen-level temperature led to the negative bias shown by the station verification (Section 6.1). With the radiation parameterizations, we were able to influence Ts typically < ± 1°. The impact of the parameterizations to the T2m values was much smaller, on average +0.1° and varying from −0.6 to +0.6°.
For examination of the local effects, the diurnal cycles of radiation fluxes, screen-level and surface temperatures were depicted at two Olympic stations, 37107 and 00011, based on +6 h forecasts by the experiments harcau0, harcau3, harcau6, harcau8, and soc38h12_15_nc (Figures 10, 11). At the former location, the gridpoint nearest to the Krasnaya Polyana valley station, 90% of the slopes looked southward while at the latter the northern slopes prevail so that no SE-S-SW-looking slopes were present in the gridpoint around this station. Local shadowing obstacles were found mostly east from 00011. The sky view factor was 0.85/0.92/0.98 for the location of 37107 and 0.90/0.86/0.98 for 00011 in the experiments harcau6/harcau8/harcau3, correspondingly.
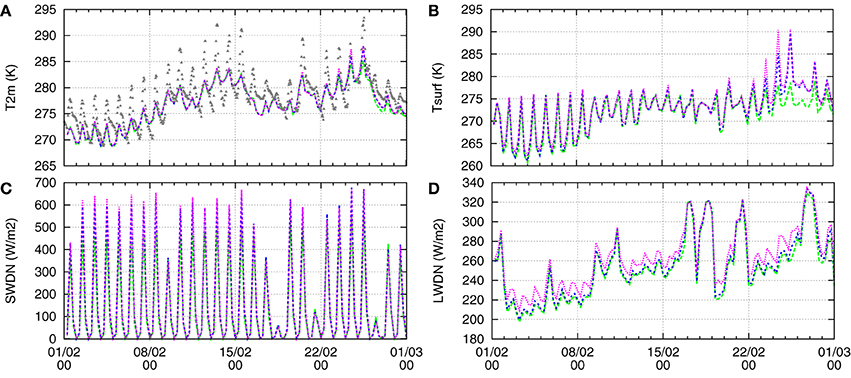
Figure 10. (A) Predicted (lines) and hourly observed (gray triangles) T2m and (B) Ts (temperature units: K); (C) 6-h average global SWD and (D) 6-h average LWD radiation flux (radiation flux units: Wm−2), picked from + 6 h forecasts by harcau0 (green), harcau3 (blue), and harcau6 (magenta) starting at 00, 06, 12, and 18 UTC in February 2014 at Olympic valley station Krasnaya Polyana (37107, Table 3).
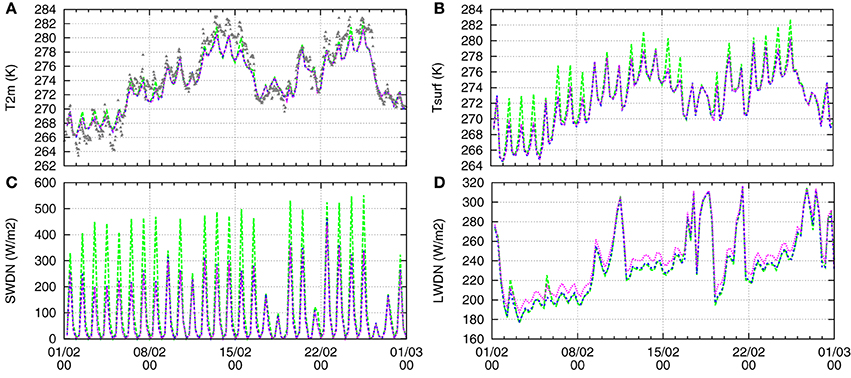
Figure 11. As in Figure 10 but at Olympic mountain station 11. Note the different scales on y-axes.
At these two stations, all experiments with and without the orographic parameterizations underestimated the maximum daytime screen-level temperature T2m up to several degrees as compared to the hourly observations. This was true especially at 37107, which is located deeper in a valley than indicated by the mean gridpoint elevation around it. The minimum T2m was typically somewhat higher than observed (Figures 10A, 11A). The maximum Ts at the northward-looking station 00011 (Figure 11B) was typically 0.5–1° higher in the reference experiment harcau0 than in the ororad experiments harcau6 and harcau3, while it was slightly lower at 37107 (Figure 10B). The difference between experiments in the minimum (nighttime) Ts values was small, harcau0 showing the coldest values. The lowest model level temperatures Tnlev were practically the same for all experiments except the Olympic reference soc38h12_15_nc, based on GTOPO30 surface elevation, where the values tended to be slightly higher, corresponding to the somewhat higher Ts and T2m in this experiment (not shown).
Corresponding global SWD radiation fluxes are shown in Figures 10C, 11C. During mostly clear days, the maximum direct SWD flux was typically up to one hundred Wm−2 larger at 37107 and up to two hundred Wm−2 smaller at 00011 in harcau6, harcau3 and harcau8 as compared to harcau0. The difference was due to the direct radiation (not shown). This may explain the differences in maximum Ts values between the harcau experiments with and without ororad parameterizations. During the few mostly cloudy days, SWD fluxes differed less between these experiments.
LWD (Figures 10D, 11D) was smaller in the reference harcau0 than in the ororad experiments. However, the difference was smaller than in the the case of SWD, typically around 10 Wm−2. The differences between harcau6, harcau3, and harcau8 (harcau8 not shown), which were related to calculation of the local horizon and sky view factor, showed up mostly in LWD fluxes which increased with decreasing δsv. The diffuse SWD and thus the global downweling SWD decreased slightly with decreasing δsv. The fluxes by harcau3 were close to those by harcau0, while those by harcau8 were slightly larger (smaller) for 00011 (37107) compared to harcau6.
6.3. Single-Column Sensitivity Studies
When solar angles are low in winter, orography may significantly influence SWD fluxes not only in the morning and evening but also during the day, as indicated by the previous figures. In order to study in detail the behavior of the slope, shadow and sky view factors (Section 3.2) and ororad parameterizations (Section 2.2), we chose atmospheric profiles from the harcau6 experiment on the 8th February 00 UTC + 6 h to be used as initial state for +24 h MUSC experiments. Surface temperatures given by different experiments are compared in Figure 12 for the same stations as in Figures 10, 11. MUSC experiments were run with all, none or partial ororad parameterizations using δsv, δsl, and δsh derived from the SRTM 3″ source data for the gridpoints closest to these stations.
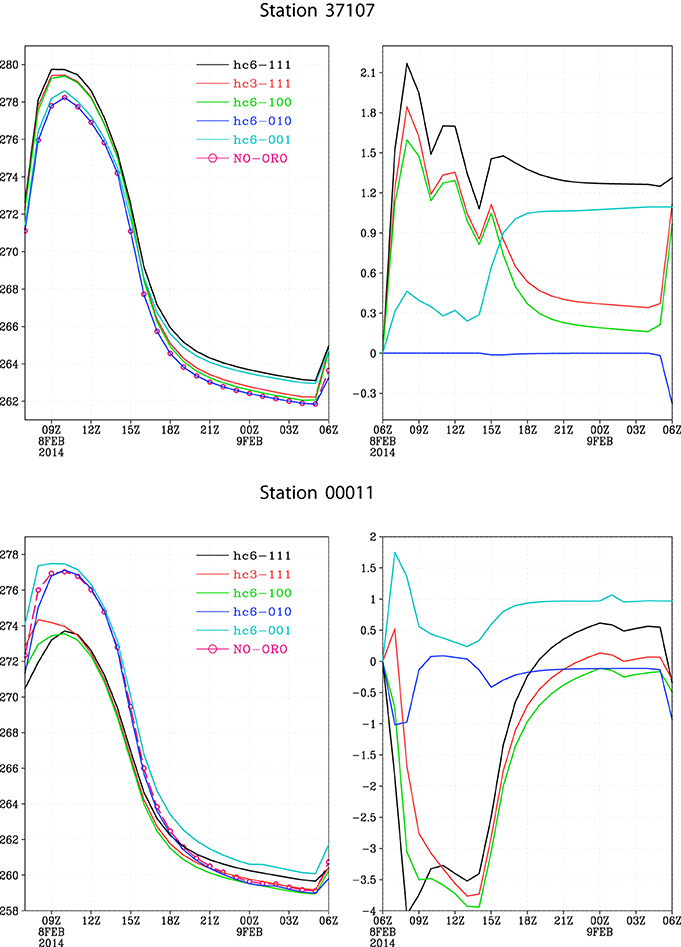
Figure 12. Surface temperature Ts (K, y-axis) as a function of time (x-axis) for the stations 37107 (upper panel) and 00011 (lower panel) from MUSC experiments initiated at 06 UTC the 8th of February 2014. Values on the left, difference from the reference (no ororad) on the right. Experiment name is given in the legend as experiment-ororad: hc6, ororad variables from harcau6; hc3, ororad variables from harcau3; 000, no ororad; 111, all ororad; 100, slope effect only; 010, shadow effect only; 001, sky view effect only.
It is evident from Figure 12 that the minimum Ts was unrealistically low as compared to the three-dimensional results (Figures 10B, 11B), which seem to be closer to the observed minimum screen-level temperatures (Figures 10A, 11A). This is a problem specific to the single-column experiments. There are several possible reasons, including the constant in time clear-sky atmospheric state, different role of vertical mixing in the full model and in the single-column experiments etc. It is important to remember that MUSC experiment results are not directly comparable to observations. However, comparison between the different model setups can give valuable information even when the results do not validate well against the observations.
The main conclusion from Figure 12 is the key role of the slope factor, controlling the direct short-wave radiation (SWdir), at the chosen locations. Due to the slope effect, SWdir increased by 199 Wm−2 (not shown) and the maximum Ts by 2.1 K at the southward-looking station 37107. Corresponding decrease of SWdir and maximum Ts at the northward-looking 00011 reached −291 Wm−2 and −4.1 K. Another conclusion is that the restricted sky view led to an increase of Ts, max of the order of 1–2°, mostly because of the increased LWD but also by the increased diffuse SW flux. The shadow effect only showed up limited time in the morning and afternoon when it led to a small decrease of SWdir and Ts. MUSC results are consistent with the three-dimensional model results over the selected locations and the Olympic domain. They explain the impact of different components of the ororad parameterizations also to the monthly averages. However, in the full model the local effects smooth out when the monthly mean values are averaged also over a larger area.
Additional single-column sensitivity experiments were performed by using δsv values resulting from the different formulations discussed in Section 3.3. The nighttime Ts temperature increased with decreasing sky view factor at both stations, the maximum increase being of the order of 1° when δsv decreased from 1 to 0.85. This agrees with similar results of the 1D and 3D experiments reported above.
7. Conclusions and Outlook
In this study, new fine-resolution source orography and new parameterizations for orographic radiation fluxes were introduced to the mesoscale NWP system HARMONIE-AROME-SURFEX. The needed orographic variables for the NWP experiments were derived from the SRTM 3″ 90 m-resolution surface elevation data set. Synoptic observations of the Sochi winter Olympic games 2014 were used for validation of the three-dimensional model experiments. Analysis of the verification results and model-observation comparison at selected locations was completed by single-column model sensitivity experiments.
Olympic HARMONIE produced sufficiently good forecasts already when run in real time during the Sochi Olympic games 2014. A preliminary comparison of the reproduced Olympic experiments, which were based on GTOPO30 surface elevation and used no orographic parameterizations, against the FROST-2014 AMS screen-level temperature observations showed that a problem of underestimated screen-level temperature, which was revealed during clear and calm nights at the mountain cluster, was solved by excluding the surface sublayer parameterizations (so called CANOPY scheme). Further experiments were performed excluding this scheme, and the experiment without CANOPY was used as a reference for the comparisons.
Comparison of the reference GTOPO30-based experiment to the reference SRTM 3″-based experiment without orography parameterizations showed an increased negative screen-level temperature bias in the standard verification at all FROST-2014 AMS when the new orography was applied in the model. The change was smaller according to the verification against all SYNOP stations over a larger Caucasian domain. The increase of the negative bias was related to the change of the source orography only. However, significance and the exact reasons of this remain to be understood.
The change of source orography changed the mean surface elevation of each land-area gridpoint, i.e., led to an adjustment of the model's surface-pressure based vertical coordinate. The assumptions in the standard verification (interpolations, height adjustment of the screen-level temperature) and in the diagnosis of the screen-level temperature from the lowest model level and surface temperatures in the model are influenced by the surface elevation. In this study, the source of orography description was changed without specific adaptation to the coarser-resolution surface physiography description (land-sea distribution, soil and surface type are given with ca. 1-km resolution). Also the surface data assimilation and all surface parameterizations (including those related to snow) remained untouched. Implicit scale-dependencies related to the surface elevation in the model dynamics, turbulence and cloud microphysics parameterizations and their interactions may have influenced the model results and diagnostics. It is thus necessary to study systematically all aspects—data assimilation, model dynamics, parameterizations, verification—related to the change of source orography in the HARMONIE-AROME NWP system using different horizontal and vertical resolutions, before suggesting such a change for application in the operational forecasting.
Comparison of the experiments with orographic parameterizations to the reference SRTM 3″-based experiment showed a consistent but very small improvement of this negative screen-level temperature bias. The three-dimensional and single-column sensitivity studies showed that the new orographic radiation parameterizations behaved as expected. The largest impact was due to the slope effect, i.e., the direction of the slopes with respect to the incoming direct solar radiation. However, averaged over a larger domain, the related variations in downweling SW radiation smoothed out. Limited sky view enhanced the downweling long-wave radiation systematically in valleys so that the average monthly LWD increased locally by up to 10 Wm−2. The smaller was the average sky view factor, the larger was the overall increase of the flux. The nighttime minimum surface temperatures increased locally up to 1–2°. The daytime maxima changed between −2 and +3°. However, the change of the surface temperature was reflected only little in the screen-level temperature and insignificantly in the lower model level temperature values.
The method of calculation of the local horizon around a given point was improved compared to the method suggested by Senkova et al. (2007) and shown to be reliable by comparing to the observed horizons in several Alpine valleys. However, the different approximations in calculation of the grid-scale sky view factor from the local horizon at the level of the fine-resolution source orography, during aggregation to the model grid or even within the NWP model resolution led to somewhat different results, with mean values varying from 0.87 to 0.91 over the Olympic venue. The related uncertainty showed up mainly on the longwave radiation fluxes where the differences were small on average but systematic. None of the approximations can be considered absolutely correct or incorrect. Further studies could be devoted to quantification of these uncertainties within different model resolutions.
For a realiable validation of the radiation parameterizations, and the NWP results in general, the measurements of the downweling short- and long-wave radiation fluxes at the surface would be very useful. The observed fluxes and those predicted by the model correspond to each other more closely than for example the usually validated screen-level temperature, anemometer-level wind, cloud cover, or mean sea level pressure. We would suggest to make radiation observations available during the 2018 winter Olympic games in Pyeongchang on the Korean Taebaek mountains.
Author Contributions
All authors listed, have made substantial, direct and intellectual contribution to the work, and approved it for publication.
Funding
Support by the International HIRLAM and LACE programs and Meteo France is gratefully acknowledged.
Conflict of Interest Statement
The authors declare that the research was conducted in the absence of any commercial or financial relationships that could be construed as a potential conflict of interest.
Acknowledgments
We thank Nora Helbig for reminding us about the different ways to calculate the sky view factor. The extensive and careful critical comments by the two anonymous reviewers helped to improve our manuscript substantially. Our thanks are due to Yann Seity and Alexandre Mary from Meteo France for discussions and guidance in the implementation of orographic radiation parameterizations into SURFEX. Observational data from the WMO FROST project were available for this study via the Finnish Meteorological Institute.
References
Bénard, P., Vivoda, J., Mašek, J., Smolková, P., Yessad, K., Smith, C., et al. (2010). Dynamical kernel of the Aladin-NH spectral limited-area model: revised formulation and sensitivity experiments. Q. J. R. Meteorol. Soc. 136, 155–169. doi: 10.1002/qj.522
Déqué, M., Dreveton, C., Braun, A., and Cariolle, D. (1994). The ARPEGE/IFS atmosphere model: a contribution to the French community climate modelling. Clim. Dyn. 10, 249–266.
ECMWF (2012). IFS Documentation cy38r1, Part IV: Physical Processes. Available online at: https://software.ecmwf.int/wiki/display/IFS/CY38R1+Official+IFS+Documentation
GDAL (2014). Geospatial Data Abstraction Library. Available online at: www.gdal.org (Accessed Januaary 01, 2014).
Helbig, N., and Löwe, H. (2012). Shortwave radiation parameterization scheme for subgrid topography. J. Geophys. Res. Atmos. 117, 2156–2202. doi: 10.1029/2011JD016465
Helbig, N., and Löwe, H. (2014). Parameterization of the spatially averaged sky view factor in complex topography. J. Geophys. Res. Atmos. 119, 4616–4625. doi: 10.1002/2013JD020892
Helbig, N., Löwe, H., and Lehning, M. (2009). Radiosity approach for the shortwave surface radiation balance in complex terrain. J. Atmos. Sci. 66, 2900–2912. doi: 10.1175/2009JAS2940.1
Jarvis, A., Reuter, H. I., Nelson, A., and Guevara, E. (2008). Hole-Filled SRTM for the Globe Version 4. Available online at: srtm.csi.cgiar.org (Accessed Januaary 01, 2014).
Kondratyev, K. Y. (1977). Radiation Regime of Inclined Surfaces. WMO Technical Report 152, World Meteorological Organization, Geneva.
Malardel, S., Lac, C., Pinty, J.-P., Thouron, O., Bouteloup, Y., Bouyssel, F., et al. (2006). “Representation of clouds in AROME,” in Proceedings of the ECMWF Workshop on Parametrization of Clouds in Large-Scale Models (Reading: ECMWF).
Manners, J., Vosper, S. B., and Roberts, N. (2012). Radiative transfer over resolved topographic features for high-resolution weather prediction. Q. J. R. Meteorol. Soc. 138, 720–733. doi: 10.1002/qj.956
Mascart, P. J., and Bougeault, P. (2011). The Meso-NH Atmospheric Simulation System: Scientific Documentation. Technical Report, Meteo France, Toulouse, France.
Masson, V., Le Moigne, P., Martin, E., Faroux, S., Alias, A., Alkama, R., et al. (2013). The surfex v7.2 land and ocean surface platform for coupled or offline simulation of earth surface variables and fluxes. Geosci. Model Dev. 6, 929–960. doi: 10.5194/gmd-6-929-2013
Masson, V., and Seity, Y. (2009). Including atmospheric layers in vegetation and urban offline surface schemes. J. Appl. Meteorol. Clim. 48, 1377–1397. doi: 10.1175/2009JAMC1866.1
Mašek, J., Geleyn, J.-F., Brožková, R., Giot, O., Achom, H. O., and Kuma, P. (2015). Single interval shortwave radiation scheme with parameterized optical saturation and spectral overlaps. Q. J. R. Meteorol. Soc. 142, 304–326. doi: 10.1002/qj.2653
Müller, M. D., and Scherer, D. (2005). A grid- and subgrid-scale radiation parametrization of topographic effects for mesoscale weather forecast models. Mon. Weather Rev. 133, 1431–1442. doi: 10.1175/MWR2927.1
Nielsen, K. P., Gleeson, E., and Rontu, L. (2014). Radiation sensitivity tests of the HARMONIE 37h1 NWP model. Geosci. Model Dev. 7, 1433–1449. doi: 10.5194/gmd-7-1433-2014
Niemelä, S., Näsman, S., and Nurmi, P. (2014). FROST-2014 – Performance of Harmonie 1km during Sochi Olympics. ALADIN-HIRLAM Newsl. 3, 79–86. Available online at: http://www.cnrm.meteo.fr/aladin/IMG/pdf/aladin-hirlam-newsletter_no3_september2014.pdf
Savijärvi, H. (1990). Fast radiation parameterization schemes for mesoscale and short-range forecast models. J. Appl. Meteor. 29, 437–447.
Seity, Y., Brousseau, P., Malardel, S., Hello, G., Bénard, P., Bouttier, F., et al. (2011). The AROME-France convective-scale operational model. Mon. Weather Rev. 139, 976–991. doi: 10.1175/2010MWR3425.1
Senkova, A., Rontu, L., and Savijärvi, H. (2007). Parametrization of orographic effects on surface radiation in HIRLAM. Tellus 59A, 279–291. doi: 10.1111/j.1600-0870.2007.00235.x
Undén, P., Rontu, L., Järvinen, H., Lynch, P., Calvo, J., Cats, G., et al. (2002). The HIRLAM-5 Scientific Documentation, December 2002. Available online at: http://hirlam.org
USGS (1998). GTOPO30, Global 30 Arc Second Elevation Data Set. U.S. Geological Survey. Available online at: https://lta.cr.usgs.gov/GTOPO30
USGS (2010). GMTED 2010, Global Multi-resolution Terrain Elevation Data 2010 (GMTED2010). U.S. Geological Survey. Available online at: http://topotools.cr.usgs.gov/gmted_viewer/
Wikipedia (2012). Elbrus. Available online at: https://en.wikipedia.org/wiki/File:Elbrus_3D_version_1.gif (Accessed Januaary 01, 2014).
Keywords: orographic effects, radiation flux, Numerical Weather Prediction, parametrization, FROST-2014
Citation: Rontu L, Wastl C and Niemelä S (2016) Influence of the Details of Topography on Weather Forecast – Evaluation of HARMONIE Experiments in the Sochi Olympics Domain over the Caucasian Mountains. Front. Earth Sci. 4:13. doi: 10.3389/feart.2016.00013
Received: 25 August 2015; Accepted: 27 January 2016;
Published: 12 February 2016.
Edited by:
Daniel J. Kirshbaum, McGill University, CanadaReviewed by:
Juan Pedro Montávez, Murcia University, SpainIvana Stiperski, University of Innsbruck, Austria
Copyright © 2016 Rontu, Wastl and Niemelä. This is an open-access article distributed under the terms of the Creative Commons Attribution License (CC BY). The use, distribution or reproduction in other forums is permitted, provided the original author(s) or licensor are credited and that the original publication in this journal is cited, in accordance with accepted academic practice. No use, distribution or reproduction is permitted which does not comply with these terms.
*Correspondence: Laura Rontu, laura.rontu@fmi.fi