 Natalia Serpetti
 Ursula F. M. Witte
 Michael R. Heath
- 1Marine Scotland – Science Laboratory Aberdeen, Aberdeen, UK
- 2Oceanlab, School of Biological Sciences, University of Aberdeen, Newburgh, UK
Mineralisation of organic detritus in the marine surficial sediments generates a flux of dissolved inorganic nutrient between the sediment and overlying water column. This is a key process in the marine ecosystem, which links the food webs of the sea-floor and the overlying water-column, and is potentially affected by a range of interacting environmental and sedimentary factors. Here, we use General Additive Models (GAM) to statistically disentangle some of the factors controlling the seasonal and spatial variability in nutrients and oxygen fluxes in a field dataset collected in the North Sea off the northeast coast of Scotland. We show that sediment grain size, turbidity due to sediment re-suspension, temperature, and sediment chlorophyll content were the key factors affecting oxygen, ammonia, and silicate fluxes. However, phosphate fluxes were only related to suspended sediment concentrations, whilst nitrate fluxes showed no clear relationship to any of the expected drivers of change, probably due to the effects of denitrification. Our analyses show that the stoichiometry of nutrient regeneration in the ecosystem is not necessarily constant and may be affected by combinations of processes.
Introduction
Inorganic nutrients assimilated in the photic zone by phytoplankton may be either retained in the food web as living organic matter, or lost from the web as detritus and soluble excreta (Eppley and Peterson, 1979). In the open ocean, much of the detrital material produced by the food web settles out of the photic zone and remineralisation processes take place in the ocean interior or deep ocean floor. In this case, the return of the resulting dissolved inorganic nutrients to the photic zone takes place over very long time scales (decades-centuries) as a result of ocean overturning through deep vertical mixing and advection. However, in shallow shelf seas, where up to 50% of phytoplankton production can settle to the seabed (Canfield, 1993; Jørgensen, 1996; Wollast, 1998), detrital remineralisation processes are less physically isolated from the photic zone, and the return of inorganic nutrients can take place on much shorter time scales (weeks-months), and the system is potentially much more sensitive to the rates and locations of remineralisation (Nixon, 1981).
Most of the particulate organic material that reached the seabed is mineralised in the sediment, providing a rich food supply for the benthic community (Conley and Johnstone, 1995) and enriching pore water nutrient concentrations (Rutgers van der Loeff, 1980). In principal, the concentration gradient between pore waters and overlying water leads to positive nutrient flux from the sediment to the water column (sediment nutrient release; Ehrenhauss et al., 2004). However, there is considerable variability in the oxygen consumption and nutrient fluxes from sediments in different coastal environments (Banta et al., 1995).
A wide range of factors have been identified as affecting the rate of whole-sediment metabolism and organic matter (OM) degradation. These include solute transport processes (e.g., Jørgensen and Revsbech, 1985; Ehrenhauss and Huettel, 2004; Huettel and Gust, 1992; Ehrenhauss et al., 2004; Janssen et al., 2005; Bühring et al., 2006), temperature (e.g., Pamatmat and Banse, 1969; Banta et al., 1995; Thamdrup et al., 1998), hydrodynamic forces (e.g., Jørgensen and Des Marais, 1990; Søndergaard et al., 1992; Almroth et al., 2009; Holmroos et al., 2009), macrofauna and microbial community (e.g., Jørgensen, 1977; Volkenborn et al., 2007; Na et al., 2008), organic matter sources (e.g., Banta et al., 1995; Conley and Johnstone, 1995; Stephens et al., 1997) and oxygen saturation in the overlying water column (e.g., Rasmussen and Jørgensen, 1992) and its penetration into the sediment (e.g., Huettel and Gust, 1992; Cardenas et al., 2008).
Many of the factors affecting sediment metabolism are related to sediment grain size distribution, which largely dictates sediment permeability and porosity (Kamann et al., 2007), OM content (Lohse et al., 1995; Winterwerp and van Kesteren, 2004; Janssen et al., 2005), and sediment oxygen availability which regulate oxic/anoxic pathways of organic matter mineralisation (e.g., Glud, 2008). Areas dominated by cohesive-muddy sediment, nutrient transport and fluxes are driven by molecular diffusion (Huettel et al., 1998) and the degradation of organic matter takes place mostly on the sediment surface whilst in sandy sediments with a permeability exceeding 10−12 m2, pore water advection is the dominant transport process carrying particulate and dissolved organic matter through the interstitial water. Pore water advection actively supplies oxygen (Ziebis et al., 1996) and removes the remineralisation products (e.g., Huettel et al., 1998) accelerating the oxygen consumption, the degradation of organic matter and the recycling of nutrients (Huettel and Rusch, 2000; Janssen et al., 2005; Bühring et al., 2006). It is generally accepted that OM mineralisation rate in permeable sands can be comparable and even higher than those found in cohesive sediments (e.g., Janssen et al., 2005; Glud, 2008). However, direct experimental comparisons across different sediment types are very rare (Glud et al., 2010) and only few studies are based on long-term and high resolution sampling design (Zetsche et al., 2012). Statistical analysis to disentangle the key environmental effects on nutrient fluxes are difficult, due to temporal correlations between the various driving factors (Banta et al., 1995; Abeare, 2009; Zetsche et al., 2012; Dedman et al., 2015) and there are few studies which provide a comprehensive spatial and temporal synthesis due to the high number of replicate measurements required. In our study, we apply General Additive Models to assess the significance of a range of time-varying environmental factors on the variability in nutrient and oxygen fluxes across a gradient of sediment median grain size based on a dataset of monthly experiments and samples collected over 1 year.
Materials and Methods
Study Area and Sampling Stations
The study area covered around 180 km2, between 14 and 57 m depth, off Stone haven (Figure 1), south of Aberdeen, north-east of Scotland, UK.
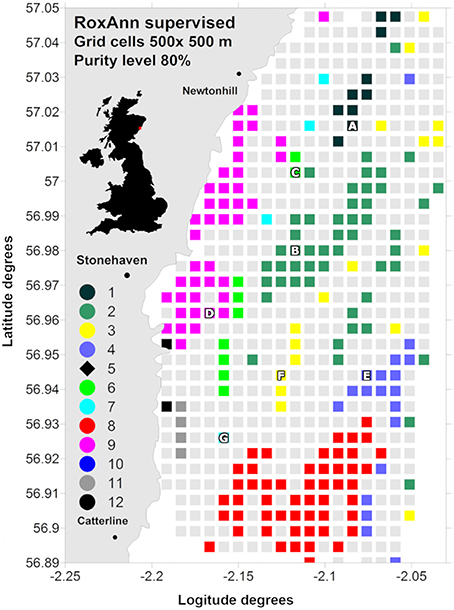
Figure 1. RoxAnn supervised map identifying 12 sediment classes ranging from muddy sands to sediment with pebbles and cobbles. Class 1, smooth, very fine muddy sand; class 2, smooth, very fine-fine muddy sand; class 3, smooth, medium sand; class 4, smooth, gravelly fine-medium muddy sand with pebbles; class 5, boulders; class 6, slightly rippled, fine muddy sand with ophiuroids present; class 7, slightly rippled, fine-medium sand with ophiuroids present; class 8, gravelly muddy sand with pebbles and cobbles with Alcyonium digitatum present; class 9, rippled, fine sand; class 10, rippled, medium-coarse sand; class 11, gravelly muddy sand with cobbles and high concentration of A. digitatum; class 12, gravelly muddy sand with boulders and high concentration of A. digitatum. The selected samplings stations are also indicated (“A” to “G”).
Between 2006 and 2008 two acoustic ground discrimination surveys, and two ground truthing video and grab sampling surveys were carried out to identify and describe different sediment types. The single beam hydro-acoustic data were processed with the widely employed RoxAnn seabed discrimination system (Serpetti et al., 2011, and references therein) that provides quantitative data on properties of the returning echo which relate to the roughness and hardness of the seabed. The combinations of ranges of hardness and roughness were used to identify seabed classes, and these were shown to relate closely to sediment categories discriminated from the grab sampling surveys on the basis of grain size and the topographical features of the seabed. The results indicated that the area could be described by 12 sediment classes ranging from muddy sand to boulders and rock (Figure 1; Serpetti et al., 2011): class 1, smooth, very fine muddy sand; class 2, smooth, very fine-fine muddy sand; class 3, smooth, medium sand; class 4, smooth, gravelly fine-medium muddy sand with pebbles; class 5, boulders; class 6, slightly rippled, fine muddy sand with ophiuroids present; class 7, slightly rippled, fine-medium sand with ophiuroids present; class 8, gravelly muddy sand with pebbles and cobbles with Alcyonium digitatum present; class 9, rippled, fine sand; class 10, rippled, medium-coarse sand; class 11, gravelly muddy sand with cobbles and high concentration of A. digitatum; class 12, gravelly muddy sand with boulders and high concentration of A. digitatum.
To select sites for measurements of sediment oxygen consumption and nutrient fluxes (stations A–G in Figure 1), the RoxAnn acoustic dataset was then analyzed by overlaying the study area with an orthogonal grid of cells (500 × 500 m), and calculating for each cell the proportion of the area represented by each hydro-acoustic sediment class (for details please refer to Serpetti et al., 2011). We refer to this value as the class “purity” of the sediment within a cell. Cells which contained homogeneous sediment (e.g., pure) were identifiable by a high proportion (80% in this case) of data points from a particular sediment class (colored cells in Figure 1).
Sediment Sample Collection and Measurements of Total Oxygen Uptake, Nutrient Fluxes, and Pore Water Profiles
During each sampling occasion, water column profiles of temperature, turbidity [measured in Formazin Turbidity Units (FTU)], salinity and chlorophyll fluorescence were recorded using the Saiv CTD (Conductivity, Temperature and Depth) system. All the CTD profiles were then calibrated and smoothed, and for each station the turbidity was averaged over a 10 m interval above the sediment. In addition, temperature at a height of 1 m above the seabed was measured by a reversing oceanographic thermometer mounted on a messenger-operated water bottle, and water samples retained for nutrient analysis.
Undisturbed core samples were collected at the sampling sites using a Mini Muc K/MT 410 corer from the 10 m catamaran research vessel “Temora” between June-2008 to July-2009 (Table 1). Weather and slack tidal conditions often limited the sampling opportunities to only a few days each month. Four acrylic tubes of 60 cm length and either 9 or 3.5 cm diameter were fitted to the sampler for each deployment. The 9 cm diameter tubes were used to collect cores for incubation experiments, whilst 3.5 cm diameter tubes were used to collect cores for permeability and porosity measurements. Once recovered aboard the vessel, core tubes were carefully removed taking care to minimize disturbance of the sediment and the overlying water column, sealed at the bottom with an inert rubber bung, and at the top with an o-ring sealed lid having ventilation ports, taking care to exclude any air. Sediment cores of length shorter than 15 cm were rejected. Three replicate intact cores were collected with both the 9 and 3.5 cm diameter tubes at each site. The intact cores were stored on the deck in the dark in tanks of water irrigated from a seawater hose and transported to the laboratory within 4–5 h.
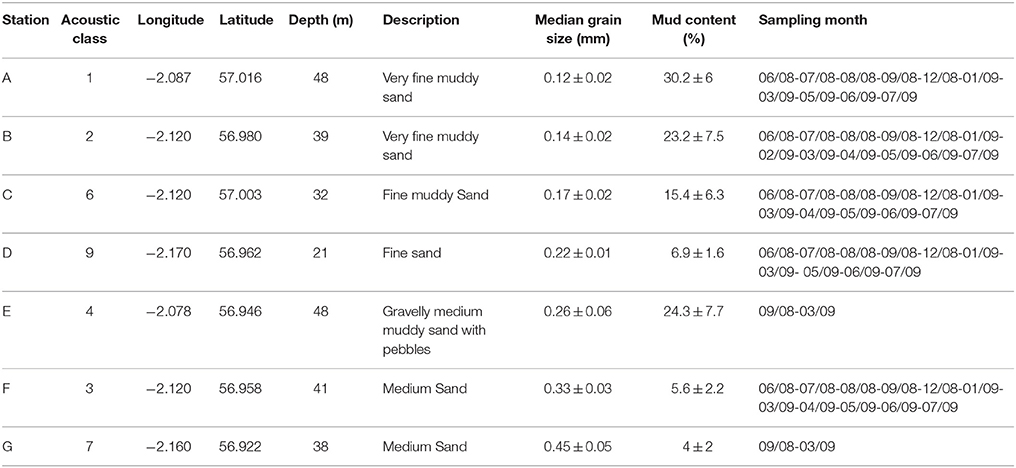
Table 1. Coring stations and corresponding acoustic classes, coordinates, sediment description, median grain size (±SD), mud content (±SD), and sampling month/year.
On arrival in the laboratory the overlying water in each core tube was gently aerated in a darkened constant temperature room at in situ seawater temperature (±1°C) for around 18 h. The tubes were then sealed with air-tight lids and incubated for 24 h in the dark. Water samples were extracted and filtered (Cronus nylon syringe filters 0.45 μm) from each chamber at 0, 3, 6, 12, and 24 h using 50 ml air tight syringes without water volume replacement.
Dissolved oxygen concentrations were measured by the Winkler titration method (Grasshoff et al., 1999) using an 808 Titrando analyser and nutrient concentrations were measured using the Quaatro element analyser by Bran-Luebbe. All samples collected for silicate analysis were stored in the fridge and polythene bottles and analyzed within 3 months while the other nutrient samples were kept in the freezer (−80°C) and analyzed within 6 months.
After the incubation experiments, the top 10 cm layer of sediment in each core was sliced to produce 8 layers with 1 cm thickness in the upper 6 and 2 cm thickness at deeper depths (0–1, 1–2, 2–3, 3–4, 4–5, 5–6, 6–8, and 8–10). To do so, the cores were put under vacuum to avoid disturbing the sediment and pore water profiles during the removal of the lower rubber bang, and carefully transferred to a plunger, fitted with two flexible o-rings that allowed it to slide relatively easy inside the core tube and extrude a length of the sediment core out of the top of the tube, which was then sliced off and collected on a stainless steel knife. Slices were stored in labeled petri-dishes in a cooled constant temperature room for the minimum time required to complete the slicing operation and pore waters were then extracted from each slice by centrifugation at 3000 rpm. Because of the low porosity of sandy sediments (e.g., stations D, F, and G) the pore waters extracted from the three replicates was stored together to obtain enough sample for nutrient analysis. Nutrient concentrations (ammonia, nitrate, nitrite, phosphates, and silicate) were measured using the Bran and Luebbe Quattro analyser and the AACE software following a standard procedure.
Oxygen and nutrient fluxes (mmol m−2 d−1) across the sediment-water interface were calculated following Fick's first law of diffusion as a function of enclosed sediment area and water volume between four time intervals in the case of oxygen (0–3, 3–6, 6–12, and 12–24 h) and two time interval in the case of nutrients (0–6 and 6–24 h). The fluxes were calculated as the sum of the oxygen and nutrient concentrations (mmol) consumed or produced in the remaining water volume (L) over the successive time intervals “i” per unit of sediment surface area (m2), following the equation:
Sediment Properties: Organic Matter Content, Grain Size Distributions
After pore water extraction, the sediment slices were stored in a freezer and grain size distribution analysis, total organic carbon (TOC%), and nitrogen (TON%) analysis, and estimation of the phytoplankton pigments chlorophyll-a (Chl-a, μg g−1) and pheophytin-a (Pheo-a, μg g−1) carried out. Pheophytin is a refractory degradation product of chlorophyll and the ratio of chlorophyll: phaeophytin may be an indicator of the age of algal material in the sediment. Because TOC and TON concentrations did not show seasonal variations and did not vary at different sediment horizon profiles differently than pigment concentrations (Serpetti et al., 2012) we used measurements analyzed only in the top 1 cm for TOC and TON and in the top 5 cm for Chl-a and Pheo-a.
The sediment slices were first freeze-dried and sub-samples were used to extract the pigments by soaking 0.5 g of sediment in 5 ml of 90% buffered acetone for 24 h in the dark at 3–5°C in a centrifuge tube. During this time the samples were regularly shaken then centrifuged for 10 min at 3000 rpm. The fluorescence of the extract was then measured before and after acidification and the Chl-a and Pheo-a concentrations (μg g−1) in each sample calculated according to Strickland and Parsons (1972), and referenced to the weight of sediment used for the extraction. TOC and TON% in the freeze-dried sediment sub-samples were measured using a Thermo Quest Flash EA 1112 elemental analyser which uses a combustion method to convert the sample elements to simple gases (CO2, H2O, and N2). For the total organic carbon the samples were acidified with HCl in silver cups prior to the analysis to remove the inorganic carbon fraction.
The rest of the top 5 cm sediment slices were sieved using a sieve shaker through 8, 4, 2, and 1.4 mm mesh for 7 min; each sieved fraction was weighed to 0.01 g. Grain sizes smaller than 2 mm was then analyzed by laser granulometry using a “Mastersizer 2000” instrument. The cumulative weight percentages below each sieve fraction were calculated and combined with the cumulative volume percentage for each size range, measured by the software, to obtain a full particle size range from 8000 to 0.49 μm. For each of the sediment samples median grain size, mud content, sorting level, skewness, and kurtosis were then calculated.
Sediments were described (Table 1) using a combined classification based on the Udden-Wentworth scale (Udden, 1914; Wentworth, 1922) and Folk's classification system (Folk, 1954). For the Udden-Wentworth scale, the classification is based on the median grain size distinguishing sediment from very fine sand to boulders. However, in Folk's classification system, a sand:mud ratio between 1:1 and 9:1 defines “muddy” sediments (sand = fractions greater than 2 mm, mud = fractions smaller than 63 μm) while “slightly gravelly” or “gravelly” sediments were defined by a percentage of gravel between 1–5% and 5–30%, respectively (for more details see also (Serpetti et al., 2011).
Porosity and Permeability Measurements
Sediment permeability was measured in three replicate cores collected with the 3.5 cm tubes using the falling-head method (Klute and Dirksen, 1986) generally applied for muddy sediment with a permeability < 10−12 m2. In this method, sediment hydraulic conductivity (K) is estimated by measuring the time (t) required for water to pass through a given sediment area (A) and length (L) when the hydraulic head difference declines in time between two known values (H1 and H2):
where a is the cross-sectional area of the reservoir.
Permeability (k in m2) was then calculated by the equation:
where m and d are the pore water viscosity (g cm−1 s−1) and density (g cm−3), respectively, dependent on temperature and salinity, and g is the acceleration due to gravity (9.81 m s−2). Permeabilities in the top 10 and 5 cm were calculated by averaging nine measurements, three for each of three different hydraulic head differences.
Sediment porosity was measured in the three replicate cores used for the permeability measurements. The cores were sliced at 1–2, 2–3, 3–4, 4–5, 5–6, 6–8, and 8–10 cm, and porosity (φ) was calculated from sediment water content (β) and density (d) using the following equations:
where ww and dw are sediment wet and dry weight (g), respectively and Vol is the sediment wet volume (g * cm−3). Porosity in the top 10 and 5 cm were calculated by averaging measurements from 1–10 and 1–5 cm, respectively.
Statistical Tests and Modeling
Analysis of the variance (ANOVA) test was used to identify significant differences between sampling months and sediment types in the response and explanatory variables. Graphical techniques were used to check for outliers using box-whisker plots: in these graphs the horizontal line represented the median of the observations, the box around is the 25 and 75% quartiles that contains half of the observations, and the vertical “whiskers” indicate the minimum and maximum values. The data were checked for possible outliers which might be legitimately removed (Zuur et al., 2010), but none were indentified in our dataset. Generalized additive modeling (GAM) was then used to relate the response variables, i.e., total oxygen uptake and the nutrient fluxes, to the predictors, i.e., water temperature, turbidity, organic matter sources and physical sediment properties. Highly correlated covariates should not be used in regression modeling (Zuur et al., 2010). Collinearity between covariates was checked using the Pearson correlation (high collinearity between explanatory variables is indicated by correlation values >0.6–0.7; Zuur et al., 2010) and the variance inflation factor (VIF; by sequentially removing the variable with the highest value, until all remaining VIFs were below the lower suggested values of 3; Zuur et al., 2010). The final GAMs used the remaining significant explanatory variables. To avoid model over-fitting the optimal number of the smoothing parameters (k), representing knot values (degree of freedom) of the spline smoothers, was penalized (fixed to the lower value estimated for the degrees of freedom for the regressions splines; Cawley and Talbot, 2010; Griggs, 2013). Model validations were carried out by analysing the normality, assuming a Gaussian fit, by plotting the theoretical quantiles vs. standardized residuals (Q-Q plots) and the frequency distributions of residuals. Collinearity was checked using the Pearson correlation coefficient and the concurvity function (Wood, 2003) and homogeneity of variance was checked by plotting residuals vs. fitted values (please for details of these methodologies refer to Zuur et al., 2010) and references therein. Statistical tests were carried out using the software R version 2.6.2 using the library mgcv.
Results
Figure 1 shows the acoustic RoxAnn classes for grid cell sizes of 500 × 500 m and at 80% of purity level. Hydro-acoustic classes 5 and 10 were not represented at this grid resolution due to their low incidence or highly scattered spatial distribution. Of the acoustic classes which emerged as being a major component of the region, we chose one cell for each of the seven acoustic classes 1, 2, 3, 4, 6, 7, and 9, as coring sites characterized by seven sediment types (Table 1). For classes 8, 11, and 12, which were represented at the 80% purity and 500 × 500 m scale, it was not possible to collect samples suitable for incubation experiments with the corer available, due to the presence of cobbles and boulders embedded in the finer sediment. The selected samplings stations (Figure 1), defined from “A” to “G” in median grain size order from very fine muddy sand to well sorted medium sand, were sampled over a 1 year cycle. Five of the sites were visited on 10 occasions of the yearly cycle. Two of the sites were visited less frequently due to their distance from the shore base of the survey vessel, and the sediment type. At one site (“E”) the sediment comprised cobbles and boulders embedded in a finer sediment matrix which was time consuming and costly in terms of equipment damage to sample. At the other site (“G”) the sediment comprised well sorted medium sand, and we lacked the equipment to effectively conduct core incubation experiments on this sediment type (see later).
Water Temperature and Turbidity
The highest temperature during the study period was recorded in September-08 (13°C) and the lowest in March-09 (6.3°C). Bottom water temperature showed the expected significant temporal variation (p < 0.001; Figure 2), but no significant differences were found between bottom water temperatures at the different stations (p>0.1). Turbidity showed significant temporal (p < 0.001) and spatial (p < 0.001) variations. The highest turbidity mean values were recorded in winter months (4.11 ± 0.95 FTU in December-08 and 4.76 ± 1.83 FTU in January-09; Figure 3A) with maximum values in shallower stations (6.61 FTU in station C and 7.76 FTU in station D). Station E and G were sampled only twice and it was not possible to calculate the mean values of turbidity (Figure 3B).
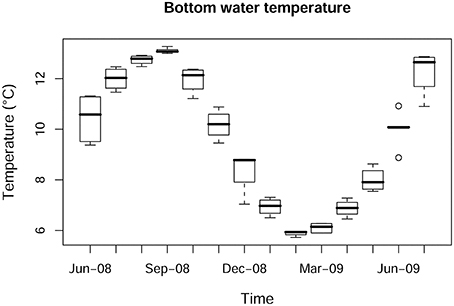
Figure 2. Box-whisker plot for bottom water temperature showing temporal variation.
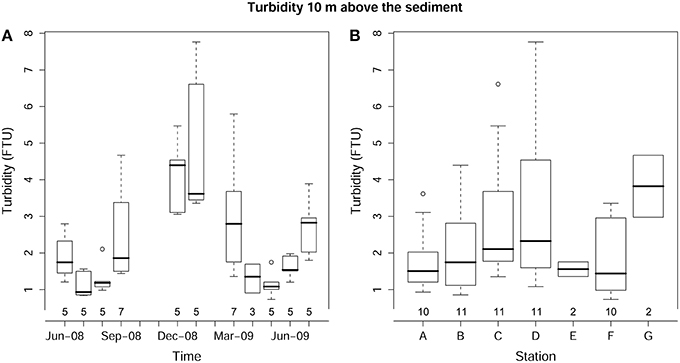
Figure 3. Box-whisker plot for turbidity showing variations in time (A) and across sediment types (B). The number of core replicates at each sampling month and station is also shown.
Sediment Properties: Organic Matter Content, Median Grain Size, Mud Content, Porosity, and Permeability
All the organic matter sources (TOC, TON, Chl-a, and Pheo-a) were highly correlated to each other (Table 2) and also showed significant differences between sampling stations (p < 0.001; Figures 4A–D), but only the pigments exhibited significant temporal variations (p < 0.001; Figures 4E,F).
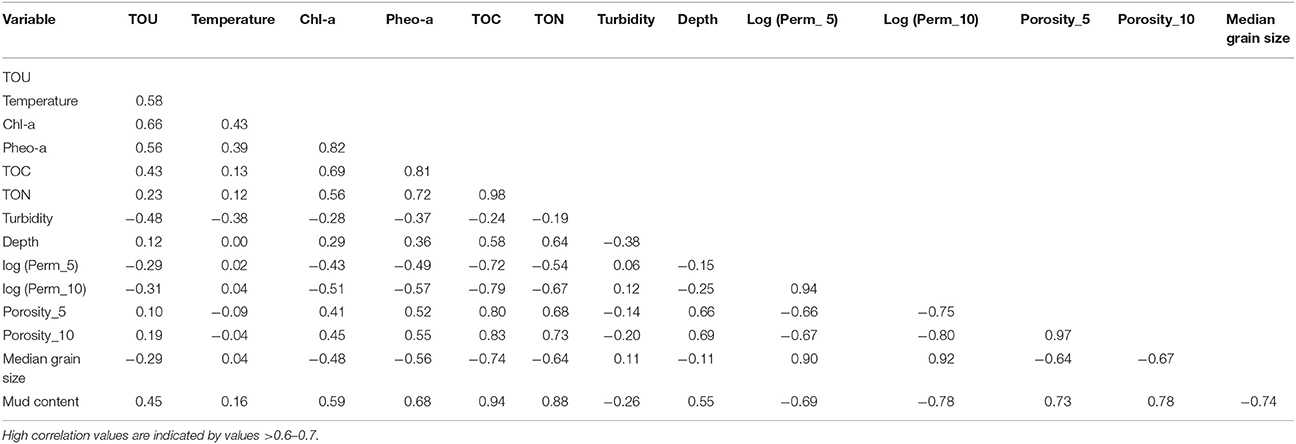
Table 2. Pearson correlation values between total oxygen uptake (TOU), temperature, chlorophyll-a, pheophytin-a, total organic carbon (TOC), total organic nitrogen (TON), turbidity, depth, log transformed permeability in the top 5 and 10 cm, median grain size, and mud content.
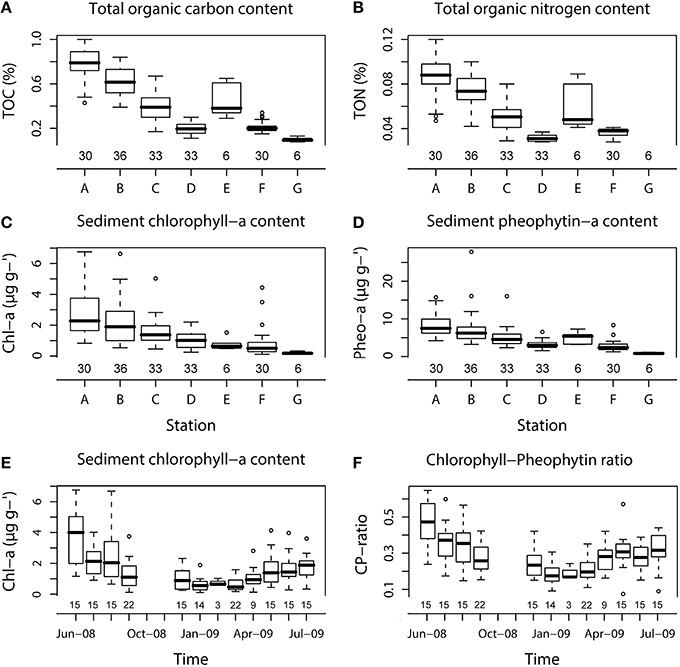
Figure 4. Box-whisker plots showing variations in different sediment types for TOC (A), TON (B), Chl-a and Pheo-a (C,D), and temporal variations of Chl-a and Chl-a:Pheo-a ratio (E,F). The number of core replicates at each station and sampling month is also shown.
For both TOC and TON, the highest contents were found at the very fine muddy sand station A (0.8 ± 0.2%, 0.09 ± 0.02% for TOC and TON, respectively) and the lowest at the medium sand station G (0.1 ± 0.02% for TOC) where TON was under the detection limit (Figures 4A,B).
The highest Chl-a and Chl-a:Pheo-a ratio mean values from all the stations were measured in June-08 (3.9 ± 1.9 μg g−1 and 0.47 ± 0.12, respectively) with maximum mean values in very fine muddy sand at station A for both Chl-a and Pheo-a pigments throughout the year (2.8 ± 1.6 and 8.5 ± 3.3 μg g−1) and the lowest in January-09 for both Chl-a and Chl-a:Pheo-a ratio (0.6 ± 0.5 μg g−1 and 0.18 ± 0.06, respectively). Minimum mean values were found at station G for both pigments (0.2 ± 0.08 and 0.8 ± 0.2 μg g−1 for Chl-a and Pheo-a, respectively; Figures 4C–F).
Permeability in the top 5 and 10 cm, porosity in the top 5 and 10 cm, median grain size and percentage of mud content, did not show temporal variation (p>0.1), but they differed strongly between stations (p < 0.001; Figure 5). Due to the exponentially increasing permeability between stations, the values were log-transformed to better visualize the differences (Figures 5A,B). Table 3 shows the mean permeability in the top 5 and 10 cm per station. All these physical sediment properties were also highly correlated (Table 2). Sediment permeability decreased with increasing mud content and porosity and decreasing median grain size.
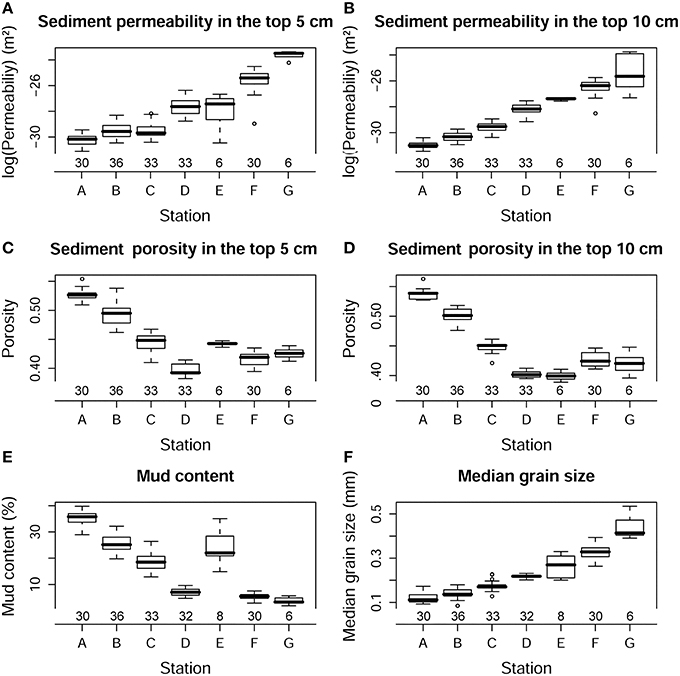
Figure 5. Box-whisker plots showing log transformed permeability in the top 5 (A) and 10 cm (B), porosity in the top 5 (C) and 10 cm (D), median grain size (E), and mud content (F) in different sediment types. The number of core replicates at each station is also shown.
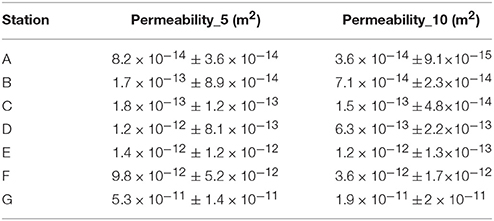
Table 3. Mean permeability and standard deviation in the top 5 and 10 cm at each station.
Temporal and Spatial Variations in Total Oxygen Uptake (TOU) and Nutrient Fluxes
Dissolved oxygen concentration in the incubated cores generally did not decrease by more than 20% over the course of each experiment. This depletion was exceeded only in June 2008, when the highest fluxes were recorded and the dissolved oxygen concentration declined by between 20 and 30% in all the stations. The annual mean oxygen consumption rate across all incubations was 13.1 ± 7.1 mmol m−2 d−1. TOU showed significant variation in time (p < 0.001; Figure 6A) with the highest mean values were recorded in June-08 (26.9 ± 3.3 mmol m−2 d−1) and the lowest in January-09 (5.9 ± 2.5 mmol m−2 d−1). Differences across sediment types (between stations) were significant only for station G (p < 0.001) where oxygen consumption was lower than at the other sites (Figure 6G).
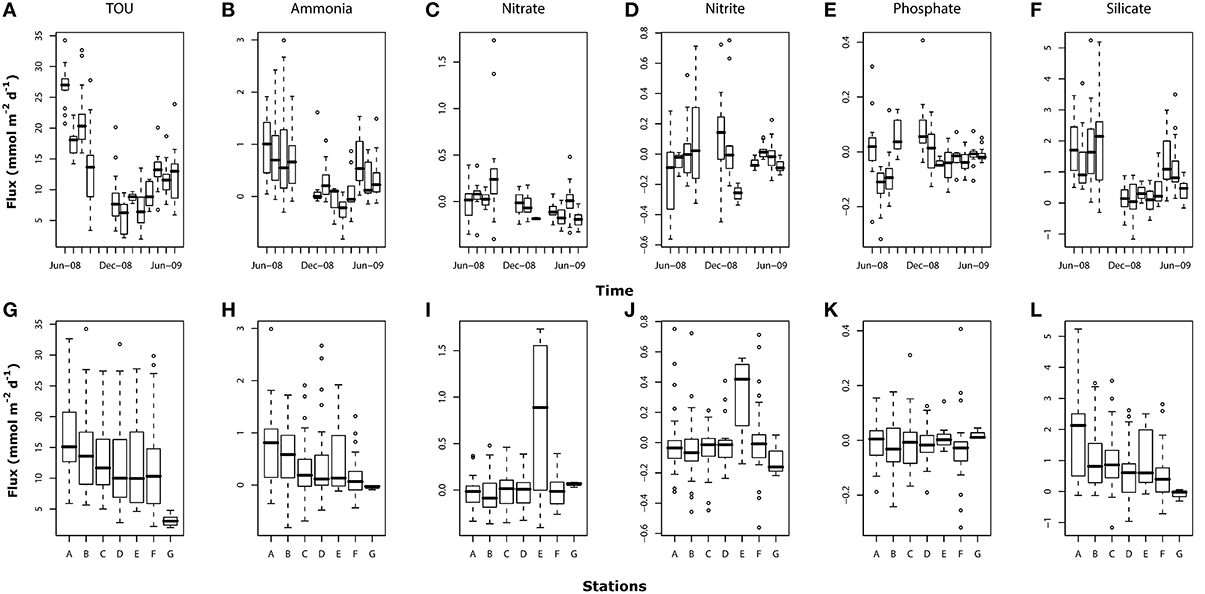
Figure 6. Box-whisker plots for TOU and nutrient fluxes (mmol m−2 d−1) showing temporal (A–F) and spatial variations (G–L). For number of core replicates at each sampling month and station refer to Figure 4.
Ammonia fluxes showed a clear seasonal pattern (p < 0.001; Figure 6B) with high positive fluxes (from sediment to the overlying water) in summer months (from June-08 to September-08 and from May-09 to July-09). Between December-08 and April-09, ammonia fluxes were centered around zero with mostly negative fluxes (sediment consumption) recorded in March-09. The mean annual ammonia flux across all core incubations was 0.43 ± 0.64 mmol m−2 d−1. Ammonia fluxes also differed between stations (Figure 6H) with values significantly lower in stations C (p < 0.01), D (p < 0.05), F (p < 0.001), and G (p < 0.05) compared to the baseline station A.
The mean annual flux values of nitrate and nitrite were low (0.001 ± 0.26 and −0.008±0.21 mmol m−2 d−1, respectively; Figures 6C,D). Significant and high nitrate fluxes were recorded only on September-08 (p < 0.001) with two samples exceptionally high (>1.2 mmol m−2 d−1). Nitrite temporal patterns showed a weak significant variation (p < 0.05) with high flux variability between stations in June-, August-, September,- and December-08. Both nitrate and nitrite also showed significantly higher values at station E (p < 0.001 and p < 0.01, respectively; Figures 6I,J).
Phosphate mean fluxes were very low with mean annual negative values (−0.01 ± 0.09 mmol m−2 d−1; Figure 6E). Significant high and positive fluxes were found in September-08 (p < 0.05) and December-08 (p < 0.01) while fluxes in July- and August-08 were significantly negative (p < 0.001). Fluxes of phosphate did not show significant differences between stations (p>0.1; Figure 6K).
Silicate mean annual fluxes were higher than those measured for the other nutrients (0.97 ± 1.12 mmol m−2 d−1; Figure 6F). As for ammonia, silicate fluxes showed a clear seasonal pattern with high mean values in the summer months (from June- to September-08 and from May- to July-09) and significantly low values (p < 0.001), in winter (from December-08 to April-09). Silicate fluxes showed the strongest spatial differences with station B (p < 0.01), C (p < 0.01), D (p < 0.001), E (p < 0.1), F (p < 0.001), and G (p < 0.01) showing significantly lower values compared to the baseline station A (Figure 6L).
TOU, ammonia and silicate fluxes were also higher and more variable in June, July, August, and September-08 compared to the following summer (May, June, and August-09).
Pore Water Profiles
To summarize, the pore water results nutrient concentrations profiles were averaged over summer 2008 (from June to August 2008), winter (from December 2008 to February 2009), and summer 2009 (from May 2009 to July 2009; Figure 7). Nutrient pore water concentrations were always higher than the concentrations of the bottom water (depth 0 in the figure).
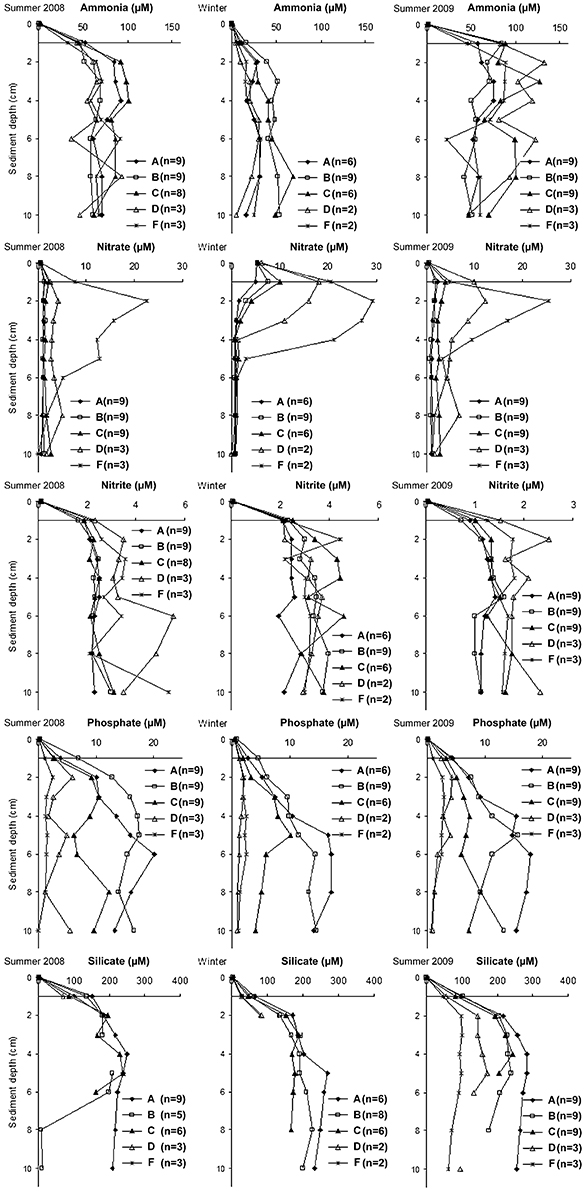
Figure 7. Temporal and spatial variations of pore water nutrient concentrations during summer 2008 (June, July and August 2008), winter (December 2008 and January and February 2009), and summer 2009 (May, June and July 2009). The standard deviations of the measurements are omitted for the sake of clarity.
The profiles clearly showed higher pore water ammonia concentrations in summer (~30–100 μM in summer 2008 and ~20–130 μM in summer 2009) than winter (< 70 μM). Opposite trends were found for nitrate with the highest concentrations in the top 2 cm in winter (5–30 μM) than in the summers (1–25 μM for both summers). High nitrate concentrations were measured in sandy stations D and F in the top 5 cm, below this depth the concentrations declined also in these stations. Nitrite pore water concentrations were also higher in sandy stations D and F than muddy stations A, B, and C in the summer of both years. No clear differences in concentrations were found in winter. Phosphate pore water concentrations were high in muddy stations A, B, and C, increased with sediment depth until ~5 cm, and were generally constant below this depth. In sandy stations D and F phosphate concentrations were low and generally constant with depth. Similar trends were found for silicate with higher concentrations at stations A, B, and C than at D and F (with the last two measured only in summer 2009). Concentrations increased with sediment depth until 2 cm at sandy, and 5 cm at muddy stations. Below these depths the concentrations remained generally constant (with the exception of station B in summer 2008).
Correlation Analysis
Nitrate and nitrite measured at station E were excluded from the modeling dataset of nutrient fluxes because measurements were carried out on only two occasions. At all the other stations, all the variables measured were considered as potential explanatory variables for sediment TOU and nutrient fluxes. High correlation values were found between the organic matter sources (TOC, TON, Chl-a, and Pheo-a) and physical sediment properties (permeability in the top 5 and 10 cm, porosity in the top 5 and 10 cm, median grain size, and mud content; Table 2). The VIF values showed high correlations between variables (Table 4): after removal, the correlation of the VIF selection identified six possible explanatory variables (temperature, Chl-a, TON, turbidity, depth, and permeability in the top 5 cm log transformed).
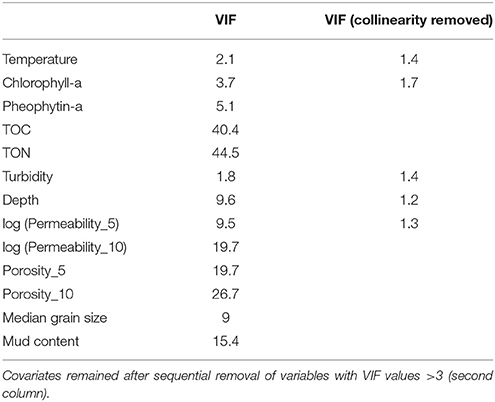
Table 4. Variance inflation factor values for all the explanatory variables [temperature, chlorophyll-a, pheophytin-a, total organic carbon (TOC), total organic nitrogen (TON), turbidity, depth, log transformed permeability in the top 5 and 10 cm, median grain size and mud content (first column)].
GAM Modeling of Fluxes
The best predictors of TOU, ammonia and silicate fluxes, identified by the final GAM selection, were water temperature and sediment Chl-a content (p < 0.001 for all the variables), turbidity (p < 0.001, p < 0.05, and p < 0.01 for TOU, ammonia and silicate respectively), and log-transformed permeability in the top 5 cm (p < 0.001, p < 0.05, and p < 0.001 for TOU, ammonia and silicate, respectively) with the following model equation:
“y” = log(TOU), ammonia or silicate fluxes;
“s” = representing regression spline smoothers;
“k” = representing knot values of the spline smoothers
“fx” = indicates whether the term is a fixed degree of freedom regression spline (TRUE) or a penalized regression spline (FALSE).
The model outputs [Figure 8 for TOU (Figures 8A–D), ammonia (Figures 8E–H), and silicate fluxes (Figures 8I–L) showed the relationship between the fluxes and each explanatory variable (fixing mean values for the other ones)]. The models explained 76, 45, and 53% of the deviance, respectively, for TOU, ammonia, and silicate.
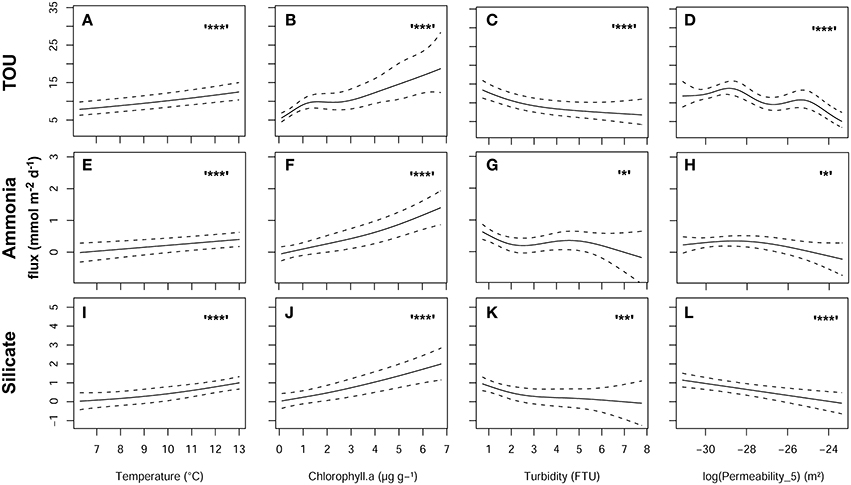
Figure 8. Model output showing the smoother relationship of TOU (A96D), ammonia (E96H), and silicate fluxes (I96L) in relation to temperature (A,E,I), sediment Chl-a content (B,F,J), water turbidity (C,G,K), and permeability in the top 5 cm log transformed (D,H,L). Symbols indicate the levels of significance: ***p < 0.001, **p < 0.01, and *p < 0.05.
Nitrite fluxes were not significantly related to any of the explanatory variables considered, while nitrate fluxes increased with temperature (p < 0.001) and decreased with an increase of chlorophyll sediment content (p < 0.05). Phosphate flux was strongly driven by water turbidity (p < 0.001), showing an increased flux with increasing turbidity. However, the nitrate and phosphate models explained only 12 and 20% of the deviances (model graphs are not shown).
Discussion
Factors Affecting Fluxes
The magnitudes of oxygen and nutrient fluxes measured in our study are quantitatively similar to those from previous studies in similar sediments and latitudes (Koop et al., 1990; Lohse et al., 1993, 1995; Banta et al., 1995; Trimmer et al., 2003; Ehrenhauss et al., 2004; Ehrenhauss and Huettel, 2004; Janssen et al., 2005; Almroth et al., 2009). However, our intensity of sampling allowed us to statistically disentangle the factors controlling the seasonal and spatial variability in a study area. The GAMs showed that water temperature and turbidity, sediment chlorophyll-a content, and permeability were the main non-correlated drivers of sediment total oxygen uptake and ammonia and silicate fluxes (Figure 8). However, none of these factors explained a high percentage of the deviance distribution for nitrate, nitrite and phosphate. Only a few other studies, using different modeling approaches to deal with highly correlated datasets (Banta et al., 1995; Zetsche et al., 2012), have statistically disentangled the factors affecting benthic remineralisation, and with different levels of significance associate with the factors.
Temperature
Seasonal fluctuations of temperature influences most abiotic and biologically catalyzed processes and are correlated with shifts in benthic community structure and species composition (Banta et al., 1995; Thamdrup et al., 1998). Our GAM model indicates a Q10 value of 2 for the seasonal pattern of TOU at a given value of sediment chlorophyll-a content, permeability and the water turbidity (Figures 8A–D). This agrees with values found for aerobic respiration rates in temperate coastal sediments (Jørgensen, 1977; Kanneworff and Christensen, 1986; Hall et al., 1989; Banta et al., 1995; Thamdrup et al., 1998).
High temperature also increases rates of silica biogenic dissolution leading to a high silicate flux (Dixit et al., 2001) and, associated with high macrofauna biomass, can stimulate the metabolic activity and excretion rates determining also high ammonia flux (Pomroy et al., 1983; Magni et al., 2000). Pore water ammonia and silicate concentrations on the top horizons showed similar seasonality patterns to the fluxes with low values in winter (Figure 7).
Chlorophyll-a
Our model results showed that sediment chlorophyll-a content is the factor that was most strongly related to TOU, ammonia and silicate fluxes (Figures 8B,F,J) confirming a rapid response of sediment benthic faunal and bacterial activities after fresh phytodetritus deposition (e.g., Banta et al., 1995; Conley and Johnstone, 1995; Grenz et al., 2000; Ehrenhauss et al., 2004; Dahllöf and Karle, 2005; Beck et al., 2008). These fluxes were also significantly higher and more variable during summer 2008 when the highest sediment Chl-a content were also measured (Figure 4E; Figures 6A,B,F). Previous studies have demonstrated, using plant-pigments as tracers of early organic matter diagenesis processes, that chlorophyll is a high quality and labile organic matter source which, in lakes and coastal marine sediments, is degraded quickly to more refractory organic matter forms with pheophytin representing the first step of the degradation (Furlong and Carpenter, 1988; Sun et al., 1991, 1993; Stephens et al., 1997). The degradation of chlorophyll to pheophytin is influenced by a range of factors such as oxygen availability, exposure to light and microbial, and macrofauna abundance (Stephens et al., 1997; Bianchi et al., 2000; Serpetti et al., 2012). This was particularly evident in the case of TOU that showed exceptionally high values in June-08 (Figure 6A) which correspond to the maximum sediment Chl-a:Pheo-a ratio (Figure 4F) indicating that the phyto-detritus in the sediment was of very recent origin.
Turbidity
Our models show a decrease in fluxes with increasing turbidity (Figures 8C,G,K). We recorded significantly higher turbidity in winter months (Figure 3A) presumably induced by resuspension due to weather conditions. The resuspension effect was also significantly higher at the shallow water stations (Figure 3B) and water oxygen saturation was always high even in summer months. The decreased of TOU and ammonia and silicate fluxes at high levels of turbidity can be explained by the dilution of sediment organic material re-suspended in the water column particularly in winter time when water productivity is low and sediment organic matter is refractory (Tengberg et al., 2003). Hence, our results suggest that resuspension events can impact the sediment biogeochemistry in different ways depending on the sediment properties and the sources of organic matter. The effect of turbidity on sediment remineralisation is controversial in the literature. Turbidity is a measurement used to indicate the occurrence of resuspension due to physical processes such as weather conditions and tidal currents or anthropogenic perturbations such as trawling. Hydrodynamic forces can influence both cohesive sediment, changing the thickness of the diffusive boundary layer (e.g., Tengberg et al., 2003), and permeable sand, inducing advective pore water transport (Huettel and Gust, 1992). Resuspension can also impact the sediment biogeochemistry involving both organic matter and fine sediment particle transport in less turbulent zones (Creutzberg et al., 1984; Jenness and Duineveld, 1985; Jonsson et al., 1990) and playing an important role in unclogging or “re-setting” permeable sands (Cook et al., 2007; Glud, 2008; Zetsche et al., 2012). Almroth et al. (2009) showed a clear enhancement of oxygen consumption rates due to simulated resuspension events in chamber incubation experiments however, no effects on silicate fluxes were found. A decreasing in ammonia effluxes were also measured in 50% of the incubation replicates when the bottom water oxygen concentration was low (see also Rasmussen and Jørgensen, 1992) and between accumulating and dispersive sites. Low oxygen concentrations in the water column were never present in our study area. The increased stirring speed, used to simulate the resuspension event, can reduce the thickness of the diffuse boundary layer raising the oxygen penetration depth in the sediment and determining the oxidation of reduced inorganic compounds which stimulated the oxygen consumption (Jørgensen and Des Marais, 1990).
Sediment Permeability
In our regression models, releases of ammonia and silicate and oxygen consumption by the sediment decreased with an increase in permeability (Figures 8D,H,L), although the effect of this explanatory variable on ammonia flux was weakly significant (p < 0.05).
Higher fluxes were recorded in muddy sediments with low permeability (Station A, B, and C, k ~ 8 × 10⁻¹⁴ to 2 × 10⁻¹³ m2, Table 3, corresponding to log permeability values between −30 and −28 in Figure 8). These high fluxes are determined by the high labile and refractory OM concentrations present in these fine-grained deposition sediments (Figure 4). Fine-medium sandy sediments (Stations D and E, k ~ 1 × 10⁻¹² m2, Table 3, corresponding to log permeability values between −28 and −25 in Figure 8) showed reduced TOU, ammonia and silicate fluxes. These two stations were very different with respect to grain size distribution (Table 1), but the high mud content (15.3%) in station E decreased the expected permeability for gravelly medium sand (median grain size of 0.312 mm) to the same level of fine sand (median grain size of 0.212 mm) with low mud content (6.3%). Several factors can determine this decline in sediment fluxes.
In the case of ammonia, the higher fluxes measured in low permeable sands (Figure 6, station A, B, and E) could be explained by lower nitrification rates, restricted to the uppermost sediment horizon, due to the reduced oxygen penetration in these sediments (Janssen et al., 2005). This is confirmed by ammonia pore water concentrations that, over all samplings, were lower in sandy sediments (stations D and F) than muddy sediments (stations A, B, and C; Figure 7; see also nitrate discussion). Ammonia pore water profiles (Figure 7) showed increasing concentrations until ~2 cm depth and remained generally constant below this horizon.
In the last 20 years, solute transport processes such as advection and bioturbation have also been identified as main drivers of sediment remineralisation in permeable sands, following the new perception of the importance of sandy sediment for organic matter mineralisation (Huettel and Gust, 1992; Boudreau et al., 2001; Ehrenhauss and Huettel, 2004; Janssen et al., 2005). Around 70% of the coastal shelf is covered by relict sands (Emery, 1969) and more than 50% of them are characterized by high permeability in the superficial layer (k > 5 × 10⁻¹² m2; Huettel and Gust, 1992). We now know that high permeability leads to pore water advection transport in the sediment which can increase organic matter remineralisation rates (Ehrenhauss et al., 2004; Janssen et al., 2005; Bühring et al., 2006) supplying electron acceptors (oxygen and sulfate; e.g., Huettel and Gust, 1992) in the deeper sediment layers and removing heterotrophic metabolism products (carbon dioxide and nutrients; Huettel et al., 1998).
Because of the low permeability of sediments at most of the stations sampled (Table 3), we did not consider simulating an advection effect in incubation experiments. However, the non-advective stirring setting applied in our experiments probably resulted in an underestimation of TOU and silicate fluxes in stations with permeability in the top 5 cm log transformed greater than -28 (corresponding to k > 1 × 10⁻¹² m2) where pressure gradients allow sediment advective transport (e.g., Janssen et al., 2005). Janssen et al. (2005) did not find a significant effect of the stirrer setting on nutrient fluxes; however, the number of replicates used for the comparison was low. Conversely, Ehrenhauss and Huettel (2004) found that the silicate fluxes increased over four times in medium and coarse sand when stirrer settings were applied. However, that is not the case of ammonia fluxes where an increase of oxygen availability by advection can increase the denitrification rates with sediment ammonia reduction.
In our dataset the presence of advection in medium sand is confirmed by the strong differences found in the pore water silicate profiles between stations (Figure 7, summer 2009) with concentrations three times higher in very fine sand (station A) compared to medium sand (station F). These trends are determined by the increase of advective pore water exchange at high sediment permeability (Huettel and Gust, 1992) and the consequent decrease of pore water nutrient concentrations: high advective flushing rates prevent the built-up of silicate concentrations in the pore water (Ehrenhauss et al., 2004; Ehrenhauss and Huettel, 2004).
TOU and Nutrient Sediment-Water Fluxes
The overall correlation between sediment oxygen and nutrient annual fluxes showed a strong coupling between oxygen, ammonia and silicate fluxes (Table 5, Pearson correlation ≥0.6) indicating that the deposition of diatom bloom material on the sediment activated the benthic activity (oxygen uptake and flux of ammonia) and the organic matter remineralisation with the release of silicate (flux of silicate). Negative correlation signs indicated opposite direction fluxes (e.g., sediment oxygen consumption and ammonia and silicate releases).
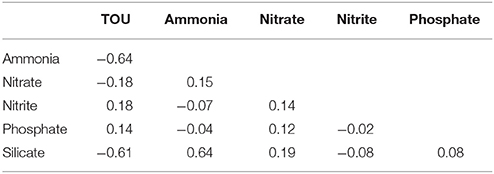
Table 5. Pearson pairwise correlation values between sediment oxygen and nutrient annual fluxes.
The high silicate sediment mean fluxes measured (Figure 6F) confirmed that, because the low impact of zooplankton grazing on the diatom spring bloom (Wollast, 1991) and the slow rate of biogenic silica remineralisation by inorganic dissolution within the water column (Schrader and Schuette, 1981), the benthic regeneration is particularly important for silicate cycling (Richardson et al., 2000).
Nitrate, nitrate, and phosphate fluxes were not correlated with the oxygen consumption because these components are involved in other biogeochemical reactions which can postpone their release (e.g., phosphate sediment adsorption) or result in a net loss (e.g., denitrification).
Nitrate and Nitrite Sediment-Water Fluxes
The mean flux values of nitrate and nitrite were markedly lower than for ammonia. Fluxes of both compounds were highest, but also most variable at station E (Figures 6I,J), but these measurements were based only on 1 sampling month (September-08). The high values and variability of oxidized nitrogen fluxes measured in this station could be due to the heterogeneous grain size distributions at the site (gravelly medium muddy sand with pebbles) with median grain size similar to other sandy stations (D and F) but with a higher percentage of mud (Figures 5E,F) and the presence of sand and pebbles in the upper horizons. The presence of large polychaetes recorded in one core it could have also determined the high variability between replicates. The patchy grain size distribution in this station, with high fractions of fine-grained material that can lead to high organic matter load (Figures 4A,B; Winterwerp and van Kesteren, 2004) together with a high oxygen availability in the sediment surface due to bio-geo-roughness (Huettel and Gust, 1992), could explain the high and variable nitrate and nitrite fluxes measured.
Nitrate and nitrite fluxes measured at station E were excluded from the regression model datasets due to the high variability and infrequent sampling. The effect of temperature on nitrate modeled fluxes was similar to those found for ammonia and silicate; however, the nitrate flux decreased with increasing sediment Chl-a content perhaps indicating higher nitrate consumption by denitrification with increase of fresh organic matter. Temperature can influence the nitrification rates by affecting the process kinetics (Zhu and Chen, 2002) and the growth of the two step nitrification bacteria (e.g., Nitrosomonas and Nitrobacter for ammonia oxidation and nitrite oxidation, respectively; Knowles et al., 1965).
Nitrate pore water concentrations increased with the sediment median grain size (from very fine muddy sand in station A to medium sand station F; Figure 7) indicating higher nitrification rates in permeable sand with high oxygen availability (e.g., Jørgensen and Sørensen, 1985; Huettel et al., 1998; Ehrenhauss and Huettel, 2004; Janssen et al., 2005). Nitrate profiles showed a steep decline in nitrate with sediment depth, indicating the presence of a denitrification process that quickly consumed nitrate in the top 5 cm. In agreement with previous studies, the highest nitrate values detected in the upper horizons of sandy stations (D and F) in winter corresponded to the lowest ammonia pore water concentrations (Lohse et al., 1993, 1995). In any case, the release of nitrate seemed to be occurring in a thin layer at the sediment water interface (within 1 and 2 cm for muddy and sandy sediment, respectively). High denitrification rates could explain the low nitrate sediment fluxes (0.001 ± 0.26 mmol m−2 d−1). However, considering the high nitrate concentrations in the upper horizons of sandy sediments (Station D, F, and G), we did not measure the expected positive and higher fluxes of this nutrient in these sites. As previously explained, this can be determined by the non-advective stirring setting applied in the incubation chambers: advection transport processes can in fact increase nitrification rates by supplying oxygen to deeper horizons in sandy substrate with permeability values exceeding 10−11–10−12 m2 (e.g., Janssen et al., 2005). For these reasons we might have underestimated the nitrate fluxes at station F and G.
Phosphate Sediment-Water Fluxes
The phosphate regression model identified water column turbidity as a strong explanatory variable but explained only 20% of the flux patterns. The phosphate biogeochemistry in the water-sediment interface can be affected by many natural and anthropogenic variables that can determine a switch from positive to negative sediment fluxes and vice versa. During the 1990's a ban on the use of washing powders containing phosphate was imposed in the southern Bight of the North Sea to reduce the expected increase of primary producer biomass (Rousseau, 2000). However, the decrease of phosphate loads did not lead to an observable decrease of phytoplankton biomass, in part, because the estuarine sediments released phosphate to the water column counterbalancing the decrease of external loadings. The effect was such that the Scheldt estuary shifted from acting as a sink of phosphate in 1980s to a source since the 1990s Soetaert et al. (2006).
In this study, we estimated a mean net phosphate flux of −0.015±0.09 mmol m−2 d−1; Figure 6E) implying a net uptake by the sediment. Suspended sediments have long been known to influence concentrations of dissolved phosphorus: the high turbidity we recorded in winter signified the occurrence of resuspension events causing sediment phosphate release (e.g., Søndergaard et al., 1992; Sundby et al., 1992; Holmroos et al., 2009). However, its effect is complicated. Adsorption on oxidized surface sediment is an important factor affecting phosphate availability, and can lead to net uptake of phosphate by sediments (Sundby et al., 1992). Re-suspended particles can in fact release, absorb or have no effect on soluble reactive phosphorus depending on water and particle phosphate concentrations (Søndergaard et al., 1992) and water pH, with release driven by high pH values (Koski-Vähälä and Hartikainen, 2001). In oxic conditions, the sediment is generally a sink of phosphate which co-precipitates with iron and manganese oxides; the occurrence of anoxic conditions, often present in semi-enclosed stratified waters in late summer and in deep sediment horizons, can determine sediment phosphate release (Carman and Wulff, 1989; Sundby et al., 1992). The regression model explained a low percentage of the deviance because it described only the winter release of phosphate, however, once again we could be underestimating the phosphate flux due to the lack of a stirring system that simulates the effect of resuspension in incubation chambers (Almroth et al., 2009). None of the other potential explanatory variables explained the recorded sediment phosphate sink patterns (phosphate fluxes below zero). Overall, bottom water concentrations at the sampling stations seemed to be related to sediment phosphate fluxes with periods of sediment uptake corresponding to decreasing concentrations in the water column. The transport of phosphate from water to sediment, recorded in July and August 2008, can be influenced by sediment adsorption stimulated by a high density of bioirrigating fauna that increase the sediment oxygenation (Clavero et al., 1994; Wood et al., 2009).
The phosphate release from iron and manganese oxides in anoxic conditions (Sundby et al., 1992) is also confirmed by higher phosphate pore water concentrations in cohesive-muddy stations (A and B) compared to sandy permeable stations (D and F; Figure 7). Pore water profiles also showed that phosphate concentrations remained constant down to 10 cm sediment depth in sandy stations D and F (Figure 7) indicating the lack of iron and manganese reductions within these depths. Conversely, muddy stations A and B showed an increase of phosphate with sediment depth until 5–6 cm depth and remained constant below these horizons indicating that iron and manganese reduction dominated the organic matter mineralisation pathways in the upper sediment layers in these stations (Fenchel and Jørgensen, 1977; Froelich et al., 1979; Sundby et al., 1992).
Conclusions
The purpose of our study was to statistically disentangle the multiple factors controlling the seasonal and spatial variability in nutrient regeneration rates. What we have shown is that sediment-water fluxes of oxygen and macro-nutrients (nitrate, nitrite, ammonia, phosphate, and silicate) are affected differently by sediment properties and environmental driving conditions. This means that the stiochiometry of nutrient regeneration is not fixed and may vary spatially and temporally depending on conditions. This conclusion has implications for the identification sensitive “hot-spots” for biogeochemistry which may require protection from disturbance.
Author Contributions
NS developed the sampling design, collected the sample, carried out the analysis and interpretation of the data, and drafted the manuscript. UW contributed to the data analysis and results interpretation, critically revised this study for important intellectual content, and work on the final approval of the version to be published. MH made a major contribution to the research conception, sampling design, sample collections, and results interpretation. He also critically revised this study for important intellectual contents and worked on the final approval of the version to be published.
Funding
This work was co-funded by the Marine Scotland—Science Laboratory Aberdeen, and University of Aberdeen, through the joint Fisheries Research Fund. In addition, the authors acknowledge the support of the MASTS pooling initiative (The Marine Alliance for Science and Technology for Scotland) in the completion of this study. MASTS is funded by the Scottish Funding Council (grant reference HR09011) and contributing institutions.
Conflict of Interest Statement
The authors declare that the research was conducted in the absence of any commercial or financial relationships that could be construed as a potential conflict of interest.
The handling Editor declared a past co-authorship with one of the authors, MH and states that the review process nevertheless met the standards of a fair and objective review.
Acknowledgments
Our thanks to the captain and crew of the research vessel “Temora,” and to our colleagues who have assisted with various aspects of the work at sea and in the laboratory, especially John Dunn and Steve Hay. Thanks also to Doug Webster for his help with the design and realization of the “falling head/constant head” system to measure sediment permeability.
References
Abeare, S. M. (2009). Comparisons of Boosted Regression Tree, GLM and GAM Performance in the Standardization of Yellowfin Tuna Catch-Rate Data from the Gulf of Mexico Longline Fishery. Ph.D. thesis, University of Pretoria, Gauteng, South Africa.
Almroth, E., Tengberg, A., Andersson, J. H., Pakhomova, S., and Hall, P. O. J. (2009). Effects of resuspension on benthic fluxes of oxygen, nutrients, dissolved inorganic carbon, iron and manganese in the Gulf of Finland, Baltic Sea. Cont. Shelf Res. 29, 807–818. doi: 10.1016/j.csr.2008.12.011
Banta, G. T., Giblin, A. E., Hobbie, J. E., and Tucker, J. (1995). Benthic respiration and nitrogen release in Buzzards Bay, Massachusetts. J. Mar. Res. 53, 107–135. doi: 10.1357/0022240953213287
Beck, M., Dellwig, O., Liebezeit, G., Schnetger, B., and Brumsack, H. J. (2008). Spatial and seasonal variations of sulphate, dissolved organic carbon, and nutrients in deep pore waters of interstitial flat sediments. Estuar. Coast. Shelf Sci. 79, 307–316. doi: 10.1016/j.ecss.2008.04.007
Bianchi, T. S., Johansson, B., and Elmgren, R. (2000). Breakdown of phytoplankton pigments in Baltic sediments: effects of anoxia and loss of deposit-feeding macrofauna. J. Exp. Mar. Biol. Ecol. 251, 161–183. doi: 10.1016/S0022-0981(00)00212-4
Boudreau, B. P., Huettel, M., Forster, S., Jahnke, R. A., McLachlan, A., Middelburg, J. J., et al. (2001). Permeable marine sediment: overturning an old paradigm. EOS Trans. Am. Geophys. Union 82, 133–136. doi: 10.1029/EO082i011p00133-01
Bühring, S. I., Ehrenhauss, S., Kamp, A., Moodley, L., and Witte, U. (2006). Enhanced benthic activity in sandy sublittoral sediments: evidence from C-13 tracer experiments. Mar. Biol. Res. 2, 120–129. doi: 10.1080/17451000600678773
Canfield, D. E. (1993). “Organic matter oxidation in marine sediments,” in Interactions of C, N, P, and S. Biogeochemical Cycles and Global Change, eds R. Wollast, F. T. MacKenzie, and L. Chou (Berlin: Springer), 333–363.
Cardenas, M. B., Cook, P. L. M., Jiang, H., and Traykovski, P. (2008). Constraining denitrification in permeable wave-influenced marine sediment using linked hydrodynamic and biogeochemical modelling. Earth Planet. Sci. Lett. 275, 127–137. doi: 10.1016/j.epsl.2008.08.016
Carman, R., and Wulff, F. (1989). Adsorption capacity of phosphorus in Baltic Sea sediments. Estuar. Coast. Shelf Sci. 29, 447–456. doi: 10.1016/0272-7714(89)90079-6
Cawley, G. C., and Talbot, N. L. C. (2010). On over-fitting in model selection and subsequent selection bias in performance evaluation. J. Mach. Learn. Res. 11, 2079–2107. Available online at: http://www.jmlr.org/papers/volume11/cawley10a/cawley10a.pdf
Clavero, V., Niell, F. X., and Fernandez, J. A. (1994). A laboratory study to quantify the influence of Nereis diversicolor O. F. Müller, in the exchange of phosphate between sediment and water. J. Exp. Mar. Biol. Ecol. 176, 257–267.
Conley, D. J., and Johnstone, R. W. (1995). Biogeochemistry of N, P and Si in Baltic Sea sediments: response to a simulated deposition of a spring bloom. Mar. Ecol. Prog. Ser. 122, 265–276. doi: 10.3354/meps122265
Cook, P. M. L., Wenzhöfer, F., Glud, R. N., Janssen, F., and Huettel, M. (2007). Benthic solute exchange and carbon mineralisation in two shallow subtidal sandy sediments: effect of advective pore-water exchange. Limnol. Oceanogr. 52, 1943–1963. doi: 10.4319/lo.2007.52.5.1943
Creutzberg, F., Wapenaar, P., Duineveld, G., and Lopez, N. (1984). Distribution and density of the benthic fauna in the southern North Sea in relation to bottom characteristics and hydrographic conditions. Rapp. P.-v. Réun. Cons. Int. Explor. Mer 183, 101–110.
Dahllöf, I., and Karle, I. M. (2005). Effect on marine sediment nitrogen fluxes caused by organic matter enrichment with varying organic matter structure and nitrogen content. Mar. Chem. 94, 17–26. doi: 10.1016/j.marchem.2004.07.008
Dedman, S., Officer, R., Brophy, D., Clarke, M., and Reid, D. G. (2015). Modelling abundance hotspots for data-poor Irish Sea rays. Ecol. Model. 312, 77–90. doi: 10.1016/j.ecolmodel.2015.05.010
Dixit, S., Van Cappellen, P., and van Bennekon, A. J. (2001). Process controlling solubility of biogenic silica and pore water build-up of silicic acid in marine sediments. Mar. Chem. 73, 333–352. doi: 10.1016/S0304-4203(00)00118-3
Ehrenhauss, S., and Huettel, M. (2004). Advective transport and decomposition of chain-forming planktonic diatoms in permeable sediments. J. Sea Res. 52, 179–197. doi: 10.1016/j.seares.2004.01.004
Ehrenhauss, S., Witte, U., Janssen, F., and Huettel, M. (2004). Decomposition of diatoms and nutrient dynamics in permeable North Sea sediments. Cont. Shelf Res. 24, 721–737. doi: 10.1016/j.csr.2004.01.002
Eppley, R. W., and Peterson, B. J. (1979). Particulate organic matter flux and planktonic new production in the deep ocean. Nature 282, 677–680. doi: 10.1038/282677a0
Fenchel, T., and Jørgensen, B. B. (1977). “Detritus food chains of aquatic systems: the role of bacteria,” in Advances in Microbial Ecology, ed M. Alexander (New York, NY: Plenum Press), 1–58.
Folk, R. L. (1954). The distinction between grain size and mineral composition in sedimentary rock nomenclature. J. Geol. 62, 344–359.
Froelich, P. N., Klinkhammer, G. P., Bender, M. L., Luedtke, N. A., Heath, G. R., Cullen, D., et al. (1979). Early oxidation of organic matter in pelagic sediment of eastern equatorial Atlantic: suboxic diagenesis. Geochim. Cosmochim. Acta 43, 10758–11090. doi: 10.1016/0016-7037(79)90095-4
Furlong, E. T., and Carpenter, R. (1988). Pigment preservation and remineralization in oxic coastal marine sediments. Geochim. Cosmochim. Acta 52, 87–99. doi: 10.1016/0016-7037(88)90058-0
Glud, R. N. (2008). Oxygen dynamics of marine sediments. Mar. Biol. Res. 4, 243–289. doi: 10.1080/17451000801888726
Glud, R. N., Berg, P., Hume, A., Batty, P., Blicher, M. E., Lennert, K., et al. (2010). Benthic O2 exchange across hard-bottom substrates quantified by eddy correlation in a sub-Arctic fjord. Mar. Ecol. Prog. Ser. 417, 1–12. doi: 10.3354/meps08795
Grasshoff, K., Kremling, K., and Ehrhardt, M. (1999). Methods of Seawater Analysis. Weinheim; New York, NY; Chichester; Brisbane, QLD; Singapore; Toronto, ON: Wiley-VCH.
Grenz, C., Cloern, J. E., Hager, S. W., and Cole, B. E. (2000). Dynamics of nutrient cycling and related benthic nutrient and oxygen fluxes during a spring phytoplankton bloom in South San Francisco Bay (USA). Mar. Ecol. Prog. Ser. 197, 67–80. doi: 10.3354/meps197067
Griggs, W. (2013). Penalized Spline Regression and its Applications. Whitman College Report. Available online at: https://www.whitman.edu/Documents/Academics/Mathematics/Griggs.pdf
Hall, P. O. J., Anderson, L. G., Rutgers van der Loeff, M. M., Sundby, B., and Westerlund, S. F. G. (1989). Oxygen uptake kinetics in the benthic boundary layer. Limnol. Oceanogr. 34, 734–746. doi: 10.4319/lo.1989.34.4.0734
Holmroos, H., Niemisto, J., Weckström, K., and Horppila, J. (2009). Seasonal variation of resuspension-mediated aerobic release of phosphorous. Boreal Environ. Res. 14, 937–946. Available online at: http://www.borenv.net/BER/pdfs/ber14/ber14-937.pdf
Huettel, M., and Gust, G. (1992). Impact of bioroughness on the interfacial solute exchange in permeable sediments. Mar. Ecol. Prog. Ser. 89, 253–267. doi: 10.3354/meps089253
Huettel, M., and Rusch, A. (2000). Transport and degradation of phytoplankton in permeable sediment. Limnol. Oceanogr. 45, 534–549. doi: 10.4319/lo.2000.45.3.0534
Huettel, M., Ziebis, W., Forster, S., and Luther, G. W. (1998). Advective transport affecting metal and nutrient distributions and interfacial fluxes in permeable sediments. Geochim. Cosmochim. Acta 62, 613–631. doi: 10.1016/S0016-7037(97)00371-2
Janssen, F., Huettel, M., and Witte, U. (2005). Pore-water advection and solute fluxes in permeable marine sediment (II): benthic respiration at three sandy sites with different permeabilities (German Bight, North Sea). Limnol. Oceanogr. 50, 779–792. doi: 10.4319/lo.2005.50.3.0779
Jenness, M. I., and Duineveld, G. C. A. (1985). Effects of tidal currents on chlorophyll a content of sandy sediments in the southern North Sea. Mar. Ecol. Prog. Ser. 21, 283–287. doi: 10.3354/meps021283
Jonsson, P., Carman, R., and Wulff, F. (1990). Laminated sediment in the Baltic – a tool for evaluating nutrient mass balances. Ambio 19, 152–158.
Jørgensen, B. B. (1977). The sulfur cycle of a coastal marine sediment (Limfjorden, Denmark). Limnol. Oceanogr. 22, 814–832. doi: 10.4319/lo.1977.22.5.0814
Jørgensen, B. B. (1996). “Material flux in the sediment,” in Eutrophication in Coastal Marine Ecosystems, eds B. B. Jargensen and K. Richardson (Washington, DC: American Geophysical Union), 115–135.
Jørgensen, B. B., and Des Marais, J. D. (1990). The diffusive boundary layer of sediments: oxygen microgradients over a microbial mat. Limnol. Oceanogr. 35, 1343–1355. doi: 10.4319/lo.1990.35.6.1343
Jørgensen, B. B., and Revsbech, N. P. (1985). Diffusive boundary layers and the oxygen uptake of sediments and detritus. Limnol. Oceanogr. 30, 111–122. doi: 10.4319/lo.1985.30.1.0111
Jørgensen, B. B., and Sørensen, J. (1985). Seasonal cycles of O2, and reduction in estuarine sediment- the significance of a reduction maximum in spring. Mar. Ecol. Prog. Ser. 24, 65–74. doi: 10.3354/meps024065
Kamann, P. J., Ritzi, R. W., Dominic, D. F., and Conrad, C. M. (2007). Porosity and permeability in sediment mixtures. Ground Water 45, 429–438. doi: 10.1111/j.1745-6584.2007.00313.x
Kanneworff, E., and Christensen, H. (1986). Benthic community respiration in relation to sedimentation of phytoplankton in the Øresund. Ophelia 26, 269–284 doi: 10.1080/00785326.1986.10421993
Klute, A., and Dirksen, C. (1986). “Hydraulic conductivity and diffusivity: laboratory methods,” in Methods of Soil Analysis – Part 1 – Physical and Mineralogical Methods, ed A. Klute (Madison3, WI: Soil Science Society of America (SSSA)/American Society of Agronomy, Inc. (ASA)), 687–703.
Knowles, G., Downing, A. L., and Barret, M. J. (1965). Determination of kinetic constants for nitrifying bacteria in mixed culture, with the aid of an electronic computer. J. Gen. Microbiol. 38, 268–278. doi: 10.1099/00221287-38-2-263
Koop, K., Boynton, W. R., Wulff, F., and Carman, R. (1990). Sediment-water oxygen and nutrient exchanges along a depth gradient in the Baltic Sea. Mar. Ecol. Prog. Ser. 63, 65–77. doi: 10.3354/meps063065
Koski-Vähälä, J., and Hartikainen, H. (2001). Assessment of the risk of phosphorus loading due to resuspended sediment. J. Environ. Qual. 30, 960–966. doi: 10.2134/jeq2001.303960x
Lohse, L., Malschaert, J. F. P., Slomp, C. P., Helder, W., and van Raaphorst, W. (1993). Nitrogen cycling in North Sea sediments: interaction of denitrification and nitrification in offshore and coastal areas. Mar. Ecol. Prog. Ser. 101, 283–296. doi: 10.3354/meps101283
Lohse, L., Malschaert, J. F. P., Slomp, C. P., Helder, W., and van Raaphorst, W. (1995). Sediment-water fluxes of inorganic nitrogen compounds along the transport route of organic matter in the North Sea. Ophelia 41, 173–197. doi: 10.1080/00785236.1995.10422043
Magni, P., Montani, S., Takada, C., and Tsutsumi, H. (2000). Temporal scaling and relevance of bivalve nutrient excretion on a tidal flat of the Seto Inland Sea, Japan. Mar. Ecol. Prog. Ser, 198, 139–155. doi: 10.3354/meps198139
Na, T., Gribsholt, B., Galaktionov, O. S., Lee, T., and Meysman, F. J. R. (2008). Influence of advective bio-irrigation on carbon and nitrogen cycling in sandy sediments. J. Mar. Res. 66, 691–722. doi: 10.1357/002224008787536826
Nixon, S. W. (1981). “Remineralization and nutrient cycling in coastal marine ecosystems,” in Estuaries and Nutrients, eds B. J. Neilson and L. E. Cronin (Clifton, NJ: Humana Press), 111–138.
Pamatmat, M. M., and Banse, K. (1969). Oxygen consumption by the seabed. II. In situ measurement to a depth of 180 m. Limnol. Oceanogr. 14, 250–259. doi: 10.4319/lo.1969.14.2.0250
Pomroy, A. J., Joint, I. R., and Clarke, K. R. (1983). Benthic nutrient flux in a shallow coastal environment. Oecologia (Berl.) 60, 306–312. doi: 10.1007/BF00376843
Rasmussen, H., and Jørgensen, B. B. (1992). Microelectrode studies of seasonal oxygen uptake in a coastal sediment: role of molecular diffusion. Mar. Ecol. Prog. Ser. 81, 289–303. doi: 10.3354/meps081289
Richardson, K., Visser, A. W., and Pedersen, F. B. (2000). Subsurface phytoplankton blooms fuel pelagic production in the North Sea. J. Plankton Res. 22, 1663–1671. doi: 10.1093/plankt/22.9.1663
Rousseau, V. (2000). Dynamics of Phaeocystis and Diatom Blooms in the Eutrophicated Coastal Waters of the Southern Bight of the North Sea. Ph.D. thesis, Université Libre de Bruxelles, Belgium.
Rutgers van der Loeff, M. M. (1980). Nutrients in the interstitial waters of the Southern Bight of the North Sea. J. Sea Res. 14, 144–171. doi: 10.1016/0077-7579(80)90019-8
Schrader, H. J., and Schuette, G. (1981). “Marine Diatoms,” in The Oceanic Lithosphere: The Sea, ed C. Emiliani (New York, NY: John Wiley and Sons), 1179–1232.
Serpetti, N., Heath, M. R., Armstrong, E., and Witte, U. (2011). Blending single beam RoxAnn and multi-beam swathe QTC hydro-acoustic discrimination techniques for the Stonehaven area, Scotland, UK. J. Sea Res. 65, 442–455. doi: 10.1016/j.seares.2011.04.001
Serpetti, N., Heath, M. R., Rose, M., and Witte, U. (2012). Mapping organic matter in seabed sediments off the north-east coast of Scotland (UK) from acoustic reflectance data. Hydrobiologia 680, 265–284. doi: 10.1007/s10750-011-0937-4
Soetaert, K., Middelburg, J. J., Heip, C., Meire, P., van Damme, S., and Maris, T. (2006). Long-term change in dissolved inorganic nutrients in the heterotrophic Scheldt estuary (Belgium, The Netherlands). Limnol. Oceanogr. 51, 409–423. doi: 10.4319/lo.2006.51.1_part_2.0409
Søndergaard, M., Kristensen, P., and Jeppesen, E. (1992). Phosphorous release from resuspended sediment in the shallow and wind-exposed Lake Arresø, Denmark. Hydrobiologia 228, 91–99. doi: 10.1007/BF00006480
Stephens, M. P., Kadko, D. C., Smith, C. R., and Latasa, M. (1997). Chlorophyll-a and pheopigments as tracers of labile organic carbon at the central equatorial Pacific seafloor. Geochim. Cosmochim. Acta 61, 4605–4619. doi: 10.1016/S0016-7037(97)00358-X
Strickland, J. D. H., and Parsons, T. R. (1972). A practical handbook of seawater analysis. Bull. Fish. Res. Board. Canada 167, 207–211.
Sun, M.-Y., Aller, R. C., and Lee, C. (1991). Early diagenesis of chlorophyll-a in Long Island Sound sediments: a measure of carbon flux and particle reworking. J. Mar. Res. 49, 379–401. doi: 10.1357/002224091784995927
Sun, M.-Y., Lee, C., and Aller, R. C. (1993). Anoxic and oxic degradation of 14C-labelled chloropigments and a 14C-labelled diatom in Long Island Sound sediments. Limnol. Oceanogr. 38, 1438–1451. doi: 10.4319/lo.1993.38.7.1438
Sundby, B., Gobeil, C., Silverberg, N., and Mucci, A. (1992). The phosphorus cycle in coastal marine sediments. Limnol. Oceanogr. 37, 1129–1145. doi: 10.4319/lo.1992.37.6.1129
Tengberg, A., Almroth, E., and Hall, P. (2003). Resuspension and its effects on organic carbon recycling and nutrient exchange in coastal sediments: in situ measurements using new experimental technology. J. Exp. Mar. Biol. Ecol. 285, 119–142. doi: 10.1016/S0022-0981(02)00523-3
Thamdrup, B., Hansen, J. W., and Jørgensen, B. B. (1998). Temperature dependence of aerobic respiration in coastal sediment. FEMS Microbiol. Ecol. 25, 189–200. doi: 10.1111/j.1574-6941.1998.tb00472.x
Trimmer, M., Gowen, R. J., and Stewart, B. M. (2003). Changes in sediment processes across the western Irish Sea front. Estuar. Coast. Shelf Sci. 56, 1011–1019. doi: 10.1016/S0272-7714(02)00312-8
Udden, J. A. (1914). Mechanical composition of clastic sediments. Geol. Soc. Am. Bull. 25, 655–744. doi: 10.1130/GSAB-25-655
Volkenborn, N., Polerecky, L., Hedtkamp, S. I. C., van Beusekom, E. E., and de Beer, D. (2007). Bioturbation and bioirrigation extend the open exchange regions in permeable sediments. Limnol. Oceanogr. 52, 1898–1909. doi: 10.4319/lo.2007.52.5.1898
Wentworth, C. K. (1922). A scale of grade and class terms for clastic sediments. J. Geol. 30, 377–392. doi: 10.1086/622910
Winterwerp, J. C., and van Kesteren, W. G. M. (2004). Introduction to the Physics of Cohesive Sediment in Marine Environment. Oxford: Elsevier B.V.
Wollast, R. (1991). “The coastal organic carbon cycle: fluxes, sources, and sinks,” in Ocean Margin Processes in Global Change, eds R. F. C. Mantoura, J. M. Martin, and R. Wollast (Chichester: Wiley), 365–381.
Wollast, R. (1998). “Evaluation and comparison of the global carbon cycle in the coastal zone and in the open ocean,” in The Sea: The Global Coastal Ocean: Processes and Methods, Vol. 10, eds K. H. Brink and A. R. Robinson (New York, NY: John Wiley and Sons), 213–252.
Wood, H. L., Widdicombe, S., and Spicer, J. I. (2009). The influence of hypercapnia and the infaunal brittlestar Amphiura filiformis on sediment nutrient flux – will ocean acidification affect nutrient exchange? Biogeosciences 6, 2015–2024. doi: 10.5194/bg-6-2015-2009
Wood, S. N. (2003). Thin plate regression splines. J. R. Stat. Soc. Series B Stat. Methodol. 65, 95–114. doi: 10.1111/1467-9868.00374
Zetsche, E. M., Bulling, M. T., and Witte, U. (2012). Permeability of intertidal sandflats: impact of temporal variability on sediment metabolism. Cont. Shelf Res. 42, 41–50. doi: 10.1016/j.csr.2012.04.020
Zhu, S., and Chen, S. (2002). The impact of temperature on nitrification rates in fixed film biofilters. Aquat. Eng. 26, 221–237. doi: 10.1016/S0144-8609(02)00022-5
Ziebis, W., Hüettel, M., and Fosters, S. (1996). Impact of biogenic sediment topography on oxygen fluxes in permeable seabeds. Mar. Ecol. Prog. Ser. 140, 227–237. doi: 10.3354/meps140227
Keywords: benthic mineralization, sediment oxygen flux, sediment nutrient fluxes, temperature, chlorophyll-a, permeability, turbidity, general additive models
Citation: Serpetti N, Witte UFM and Heath MR (2016) Statistical Modeling of Variability in Sediment-Water Nutrient and Oxygen Fluxes. Front. Earth Sci. 4:65. doi: 10.3389/feart.2016.00065
Received: 16 February 2016; Accepted: 23 May 2016;
Published: 08 June 2016.
Edited by:
Sandra Arndt, University of Bristol, UKReviewed by:
Doug LaRowe, University of Southern California, USAPerran Louis Miall Cook, Monash University, Australia
Copyright © 2016 Serpetti, Witte and Heath. This is an open-access article distributed under the terms of the Creative Commons Attribution License (CC BY). The use, distribution or reproduction in other forums is permitted, provided the original author(s) or licensor are credited and that the original publication in this journal is cited, in accordance with accepted academic practice. No use, distribution or reproduction is permitted which does not comply with these terms.
*Correspondence: Natalia Serpetti, bmF0YWxpYS5zZXJwZXR0aUBzYW1zLmFjLnVr
†Present Address: Natalia Serpetti, Scottish Association for Marine Science, Scottish Marine Institute, Oban, Argyll, UK;
Michael R. Heath, Department of Mathematics and Statistics, University of Strathclyde, Glasgow, UK