The Early Miocene Critical Zone at Karungu, Western Kenya: An Equatorial, Open Habitat with Few Primate Remains
 William E. Lukens1*
  Thomas Lehmann2
  Daniel J. Peppe1
  David L. Fox3
  Steven G. Driese1 Kieran P. McNulty4
- 1Terrestrial Paleoclimatology Research Group, Department of Geosciences, Baylor University, Waco, TX, United States
- 2Messel Research and Mammalogy Department, Senckenberg Research Institute and Natural History Museum Frankfurt, Frankfurt, Germany
- 3Department of Earth Sciences, University of Minnesota, Minneapolis, MN, United States
- 4Department of Anthropology, University of Minnesota, Minneapolis, MN, United States
Early Miocene outcrops near Karungu, Western Kenya, preserve a range of fluvio-lacustrine, lowland landscapes that contain abundant fossils of terrestrial and aquatic vertebrates. Primates are notably rare among these remains, although nearby early Miocene strata on Rusinga Island contain a rich assemblage of fossilized catarrhines and strepsirrhines. To explore possible environmental controls on the occurrence of early Miocene primates, we performed a deep-time Critical Zone (DTCZ) reconstruction focused on floodplain paleosols at the Ngira locality in Karungu. We specifically focused on a single stratigraphic unit (NG15), which preserves moderately developed paleosols that contain a microvertebrate fossil assemblage. Although similarities between deposits at Karungu and Rusinga Island are commonly assumed, physical sedimentary processes, vegetative cover, soil hydrology, and some aspects of climate state are notably different between the two areas. Estimates of paleoclimate parameters using paleosol B horizon elemental chemistry and morphologic properties are consistent with seasonal, dry subhumid conditions, occasional waterlogging, and herbaceous vegetation. The reconstructed small mammal community indicates periodic waterlogging and open-canopy conditions. Based on the presence of herbaceous root traces, abundant microcharcoal, and pedogenic carbonates with high stable carbon isotope ratios, we interpret NG15 to have formed under a warm, seasonally dry, open riparian woodland to wooded grassland, in which at least a subset of the vegetation was likely C4 biomass. Our results, coupled with previous paleoenvironmental interpretations for deposits on Rusinga Island, demonstrate that there was considerable environmental heterogeneity ranging from open to closed habitats in the early Miocene. We hypothesize that the relative paucity of primates at Karungu was driven by their environmental preference for locally abundant closed canopy vegetation, which was likely absent at Karungu, at least during the NG15 interval if not also earlier and later intervals that have not yet been studied in as much detail.
Introduction
Early Miocene deposits in the Nyanza rift valley of East Africa preserve a rich assemblage of mammalian remains, with nearly a century of research there focused on the evolutionary context of apes (e.g., Hopwood, 1933; Andrews, 1978; Walker et al., 1993; McNulty et al., 2007, 2015). The early Miocene is recognized as a key interval in the development of anatomical and behavioral adaptations fundamental to interpreting the origin of the human lineage (Gebo et al., 1997; Michel et al., 2014; Begun, 2015; McNulty et al., 2015). These include aspects of the axial skeleton and extremities shared between early hominins and the primitive ape Ekembo (Lovejoy, 2009; Lovejoy et al., 2009a,b), frequent use of upright posture in Morotopithecus (Sanders and Bodenbender, 1994; Gebo et al., 1997; MacLatchy et al., 2000), advanced subnasal morphology in Rangwapithecus (Andrews, 1978; McNulty, 2003), and large body size and prolonged life history in Afropithecus, Ekembo, and Morotopithecus (Kelley, 1997, 2002). Further, evidence of folivory in Rangwapithecus and Morotopithecus (Kay and Ungar, 1997; MacLatchy et al., 2010; McNulty et al., 2015) and durophagy in Afropithecus (Leakey and Walker, 1997) suggest specialized dietary adaptations existed between clades and locations. Understanding the variety of paleoenvironments and paleoclimate zones in East Africa in the early Miocene is essential to differentiate the roles of environmental pressures (e.g., vegetation and climate) from biotic factors (e.g., niche partitioning, biogeography, and sexual selection) as selection mechanisms for derived traits in hominoids and apes.
Longstanding interpretations suggest that wooded or forested habitats were pervasive across eastern Africa until the late Miocene at ca. 8–10 Ma (Cerling et al., 1998; Jacobs et al., 1999, 2010; Uno et al., 2016), implying that unchanging habitats allowed biotic factors to drive evolution of early hominoid lineages through most of the early and middle Miocene. However, a few studies have indicated the presence of open canopy habitats based on environmental interpretations from paleosols and stable isotopes from early Miocene strata at Karungu and Rusinga Island in western Kenya (Bestland and Krull, 1999; Forbes et al., 2004; Driese et al., 2016). A significant proportion of C4 vegetation, which is characteristic of open canopy habitats today, has been interpreted for middle to late Miocene strata in the Tugen Hills, central Kenya (Kingston et al., 1994). These studies suggest that open canopy environments may have been important components of landscapes prior to the late Miocene.
Herein, we investigate the evidence for open canopy environments at Karungu by using paleopedology, sedimentology, and microvertebrate paleontology. Although hundreds of mammalian specimens have been recovered from Karungu (Andrews, 1911; Pickford, 1981), only a small number of the fossils are catarrhine primates, including a tooth of Dendropithecus and a few specimens identified as cf. Ekembo (Clark and Leakey, 1951; McNulty et al., 2015). Pickford (1981) argued that the mammals represented in the Karungu fauna are generally similar to fauna of Hiwegi Formation on Rusinga Island (Figure 1), which contains abundant, well-preserved fossil catarrhine primates including Dendropithecus, Ekembo, Nyanzapithecus, and Limnopithecus, (Leakey, 1943; Clark and Leakey, 1951; Kelley, 1986, 1993; Pickford, 1986; Walker et al., 1993; Harrison, 2010; Michel et al., 2014; McNulty et al., 2015). Based on assessments of the faunas at Karungu and from the entire Hiwegi Formation on Rusinga Island, Nesbit Evans et al. (1981) interpreted them to represent similar paleoecological conditions. Driese et al. (2016) argued from analyses of paleosols, sedimentology, stable isotopes, and fauna at the Ngira locality at Karungu, that the paleovegetation and paleoenvironments of Karungu were similar to the Grit and lower Fossil Bed Members of the Hiwegi Formation on Rusinga Island. Based on this similarity, Driese et al. (2016) suggested that faunal differences between Karungu and the lower Hiwegi Formation were unlikely to have been driven by paleoenvironmental differences. Forbes et al. (2004), however, used paleopedology and stable isotope analyses to interpret humid climate conditions for both Karungu and the Wayando Formation, which underlies the Hiwegi Formation on Rusinga Island. In each case, the interpretation of similar paleoenvironments at Karungu, which generally lacks primate fossils, and deposits on Rusinga Island, which preserve abundant primate fossils, suggests differences in the fossil record are due to biotic pressures or preferences rather than abiotic factors such as paleoenvironmental setting.
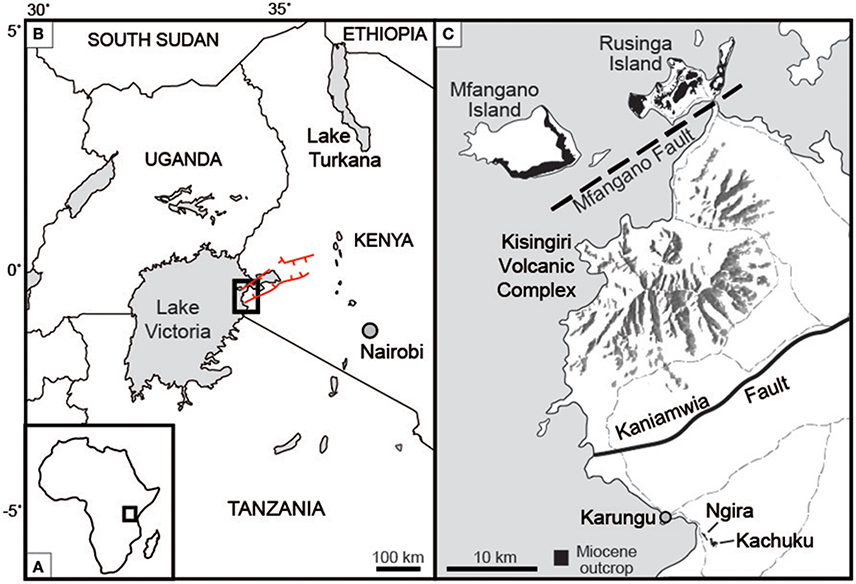
Figure 1. Location of study site (A) on the African continent, and (B) within western Kenya. Red lines indicate the boundary faults of the Nyanza rift. (C) Ngira and Kachucku together comprise the Karungu outcrop areas, located roughly 50 km south of Rusinga and Mfangano Islands. Light gray dashed lines are roads. Modified after Bestland et al. (1995), Geraads et al. (2016), and Driese et al. (2016).
We reexamine the hypothesis that differences in the abundance of primates between Karungu and Rusinga Island are driven by biotic or abiotic factors by studying an interval of paleosols at the Ngira locality in Karungu as a spatio-temporal slice through the dynamic deep-time Critical Zone (DTCZ) from western Kenya in the early Miocene (Figure 1). The Critical Zone is the net result of interactions between the lithosphere, atmosphere, hydrosphere, and biosphere, and is preserved as an integrated substrate in the pedosphere (Brantley et al., 2007). The Critical Zone concept has been translated to the terrestrial stratigraphic record through DTCZ analysis, which utilizes tools developed and applied in sedimentology, paleopedology, and paleoecology (Nordt et al., 2012; Nordt and Driese, 2013). Application of DTCZ concepts to Neogene sites in East Africa will advance the interpretive capacity of environmental and climatic variables from strata that preserve hominoid remains.
Geologic Setting
Early Miocene deposits at Karungu accumulated in a small graben on the southern flank of the Nyanza Rift system (Drake et al., 1988). Sedimentary deposits associated with the Kisingiri volcanic complex include Mfangano and Rusinga Islands, which are on the north side of the Kisingiri caldera roughly 50 km from Karungu. The Kaniamwia fault separates Miocene deposits around Karungu from Kisingiri volcaniclastics to the north (Figure 1; King et al., 1972; Drake et al., 1988; Bestland et al., 1995). Precambrian igneous and metamorphic basement surrounds the Nyanza Rift in western Kenya (Smith and Mosley, 1993).
Fossiliferous deposits at Karungu consist of two distinct outcrop areas: Ngira and Kachuku. In this study, we focus on the Ngira locality. The stratigraphy and sedimentary environments at Ngira were first documented by Oswald (1914) and were subsequently reexamined by Forbes et al. (2004) and Driese et al. (2016). We follow the stratigraphic descriptions of Driese et al. (2016), which are generally similar to the previous studies (Figure 2). The 50 m of strata at Ngira are divided into units based on major depositional packages. The base of the section is a highly weathered Vertisol with oxisolic properties and is unconformably capped by lacustrine shoreline sandstones (Driese et al., 2016). Fluvial and lacustrine facies are interstratified throughout the section and include fluvial channel sandstones, pedogenically-modified mudstones parented from alluvium and exposed lacustrine mud, and a succession of deep-water lacustrine turbidites that cap the section (Driese et al., 2016). For this study, we focus on unit 15 because it contains pedogenic features, a microfossil assemblage, and carbonate nodules, thus allowing for reconstruction of climatic and ecologic properties through multiple, independent methodologies.
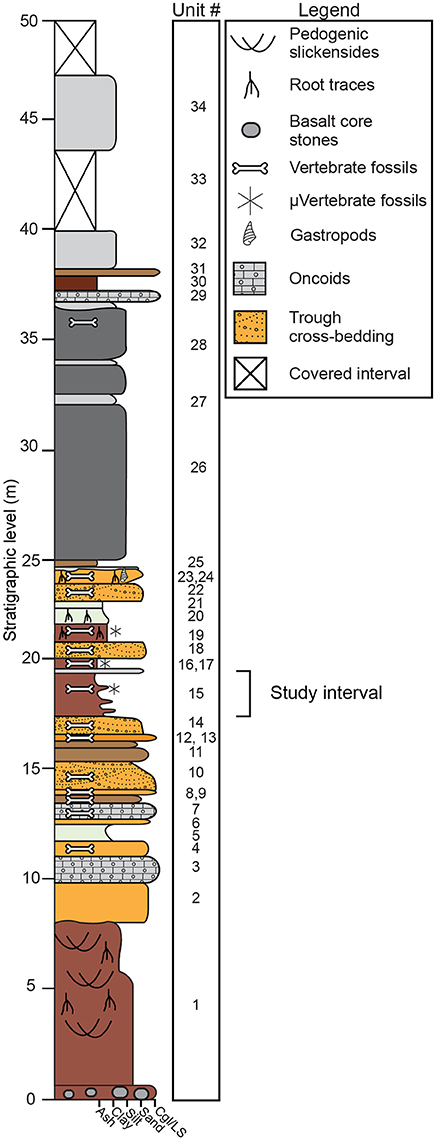
Figure 2. Stratigraphic section at Ngira (after Driese et al., 2016). The current study focuses on paleosols within unit 15. Driese et al. (2016) previously examined paleosols in units 1, 19, and 20.
Geochronologic control for Ngira is based on two K-Ar dates on a biotite tuff (unit 25), which yielded ages of 17.7 ± 0.06 and 17.5 ± 0.2 Ma (Drake et al., 1988). However, recent geochronologic analyses of ashes erupted from the Kisingiri complex and deposited on Rusinga Island suggest that the K-Ar total fusion method used by Drake et al. (1988) may not be accurate as a result of post-depositional alteration (McCollum et al., 2013; Peppe et al., 2017). Regardless, numerous analyses of the Karungu fauna are consistent with an early Miocene age (Pickford, 1981, 1986). Re-dating of the deposits at Karungu is underway as part of the Research on East African Catarrhine and Hominoid Evolution (REACHE) project.
Methods
Field Methods
Stratigraphy
Each stratigraphic unit at Ngira was identified in the field at the location described by Driese et al. (2016) using field photos, field notes, and GPS coordinates. For this study, unit 15, hereafter referred to as NG15, was identified and traced laterally using sandstone units that demarcate the top and bottom of the unit. In the location described by Driese et al. (2016), NG15 lacked pedogenic features and consisted of interbedded fluvial sand and silt. Roughly 100 m lateral to that position, however, the interval was found to contain abundant microvertebrate fossils in a mudstone with pedogenic features.
Paleontology
Following the systematic surface collection procedure developed in the framework of the REACHE project, the area of interest was surveyed using flagging nails to visualize bone concentration. A 12 m2 grid was established over the area including the microfossil assemblage, centered around 36M 632912, 9904780 (UTM, WGS84). Within this grid, an exhaustive collection of paleontological remains was performed. Sediment on the surface of the squares was swept and sieved, while the immediate area around the grid was surveyed for identifiable specimens (i.e., surface collection). All items were bagged according to their grid cell. The grid was the basis for the ensuing subsurface excavations, and 11 squares (1 × 1 m) of the grid were actually excavated. Squares were excavated in arbitrary 10 cm intervals measured from the overlying sandstone unit (NG16) to a depth of 80 cm. Bulk sediment from each depth interval in each grid cell was then sieved on site (5 and 2 mm opening) and every biological element recovered was bagged and labeled according to its depth interval and grid cell.
Fossils systematically excavated from NG15 were compared to surface collections made at Ngira over multiple field seasons (2010, 2012, 2013, 2015) in the framework of the REACHE project (Lehmann et al., 2014), and also to the historical collections housed at the National Museums of Kenya in Nairobi (NMK). These surface collections are assumed to record a time-averaged faunal signal, as they were sampled over 25 stratigraphic meters of fluvial sands, gravels, and fluvio-lacustrine mudstones at Ngira (Driese et al., 2016). Nevertheless, the sample size is large enough to capture the conditions during most of the time of accumulation (Olszewski, 1999) and can be used in broad comparisons between early Miocene localities. All fossils were identified to the lowest taxonomic level possible with regard to anatomical element and taxon. In order to measure the taxonomic structure and composition of the collected fauna, the number of individual specimens (NISP) was calculated (Lyman, 2008). For the purpose of the present paper, our comparisons focused on small mammals, whose body size is inferred to be equal to or less than that of Megapedetes pentadactylus (a fossil rodent related to the springhare), which was the largest mammal found during excavations of NG15.
Paleopedology
Two paleosol profiles were trenched into fresh rock through NG15. A trench was excavated through the microfossil collection grid (profile NG15-A) after fossil surveys were completed. A second profile was described ca. 3 m lateral to the fossil excavation (profile NG15-B) after initial observations indicated that paleosol horizons appeared to vary laterally. By describing a pair of trenches, we sought to generate a better understanding of the local sedimentologic and pedogenic conditions that lead to the preservation of the microfossil assemblage. Sedimentologic and pedogenic features were described in both profiles using a modification of USDA-NRCS terminology (Schoeneberger, 2002), and include grain size, horizonation, bounding contacts, ped structure, color, mineralizations, and root traces. Serial bulk and oriented samples were recovered through each horizon of NG15-B, and selected horizons were sampled from NG15-A for comparison.
Laboratory Methods
Elemental geochemistry of bulk paleosol samples was characterized using two methods: (1) untreated, whole-sample assays using fused-bead ICP-AES and ICP-MS analysis for major and trace elements, respectively, at ALS Global (alsglobal.com); and (2) whole-sample assays of decarbonated aliquots of the same samples using X-ray fluorescence (XRF) for major element analysis at Baylor University. Samples sent to ALS Global were also analyzed for loss on ignition (LOI) at 1,000°C. Samples analyzed in-house at Baylor University were powdered and homogenized, decarbonated using 10% HCl, and neutralized using repeated rinsing with de-ionized water. The decarbonated samples were then re-ground, homogenized, fused into glass beads, and analyzed for major element concentrations using a Rigaku ZSK Primus II X-ray fluorescence analyzer. Total and organic carbon content were measured on aliquots from each horizon using an element analyzer (EA) before and after in situ decarbonation, respectively. Inorganic carbon content was calculated as the difference between the two measurements.
Thin sections of oriented samples from each horizon were prepared by Spectrum Petrographics (http://www.petrography.com) and characterized using a combination of methods from Brewer (1964) and Bullock et al. (1985). Carbonates were analyzed in thin section to identify mineral phases. Nodules and rhizoliths were micro-drilled on paired billets and hand samples after cross-comparison with thin sections. Carbonate powders were analyzed for inorganic carbon (δ13C) and oxygen (δ18O) stable isotope composition at Baylor University using a Thermo-Electron dual-inlet gas-source stable isotope ratio mass spectrometer. The delta notation is used in reporting stable isotope compositions (e.g., δ18O = [Rsample / Rstandard − 1] x 1000), where R is the ratio of the heavy to light isotope (e.g., 18O/16O). All isotope values are reported relative to the Vienna Pee Dee Belemnite (VPDB) standard with analytical precision within 0.03%0 and 0.1%0 for δ13C and δ18O, respectively.
Clay mineralogy of parent material and weathered soil horizons was analyzed using oriented clay slides on a Siemens D5000 X-ray diffractometer that uses Cu Kα radiation and operates at 40 Kv and 30 mA. The clay-sized fraction (<2 μm equivalent diameter) was separated via centrifugation following the methods of Poppe et al. (2001) and oriented clay slides were prepared following the methods of Moore and Reynolds (1997). To differentiate possible commonly-occurring clay minerals, four treatments were performed on clay slides (Moore and Reynolds, 1997): (1) samples were Mg2+-saturated using a Mg salt solution, (2) Mg2+-saturated samples were glycolated overnight in an airtight chamber, (3) duplicate samples were K+-saturated using KCl, and (4) a subset of K+-saturated samples were heated for at least 2 h at 550°C. All clay samples were analyzed from 2 to 30° 2Θ with a step size of 0.02° 2Θ and dwell time of 1 s. Clay minerals were identified following the methods of Moore and Reynolds (1997).
Constitutive Mass-Balance
Bulk geochemistry of paleosol horizons was compared using mass-balance calculations (Brimhall and Dietrich, 1987; Chadwick et al., 1990; Brimhall et al., 1991), without including bulk density due to the effects of compaction on paleosol samples (Driese et al., 2000, 2016; Driese, 2004). Translocation (τ, or “tau”) of elements was calculated relative to parent material, where: τ = {[(Cj, w /Cj, p)]/[(Ci, w /Ci, p)] − 1} × 100, in which the concentrations (C) of elements (j) in weathered horizons (w) are assessed relative to immobile elements (i) in the parent material (p). Profiles of tau values therefore can be used to show gains (positive values) or losses (negative values) as a result of pedogenic processes or sedimentary additions, assessed as a function of starting parent material composition. The composition of C and BC horizons was averaged to account for minor biases due to grain size-dependent compositional changes and/or incipient weathering of individual C or BC horizons.
Climate and Vegetation Reconstruction
The elemental composition of paleosol B horizon samples was used to estimate mean annual precipitation (MAP) and temperature (MAT) using a suite of pedotransfer functions (Sheldon et al., 2002; Gallagher and Sheldon, 2013; Table 1). The chemical index of alteration minus potassium (CIA-K), which tracks feldspar hydrolysis and base cation leaching (Sheldon et al., 2002) was used to estimate MAP. The salinization index (NaK; Sheldon et al., 2002) and the paleosol weathering index (PWI; Gallagher and Sheldon, 2013), which track thermodynamic controls on silicate dissolution, were used to estimate MAT. The paleosol-paleoclimate model (PPM1.0) (Stinchcomb et al., 2016) was also used to co-predict MAP and MAT. PPM1.0 uses eleven elemental oxides as input variables (Fe2O3, Al2O3, SiO2, TiO2, ZrO2, CaO, MgO, K2O, Na2O, MnO, and P2O5) to simultaneously model both MAP and MAT using a thin-plate spline drawn through sample scores generated by a partial least squares regression analysis of modern soil B horizon samples. PPM1.0 calculations were run in SAS statistical software (SAS Institute, Inc., v. 9.2.). Climate results are discussed in terms of climate zones after (Bull, 1991), which include MAP zones of arid (<250 mm), semiarid (250–500 mm), subhumid (500–1,000 mm), and humid (1,000–2,000 mm), and MAT zones of frigid (0–8°C), mesic (8–15°C), thermic (15–22.5°C), and hyperthermic (>22°C).
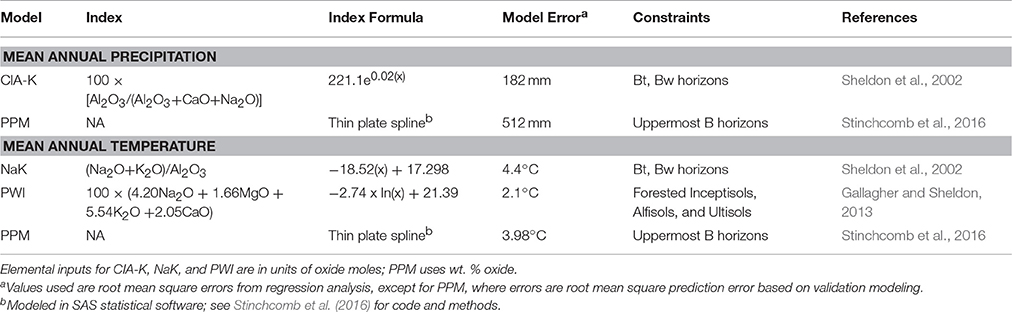
Table 1. Paleoclimate proxies.
We frame our vegetation reconstruction in terms of photosynthetic pathway, which is possible as a result of two broad photosynthetic mechanisms that differentially fractionate atmospheric CO2, resulting in plant-respired soil CO2 with differing carbon isotope signatures (δ13C). Modern plants that use the Calvin cycle (C3 pathway) include most trees, shrubs, and cool-season grasses, and have δ13C signatures between −20 to −33%0, with a mean of −26.7%0 (O'Leary, 1988; Cerling et al., 1997). Water stress is the primary factor that drives the enrichment of C3 plant δ13C signatures above ca. −24 to −25%0 (Ehleringer and Cooper, 1988). The Hatch-Slack (C4) pathway, which is utilized mostly by modern tropical and warm-season grasses and sedges, is a series of anatomical and biochemical adaptations that allows for closure of stomata without photorespiration (Sage, 2004). Modern C4 plants have δ13C values between −9 to −11%0, with a mean value of −12.5%0 (O'Leary, 1988; Cerling et al., 1997). Carbon isotope values of vegetation are recorded in the isotopic composition of pedogenic carbonates that form in equilibrium with plant-respired soil CO2 at depth in soils of moderate to high productivity (Cerling et al., 1989).
Endmember δ13C compositions for C3, water-stressed C3 (wsC3), and C4 vegetation were modeled using nominal fractionation factors for each photosynthetic pathway/plant type and corrected for an average atmospheric CO2 composition of −5.8%0 from benthic foraminifera for the interval 17.07–17.5 Ma (Tipple et al., 2010). Fractionation factors between plants and CO2 (εplant−CO2) reported by Passey et al. (2002) were used, where εC3−CO2 = −19.6%0, εwsC3−CO2 = −16.7%0, and εC4−CO2 = −4.7%0. A net fractionation of +15%0 between plant-respired soil CO2 and pedogenic carbonate (Fox et al., 2012, after Cerling and Quade, 1993) yielded endmember compositions of −10.4%0, −7.5%0, and +4.5%0 for carbonates forming under C3, wsC3, and C4 vegetation cover, respectively.
Results
Stratigraphy and Sedimentology
NG15 is bounded by trough cross-stratified fluvial channel sandstones (NG14 and NG16). Across ca. 150 m of lateral outcrop, NG15 varies from thinly-bedded, tan fluvial sandstones to red, calcareous sandy siltstones. The NG15-A and B profiles were described where NG15 occurs as sandy siltstone. A total of five superposed paleosols were identified, most of which were underlain by an alluvial parent material (C or BC) horizon (Figure 3). The parent material horizons were more coarse-grained than overlying subsurface horizons, and in some cases retained primary horizontal stratification. Bedding contacts at the base of parent material horizons are inclined from NG15-A to NG15-B with upwards of 10 cm relief.
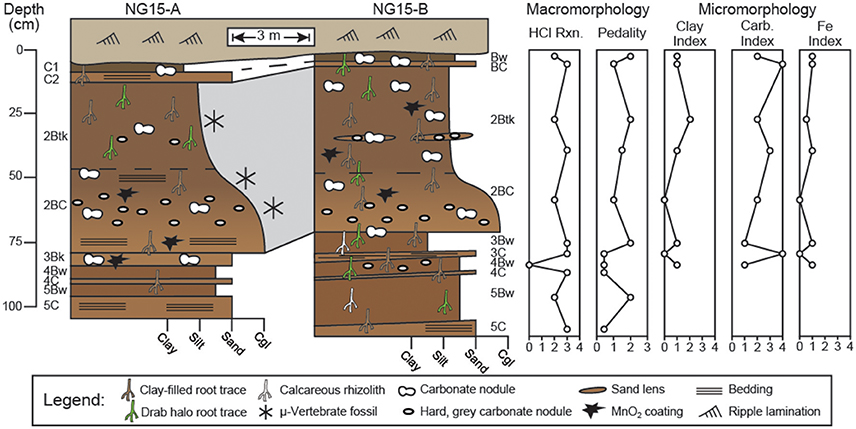
Figure 3. Profiles through Ngira unit 15 (NG15). Macro- and micromorphologic descriptions are for profile NG15-B. Numbers before paleosol horizonation indicate separate, superposed paleosols. Effervescence reaction classes (HCl Rxn.) are reported from field tests, with values corresponding to (0) no reaction, (1) very slight, (2) slight, (3) strong, and (4) violent effervescence (after Schoeneberger, 2002). Pedality classes correspond to (0) massive, (1) weakly formed, (2) moderately formed, and (3) strongly formed peds (after Schoeneberger, 2002). Clay, carbonate, and Fe indices are based on qualitative assessment of thin sections with numbers corresponding to features being (0) absent, (1) few, (2) common, (3) abundant, or (4) omnipresent.
Paleosol Descriptions
Detailed descriptions of paleosol macro- and micromorphology are reported in Table A1, with key observations presented in Figure 3. Horizonation is largely similar between profiles NG15-A and B. The uppermost paleosol is truncated from above and grades laterally from a C1-C2 to a Bw-BC horizon sequence between the profiles, respectively. The second paleosol consists of a Btk-BC horizon sequence with lenses of sand and reworked, hard, gray carbonate nodules variably coated in MnO2 or Fe2O3. The Btk horizon has well-developed prismatic ped structure, clay-filled root traces, clay coatings on peds, and vertically-oriented hairline root traces (Figure 4). With the exception of a thin, truncated Bk horizon that underlies the second paleosol in NG15-A, the rest of the succession consists of alternating couplets of Bw-C horizons, each of which are bounded by erosional contacts. The Bw horizons in the lower portion of the profile have root traces that tend to be <2 mm wide and occur as drab haloes, calcareous rhizoliths, or clay-filled pores.
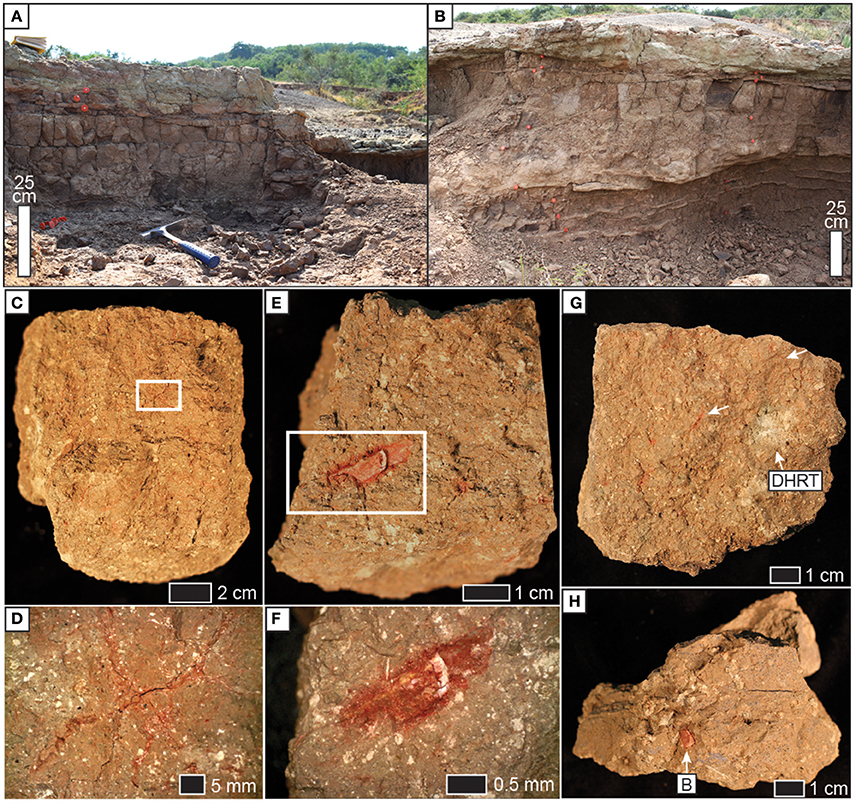
Figure 4. Field photographs of profiles of (A) NG15-A and (B) NG15-B. Note prismatic ped structure in 2Btk horizon. (C) Prismatic ped from 2Btk horizon (vertically oriented). Thin, red lines are root traces lined with Fe and clay; white speckles are pedogenic carbonates. (D) Close-up of thin root traces from white box in (C). Photo taken with reflected light and a polarizing filter. (E) Angular blocky compound ped removed from a prismatic ped in the 2Btk horizon. Photo is the base of the ped, with Fe-coated microvertebrate fossil. (F) Close-up of microvertebrate bone from E. Note Fe coating and white pedogenic carbonate. Faint, thin root traces are also present. Photo taken with reflected light and a polarizing filter. (G) Angular blocky ped from 2Btk horizon. White arrows indicate fine root traces; DHRT = drab halo root trace. Ped is vertically oriented. (H) Base of an irregular angular blocky ped (3Bw horizon), with Fe-stained bone fragment indicated. Note white calcareous rhizoliths, seen in cross section from this view. Photo in box A is used with permission from T. Wenzel.
Pedality—a measure of ped structure development—and reaction to HCl were characterized for profile NG15-B using USDA-NRCS methods (Figure 3; Schoeneberger, 2002). The B horizons tend to have more well-developed pedality than parent material horizons. Effervescence was very strong in both B horizons and parent material horizons.
Micromorphology
Thin sections from all horizons of the uppermost 4 paleosols in NG15-B were studied for a variety of pedogenic and sedimentary properties (Figure 5). Surveys of clay, carbonate, and Fe features were converted to qualitative indices with values corresponding to features being (0) absent, (1) few, (2) common, (3) abundant, or (4) omnipresent (Figure 3). Pedogenic clay fabric includes grain coatings (granostriated), pore linings (porostriated), and matrix impregnations (argillans). The clay index closely tracks pedality and is highest in B horizons, particularly the 2Btk horizon.
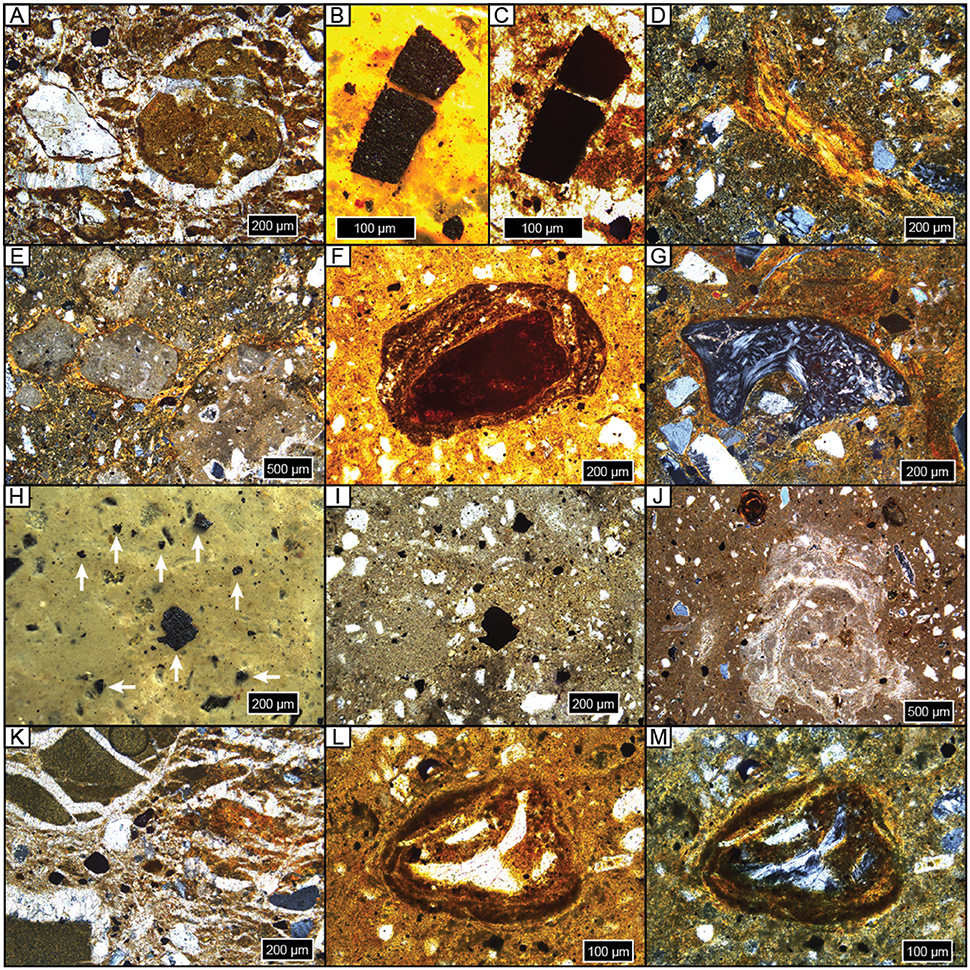
Figure 5. Photomicrographs of representative features. All samples are upright and in cross-polarized light unless noted. (A) Diagenetic sparite overgrowths on detrital quartz grain, on and in a micritic carbonate nodule, and throughout matrix; NG15-B, BC. (B,C) Microcharcoal grain in reflected light (B) and plane-polarized light (ppl) (C); NG15-B, BC. (D) Argillan and granostriated clay fabric on quartz and weathered orthoclase detrital grains; NG15-B, 2Btk. (E) Micritic carbonate nodules with sparite filling septarian cracks with pedogenic clay bridges (granostriated fabric); NG15-B, 2Btk. (F) Fe concretion nucleated on weathered detrital grain; note clay coatings within and on concretion, and clay-rich matrix; ppl, NG15-A, 2Btk. (G) Granostriated clay fabric on bone chip and detrital grains; NG15-A, 2Btk. (H,I) Microcharcoal grains in reflected light (H, white arrows) and ppl (I); NG15-B, 2BC. (J) Microspar carbonate concretion with sparite filling septarian cracks. Thin clay coats line septarian walls. Note Fe concretion and sparite overgrowths on detrital grains; NG15-A, 3Bw. (K) Displacive sparite around and within clay clasts (left) and orange pedogenic clay (right), on detrital grains, and through matrix; NG15-B, 3C. (K,L) Bone chip encased in Fe/clay concretion, ppl (L) and xpl (M); NG15-B, 4Bw.
Carbonates exhibit a range of morphologies in profile NG15-B. Pedogenic micrite is the dominant phase in the 2Btk horizon, though minor amounts of sparite coat septarian shrinkage cracks in some cases. Hard, gray carbonate nodules tend to be micritic with minor quantities of sparite in septarian cracks. Diagenetic calcite spar is pervasive in parent material horizons and cross-cuts pedogenic features, such as fecal pellets and clay fabric. Sparite crystals are nucleated on detrital silicate grains and pedogenic features, with growth axes radiating displacively into the paleosol matrix. The carbonate index includes both pedogenic and diagenetic phases, and therefore tracks increases in pedogenic carbonate content in the Btk horizon, as well as diagenetic sparite that occurs in C horizons.
Fe features primarily occur as concretions in B horizons. Fe concretions are nucleated on weathered detrital grains and microvertebrate bone chips, which typically also have clay coatings (Figures 5L,M). The Fe index is highest in B horizons and closely tracks the clay index and pedality.
Microcharcoal (10–500 μm wide) was observed in most thin sections (Figures 5B,C,H,I). Grains of microcharcoal were differentiated from detrital silicates and heavy minerals by their opacity under plane- and cross-polarized light, tattered and irregular edges, and lack of cleavage planes. The concentration of microcharcoal grains was not estimated because, in many instances, grains occurred in a large range of sizes, likely as a result of fragmentation.
Elemental Geochemistry
Elemental geochemistry, loss-on-ignition (LOI), and measured organic and inorganic carbon content for the NG15-B profile is reported in Table A2. Untreated samples were compared with samples that were decarbonated before elemental analysis (Figure 6).
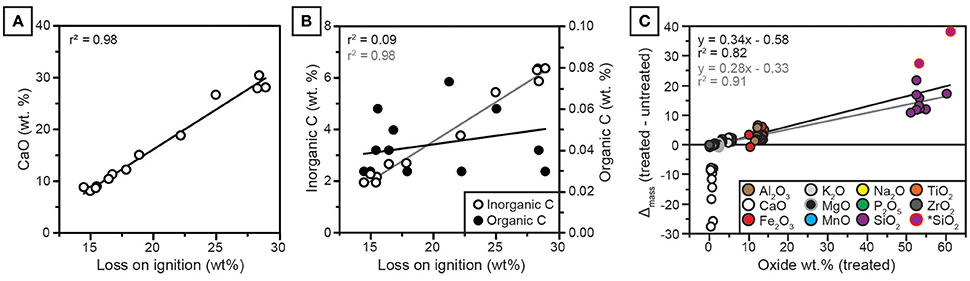
Figure 6. (A) CaO in untreated samples is strongly correlated with loss on ignition (LOI). (B) Inorganic C is strongly correlated with LOI (gray regression line); organic C is very low in abundance and not correlated with LOI (black regression line). (C) Effect of treatment on oxide abundances. The y-axis is the mass change, calculated as decarbonated sample mass minus untreated mass, plotted against mass of treated (decarbonated) samples. Note that mass change scales with oxide abundance for all constituents except CaO. *SiO2: Two outlier values with high initial CaO and high SiO2 mass change, which improve regression statistics when omitted. Black regression was calculated for all samples. Gray regression was calculated omitting two SiO2 outliers.
Effects of HCl Treatments
The concentrations of CaO and inorganic carbon from NG15-B are well correlated with loss on ignition (Figure 6). Organic carbon is uncorrelated with loss on ignition. Because clay mineralogy is dominated by illite, which holds little structural water (Moore and Reynolds, 1997), and organic carbon concentrations are low (ca. 0.03 wt.%), the majority of LOI is attributed to calcite.
All major elemental oxides (Na2O, MgO, K2O, Fe2O3, SiO2, P2O5, MnO, Al2O3, and Ti2O) show significant (p < 0.05) correlations with CaO in untreated samples (Table A3). Because many of the oxides are not associated with carbonate minerals, the correlations are interpreted to be a result of CaO diluting the contributions of other elementals to total measured concentrations. In contrast, only SiO2, P2O5, MnO, and Al2O3 are correlated with CaO in decarbonated samples, and none of the weatherable bases (MgO, Na2O, K2O) are correlated with CaO. Most elements, including CaO, show little down-profile variation in decarbonated samples.
The effect of weight percent change induced by removal of carbonate-bound calcium scales linearly with the elemental concentration of each oxide, such that elements with higher concentrations in decarbonated samples receive a proportionately larger share of the relative measured weight occupied by CaO in untreated samples (Figure 6). Regression diagnostics were analyzed using the “plot” function in R (R Core Team, 2016). Two samples with high initial CaO (28.0 and 30.5 wt.% before HCl treatment) were found to be high-leverage points in the linear regression, both of which had a Cook's distance of ca. 1 or more (Cook and Weisberg, 1982). For these two samples, decarbonation resulted in disproportionately large increases in SiO2 (samples with mass change >25 in Figure 6C). When these two samples were omitted from simple linear regression in Figure 6C, the correlation coefficient between treatment effect (oxide mass gain after decarbonation) and decarbonated oxide mass increased from 0.82 to 0.91. No other samples were found to be high-leverage points in regression analyses. The removal of CaO via decarbonation caused substantial increases in CIA-K and PWI index values (Figures 7A,B). Because Na2O and K2O are minimally affected by the treatment, NaK index values do not change significantly after decarbonation (Figure 7C).
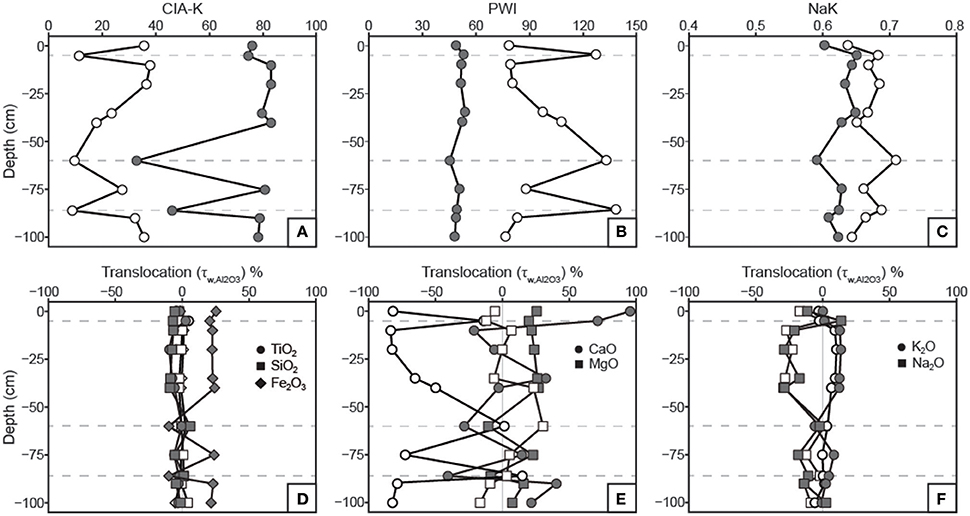
Figure 7. Profiles of weathering indices and constitutive mass-balance results. See Table 1 for weathering index formulae. (A) Chemical index of alteration minus potassium (CIA-K) values increase with decarbonation as a result of CaO removal and Al2O3 relative mass increase. (B) Paleosol weathering index (PWI) values decrease with decarbonation; note that lower PWI values correspond to more highly weathered, base-poor samples. (C) Salinization index (NaK) values are generally inversely correlated before and after treatment due to the relative increase in Al2O3 with removal of CaO. (D) Translocation (τ) values indicate no down-profile change in TiO2 or SiO2 relative to parent material in either untreated or treated samples. Removal of carbonates resulted in a discernible increase in Fe2O3 in B horizons, which matches the Fe index (Figure 3). (E) The apparent CaO losses in B horizons for untreated samples does not appear after HCl treatment. No significant trends in MgO translocation are apparent. (F) Na2O and K2O show inverse translocation behavior, which are not affected by HCl treatment. Na2O loss is attributed to mineral weathering.
Mass-Balance Geochemistry
The three oxides commonly used as immobile index constituents in mass-balance calculations are Al2O3, TiO2, and ZrO2. The concentrations of these three oxides in untreated samples vary greatly down-profile, but showed little variation in decarbonated samples. Al2O3 was selected as the immobile element for mass-balance calculations because it has the highest concentration of the three candidate oxides.
Results of tau calculations are presented in Figure 7, wherein untreated and decarbonated samples are overlain on mass-balance plots for comparison. TiO2 and SiO2 concentrations do not vary relative to Al2O3 in both untreated and decarbonated samples. Fe2O3, however, shows increases in decarbonated samples from B horizons, a trend that was not observable in untreated samples and mirrors the micromorphologic Fe index (Figure 3). CaO shows large losses in B horizons relative to parent material in untreated samples (Figure 7E). With the exception of gains in the uppermost horizon, CaO concentrations in decarbonated samples vary within ca. 50% of parent material composition. MgO concentrations vary within ca. 25% of parent material for both untreated and decarbonated samples (Figure 7E). K2O and Na2O show inverse trends that are unaffected by the acid treatment (Figure 7F).
Clay Mineralogy
Samples from the five uppermost horizons of NG15-B profile yielded similar X-ray diffraction results (Figure 8). Primary peaks on each diffractogram of K+-saturated samples occur at 10.15, 5.02, and 3.34 Å, which are associated with illite/mica 001, 002, and 003 peaks, respectively. Quartz can also contribute to the peak at 3.34 Å, but because a secondary peak at 4.26 Å is absent, quartz is either absent in the clay-sized fraction or contributing very little to the illite 003 peak. Peaks associated with smectite (17.5 Å) and kaolinite (7.18 and 5.38 Å) were not observed. The lack of change with Mg2+ saturation, glycolation, or heat treatments further supports an interpretation of exclusively illitic clay mineralogy. The calcite peak corresponding to a d-spacing of 3.03 Å is present in all samples, and is sharpest in the Btk horizon. Peaks occurring at 4.51 and 3.52 Å may indicate minor quantities of detrital palygorskite and kaolinite, respectively (e.g., Myers et al., 2011), though no secondary peaks associated with either mineral is present.
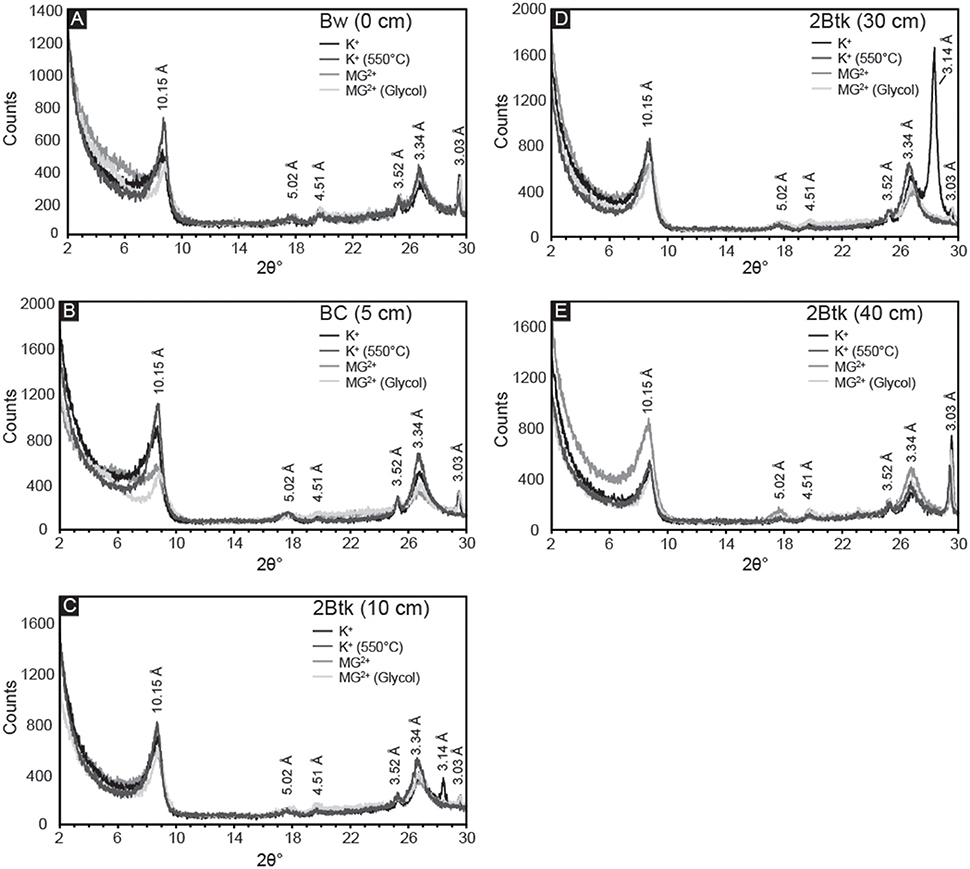
Figure 8. X-ray diffractograms of the <2 μm fraction from the first five horizons in NG15-B: (A) Bw, (B) BC, and (C–E) three samples from the 2Btk horizon. Four treatments were applied to all samples: K-saturation, heating to 550°C of K-saturated samples, Mg-saturation, and ethylene glycolation of Mg-saturated samples. Illite is identified by the presence of peaks at 10.15, 5.02, and 3.34 Å. Peaks associated with smectite (17.5 Å) and kaolinite (7.18 and 5.38 Å) were not observed, and the lack of change with glycolation or heat treatments further supports an interpretation of exclusively illitic clay mineralogy.
Paleoclimate
Two approaches were used to estimate MAP and MAT values: pedotransfer functions using weathering index proxies for MAP or MAT, and a multivariate spline model that uses 11 elemental oxides as input values to co-predict MAP and MAT (Figure 9). The CIA-K proxy for MAP yields arid to semiarid values (<500 mm) for untreated samples and mostly subhumid values (500–1,000 mm) for decarbonated samples. MAP values calculated using PPM1.0 range from arid to humid for untreated samples, and, interestingly, range from arid to subhumid for treated samples—substantially lower than CIA-K predicted MAP. Decarbonation resulted in no detectable change in MAT values predicted by NaK and PWI, which were within the frigid (<8°C) and mesic zones (8–15°C), respectively. The PPM1.0 model yielded mesic to thermic MAT values (ca. 8–18°C) for untreated samples and frigid to mesic values (ca. 5–14°C) for treated samples.
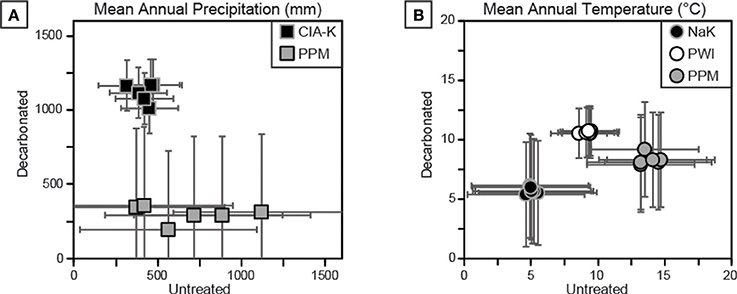
Figure 9. Cross-plots of climate estimations for decarbonated and untreated samples. See Table 1 for details of each proxy. (A) Mean annual precipitation (MAP) estimates using CIA-K and PPM1.0 show disparate results. MAP estimates using CIA-K are likely underestimated in untreated samples and overestimated in decarbonated samples, suggesting a dry subhumid climate (800–1,000 mm), within error of PPM1.0 estimates. (B) Mean annual temperature (MAT) estimates using NaK, PWI, and PPM1.0. Decarbonation had little effect on NaK and PWI estimates, but reduced PPM1.0 output values. All estimates are interpreted to be too low for the geologic setting and sampled flora and fauna.
Stable Isotopes and Pedogenic Carbonates
Pedogenic carbonate δ13C and δ18O results are presented in Figure 10; raw values are reported in Table A4. Values for δ13C span approximately 9%0, ranging from −7.3 ± 0.1 to −1.9 ± 0.2%0 VPDB, and the majority of samples are more positive than the calculated endmember of water-stressed C3 vegetation. Previously analyzed carbonate nodules from units 19 and 20 by Driese et al. (2016) fall within the range of samples presented in this study, with the exception of a single nodule close to the C3 endmember composition. Samples of lacustrine oncoid carbonate reported by Driese et al. (2016) fall in the middle of the isotope space and mirror the overall negative correlation between δ13C and δ18O. This suggests that lacustrine carbonates carried an isotope signal that sampled a mixture of local vegetation, similar to Pleistocene riverine tufa from Karungu and Rusinga Island (Beverly et al., 2015). Mean δ18O values reported in this study range from −4.6%0 to −8.0%0, which are similar to pedogenic carbonate values ranging between ca. −5%0 to −8%0 reported from middle Miocene sites at Fort Ternan and West Turkana in Kenya (Cerling, 1992), and thus likely did not form from highly evaporitic waters.
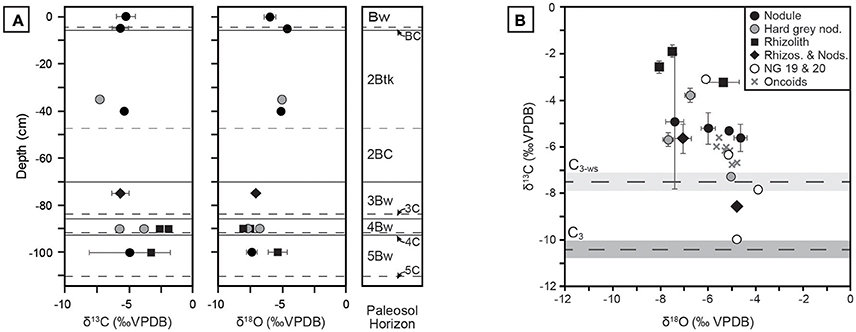
Figure 10. Stable isotopic compositions of pedogenic carbonates from Ngira. (A) Profiles in NG15-B of pedogenic carbonates, coded by morphology and phase (see B for key). Each sample is the mean of triplicate analysis; 1 σ error bars about the mean are shown when error is greater than symbol size. (B) Cross-plot of δ13C vs. δ18O values, with calculated endmember compositions for C3 and water-stressed C3 (C3-ws) vegetation. The C4 endmember is +4.5%0. Data for units NG19 and NG20, as well as lacustrine oncoid carbonates, are also plotted (from Driese et al., 2016).
Measured δ13C values show limited correlation with carbonate morphology. Micritic, hairline rhizoliths from Bw horizons in the NG15-B profile have the highest δ13C values (up to −1.9%0). Mixed samples containing both rhizoliths and nodules are variable across the sample space. The composition of hard, gray nodules interpreted to be detrital is not unique; those occurring the 4Bw horizon have relatively high δ13C and low δ18O values, whereas those found in the 2Btk horizon have lower δ13C and higher δ18O values.
Using the calculated C3 and C4 endmembers of carbonate compositions, 21–57% of the standing biomass associated with NG15 was C4 vegetation. If a water-stressed C3 endmember is used, 2–47% C4 biomass is required to account for the observed δ13C values, which on the upper end at least is a considerable and possibly surprising amount of C4 biomass for an interval of this age.
Microfossil Assemblage Results
Faunal composition of the excavated NG15 site is given in Table 2. NISP for the excavation grid at NG15 was 415, including surface collections within the grid boundaries. Mammals are the dominant taxon in the excavated grid, with 81.1% of the total abundance (83.6% when including the indeterminate Mammalia). Aquatic taxa are present, but not very common, and include crocodiles (1.7%), turtles (1.2%), and fish (1.2%). In contrast, crocodiles and turtles collectively represent almost a third of the total NISP recovered through surface collections at Ngira as a whole.
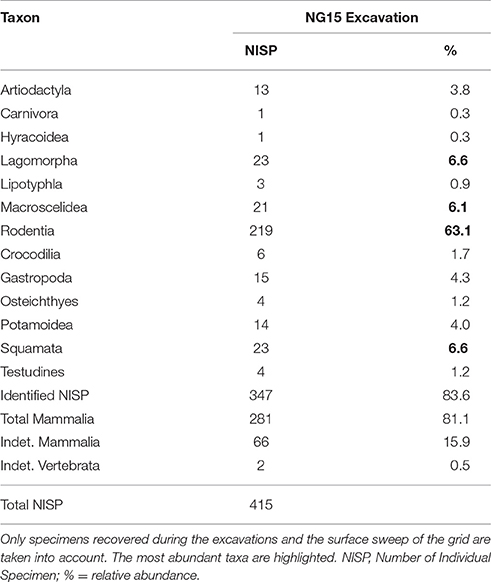
Table 2. Faunal composition of the excavated NG15 site.
Only 152 of the 347 mammal specimens are sufficiently well-preserved to be identified at the genus level (Table 3). By comparison, the surface collections made at Ngira include over 3,000 fossils, but only 482 belong to small mammals (i.e., body size of the rodent M. pentadactylus or smaller) identifiable to the genus level. The taxonomic composition of the NG15 excavation includes 10 genera, and surface collections from throughout Ngira yielded 18 genera of comparable size ranges. Both samples show seven genera in common, whereas three genera are unique to the NG15 excavation sample and 11 to the surface collections (Table 3). Accordingly, the Jaccard similarity coefficient and the Sørensen–Dice index are very low (33.3 and 50% respectively; see Lyman, 2008), which indicate that the overall surface collection is quite different from the NG15 excavation in their taxonomic composition.
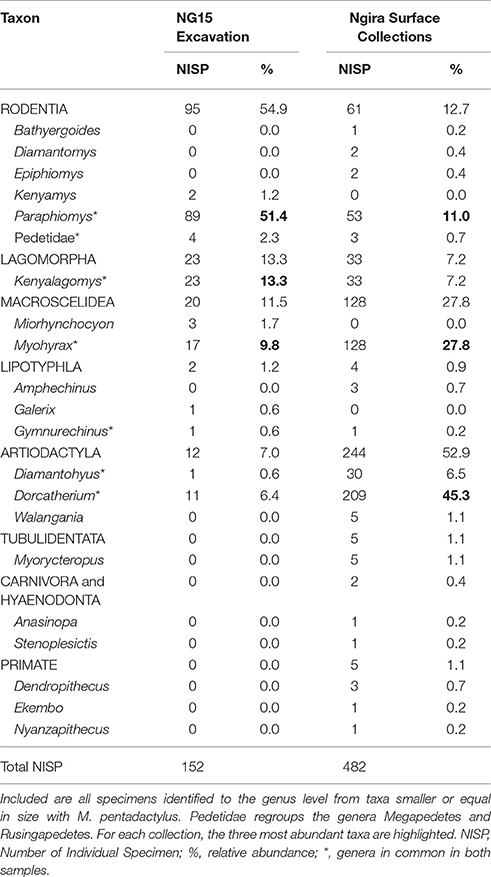
Table 3. Composition of the small mammal fauna from Ngira, recovered from the NG15 excavations and from surface collections (including REACHE surveys in 2010, 2012, 2013, 2015 and historical collections housed at the NMK).
The small mammal community at Ngira is dominated by artiodactyls (especially the genus Dorcatherium) in the overall surface collection sample. In contrast, the NG15 excavation fauna is dominated by rodents, especially the genus Paraphiomys. Lagomorphs are equally well represented in both samples, whereas macroscelids (especially the genus Myohyrax) are more abundant in the surface collection sample. The NISP of each genus in common between surface collected and excavated samples at NG15 differ significantly in terms of taxonomic abundance (chi-square = 220.27; p < 0.001) and are not correlated (Spearman's rho = 0.36; p > 0.10), which suggests that the fauna recovered by the NG15 excavation may represent a separate ecosystem, or at least—taking into account time averaging for the surface collections—a specific ecosystem within an environmental mosaic that varied spatially and temporally at Ngira. Notably absent from NG15 are carnivorous mammals and primates, which are also rare in the surface and historical collections from Ngira.
Notable taxonomic differences were also observed within the NG15 profile (Table 4). The depth interval from 5–50 cm, which includes the C1, C2, and 2Btk horizons, is dominated by Paraphiomys and lacks remains of Dorcatherium and Pedetidae. The depth interval from 50 to 80 cm yields a moderate abundance of Dorcatherium and Pedetidae, but lacks the rodent Kenyamys. Although the taxonomic abundance of each depth interval is not significantly different (chi-square = 9.43; p > 0.32), the taxonomic composition does differ between the upper and lower portions of the profile (Jaccard similarity coefficient of 33.3%; Sørensen–Dice index of 50%).
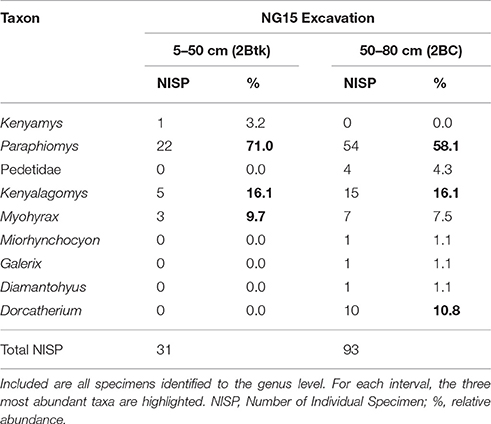
Table 4. Faunal composition of the excavated NG15 site by depth interval, omitting surface collections.
Discussion
Two profiles through stacked paleosols in unit 15 at Ngira preserve a unique assemblage of physical, biotic, and climatic elements of the Critical Zone in western Kenya during the early Miocene. The following discussion frames field and laboratory observations into interpretations of Critical Zone components, and subsequently ties inter-related processes together.
Lithosphere
The stratigraphic interval of NG15 transitions laterally from small fluvial channels (Driese et al., 2016) to pedogenically modified floodplain siltstones. Microtopography observed across the ca. 3 m described in the current study includes dipping sedimentary and paleosol horizon contacts that are overlain by coarser sediment, reworked carbonate nodules, and microvertebrate skeletal elements. We interpret these features to be the result of cut-and-fill episodes that were subsequently overprinted by pedogenic alteration.
The mineral assemblage reflects granitic basement sources in the surrounding uplands (Smith and Mosley, 1993), and lacks evidence of drainage connection to the Kisingiri volcanic complex to the northwest. The detrital grains observed in thin section consist of dominantly poly- and mono-crystalline quartz, with accessory orthoclase, microcline, and plagioclase feldspars. This mineral assemblage is likely derived from a granitic source rather than the mafic-alkaline volcanic source at Kisingiri, due primarily to the lack of tuffaceous material, volcanic rock fragments, and paucity of mafic minerals observed in thin section. Amphiboles and pyroxenes are rare in NG15 thin sections and are highly weathered. The Fe released by decomposition of these mafic minerals was conserved as concretions in B horizons.
The clay mineral assemblage in NG15 is composed of illite, and volcanic grains are notably absent. Illite is most likely a detrital rather than diagenetic mineral for two reasons. First, unaltered smectite was observed in the lowest unit at Ngira (NG01) and contains no illite (Driese et al., 2016). If the illite observed in NG15 were an alteration product of smectite, one would expect that NG01 would also have been illitized. The unconformity above NG01 coincides with a change in sediment composition and geomorphology, which accounts for the lack of detrital illite in NG01. Second, mass-balance calculations after removal of calcite from NG15 revealed that relatively little elemental variation was present between paleosol horizons. Significant production of pedogenic clay in B horizons would have been evident as increases in Al2O3 relative to SiO2 (Retallack, 2008), which was not observed. Therefore, we interpret micromorphologic clay fabric and macroscopic clay coatings to be reworking of detrital clay.
Forbes et al. (2004) previously described the stratigraphy and selected paleosols at Ngira. Their KU-3 paleosol is almost certainly the same interval as NG15, as their description includes clay-lined columnar peds in a Bt horizon underlain by thin couplets of siltstone and sandstone (see Figure 3 in Forbes et al., 2004). The ped structure in the Btk horizon is actually prismatic, forming as a result of clay translocation and stabilization by herbaceous roots, rather than columnar peds, which form as a result of clay flocculation in sodic soils (Brady and Weil, 2008). Forbes et al. (2004) calculated constitutive mass-balance for samples equivalent to the Btk horizon of NG15 relative to a granitic parent material and found losses of 80–90% for SiO2, Na2O, and K2O. This result led to the interpretation that the paleosols formed under subhumid to humid conditions. However, the parent material for the NG15 paleosol was fine-grained alluvium—originally sourced from granitic basement—and had significant additions of CaO associated with diagenetic calcite (Figure 6). Pre-weathering and reworking of alluvium before deposition at NG15 led to the overestimation of mass loss calculated by Forbes et al. (2004). After removing carbonate-associated CaO, we found that only moderate in situ weathering occurred and the climate was more likely dry subhumid.
Hydrosphere
The NG15 paleosols show evidence of variable drainage conditions. The 2Btk horizon contains prismatic ped structure, macro- and micro-scopic illuvial clay coatings, pedogenic carbonate, and oxidized color, all of which form during well-drained conditions (Birkeland, 1999). In contrast, isolated zones of Fe depletion are also present in both hand sample and thin section and are the result of saturated conditions. Hematite concretions are present in all B horizons and require intervals of water saturation to reduce and mobilize Fe from the surrounding soil matrix, and subsequent intervals of well-drained conditions to oxidize and stabilize Fe2+ to Fe3+ (Vepraskas, 2001). Taken together, these features indicate that the paleosols in NG15 were episodically waterlogged, but the predominance of oxidized features is consistent with well-drained conditions for relatively longer durations.
Atmosphere: Climate State
Mean annual precipitation estimations using CIA-K are bounded by underestimates associated with untreated samples containing artificially high CaO, and overestimates from decarbonated samples containing artificially low CaO due to the removal of small quantities of pedogenic carbonate. The best estimate for paleo-MAP is likely subhumid (500–1,000 mm), which falls between the values calculated for untreated (<500 mm) and decarbonated samples (800–1,200 mm). Previous MAP estimates from paleosol B horizons in NG19 and NG20, which occur ~5 m stratigraphically above NG15 and showed no evidence of diagenetic calcite, also yielded subhumid MAP estimates (Driese et al., 2016). Results from the PPM1.0 model are variable with high error that encompasses all values calculated using CIA-K, and therefore offer less practical utility than the CIA-K estimates. The presence of illuvial clay and pedogenic carbonate is an indication of seasonally-variable precipitation.
Estimations of MAT using NaK, PWI, and PPM1.0 are all clearly too low given the equatorial setting of the locality and presence of taxa that currently inhabit thermic to hyperthermic climate zones (e.g., crocodilians and turtles). Instead we suggest that MAT was probably considerably warmer and similar to fossil leaf estimates from Rusinga Island of 23–35°C (Michel et al., 2014). Paleosol studies frequently find the results from elemental proxies for MAT are below reasonable values, primarily because MAT is much less important in controlling soil weathering compared to other variables, such as MAP (e.g., Stinchcomb et al., 2016).
Biosphere
Flora
Multiple lines of evidence suggest that paleosols in NG15 formed under open canopy conditions with predominantly herbaceous vegetation. Root traces are abundant and occur in multiple morphologies, including calcareous rhizoliths, clay- and Fe-lined root pores, and as drab haloes. Drab halo root traces do not preserve original root dimensions (Retallack, 2008); however, calcareous rhizoliths and clay- and Fe-lined pores likely record primary root diameters. All observed root traces are less than ca. 5 mm, consistent with herbaceous roots.
Further, δ13C values of pedogenic carbonates are surprisingly high, and cannot be explained by water-stressed C3 vegetation under the boundary conditions of modern terrestrial vegetation δ13C values (Kohn, 2010). The weak, negative relationship between δ13C and δ18O values (r = −0.58) negates the possibility that high δ13C values (i.e., water stressed vegetation) are associated with evaporative enrichment of soil water in 18O, a circumstance observed in some lacustrine settings (Ufnar et al., 2008). The most parsimonious explanation of highly enriched δ13C signatures of pedogenic carbonates is the presence of C4-photosynthesizing biomass. Most of the measured δ13C values fall within the range of modern wooded grassland (roughly −2.4%0 to −6.9%0), with only three samples within the range of woodland/bushland/shrubland biomes (roughly −6.9%0 to −12%0) (Cerling et al., 2011).
Forbes et al. (2004) reported organic carbon stable isotope analyses for the NG15 paleosol interval (interpreted to be their unit KU-3), with all values between ca. −22%0 to −25%0. Total organic matter measured in the paleosol was between 0.08 to 0.02 wt.%, which is far less than typical soil organic matter contents (e.g., Wynn, 2007). These organic carbon isotope signatures are within the range for early Miocene C3 vegetation. However, given the very low organic contents of the paleosols, we contend that the stable isotope signatures of pedogenic carbonates are better indicators of aboveground biomass in this setting.
Modern hydromorphic Vertisols have been shown to precipitate carbonate during a range of hydrologic conditions, from fully saturated to well-drained (Mintz et al., 2011). In such soils, δ13C values of authigenic carbonate phases tend to be more positive when calcite precipitates during well-drained conditions as a result of actively growing C4 biomass and higher rates of atmospheric CO2 diffusion into soil pore space (Cerling, 1991). Though NG15 does not contain Vertisols, occasional waterlogging may simulate the poorly drained phase common in Vertisols. The Mintz et al. (2011) model of carbonate precipitation is in line with our interpretation of a C4 biomass isotopic signature on the δ13C values measured for NG15: specifically, that the carbonates in NG15 formed during well-drained conditions in equilibrium with fully terrestrial aboveground biomass. If, however, bicarbonate-fixing semi-aquatic vegetation were present at the time of carbonate precipitation, C4 vegetation would not be necessary to account for the very positive values observed (e.g., Rascio, 2002). To our knowledge, there is no diagnostic method for independently identifying such vegetation from the set of observations available in this study (e.g., root morphology). Thus, we acknowledge the possibility that the observed δ13C values for pedogenic carbonates in NG15 could be the result of bicarbonate fixation by C3 vegetation during water-saturated conditions. Given that the NG15 paleosols appear to be predominantly well-drained, with only occasional waterlogging, it is most plausible that the pedogenic carbonates measured in this study formed during well-drained conditions in equilibrium with a mixture of C3 and C4 biomass.
The δ13C values measured for NG15 are similar to those previously reported by Driese et al. (2016) for paleosols in NG19 and NG20 (Figure 10B). Because NG19 and NG20 were interpreted to be redoximorphic Vertisols, soil forming conditions were generally similar to that of NG15—a fine grained substrate subjected to occasional waterlogging on a low-lying fluvial landscape. These similarities suggest that the open canopy biome interpreted for NG15 was recurrent throughout the stratigraphic section at Ngira, and that C4 vegetation inhabited a marginal habitat within a narrow range of landscape positions in the early Miocene.
The microcharcoal reported in this study suggests that wildfires occurred in seasonally dry landscapes at or near Karungu in the early Miocene, though we note that cellular structure and stomata were not observed in our samples. Seasonal aridity is independently recorded as micromorphologic interlayering of translocated clay and carbonate in pedogenic concretions (Figure 5), with intervals of carbonate precipitation representing seasonal water deficiency. The microcharcoal grains are small enough to have been deposited from eolian or fluvial deposition. However, because most environmental reconstructions for early Miocene sites are for forested or woodland environments (Jacobs et al., 1999), it is more likely that the charcoal originated locally in association with the open canopy land cover at NG15. Fire is one of the key ecological variables that can facilitate the maintenance of open-canopy landscapes (Bond and Keeley, 2005; Keeley and Rundel, 2005), and may have been an important property of the paleolandscapes preserved in NG15.
Fauna
The dominance of terrestrial fauna, paucity of aquatic taxa, and down-profile variations in faunal composition within NG15-A are consistent with sedimentologic and paleopedologic interpretations. The depth interval of 50-80 cm (2BC horizon) contains a larger NISP and taxonomic diversity than the overlying 45 cm (Table 4), suggesting that fluvial reworking mixed microvertebrates from the local area and deposited them with detrital parent material. The depth interval from 5 to 50 cm is predominantly the 2Btk horizon and either contains a more local faunal signal unique to the position of NG15 on a floodplain, or a depositional fining-upward pattern caused taphonomic filtering toward smaller specimens higher in the profile.
The NG15 fauna differs both in taxonomic composition and abundance compared to the Ngira locality overall, with a predominance of Paraphiomys and a relative scarcity of artiodactyls (Dorcatherium), primates, and carnivores. Lagomorphs (Kenyalagomys) and elephant-shrews form an important proportion of the small mammal fauna at the NG15 site, but the highly specialized Myohyrax (Macroscelidea) is less abundant than in the overall Ngira assemblage. The small proportion of microfossils in surface collections can be attributed to multiple factors, including their relatively higher erodibility from outcrop and the inherent bias toward sampling larger fossils in surface collection (Rogers et al., 2017). Microfossil assemblages are therefore particularly important to assess relative taxonomic abundance and species richness as they help to recover otherwise underrepresented small-bodied taxa (Lyman, 2008). As a result of the NG15 excavations, the faunal list for Ngira has been expanded to now include the rodent Kenyamys, the Macroscelid Miorhynchocyon, and the Galericine Galerix, all of which are also known from Rusinga Island.
The paleoecology of the fossil genera observed in this study is not well understood and still relies mostly on comparison with modern analogs. The rodent genus Paraphiomys for instance, belongs to the family Thryonomyidae, whose extant representatives (endemic to Africa) live in long grass savanna, swamps and reed beds, do not dig burrows nor climb trees, and feed on coarse grass (Happold, 2013a). Interestingly, these rodents tend to live in small groups, which may explain the concentration of 89 NISP at the NG15 excavation site, though more than half of these occur in the 2BC horizon that is interpreted to contain reworked specimens.
The two extinct genera of the rodent family Pedetidae, Megapedetes and Rusingapedetes, are morphologically similar to the extant springhares (Pedetes) (Pickford and Mein, 2011; Butynski, 2013a). Extant springhares are notorious saltatorial rodents, but are also good diggers. They feed primarily on grasses, live in arid and semiarid, relatively flat and open areas with short grass, with little or no woody vegetation (Butynski, 2013b). The highest density of extant springhares is found near floodplains, lakes, and swamps (Butynski, 2013b), which are within the plausible environments for NG15 based on sedimentary and paleosol evidence.
A recent study of the dental microwear of Dorcatherium species from Rusinga Island and Songhor (Ungar et al., 2012) showed that, contrary to extant chevrotains, the fossil tragulids were ecologically diverse in their diet, ranging from variable grazers (D. chappuisi) and mixed feeders (D. parvum) to browsers/generalists (D. pigotti). These authors also suggested that the presence of grazing animals implied that there was at least some grass locally available. At Ngira, both in the NG15 excavations and in the surface collections, all three of these Dorcatherium species have been found.
Kenyalagomys belongs to the family Ochotonidae, known from Africa from the early to the middle Miocene, and now only living in Eurasia and North America (Happold, 2013b). The Leporidae migrated to Africa not before the late Miocene (Happold, 2013b). Extant members of the Ochotonidae (i.e., pikas) are smaller than extant Leporidae of Africa, are terrestrial herbivorous animals, and are usually associated with rocks and talus slopes (Happold, 2013b). Interestingly, a recent study showed that pikas have a strong preference for C3 plants, whereas leporids are more attracted by C4 plants (especially Poaceae; Ge et al., 2013). The authors suggested also that the expansion of C4 plants induced the extinction of ochotonids in Africa to the profit of leporids. We note, however, that the decrease in ochotonid genera began before the C4 origination date (Ge et al., 2013: Figure 1).
Finally, the genus Myohyrax is more enigmatic, as they exhibit highly specialized, ungulate-like hypsodont teeth that are unique among macroscelids (Andrews et al., 1979). Cranial, dental and postcranial features led several authors to suggest a tough diet (e.g., seeds), possibly a saltatorial locomotion, and a predilection for savannah (or “veldt”) habitat (Whitworth, 1954; Patterson, 1965).
None of these taxa represents a strict indicator for a forested environment. On the contrary, the reconstructed NG15 small mammal community supports an open floodplain environment with little wood cover. The observations of herbaceous roots and isotopic evidence for at least some C4 grass imply the availability of fodder for animals adapted to grazing (e.g., hypsodont teeth) and open spaces suitable for fast moving animals (e.g., saltatorial locomotion). The spatially restricted and stratigraphically limited NG15 assemblage does not represent the entirety of the faunal community from Karungu. Hence, further studies are necessary to understand the faunal and environmental variations within the stratigraphic record preserved at Karungu.
Comparison to Paleoenvironments of the Hiwegi Formation on Rusinga Island
Previous investigations have often treated early Miocene deposits at Karungu and Rusinga Island, specifically the fauna of the Hiwegi Formation, as comparable (Nesbit Evans et al., 1981; Pickford, 1981). However, the results of this study and the work of Driese et al. (2016) call this assumption into question for a number of reasons. First, lithostratigraphic and paleopedologic analyses of the entire sequence indicate a variety of depositional environments (Driese et al., 2016). Additionally, our results, which document differences in the faunal assemblages between surface collections at Ngira and the excavation at NG15, also support the interpretation of multiple paleoenvironments within Ngira. Second, paleoenvironmental interpretations for the Hiwegi Formation on Rusinga Island indicate multiple environments ranging from more open shrubland to riparian woodland to closed-canopy tropical seasonal forest (Collinson et al., 2009; Conrad et al., 2013; Maxbauer et al., 2013; Michel et al., 2014). Third, the paleoenvironmental reconstructions for nearly every Critical Zone component reconstructed for NG15 are different from most recent environmental and climatic reconstructions of the Hiwegi Formation. While the stratigraphy at Ngira consists of interbedded fluvial and lacustrine strata (Driese et al., 2016), sedimentation in the Hiwegi Formation is a mixture of fluvial, palustrine, and primary and reworked volcaniclastic material (e.g., ash fallout and lahars; Bestland and Krull, 1999; Maxbauer et al., 2013; Michel et al., 2014). This indicates that there were substantial differences in physical sedimentary environments between Karungu and the Hiwegi Formation. We reconstruct the NG15 interval as an open canopy environment, ranging from an open riparian woodland to a wooded grassland biome. This is similar to, though perhaps more open than, environmental reconstructions for the Grit Member and lower Fossil Bed Member of the Hiwegi Formation, which are reconstructed as a patchwork of woodland and forested biomes within a riparian habitat in a warm and highly seasonal climate in which evaporitic conditions were recurrent (Collinson et al., 2009; Conrad et al., 2013; Maxbauer et al., 2013). Likewise, the interpretations for the NG15 interval are considerably different from the paleoenvironmental reconstruction for the Kibanga Member of the Hiwegi Formation, which is reconstructed to be a closed-canopy, tropical seasonal forest (Michel et al., 2014). Fourth, there are notable differences in the fauna recovered from Karungu and that of the Hiwegi Formation, particularly in the composition and abundance of small mammals and especially primates.
These differences between Karungu and Rusinga Island draw into question the reliability of wholesale comparisons of faunal composition and abundances between early Miocene sites before detailed geologic analyses are performed. For example, Pickford (1981) suggested that the Karungu fauna was most similar to that of the Hiwegi Formation from Rusinga Island (i.e., his faunal Set II). Perhaps the most conspicuous difference between Karungu and the Hiwegi Formation is the rarity of primate taxa at Karungu, in comparison to the relatively common primates found in the Hiwegi Formation. Coupled with evidence for variability in paleoenvironment and paleovegetation through the deposits at Karungu and through the Hiwegi Formation (e.g., this study; Collinson et al., 2009; Maxbauer et al., 2013; Michel et al., 2014; Driese et al., 2016), the differences in the faunal abundance and occurrences between Karungu and Rusinga Island are likely related to true faunal differences, possibly as a result of paleoenvironment differences.
Compared to the 34 genera (smaller or equal in size with M. pentadactylus) recorded from the Hiwegi formation at Rusinga Island (e.g., Pickford, 1986), the small mammal collections of both the NG15 excavation (10 genera) and the Ngira surface collections (18 genera) are less taxonomically diverse. This could be an artifact of sampling bias, but we have exhaustively collected the Ngira deposits at Karungu over the last several years and small mammals are uncommon and carnivore and primate taxa are very rare. Thus, we hypothesize that the difference in small mammal diversity and abundance between Karungu and the Hiwegi Formation on Rusinga Island reflect true differences in the fauna. When our results are coupled with recent paleoenvironmental reconstructions from Karungu and the Hiwegi Formation (e.g., Collinson et al., 2009; Conrad et al., 2013; Maxbauer et al., 2013; Michel et al., 2014; Driese et al., 2016), we conclude that a substantial heterogeneity of environments and climates existed in western Kenya in the early Miocene, and the paucity of primates at Karungu is not likely the result of biotic factors alone.
Paleoenvironmental Context in East Africa
In general, early Miocene environments across East Africa are interpreted to have been dominated by tropical forest or woodland vegetation (Andrews and Van Couvering, 1975; Edwards et al., 2010). Stable isotope analyses of compound-specific biomarkers (Uno et al., 2016), pedogenic carbonate (Cerling, 1992), and fossil tooth enamel (Cerling et al., 1998) suggest that C4 vegetation was not common across East Africa until ca.10 Ma, with a gradual rise of C4-dominated grasslands starting in the late Miocene at ca. 8 Ma. Nevertheless, several lines of evidence suggest that a patchwork of environments existed in the early Miocene, at least in some parts of the region.
Sediment cores from the Niger River delta show evidence of grass pollen and charred grass cuticle appearing in low abundance at ca. 16 Ma, which is interpreted to signify the initiation of seasonally dry savannahs (Morley and Richards, 1993). A review of Cenozoic vegetation across East Africa by Bonnefille (2010) provides strong evidence for a patchwork of dry, seasonal woodlands to humid forest habitats across the tropical belts of the African continent as early as the late Eocene. Pedogenic carbonates from the Tugen Hills succession near Lake Baringo in Kenya have δ13C values consistent with mixed C3 and C4 vegetation from 15 Ma to Recent (Kingston et al., 1994). Contemporaneous mammals from the same strata in the Tugen Hills also have tooth enamel δ13C values that are higher than expected for a pure C3 endmember, and in the absence of vegetation with extreme water stress, those mammals with high δ13C values likely consumed some portion of C4 vegetation in their diets (Morgan et al., 1994). Based on the tendency of C4 vegetation to exist in open canopy conditions in modern ecosystems, it is likely that the Tugen Hills succession contained at least a patchwork of woodland/shrubland to woody grassland environments.
Our observations supporting the presence of open canopy, dry woodland to woody grassland at Karungu are consistent with previous faunal analyses by Andrews et al. (1979), who compared the composition of modern faunas with that of early Miocene sites. These included a total of 15 species (including microvertebrates) (Andrews, 1974) from Karungu recovered from excavations and sieving from Oswald's (1914) Bed 16. According to our fieldwork, this stratigraphic interval corresponds to units 20–22 of Driese et al. (2016), 3–5 m above NG15. In Andrews' et al. (1979) analysis, the fauna from Karungu stood out because: (1) its ecological diversity patterns as well as its locomotor adaptations resemble those of non-forest faunas; (2) its taxonomic composition closely resembles that of woodland-bushland faunas (except for the lack of carnivorous species); (3) the smallest size categories predominate the assemblage; and (4) interpreted feeding patterns of the community overall were unlike those in any modern community. Interestingly, unlike the NG15 excavation, this faunal assemblage was dominated by Kenyalagomys and Myohyrax (74% of the total NISP; Andrews, 1974). But because both taxa have no living relatives in Africa today, Andrews et al. (1979) considered that this faunal assemblage may either represent a habitat type that is no longer represented in Africa, or was a limited sample from a larger community. Based on similarities in pedogenic carbonate δ13C values and paleoclimate estimates between NG15 and NG19-NG20, we hypothesize that the fauna recovered from NG20-NG22 also represent open canopy conditions. These environments may not be comparable to any known modern landscape due to the possibly ephemeral and unique nature of early C4 savannahs or grasslands.
Finally, we posit a possible explanation for the lack of records of C4 vegetation in recently studied marine cores. Uno et al. (2016) present a compound-specific isotope record from cores taken from the Somali Basin, Gulf of Aden, and Red Sea. Their data offer a large-scale picture of vegetation types in East Africa, but necessarily sample externally-drained continental basins. However, the Ngira locality was potentially an endorheic basin, given the rapid lake level fluctuations documented in the stratigraphy (Driese et al., 2016), and therefore is very unlikely to have contributed to the record of Uno et al. (2016). This finding underscores the fact that, while a major turnover from C3 to C4 vegetation occurred in the late Miocene, much work remains for documenting landscape heterogeneity earlier in the geologic history of East Africa.
Taken together, the observations of pedogenic carbonate δ13C signatures, paleosol morphology, microcharcoal, and microvertebrate fauna presented in this and previous studies support an interpretation of open canopy conditions within an overall diverse environmental mosaic in the early Miocene of western Kenya.
Conclusions
Early Miocene deposits at Ngira show substantial environmental differences compared to the reconstructions for other contemporaneous primate-bearing deposits in Western Kenya. Climate and vegetation reconstructed for the NG15 stratigraphic interval is consistent with a dry, seasonal subhumid setting with open habitats likely ranging from open riparian woodland to wooded grassland, in which C4 vegetation may have been an important ecosystem component. These findings differ from previous reconstructions for deposits at Karungu and suggest that either depositional processes or habitat preference are the root causes of differences between the faunal communities at Karungu and Rusinga Island.
The findings presented in this study allow us to present a number of testable hypotheses to explain the scarcity of primate remains at Karungu:
(H1) Early Miocene primates did not inhabit the open-canopy environments at Ngira;
(H2) Fluvial deposition on relatively low-relief floodplains was less likely to preserve primate remains than volcanic and volcaniclastic sedimentation on higher-relief slopes at Rusinga and Mfangano Islands;
(H3) The age for deposits at Karungu are incorrect, and strata are not directly comparable to formations on Rusinga Island.
To test H1, additional early Miocene sites that lack primate remains should be investigated. Because the focus on sedimentary environments of sites in Western Kenya has largely been in conjunction with faunal sites, there is clearly much to learn regarding non-fossiliferous strata. To test H2, taphonomic studies of primate fossils on Rusinga Island and mammalian fossils at Karungu should be compared. Further geochronologic control is needed to test H3, although overall similarities in non-primate fauna suggested that deposits at Karungu are similar in age to the Hiwegi Formation on Rusinga Island (Pickford, 1981, 1986). Pending further investigations, we tentatively favor H1—that early Miocene primates did not favor the environments at Karungu—due to the lack of canopy cover in a more open woodland to woody grassland biome in early Miocene times. While some hominoid primates were clearly adapted to open-canopy conditions by the Pliocene (Cerling et al., 2011), it is yet unknown whether primates exploited non-forested ecosystems where they occurred in the early Miocene. Future investigations of early Miocene paleoclimate and paleoenvironments should include localities that lack primate fossils in order to test the relative importance of biotic vs. environmental controls on the occurrence of primates in the fossil record.
Author Contributions
WL and TL designed the study, collected field data, and performed laboratory analyses. WL, TL, DP, DF, SD, and KM wrote the manuscript.
Conflict of Interest Statement
The authors declare that the research was conducted in the absence of any commercial or financial relationships that could be construed as a potential conflict of interest.
Acknowledgments
Funding for this research was provided by the National Science Foundation (BCS #124812 to SD and DP, and BCS #1241807 to KM and DF), by the Karl und Marie Schack-Stiftung to TL, by the Vereinigung von Freunden und Förderern der Goethe-Universität Frankfurt to TL, and the Baylor University Department of Geosciences. We are grateful to the Kenyan government and National Museums of Kenya and Dr. F. Kyalo Manti for facilitating our work. Invaluable field assistance was provided by K. Jenkins, D. Aketch, T. Cicak, M. Fuchs, C. Hemm, R. Henning, U. Menz, S.N. Muteti, S.O. Oloo, D. Obura, C. Ochieng, J. Ouma, T. Rumpf, J. Tausch, T. Wenzel, W. Odhiambo, S. Odhiambo, B.A. Obonyo, J.L. Otieno, F. Odeny, J.O. Orembe., K. Ogondo, and J. Shaduma. Logistical support was provided by J. Siembo. We thank associated editor G.E. Stinchcomb and C. Magill and D. Barboni for careful and constructive reviews. This manuscript is publication #6 supporting Research on East African Catarrhine and Hominoid Evolution (REACHE).
Supplementary Material
The Supplementary Material for this article can be found online at: https://www.frontiersin.org/articles/10.3389/feart.2017.00087/full#supplementary-material
References
Andrews, C. W. (1911). On a new species of Dinotherium (Dinotherium hobleyi) from British East Africa. Proc. Zool. Soc. Lond. 81, 943–945. doi: 10.1111/j.1096-3642.1911.tb01964.x
Andrews, P. J. (1978). A revision of the Miocene Hominoidea of East Africa. Bull. Br. Mus. Nat. Hist. 30, 85–224.
Andrews, P., and Van Couvering, J. A. (1975). “Palaeoenvironments in the East African Miocene,” in Approaches to Primate Paleobiology, Vol. 5, ed F. S. Szalay. (Basel: Karger publisher), 62–103.
Andrews, P., Lord, J. M., and Nesbit Evans, E. A. (1979). Patterns of ecological diversity in fossil and modern mammalian faunas. Biol. J. Linn. Soc. 11, 177–205. doi: 10.1111/j.1095-8312.1979.tb00034.x
Begun, D. R. (2015). “Fossil record of Miocene hominoids,” in Handbook of Paleoanthropology, eds W. Henke and I. Tattersall (Berlin; Heidelberg: Springer), 1261–1332.
Bestland, E. A., and Krull, E. S. (1999). Palaeoenvironments of Early Miocene Kisingiri volcano Proconsul sites: evidence from carbon isotopes, palaeosols and hydromagmatic deposits. J. Geol. Soc. 156, 965–976. doi: 10.1144/gsjgs.156.5.0965
Bestland, E. A., Thackray, G. D., and Retallack, G. J. (1995). Cycles of doming and eruption of the Miocene Kisingiri Volcano, Southwest Kenya. J. Geol. 103, 598–607. doi: 10.1086/629779
Beverly, E. J., Driese, S. G., Peppe, D. J., Johnson, C. R., Michel, L. A., Faith, J. T., et al. (2015). Recurrent spring-fed rivers in a Middle to Late Pleistocene semi-arid grassland: implications for environments of early humans in the Lake Victoria Basin, Kenya. Sedimentology 62, 1611–1635. doi: 10.1111/sed.12199
Bond, W. J., and Keeley, J. E. (2005). Fire as a global “herbivore”: the ecology and evolution of flammable ecosystems. Trends Ecol. Evol. 20, 387–394. doi: 10.1016/j.tree.2005.04.025
Bonnefille, R. (2010). Cenozoic vegetation, climate changes and hominid evolution in tropical Africa. Global Planet. Change 72, 390–411. doi: 10.1016/j.gloplacha.2010.01.015
Brady, N. C., and Weil, R. C. (2008). The Nature and Properties of Soils, 14th Edn. Pearson Education, Inc. Upper Saddle River, NJ: Pearson Prentice Hall.
Brantley, S. L., Goldhaber, M. B., and Ragnarsdottir, K. V. (2007). Crossing disciplines and scales to understand the critical zone. Elements 3, 307–314. doi: 10.2113/gselements.3.5.307
Brimhall, G. H., and Dietrich, W. E. (1987). Constitutive mass balance relations between chemical composition, volume, density, porosity, and strain in metasomatic hydrochemical systems: results on weathering and pedogenesis. Geochim. Cosmochim. Acta 51, 567–587. doi: 10.1016/0016-7037(87)90070-6
Brimhall, G. H., Ford, C., Bratt, J., Taylor, G., and Warin, O. (1991). Quantitative geochemical approach to pedogenesis: importance of parent material reduction, volumetric expansion, and eolian influx in lateritization. Geoderma 51, 51–91. doi: 10.1016/0016-7061(91)90066-3
Bullock, P., Fedoroff, N., Jungerius, A., Stoops, G., and Tursina, T. (1985). Handbook of Soil Thin Section Description. Albrighton: Waine Research Publications.
Butynski, T. (2013a). “Family Pedetidae,” in Mammals of Africa, eds J. Kingdon, D. Happold, T. Butynski, M. Hoffmann, M. Happold, and J. Kalina (London: Bloomsbury Publishing), 618.
Butynski, T. (2013b). “Species profile: pedetes capensis,” in Mammals of Africa, eds J. Kingdon, D. Happold, T. Butynski, M. Hoffmann, M. Happold, and J. Kalina (London: Bloomsbury Publishing), 619–624.
Cerling, T. E. (1992). Development of grasslands and savannas in East Africa during the Neogene. Palaeogeogr. Palaeoclimatol. Palaeoecol. 97, 241–247. doi: 10.1016/0031-0182(92)90211-M
Cerling, T. E. (1991). Carbon dioxide in the atmosphere: evidence from Cenozoic and Mesozoic paleosls. Am. J. Sci. 291, 377–400. doi: 10.2475/ajs.291.4.377
Cerling, T. E., and Quade, J. (1993). “Stable carbon and oxygen isotopes in soil carbonates,” in Climate Change in Continental Isotopic Records, eds P. K. Swart, K. C. Lohmann, J. Mckenzie, and S. Savin (Washington, DC: American Geophysical Union), 217–231. doi: 10.1029/GM078p0217
Cerling, T. E., Ehleringer, J. R., and Harris, J. M. (1998). Carbon dioxide starvation, the development of C4 ecosystems, and mammalian evolution. Philos. Trans. R. Soc. Lond. B. Biol. Sci. 353, 159–171. doi: 10.1098/rstb.1998.0198
Cerling, T. E., Harris, J. M., MacFadden, B. J., Leakey, M. G., Quade, J., Eisenmann, V., et al. (1997). Global vegetation change through the Miocene/Pliocene boundary. Nature 389, 153–158. doi: 10.1038/38229
Cerling, T. E., Quade, J., Wang, Y., and Bowman, J. R. (1989). Carbon isotopes in soils and palaeosols as ecology and palaeoecology indicators. Nature 341, 138–139. doi: 10.1038/341138a0
Cerling, T. E., Wynn, J. G., Andanje, S. A., Bird, M. I., Korir, D. K., Levin, N. E., et al. (2011). Woody cover and hominin environments in the past 6 million years. Nature 476, 51–56. doi: 10.1038/nature10306
Chadwick, O. A., Brimhall, G. H., and Hendricks, D. M. (1990). From a black to a gray box — a mass balance interpretation of pedogenesis. Geomorphology 3, 369–390. doi: 10.1016/0169-555X(90)90012-F
Clark, W. E. L. G., and Leakey, L. S. B. (1951). “The miocene hominoidea of east africa,” in Fossil Mammals of Africa, Vol. 1 (London: Natural History).
Collinson, M. E., Andrews, P., and Bamford, M. K. (2009). Taphonomy of the early Miocene flora, Hiwegi Formation, Rusinga Island, Kenya. J. Hum. Evol. 57, 149–162. doi: 10.1016/j.jhevol.2009.02.010
Conrad, J. L., Jenkins, K., Lehmann, T., Manthi, F. K., Peppe, D. J., Nightingale, S., et al. (2013). New specimens of “Crocodylus” pigotti (Crocodylidae) from Rusinga Island, Kenya, and generic reallocation of the species. J. Vertebr. Paleontol. 33, 629–646. doi: 10.1080/02724634.2013.743404
Cook, R. D., and Weisberg, S. (1982). Residuals and Influence in Regression. New York, NY: Chapman & Hall.
Drake, R. E., Van Couvering, J. A., Pickford, M. H., Curtis, G. H., and Harris, J. A. (1988). New chronology for the Early Miocene mammalian faunas of Kisingiri, Western Kenya. J. Geol. Soc. 145, 479–491. doi: 10.1144/gsjgs.145.3.0479
Driese, S. G. (2004). Pedogenic Translocation of Fe in Modern and Ancient Vertisols and Implications for Interpretations of the Hekpoort Paleosol (2.25 Ga). J. Geol. 112, 543–560. doi: 10.1086/422665
Driese, S. G., Mora, C. I., Stiles, C. A., Joeckel, R. M., and Nordt, L. C. (2000). Mass-balance reconstruction of a modern Vertisol: implications for interpreting the geochemistry and burial alteration of paleo-Vertisols. Geoderma 95, 179–204. doi: 10.1016/S0016-7061(99)00074-9
Driese, S. G., Peppe, D. J., Beverly, E. J., DiPietro, L. M., Arellano, L. N., and Lehmann, T. (2016). Paleosols and paleoenvironments of the early Miocene deposits near Karungu, Lake Victoria, Kenya. Palaeogeogr. Palaeoclimatol. Palaeoecol. 443, 167–182. doi: 10.1016/j.palaeo.2015.11.030
Edwards, E. J., Osborne, C. P., Strömberg, C. A., Smith, S. A., Consortium, C. G., Bond, W. J., et al. (2010). The origins of C4 grasslands: integrating evolutionary and ecosystem science. Science 328, 587–591. doi: 10.1126/science.1177216
Ehleringer, J. R., and Cooper, T. A. (1988). Correlations between carbon isotope ratio and microhabitat in desert plants. Oecologia 76, 562–566. doi: 10.1007/BF00397870
Forbes, M. S., Bestland, E. A., Krull, E. S., and Dicker, D. G. (2004). Palaeoenvironmental mosaic of Proconsul habitats: geochemical and sedimentalogical interpretation of Kisingiri fossil sites, Western Kenya. J. Afr. Earth Sci. 39, 63–79. doi: 10.1016/j.jafrearsci.2004.04.003
Fox, D. L., Honey, J. G., Martin, R. A., and Peláez-Campomanes, P. (2012). Pedogenic carbonate stable isotope record of environmental change during the Neogene in the southern Great Plains, southwest Kansas, USA: carbon isotopes and the evolution of C4-dominated grasslands. Geol. Soc. Am. Bull. 124, 444–462. doi: 10.1130/B30401.1
Gallagher, T. M., and Sheldon, N. D. (2013). A new paleothermometer for forest paleosols and its implications for Cenozoic climate. Geology 41, 647–650. doi: 10.1130/G34074.1
Ge, D., Wen, Z., Xia, L., Zhang, Z., Erbajeva, M., Huang, C., et al. (2013). Evolutionary history of lagomorphs in response to global environmental change. PLoS ONE 8:e59668. doi: 10.1371/journal.pone.0059668
Gebo, D. L., MacLatchy, L., Kityo, R., Deino, A., Kingston, J., and Pilbeam, D. (1997). A hominoid genus from the early Miocene of Uganda. Science 276, 401–404. doi: 10.1126/science.276.5311.401
Geraads, D., Lehmann, T., Peppe, D. J., and McNulty, K. P. (2016). New Rhinocerotidae from the Kisingiri localities (lower Miocene of western Kenya). J. Vertebr. Paleontol. 36:e1103247. doi: 10.1080/02724634.2016.1103247
Happold, D. C. D. (2013a). “Family thryonomyidae,” in Mammals of Africa, eds J. Kingdon, D. Happold, T. Butynski, M. Hoffmann, M. Happold, and J. Kalina (London: Bloomsbury Publishing), 685–690.
Happold, D. C. D. (2013b). “Order Lagomorpha,” in Mammals of Africa, eds J. Kingdon, D. Happold, T. Butynski, M. Hoffmann, M. Happold, and J. Kalina (London: Bloomsbury Publishing), 693–717.
Harrison, T. (2010). “Dendropithecoidea, proconsuloidea, and hominoidea” in Cenozoic Mammals of Africa, eds L. Werdelin and W. J. Sanders (Berkeley, CA: University of California Press), 429–469
Hopwood, A. T. (1933). XI.—Miocene Primates from British East Africa. J. Nat. Hist. 11, 96–98. doi: 10.1080/00222933308673629
Jacobs, B. F., Kingston, J. D., and Jacobs, L. L. (1999). The Origin of Grass-Dominated Ecosystems. Ann. Mo. Bot. Gard. 86, 590. doi: 10.2307/2666186
Jacobs, B. F., Pan, A. D., and Scotese, C. R. (2010). “A review of the Cenozoic vegetation history of Africa,” in Cenozoic Mammals of Africa, eds L. Werdelin and W. J. Sanders (Berkeley, CA: University California Press), 57–72.
Kay, R. F., and Ungar, P. S. (1997). “Dental evidence for diet in some Miocene catarrhines with comments on the effects of phylogeny on the interpretation of adaptation,” in Function, Phylogeny, and Fossils, eds D. R. Begun, C. V. Ward, and M. D. Rose (New York, NY: Springer; Plenum Publishing Co.), 131–151.
Keeley, J. E., and Rundel, P. W. (2005). Fire and the Miocene expansion of C4 grasslands: Miocene C4 grassland expansion. Ecol. Lett. 8, 683–690. doi: 10.1111/j.1461-0248.2005.00767.x
Kelley, J. (1986). Species recognition and sexual dimorphism in Proconsul and Rangwapithecus. J. Hum. Evol. 15, 461–495. doi: 10.1016/S0047-2484(86)80028-8
Kelley, J. (1993). “Taxonomic implications of sexual dimorphism in Lufengpithecus,” in Species, Species Concepts and Primate Evolution, eds W. H. Kimbel and L. B. Martin (New York, NY: Springer; Plenum Press), 429–458.
Kelley, J. (1997). “Paleobiological and phylogenetic significance of life history in Miocene hominoids,” in Function, Phylogeny, and Fossils, eds D. R. Begun, C. V. Ward, and M. D. Rose (New York, NY: Springer; Plenum Publishing Co.), 173–208.
Kelley, J. (2002). “The hominoid radiation in Asia,” in The Primate Fossil Record. ed W. C. Hartwig (Cambridge: Cambridge University Press).
King, B. C., Le Bas, M. J., and Sutherland, D. S. (1972). The history of the alkaline volcanoes and intrusive complexes of eastern Uganda and western Kenya. J. Geol. Soc. 128, 173–205. doi: 10.1144/gsjgs.128.2.0173
Kingston, J. D., Marino, B. D., and Hill, A. (1994). Isotopic evidence for Neogene hominid paleoenvironments in the Kenya Rift Valley. Science 264, 955–958. doi: 10.1126/science.264.5161.955
Kohn, M. J. (2010). Carbon isotope compositions of terrestrial C3 plants as indicators of (paleo)ecology and (paleo)climate. Proc. Natl. Acad. Sci. U.S.A. 107, 19691–19695. doi: 10.1073/pnas.1004933107
Leakey, L. S. B. (1943). A Miocene anthropoid mandible from Rusinga, Kenya. Nature 152, 319–320. doi: 10.1038/152319a0
Leakey, M., and Walker, A. (1997). “Afropithecus,” in Function, Phylogeny, and Fossils, eds D. R. Begun, C. V. Ward, and M. D. Rose (New York, NY: Springer; Plenum Publishing Co.), 225–239.
Lehmann, T., Peppe, D. J., Driese, S. G., Jenkins, K., Sanders, W. J., and McNulty, K. P. (2014). New fieldwork at Karungu (early Miocene; Lake Victoria, Kenya): preliminary paleontological and geological results. J. Vertebr. Paleontol. Progr. Abstr. A168.
Lovejoy, C. O. (2009). Reexamining human origins in light of Ardipithecus ramidus. Science 326, 74–74e8. doi: 10.1126/science.1175834
Lovejoy, C. O., Simpson, S. W., White, T. D., Asfaw, B., and Suwa, G. (2009a). Careful climbing in the Miocene: the forelimbs of Ardipithecus ramidus and humans are primitive. Science 326, 70–70e8. doi: 10.1126/science.1175827
Lovejoy, C. O., Suwa, G., Simpson, S. W., Matternes, J. H., and White, T. D. (2009b). The great divides: Ardipithecus ramidus reveals the postcrania of our last common ancestors with African apes. Science 326, 73–106. doi: 10.1126/science.1175833
MacLatchy, L., Gebo, D., Kityo, R., and Pilbeam, D. (2000). Postcranial functional morphology of Morotopithecus bishopi, with implications for the evolution of modern ape locomotion. J. Hum. Evol. 39, 159–183. doi: 10.1006/jhev.2000.0407
MacLatchy, L., Rossie, J., Smith, T. M., and Tafforeau, P. (2010). Evidence for dietary niche separation in the miocene hominoids morotopithecus and afropithecus. Am. J. Phys. Anthropol. Supplement. 48:181.
Maxbauer, D. P., Peppe, D. J., Bamford, M., McNulty, K. P., Harcourt-Smith, W. E., and Davis, L. E. (2013). A morphotype catalog and paleoenvironmental interpretations of early Miocene fossil leaves from the Hiwegi Formation, Rusinga Island, Lake Victoria, Kenya. Palaeontol. Electron. 16.3.28A. Available online at: http://palaeo-electronica.org/content/2013/547-rusinga-island-flora
McCollum, M. S., Peppe, D. J., McNulty, K. P., Dunsworth, H. M., Harcourt-Smith, W. E. H., and Andrews, A. L. (2013). Magnetostratigraphy of the early miocene hiwegi formation (Rusinga Island, Lake Victoria, Kenya). Geol. Soc. Am. Abst. Prog. 44:241.
McNulty, K. P. (2003). Geometric Morphometric Analyses of Extant and Fossil Hominoid Craniofacial Morphology, Unpublished PhD. Thesis, University of New York.
McNulty, K. P., Begun, D. R., Kelley, J., Manthi, F. K., and Mbua, E. N. (2015). A systematic revision of Proconsul with the description of a new genus of early Miocene hominoid. J. Hum. Evol. 84, 42–61. doi: 10.1016/j.jhevol.2015.03.009
McNulty, K. P., Harcourt-Smith, W. E. H., and Dunsworth, H. M. (2007). New primate fossils from rusinga island, kenya. Am. J. Phys. Anthropol. 132:170.
Michel, L. A., Peppe, D. J., Lutz, J. A., Driese, S. G., Dunsworth, H. M., Harcourt-Smith, W. E. H., et al. (2014). Remnants of an ancient forest provide ecological context for Early Miocene fossil apes. Nat. Commun. 5:3236. doi: 10.1038/ncomms4236
Mintz, J. S., Driese, S. G., Breecker, D. O., and Ludvigson, G. A. (2011). Influence of changing hydrology on pedogenic calcite precipitation in Vertisols, Dance Bayou, Brazoria County, Texas, U.S.A.: implications for estimating paleoatmospheric pCO2. J. Sediment. Res. 81, 394–400. doi: 10.2110/jsr.2011.36
Moore, D. M., and Reynolds, R. C. (1997). X-ray Diffraction and the Identification and Analysis of Clay Minerals. Oxford: Oxford University Press Oxford.
Morgan, M. E., Kingston, J. D., and Marino, B. D. (1994). Carbon isotopic evidence for the emergence of C4 plants in the Neogene from Pakistan and Kenya. Nature 367, 162–165. doi: 10.1038/367162a0
Morley, R. J., and Richards, K. (1993). Gramineae cuticle: a key indicator of Late Cenozoic climatic change in the Niger Delta. Rev. Palaeobot. Palynol. 77, 119–127. doi: 10.1016/0034-6667(93)90060-8
Myers, T. S., Tabor, N. J., and Jacobs, L. L. (2011). Late Jurassic paleoclimate of central Africa. Palaeogeogr. Palaeoclimatol. Palaeoecol. 311, 111–125. doi: 10.1016/j.palaeo.2011.08.013
Nesbit Evans, E., Van Couvering, J. A., and Andrews, P. (1981). Palaeoecology of Miocene sites in western Kenya. J. Hum. Evol. 10, 99–116. doi: 10.1016/S0047-2484(81)80027-9
Nordt, L. C., and Driese, S. G. (2013). Application of the Critical Zone Concept to the Deep-Time Sedimentary Record Lee C. Sediment. Rec. 11, 4–9. doi: 10.2110/sedred.2013.3.4
Nordt, L. C., Hallmark, C. T., Driese, S. G., Dworkin, S. I., and Atchley, S. C. (2012). Biogeochemical characterization of a lithified paleosol: implications for the interpretation of ancient Critical Zones. Geochim. Cosmochim. Acta 87, 267–282. doi: 10.1016/j.gca.2012.03.019
O'Leary, M. H. (1988). Carbon isotopes in photosynthesis. Bioscience 38, 328–336. doi: 10.2307/1310735
Olszewski, T. (1999). Taking advantage of time-averaging. Paleobiology 25, 226–238. doi: 10.1017/S009483730002652X
Oswald, F. (1914). The Miocene Beds of the Victoria Nyanza and the geology of the country between the lake and the Kisii Highlands. Q. J. Geol. Soc. 70, 128–159. doi: 10.1144/GSL.JGS.1914.070.01-04.10
Passey, B. H., Cerling, T. E., Perkins, M. E., Voorhies, M. R., Harris, J. M., and Tucker, S. T. (2002). Environmental Change in the Great Plains: an Isotopic Record from Fossil Horses. J. Geol. 110, 123–140. doi: 10.1086/338280
Patterson, B. (1965). The fossil elephant shrews (Family Macroscelididae). Bull. Mus. Comp. Zool. 133, 297–335.
Peppe, D. J., Deino, A. L., Driese, S. G., Dunsworth, H. M., Fox, D. L., Harcourt-Smith, W. E. H., et al. (2017). Revised geochronology of the early miocene faunas from Rusinga Island and Mfangano Island (Lake Victoria, Kenya): implications for miocene hominoid evolution and faunal succession. Am. J. Phys. Anthropol. 162:313. doi: 10.1002/ajpa.23210
Pickford, M. (1981). Preliminary Miocene mammalian biostratigraphy for western Kenya. J. Hum. Evol. 10, 73–97. doi: 10.1016/S0047-2484(81)80026-7
Pickford, M. (1986). Sedimentation and fossil preservation in the Nyanza Rift System, Kenya. Geol. Soc. Lond. Spec. Publ. 25, 345–362. doi: 10.1144/GSL.SP.1986.025.01.29
Pickford, M., and Mein, P. (2011). Nuevos Pedetidae (Rodentia: Mammalia) del Mio-Plioceno de Africa. Estud. Geol. 67, 455–469. doi: 10.3989/egeol.40714.202
Poppe, L. J., Paskevich, V. F., Hathaway, J. C., and Blackwood, D. S. (2001). A Laboratory Manual for X-Ray Powder Diffraction. US Geological Survey Open-File Report 01-041.
R Core Team (2016). R: A Language and Environment for Statistical Computing: Vienna: R Foundation for Statistical Computing. Available online at: https://www.R-project.org/
Rascio, N. (2002). The underwater life of secondarily aquatic plants: some problems and solutions. Crit. Rev. Plant Sci. 21, 401–427. doi: 10.1080/0735-260291044296
Retallack, G. J. (2008). Soils of the Past: An Introduction to Paleopedology. 2nd Edn., (Oxford, UK: Blackwell Science Ltd.), doi: 10.1002/9780470698716
Rogers, R. R., Carrano, M. T., Rogers, K. A. C., Perez, M., and Regan, A. K. (2017). Isotaphonomy in concept and practice: an exploration of vertebrate microfossil bonebeds in the Upper Cretaceous (Campanian) Judith River Formation, north-central Montana. Paleobiology 43, 248–273. doi: 10.1017/pab.2016.37
Sage, R. F. (2004). The evolution of C4 photosynthesis. New Phytol. 161, 341–370. doi: 10.1111/j.1469-8137.2004.00974.x
Sanders, W. J., and Bodenbender, B. E. (1994). Morphometric analysis of lumbar vertebra UMP 67-28: implications for spinal function and phylogeny of the Miocene Moroto hominoid. J. Hum. Evol. 26, 203–237. doi: 10.1006/jhev.1994.1012
Schoeneberger, P. J. (2002). Field Book for Describing and Sampling Soils. Lincoln, NE: Government Printing Office.
Sheldon, N. D., Retallack, G. J., and Tanaka, S. (2002). Geochemical climofunctions from North American soils and application to paleosols across the Eocene-Oligocene boundary in Oregon. J. Geol. 110, 687–696. doi: 10.1086/342865
Smith, M., and Mosley, P. (1993). Crustal heterogeneity and basement influence on the development of the Kenya Rift, East Africa. Tectonics 12, 591–606. doi: 10.1029/92TC01710
Stinchcomb, G. E., Nordt, L. C., Driese, S. G., Lukens, W. E., Williamson, F. C., and Tubbs, J. D. (2016). A data-driven spline model designed to predict paleoclimate using paleosol geochemistry. Am. J. Sci. 316, 746–777. doi: 10.2475/08.2016.02
Tipple, B. J., Meyers, S. R., and Pagani, M. (2010). Carbon isotope ratio of Cenozoic CO2: a comparative evaluation of available geochemical proxies. Paleoceanography 25:PA3202. doi: 10.1029/2009PA001851
Ufnar, D. F., Gröcke, D. R., and Beddows, P. A. (2008). Assessing pedogenic calcite stable-isotope values: can positive linear covariant trends be used to quantify palaeo-evaporation rates? Chem. Geol. 256, 46–51. doi: 10.1016/j.chemgeo.2008.07.022
Ungar, P. S., Scott, J. R., Curran, S. C., Dunsworth, H. M., Harcourt-Smith, W. E. H., Lehmann, T., et al. (2012). Early Neogene environments in East Africa: evidence from dental microwear of tragulids. Palaeogeogr. Palaeoclimatol. Palaeoecol. 342, 84–96. doi: 10.1016/j.palaeo.2012.05.005
Uno, K. T., Polissar, P. J., Jackson, K. E., and deMenocal, P. B. (2016). Neogene biomarker record of vegetation change in eastern Africa. Proc. Natl. Acad. Sci. U.S.A. 113, 6355–6363. doi: 10.1073/pnas.1521267113
Vepraskas, M. J. (2001). “Morphological features of seasonally reduced soils,” in Wetland Soils: Genesis, Hydrology, Landscapes, and Classification, eds J. L. Richardson and M. J. Vepraskas (Washington, DC: Lewis Publishers), 163–182.
Walker, A., Teaford, M. F., Martin, L., and Andrews, P. (1993). A new species of Proconsul from the early Miocene of Rusinga/Mfangano Islands, Kenya. J. Hum. Evol. 25, 43–56. doi: 10.1006/jhev.1993.1037
Whitworth, T. (1954). “The miocene hyracoids of east africa,” in Fossil mammals of Africa, Vol. 7, British Museum (London: Natural History), 1–58.
Keywords: paleosol, hominoid, paleovegetation, paleoclimate, paleoenvironment
Citation: Lukens WE, Lehmann T, Peppe DJ, Fox DL, Driese SG and McNulty KP (2017) The Early Miocene Critical Zone at Karungu, Western Kenya: An Equatorial, Open Habitat with Few Primate Remains. Front. Earth Sci. 5:87. doi: 10.3389/feart.2017.00087
Received: 12 July 2017; Accepted: 06 October 2017;
Published: 25 October 2017.
Edited by:
Gary E. Stinchcomb, Murray State University, United StatesReviewed by:
Clayton Magill, Heriot-Watt University, United KingdomDoris Barboni, UMR7330 Centre Européen de Recherche et d'enseignement de Géosciences de l'environnement (CEREGE), France
Copyright © 2017 Lukens, Lehmann, Peppe, Fox, Driese and McNulty. This is an open-access article distributed under the terms of the Creative Commons Attribution License (CC BY). The use, distribution or reproduction in other forums is permitted, provided the original author(s) or licensor are credited and that the original publication in this journal is cited, in accordance with accepted academic practice. No use, distribution or reproduction is permitted which does not comply with these terms.
*Correspondence: William E. Lukens, bill_lukens@baylor.edu