 Jessica Miesel
 Alicia Reiner2
 Bernardo Maestrini
- 1Department of Forestry, Michigan State University, East Lansing, MI, United States
- 2Enterprise Program, USDA Forest Service, Brevard, NC, United States
- 3Region 5, USDA Forest Service, Sonora, CA, United States
- 4Northern Research Station, USDA Forest Service, Delaware, OH, United States
Positive feedbacks between wildfire emissions and climate are expected to increase in strength in the future; however, fires not only release carbon (C) from terrestrial to atmospheric pools, they also produce pyrogenic C (PyC) which contributes to longer-term C stability. Our objective was to quantify wildfire impacts on total C and PyC stocks in California mixed-conifer forest, and to investigate patterns in C and PyC stocks and changes across gradients of fire severity, using metrics derived from remote sensing and field observations. Our unique study accessed active wildfires to establish and measure plots within days before and after fire, prior to substantial erosion. We measured pre- and post-fire aboveground forest structure and woody fuels to calculate aboveground biomass, C and PyC, and collected forest floor and 0–5 cm mineral soil samples. Immediate tree mortality increased with severity, but overstory C loss was minimal and limited primarily to foliage. Fire released 85% of understory and herbaceous C (comprising < 1.0% of total ecosystem C). The greatest C losses occurred from downed wood and forest floor pools (19.3 ± 5.1 Mg ha−1 and 25.9 ± 3.2 Mg ha−1, respectively). Tree bark and downed wood contributed the greatest PyC gains (1.5 ± 0.3 Mg ha−1 and 1.9 ± 0.8 Mg ha−1, respectively), and PyC in tree bark showed non-significant positive trends with increasing severity. Overall PyC losses of 1.9 ± 0.3 Mg ha−1 and 0.5 ± 0.1 Mg ha−1 occurred from forest floor and 0–5 cm mineral soil, with no clear patterns across severity. Fire resulted in a net ecosystem PyC gain (1.0 ± 1.0 Mg ha−1) across aboveground and belowground components of these forests, and there were no differences among severity levels. Carbon emissions represented only 21.6% of total forest C; however, extensive conversion of C from live to dead pools will contribute to large downed wood C pools susceptible to release in a subsequent fire, indicating that there may be a delayed relationship between fire severity and C emissions. This research advances understanding of forest C loss and stabilization as PyC in wildfires; however, poor relationships between C and PyC gains or losses and fire severity highlight the complexity of fire impacts on forest C.
Introduction
Wildfires play a major role in controlling forest carbon (C) storage and cycling in fire-suppressed forests in the western United States (US) (Earles et al., 2014), and are expected to increase in frequency and size in future climate conditions (Westerling et al., 2011; Moritz et al., 2012). Increased tree density and fuel accumulation in low- to middle-elevation mixed-conifer forests of the western US since the early 1900s have contributed to the present-day occurrence of fires that are larger and burn at greater intensity relative to historic conditions (Covington and Moore, 1994; Schoennagel et al., 2004). Increased fire activity in these forests has also been influenced by warming temperatures in recent decades (Westerling et al., 2006). For example, warming temperatures are associated with earlier and warmer growing seasons, as well as increased fire season length, and, in combination with drought, also increase tree mortality rates, fuel load accumulation, and flammability of live and dead fuels (Breshears et al., 2005; Westerling et al., 2006; Van Mantgem et al., 2009; Littell et al., 2016). Projections of future wildfire area burned in the state of California range from increases of 36–74% by the year 2085, and >100% for forests in northern California (Westerling et al., 2011). These changes are expected to lead to positive feedbacks among climate, fire and fire-mediated C cycling that threaten to exacerbate climate warming (Liu et al., 2014; Barbero et al., 2015; Millar and Stephenson, 2015), which in turn increases drought stress in trees, and, consequently, increased fire severity (Van Mantgem et al., 2013).
The severity of a fire describes the magnitude of impact to an ecosystem, and is represented by a wide variety of definitions and metrics (Keeley, 2009; Jain et al., 2012; Morgan et al., 2014). Keeley (2009) provided a standardized definition of fire severity as “aboveground and belowground organic matter consumption from fire” and he includes fire-caused plant mortality as a type of organic matter consumption. Consequently, accumulated fuels and their increased flammability due to low moisture content during drought conditions are likely to contribute to increased wildfire combustion and, therefore, severity of immediate effects.
Increases in fire severity and patch size of high-severity areas in many conifer forests in California have been reported over recent decades, with above-average increases in low- to middle-elevation forests such as the widespread mixed-conifer forest type (Miller et al., 2009b). The proportion of area burned in conifer forests is also greater in areas dominated by smaller-diameter trees than areas dominated by larger-diameter trees (Miller et al., 2012), suggesting that fire-suppressed forests as well as regenerating forests are susceptible to—and contribute to—increased fire size and severity.
Efforts to develop and apply standard indices for characterizing fire severity are relatively recent and include remote sensing approaches (Key and Benson, 2006; Miller and Thode, 2007; Robichaud et al., 2007) as well as field classification of composite [e.g., Composite Burn Index (CBI), (Key and Benson, 2006)] and stratrum-specific impacts (NPS, 2003; Keeley, 2009; Jain et al., 2012). Field indices classify fire severity based on the extent of organic matter loss or decomposition (i.e., using metrics such as tree crown scorch, tree mortality, woody fuel consumption, loss of soil organic horizons, etc.), and although vegetation composition, structure, and environmental factors also influence organic matter loss, fire severity indices generally reflect fireline intensity (Keeley, 2009; Morgan et al., 2014). Because of variability in characteristics in vegetation and soil within and across ecosystems (e.g., extent of mineral soil exposure, soil color, vegetation structure and stem density), fire severity is best evaluated based on knowledge of pre-fire ecosystem characteristics (Keeley, 2009), but these data often may not exist in areas that experience unplanned fires.
Understanding how fire severity influences C flux to the atmosphere is crucial, not only for predicting climate impacts, but also for developing mitigation strategies that support forest resilience, especially in a time of shifting disturbance regimes and poorly understood impacts on forest ecosystem services. Over a full post-fire successional sequence and at landscape scales in fire-adapted systems with constant fire return intervals, the net impact of fire on C emissions is zero, because tree growth will offset the C emission due to combustion and dead biomass decomposition (Harmon, 2001; Hurteau and Brooks, 2011; Loehman et al., 2014). However, this theory may not hold if one of its assumptions—full post-fire successional sequence, landscape scale, constant fire return interval, no fire-induced structural change—is not met. Future scenarios of changes in the climate and the socio-economic context in Californian mixed conifer forests are now challenging the applicability of the net-zero emission principle in the future. For example, an increase in fire severity in Sierra Nevada forests, as suggested by Miller and Safford (2012), has potential to impact forest structure by favoring chaparral over mixed conifer forests (Lauvaux et al., 2016). Under a scenario where the net zero emission principle is applicable, the timescale for complete recovery of emitted C is largely dependent on the pre-fire conditions and fire severity. For example, a study conducted 4–5 years after fire in an Oregon mixed-conifer forest showed that low-severity areas were a net sink of C even though they had only partially recovered the lost C, whereas high-severity areas were still a C source because of dead wood decomposition (Meigs et al., 2009). Weichman et al. (2015) found that 50% of emitted C was recovered 10 years after a prescribed burn in a California mixed-conifer forest, whereas Eskelson et al. (2016) reported significant losses of live wood C in low- and moderate-severity areas, but no change in high-severity areas, over 6 years post-fire for 130 Forest Inventory and Analysis plots in the same state. Therefore, in fire-prone forests, increases in fire severity have potential to increase short-term C losses via fire emissions (including emissions from otherwise longer-lived C pools such as dead wood and mineral soil C) as well as decrease longer-term C storage by slowing the rate of post-fire forest recovery (Pan et al., 2011). For example, a shift from historically low- to mixed-severity fire in western mixed-conifer forests to fires that are larger and result in a greater extent of high-severity areas has potential to disrupt successional trajectories and result in ecosystem replacement, with major impacts on post-fire C sequestration (Folke et al., 2004; Bond-Lamberty et al., 2007).
However, the relationship between fire severity and forest C budgets are complex, because wildfires not only release C from terrestrial to atmospheric pools, they also produce pyrogenic C (PyC) that contributes to C sequestration over longer (i.e., decadal to millennial) time-scales when present in soils (Bird et al., 2015; Santín et al., 2015b). Pyrogenic C defines a class of organic compounds altered by heat under anoxic conditions (pyrolysis). The chemistry of these molecules is heterogenous and can be represented as a “continuum” of compounds ranging from slightly charred biomass to highly condensed aromatic materials (Masiello, 2004; Bird et al., 2015), all of which are characterized by an increase in C concentration relative to their non-pyrolyzed precursors (Bird et al., 2015). Although part of the PyC pool is labile, PyC ages of 100s−1000s of years, and even up to 10,000 years have been reported in the top 1 m of soil, indicating that PyC can be one of the longest-lived C pools in terrestrial ecosystems (Schmidt et al., 2002, 2011; Eckmeier et al., 2009). Therefore, conversion of biomass and soil C into long-lived PyC during fires may help mitigate a proportion of fire-induced C losses.
Seiler and Crutzen (1980) produced the first global estimate of PyC production using a simple model based on burned area, biomass stock and burning efficiency. Since then, charcoal research has reached important milestones in determining the fate of PyC once it become embedded in the soil matrix; however, the production rate of PyC during wildfire in natural conditions still represents a poorly addressed research gap (Santín et al., 2015a). Biomass type and formation conditions (i.e., temperature, oxygen availability) influence PyC stocks and characteristics (Baldock and Smernik, 2002; Hammes et al., 2006; McBeath et al., 2011; Hatton et al., 2016), and natural PyC is known to exhibit a range of physical and chemical characteristics depending on fire characteristics (McBeath and Smernik, 2009; McBeath et al., 2013; Michelotti and Miesel, 2015; Uhelski and Miesel, 2017). Conversion rates for C to PyC in boreal forests for the forest floor layer range between 0.7% using the benzene polycarboxylic acid (BPCA) method (Czimczik et al., 2003) and 24.5% using elemental analysis on visually blackened material (Santín et al., 2015b). Conversion rates also vary across forest components, as low as 7.3% for conifer needles to 67.1% for bark in a boreal jack pine fores (Santín et al., 2015b). Saiz et al. (2015) estimated a 16% conversion rate for surface fuels across contrasting tropical savannas using visual, gravimetric and total C identification. Differences among ecosystems and among quantification methodologies contribute to the variability of these results. Many studies, in fact, report only a partial estimate of charcoal formation, e.g., accounting only for the charcoal present on the ground after fire (Fearnside et al., 2001) or in the bark of standing trees (Makoto et al., 2011). PyC formation rates have also been investigated in laboratory studies, and although the influence of individual factors on PyC formation rate has been well characterized—e.g., temperature (Keiluweit et al., 2010), moisture (Brewer et al., 2013), or fuel type (Hammes et al., 2006)—their interaction in the field remains largely unpredictable (Santín et al., 2017). Therefore, there is a pressing need to produce data that will help predict PyC formation rate from data on biomass and fire characteristics that are increasingly available at relatively high spatial and temporal resolution, e.g., data derived from remote sensing.
Remote sensing as well as field observations can be used to assess fire severity after a fire, which, in general, represents combined effects of fire intensity and residence time (Eidenshink et al., 2007; Keeley, 2009). Fire behavior drives the magnitude and duration of heating of biomass, which in turn influences PyC characteristics. However, current understanding of the influences of fire severity and pre-fire forest fuel loads on PyC formation during forest fires is limited (González-Pérez et al., 2004; DeLuca and Aplet, 2008). Previous efforts to quantify PyC across gradients of fire severity have focused primarily on PyC stocks or concentrations in soil (Pingree et al., 2012; Boot et al., 2015; Miesel et al., 2015), although a recent investigation of post-erosion PyC pools in California mixed-conifer forest quantified PyC in the aboveground and belowground pools (Maestrini et al., 2017). Santín et al. (2015b) provided the first estimation of pre- and post-fire PyC stocks in a boreal jack pine forest by measuring changes in C concentration in visually blackened material; however, their study site represented high-severity fire only (i.e., as defined by mortality to forest overstory) in which impacts to mineral soil were negligible due to high moisture content. A critical next step is to obtain the information necessary for understanding the direct impacts of wildfire and fire severity level on forest PyC stocks, especially in forests vulnerable to ecosystem type conversion via fire activity that falls outside the range of historic variability.
Our overarching objectives were to quantify wildfire impacts on aboveground and belowground total C and PyC stocks in California mixed-conifer forests, and to investigate relationships between net changes in C or PyC and fire severity level, using three fire severity classification systems. We used nearly immediate pre- and postfire (i.e., typically within less than a week before and after fire) measurements of the forest overstory, understory, herbaceous layer, downed wood, and soil (organic horizon and 0–5 cm mineral soil) to quantify fire-induced changes to ecosystem-level C and PyC stocks, across fire severity levels derived from remote sensing imagery, as well as from vegetation and substrate severity indicators classified in the field.
Methods
Study Area
Our study sites included five active wildfire incidents that occurred in 2014 and 2015 in mixed-conifer forest in California, USA (Figure 1, Table 1). Both years of the study were part of a record-setting drought that began in 2012, and all fires occurred during the hottest months of the year. These forests are characterized by a mixture of conifer species including ponderosa, Jeffrey and sugar pines (P. ponderosa, P. jeffreyi, and P. lambertiana), white fir (Abies concolor), Douglas-fir (Pseudotsuga menziesii), and incense cedar (Calocedrus decurrens). This is a widespread forest type on US Forest Service (FS) and National Park Service (NPS) land in the Sierra Nevada ecoregion of California, with a history of low-severity fires occurring at 11–16 year intervals prior to Euro-American settlement, documented by tree ring studies and fire records dating to the early 1900s (Van de Water and Safford, 2011). Soils at these sites are coarse-textured and characterized as well-drained to somewhat excessively drained Alfisols and Inceptisols, with the soil derived from material weathered from granitic bedrock; one site supported Andisols formed in material weathered from andesitic breccia or andesitic mudflows, characterized as well- to somewhat excessively drained (NRCS, 2018). Mean annual precipitation ranges between 76.2 and 139.7 cm and occurs primarily as winter snowpack; mean annual temperature ranges between 8.9 and 12.8°C.
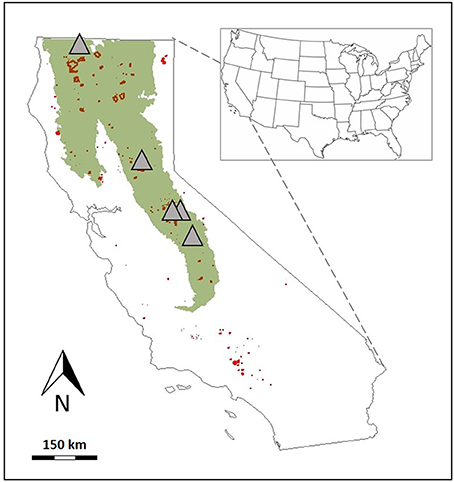
Figure 1. Map of California, USA showing Sierra Nevada mixed-conifer vegetation type (green polygon), fires occurring between 2014 and 2015 (red polygons), and locations of the five wildfires from which data were collected for this study (gray triangles). Inset map shows the location of California in the continental United States.
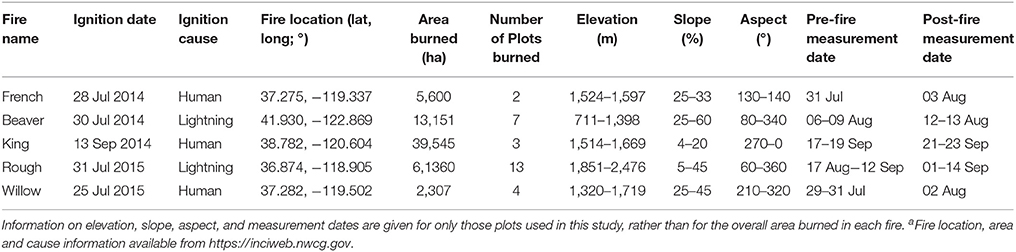
Table 1. Fire and location informationa for the five wildfires used in this study.
Field Methods
The USDA Forest Service Fire Behavior Assessment Team (FBAT) installed fire behavior instrumentation and conducted pre-fire measurements and sampling at all sites before fire, and duplicated the set of measurements and sampling after the fire passed through a given plot, when it was determined safe to re-enter. During a wildfire incident, the incident management team or other official can request the FBAT team to measure and/or monitor fuels and fire behavior to support fire management decisions. A.R and C.E. led the coordination and training, logistics and resources of the team. The five wildfire sites we used in this study provided 29 plots with pre- and post-fire measurements: 76% of these plots were measured within 5 days post-fire, and another 17% were measured ≤ 10 days post-fire; only two plots (7% of total) were measured 12 and 14 days post-fire (Table 1). Plots were established in areas expected to burn; however, in some cases the path of the fire did not coincide with plot location; we excluded unburned plots from this study. Therefore, the number of plots used for this study were distributed unevenly across the five fires.
Each plot was installed within a relatively homogenous area (in terms of forest structure and environmental characteristics) to avoid the potential for plots to overlap two different fire severity classes derived from the 30-m Landsat pixel scale. We took plot photographs (Figure 2) and recorded GPS location, slope, aspect, elevation and topographic position. Because of the need to rapidly measure plots to determine forest structure and composition, we used a Relaskop (using basal area factors of 5, 10, 20 depending on stand density) to record basal area in a variable-radius plot approach, following standard rapid-assessment forest mensuration methods. We then recorded tree species, diameter at breast height (DBH; stem diameter at 1.37 m above ground), total height, height to live crown, and live/dead status for tree (>15.0 cm DBH) and pole (2.5–15.0 cm DBH) size classes for all stems determined to be “in” via the Relaskop approach (NPS, 2003; Jain and Graham, 2007). Dead tree (snag) decay class was also recorded (NPS, 2003; Domke et al., 2011). We measured char height (minimum and maximum) on tree boles, percentage of tree crown scorched (i.e., present but killed) by fire, and percentage of tree crown consumed by fire.
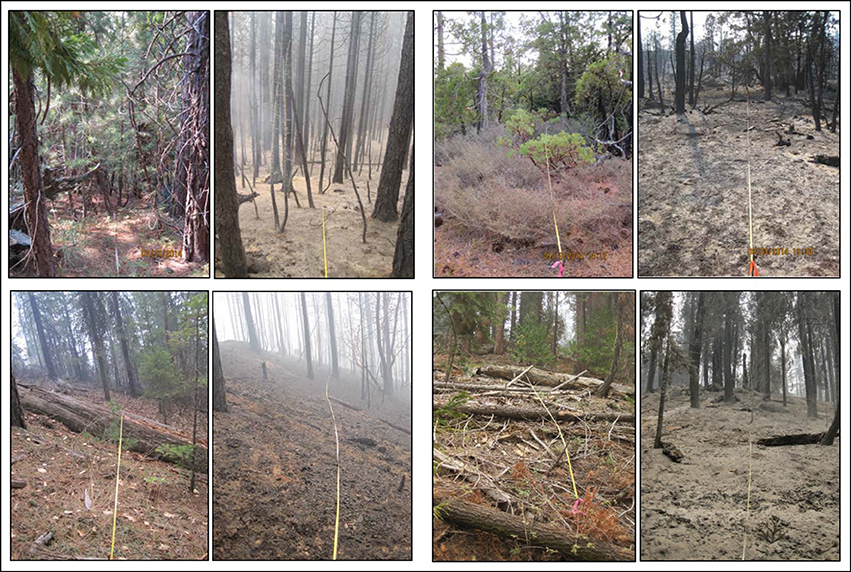
Figure 2. Paired photos taken during pre-fire and post-fire measurements showing examples of fire impacts on forest vegetation and substrate at four plot locations used in this study. For each pair of photos, pre-fire conditions are shown on the left and post-fire conditions are shown on the right. Photo credit: Reiner and Ewell.
We used the line intercept method to measure dead and down woody debris (hereafter: downed wood) and litter (Oi horizon) and duff (Oe+Oa horizons) depths along three 15.24 m transects radiating from plot center (Van Wagner, 1968; Brown, 1974). We also visually estimated the percent cover for each NPS vegetation and substrate burn severity class (NPS, 2003) for the area inside a 15 m radius circular plot overlain on plot center, and then calculated the weighted average of the classes to obtain a plot-level estimate for vegetation burn severity and, separately, for substrate burn severity. The substrate and understory severity classification followed protocol developed by the NPS (2003) presented in Supplementary Material (Table S1), hereafter referred to as “NPS substrate” and “NPS vegetation severity,” respectively. We also measured total forest floor (litter and duff) depth and collected volumetric soil samples from the organic horizon (i.e., forest floor) and 0–5 cm mineral soil (Miesel et al., 2015) at an additional three locations per plot for a subset of the plots (i.e., for plots at which soil sample collection was possible based on time and safety considerations). Only six of the plots sampled for soils were affected by fire (producing 18 paired pre- and post-fire samples). Each severity metric was assessed at the plot scale; severity was not assessed separately at the soil sample locations. Post-fire samples of the residual forest floor layer included the ash; therefore the ash mass and C content was quantified as part of the post-fire (i.e., fire-altered) forest floor. The distribution of data for forest floor depths measured for whole-plot estimates and at the soil sample locations are shown in Figure S1.
Our original goal was to collect pre- and post-fire forest floor and mineral soil samples near a soil thermocouple to relate changes in C and PyC to the magnitude or duration of heating (i.e., rather than collecting and pooling a larger number of samples from the plot); however, we were unable to obtain enough satisfactory data from the thermocouples near soil sample locations to confidently include in this analysis. In addition to classifying the NPS vegetation and substrate severities described above, we also identified plot-level fire severity level from geospatial layers available from the Monitoring Trends in Burn Severity (MTBS) program, which provided severity classifications derived from Landsat Thematic Mapper imagery via the dNBR approach (Eidenshink et al., 2007) and calibrated to the CBI (Miller et al., 2009a; Miller and Quayle, 2015), hereafter referred to as remote sensing (RS) severity.
Laboratory Methods
Soil samples were shipped to the laboratory and air-dried to constant mass. Pre- and post-fire forest floor samples were ground to pass a 1 mm screen, and 0–5 cm mineral soil samples were sieved to 2 mm to remove stones and roots. We then pulverized a subsample of each forest floor and mineral soil sample to fine powder and dried to remove all moisture (60°C for forest floor samples; 105°C for mineral soil samples) before elemental analysis for total C and N (Costech, Italy; 1,000°C combustion temperature). We also determined pyrogenic C in forest floor and mineral soil samples as oxidation-resistant C using a weak nitric acid-peroxide method following Kurth et al. (2006) for mineral soil samples and Maestrini and Miesel (2017) for forest floor samples. The modification of Kurth et al. (2006) presented by Maestrini and Miesel (2017) for use in organic matrices requires pre-digestion dilution of organic sample in a carbon-free pulverized quartz matrix to ensure full digestion of non-resistant C while ensuring sufficient post-digestion solid mass to collect for elemental analysis. Briefly, we digested 0.5 g of sample in a solution of 10 mL 1N nitric acid combined with 20 mL of 30% hydrogen peroxide at 100°C for 16 h in a block digester (BD50, Seal Analytical, USA). Digestion tubes were capped with teardrop stoppers to minimize evaporation, and were periodically agitated during the first 4 h to disperse foam that forms during the digestion. Tubes were removed from the block digester at the end of 16 h and allowed to cool to room temperature before agitating to suspend the solid digestion residue into the solution, and then vacuum filtering (Whatman, Grade 2 filters). We dried the solid residue on each filter at 70°C for 24 h before weighing, and then measured C concentration as described above. All PyC results we present represent estimates derived from this chemical oxidation approach (PyCCTR) which, like all PyC quantification methods, cannot fully represent the complete PyC spectrum (Hammes et al., 2007). For brevity we use “PyC” in our Results section where only our data are presented, whereas in the Discussion we will use “PyCCTR” to differentiate our oxidation-based estimates of PyC from the broader concept of PyC regardless of method (Zimmerman and Mitra, 2017).
Calculations and Statistical Approach
We used genus-specific allometric equations to calculate tree and pole biomass for pre- and post-fire measurements, adjusting for foliage and branch loss (Jenkins et al., 2004). Biomass estimates for dead trees (snags) pre- and post-fire were adjusted for snag decay class following Domke et al. (2011). Data for live basal area and quadratic mean diameter are shown in Figure S2; biomass data for all aboveground forest components are shown in Figure S3. We used a biomass fraction of 0.50 to calculate tree and pole C mass, following standard convention. To quantify pyrogenic C in the tree layer, we assimilated tree volume to a cone, and used the measured char height from this study and overall mean char depth from other study sites in mixed-conifer forest the same region (Maestrini et al., 2017) to calculate char volume. Char volume was calculated as the difference between the volume of a frustrum of the tree from base to mean char height, and the volume of the uncharred core of the same frustrum. We then calculated char mass as the product of char volume and the mean bulk density of charred bark, and PyC mass as the mass fraction of PyC in charred bark samples. Bulk density and PyC mass fraction of charred bark from mixed-conifer forests follow values presented by Maestrini et al. (2017). Pre-fire char was noted if present on trees but was determined to be not quantitatively significant; therefore, it is possible that the calculations in this study provide a slight over-estimate of tree char produced by the single fires.
We used field measurements of understory vegetation height and percent cover to categorize understory species by density class and species type (e.g., based on stem thickness), and then calculated understory fuel biomass (for tree seedling and shrubs, and for herbaceous species including grasses) using bulk density coefficients extracted from the BEHAVE Fuel Subsystem (Scott, 2018, Personal communication), where fuel load is the product of bulk density, depth and percent cover (Burgan and Rothermel, 1984). We calculated C mass in the understory and herbaceous layer following C mass fraction for mixed-conifer forest given in Campbell et al. (2009). Because this layer experienced major loss of biomass during fire, we assumed that PyC formed by the fire in the understory and herbaceous layers was transferred to the forest floor. We calculated fuel loadings (biomass) for pre- and post-fire woody fuels and the forest floor following the methods of Van Wagtendonk et al. (1998), and converted to C mass using published values for this region (Harmon et al., 1987). We did not collect field measurements of charring on downed wood; therefore, based on our previous work in other mixed-conifer sites, we assumed negligible pre-fire charring on this component. For post-fire downed wood, we assumed an overall mean of 0.23 PyC/C mass fraction for pieces < 8.0 cm diameter, and 0.39 PyC/C mass fraction for pieces >8.0 cm diameter at the point of intersection with the survey line, which represents the mean value for each downed wood size category across severity levels (severity determined via remote sensing data) in burned areas in the same mixed-conifer ecosystem type presented by Maestrini et al. (2017). Maestrini et al. (2017) measured PyC 2–3 years post-fire, so using their values probably underestimates downed wood PyC in our study. Forest floor horizon depth and biomass are presented in Figure S4.
Forest floor C stock was calculated using pre- and post-fire values of mass per unit area determined from the sum of the litter and duff fuel loads (described above, as determined along the fuels transects, Figure S1) multiplied by C concentration measured in the physical samples collected. We used the actual measured plot mean C concentration when possible, and we used the grand mean within NPS substrate severity level for the C concentration for plots for which no physical samples were collected. For mineral soil we calculated C stock by multiplying the fine fraction (<2 mm) soil mass per unit area for the 0–5 cm depth increment from other nearby study sites in mixed-conifer forests by the C concentration measured in the soil samples collected in this study (with “missing values” replaced by the grand mean within severity as described above for forest floor). We used a value of 2.40 g cm−2 at one fire site (determined during a follow-up visit 1 year post-fire), whereas we used 3.10 g cm−2 for the other four sites based on measurements by Maestrini et al. (2017); both values represent the total mass of fine fraction soil in the 0–5 cm depth increment. Similarly, we used PyC mass fraction as determined by nitric acid digestion described above to calculate PyC stocks for the forest floor and for 0–5 cm mineral soil. Pre- and post-fire total C and PyC stocks for the physical samples of forest floor and mineral soil are shown in Figure S5. For the purposes of this study, we took a conservative approach and calculated within-plot means for forest floor and mineral soil C and PyC stocks. All statistical analyses were performed using the plot as the unit of replication.
We calculated change in C and PyC by subtracting post-fire C and PyC stocks from pre-fire C and PyC stocks within plot, for each individual forest component and also for the sum of all forest components (hereafter, “total ecosystem” C or PyC). We interpreted a loss of total ecosystem C as C emissions, following North et al. (2009), whereas negative changes in C stock in individual forest components could indicate either a conversion to PyC in (and/or a transfer to) another component and/or emitted C; therefore, changes in individual component C stocks are not assumed to be emitted C. We calculated the C affected by fire as the sum of C lost and C converted to PyC, and the conversion rate of C to PyC as the ratio of PyC to C affected (i.e., sum of C loss and conversion to PyC; hereafter PyC/CA), following Santín et al. (2015b). We used general linear models (GLMs) to investigate differences in C or PyC stocks between pre- and post-fire measurements within severity classes, for each forest component (SAS 9.4, SAS Institute, Inc., Cary, NC), using elevation as a covariate to control for variability in plot characteristics due to elevation. We also used GLMs to investigate differences in the magnitude of C or PyC change between pre- and post-fire measurements, among severity classes, using elevation and pre-fire forest biomass measurements from each forest stratum as covariates to control for variation in pre-fire plot characteristics. Quantification of the specific effects of covariates on the response variables was not the focus of the study and they are not discussed further. We log-transformed data where necessary to meet model assumptions, and we ranked data before analysis when standard transformations failed to meet model assumptions. We used Tukey-adjusted pairwise comparisons to identify difference between pre- vs. post-fire C and PyC stocks within severity level, and for comparisons among severity level within pre-fire measurements and within post-fire measurements. Although we present results for all forest components, we recognize that the hypothesis test of no difference between total pre- and postfire C stocks is somewhat paradoxical because combustion of biomass during wildfire by definition releases C from the ecosystem. We determined statistical significance at p < 0.05 unless indicated otherwise. Descriptive statistics for all figures and tables presented in this manuscript are also provided in tabular form in supplementary information (Table S2).
Results
Agreement Between Severity Level Measurement Method and Tree Mortality
All plots used in this study were affected by fire, and together represented the full range of severity classes derived from remotely sensed imagery (RS) and the full range of the NPS vegetation severity classes, whereas there was a much more narrow range of severity classes determined by NPS substrate metrics (Table 2). In general, we observed relatively low agreement in severity classification, among the three systems applied. For example, although this study omitted plots that were unburned by fire, one burned plot was classified as unchanged by remote sensing metrics, and a different plot was classified as unburned by the NPS vegetation severity metrics (Table 2). The plot classified as unchanged by remote sensing metrics demonstrated moderately severe burn when using NPS substrate metrics, and heavily burned conditions when using NPS vegetation metrics. The low RS severity class included plots classified as unburned to moderately burned when using NPS vegetation severity metrics. The majority of plots classified as high RS severity were classified as moderately burned by NPS substrate severity metrics, and as heavily burned using vegetation severity indices. The strongest agreement occurred between the vegetation and substrate severity indices, with 41% of plots classified as heavily burned by vegetation metrics also classified as moderately burned by substrate metrics (Table 2).
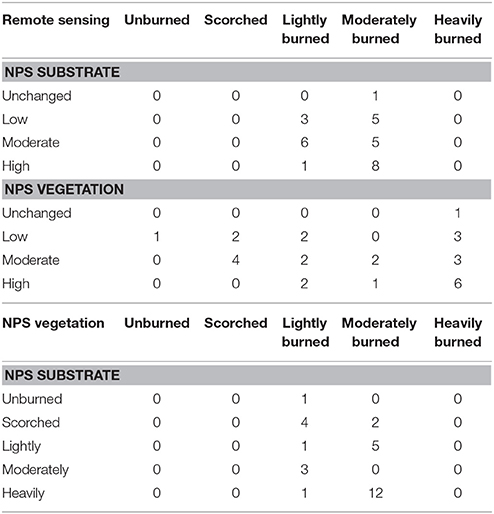
Table 2. Severity classification matrix showing distribution of plots (count) assessed for fire severity level using remote sensing (RS), and National Park Service (NPS) vegetation and substrate severity metrics assessed in the field post-fire.
Across all severity levels, fire caused 74% mortality of live tree stems present before fire, and the difference in stem density between pre-fire and post-fire live trees was significant (p = 0.0002) (Figure 3). However, when considered by severity level, the loss of live tree stems was significant only for the high RS severity (100% mortality; p < 0.0001) and moderate NPS substrate severity (81% mortality; p = 0.005) categories (Figure 3). There were no differences in pre-fire stem density among any of the post-fire severity classifications, and the only difference among post-fire severity classes occurred between the high and low RS classes (marginal significance; p = 0.079). When using RS metrics, tree mortality was 14-fold greater in high severity areas than in low-severity areas (p = 0.022), whereas only approximately four times greater than mortality in moderate RS severity areas (p = 0.066); there was no tree mortality observed in the RS unchanged class (Figure 3). The two NPS severity systems showed trends toward greater tree mortality with severity level, but there were no significant differences among severity levels (Figure 3). Elevation explained a significant amount of the variation in tree mortality overall, and for all three of the severity classification systems, but plots that experienced no mortality as well as plots that experienced total mortality occurred across the full range of elevation (711–2,476 and 1,079–2,088 m, respectively).
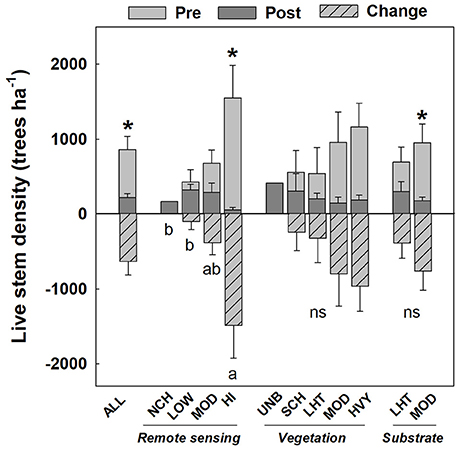
Figure 3. Mean (±s.e.) number of live trees ha−1 measured pre-fire and post-fire in burned plots, shown for overall severity levels (ALL) and for plots classified by three burn severity classification systems. Fire severity classifications determined from remote sensing includes unchanged (NCH), low (LOW), moderate (MOD), and high (HI) severity. Vegetation and substrate severity follows National Park Service classification scheme, including unburned (UNB), scorched (SCH), lightly burned (LHT), moderately burned (MOD), and heavily burned (HVY). Difference bars below the zero line indicate the number of tree stems killed by the fires used in this study. Asterisks (*) indicate significant differences between pre- and post-fire measurements, within severity level. Lowercase letters below the zero line indicate significant differences in the change between pre- and post-fire measurements (hatched bars) among severity levels within classification system; ns indicates no significant differences (p < 0.05). Differences among severity levels for pre-fire and for post-fire measurements are described in the text. All plots used in this study were burned by wildfire, including those classified into the unchanged or unburned severity classes.
Total Fire-Affected Ecosystem C and PyC Stocks
Our results indicated that fire released 54.8 ± 6.6 Mg ha−1 C as emissions, and that there was a net ecosystem PyC gain of 1.0 ± 1.0 Mg ha−1 (Figures 4A,B). However, overall post-fire total ecosystem (forest overstory to 5 cm mineral soil depth) C and PyC (i.e., PyCCTR) stocks were 198.2 ± 27.1 Mg ha−1 C and 5.3 ± 1.0 Mg ha−1 PyC, which was only 21.6% less and 22.5% greater than pre-fire stocks of 253.0 ± 28.4 Mg ha−1 C and 4.3 ± 0.3 Mg ha−1 PyC, respectively (Figures 4A,B). There were no statistically significant differences between pre- and post-fire total ecosystem C or PyC stocks for the grand mean across all severity levels, or for any severity system (Figures 4A,B; but see earlier comment about paradoxical hypothesis tests). Total ecosystem C stocks showed greater variability in the RS low-severity class compared to the moderate- and high-severity class for pre-fire as well as post-fire values; however, there were no significant differences among RS severity classes. Neither the total ecosystem C mass loss nor net PyC change between pre- and post-fire measurements differed among severity levels, for any of the three severity classification systems (Figures 4A,B).
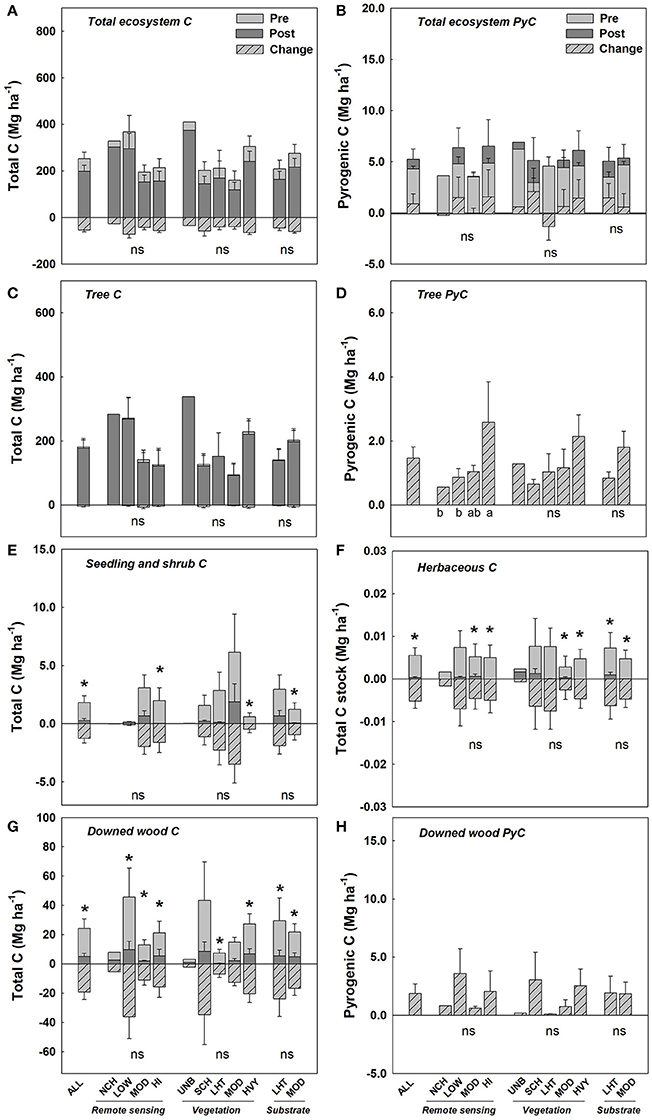
Figure 4. Mean (±s.e.) total C and PyC stocks (Mg ha−1, estimated as PyCCTR via chemical oxidation) for total ecosystem carbon (A,B), for the forest overstory (i.e., tree layer; C,D); seedling and shrub layer (C only; E), herbaceous and grass layer (C only; F), and downed wood (G,H) for pre-fire and post-fire conditions and calculated differences between pre- and post-fire measurements, shown for overall severity levels (ALL) and for plots classified by three fire severity classification systems. Because pre-fire PyC in bark and downed wood was assumed to be negligible, the post-fire PyC stocks in panels D and H are equivalent to the change (increase) in PyC for these forest components. Severity abbreviations follow those given in Figure 3. Asterisks (*) indicate significant differences between pre- and post-fire measurements, within severity level. Lowercase letters below the zero line indicate significant differences in the change between pre- and post-fire measurements (hatched bars) among severity levels within classification system; ns indicates no significant differences (p < 0.05). Differences among severity levels for pre-fire and for post-fire measurements are described in the text.
Total C and PyC Stocks in Vegetation and Downed Wood
The forest overstory contributed the majority of ecosystem C (71.6%) before fire, whereas downed wood, the forest floor and 0–5 cm mineral soil contributed much lower amounts (9.6, 11.4, and 6.6%, respectively). The understory and herbaceous layers each contributed < 1% of total ecosystem C stock. There were no differences in forest overstory (tree layer) C stocks between pre- and post-fire measurements for any of the severity classes (Figure 4C). The magnitude of overstory C loss was 4.8 ± 1.9 Mg ha−1 overall, and did not differ among RS severity levels (Figure 4C). Tree foliage contributed the greatest source of C mass loss from the forest overstory; however, foliage contributed only 3.4% of total overstory C (data not shown). Conversely, overstory PyC mass gain due to fire was greater for high RS severity areas relative to unchanged or low severity areas (p = 0.014 and p = 0.008, respectively), with a gain of 1.5 ± 0.0 Mg ha−1 across all severity levels. Changes in overstory C or PyC stocks due to fire did not differ among severity classes for either the NPS vegetation or substrate indices; however, PyC in tree bark showed non-significant positive trends that followed the severity gradient (Figures 4C,D).
We observed an overall loss of 86% of seedling and shrub C stocks due to fire (p = 0.0163; Figure 4E). However, pairwise comparisons of pre- and post-fire C stocks within severity level showed that the only significant loss occurred in the high RS severity class (p = 0.001) and heavily burned NPS vegetation severity systems (p = 0.033), both of which showed a 99% loss of C (Figure 4E). Similarly, the moderate NPS substrate severity class indicated a 95% loss of C (p = 0.003; Figure 4E). Areas classified as moderate or high severity by RS metrics supported less overstory C and greater understory C, relative to unchanged and low severity classes (Figures 4C,E). No pre-fire differences in seedling and shrub C existed among severity classes for any of the three classification systems, whereas post-fire measurements indicated 97% less C in RS high severity areas relative to moderate severity areas (p = 0.045). Although we observed a trend toward increasing C mass loss from the scorched to moderately burned classes in the NPS vegetation system, the pattern was disrupted by the small loss from the heavily burned class; therefore, the magnitude of loss appears to mirror the pre-fire C stocks rather than the severity gradient. Differences in the magnitude of understory C mass loss among severity levels were not statistically significant for any of the three severity classification systems (Figure 4C). Similar to our results for understory C, fire caused an overall loss of 93% of herbaceous layer C (p < 0.0001; Figure 4F). Significant losses also occurred from the moderate (p = 0.015) and high (p = 0.005) RS severity classes, from moderately (p = 0.015) and heavily burned (p = 0.001) areas using NPS vegetation metrics, and from areas classified as lightly (p = 0.042) and moderately burned (p < 0.0001) using NPS substrate severity metrics (Figure 4F).There were no differences in pre-fire herbaceous layer C across severity classes, for any of the three types of severity metrics, and no differences in post-fire C stocks among the RS or NPS vegetation severity indices. In contrast, post-fire C stocks were 100% lower in moderately burned than in lightly burned areas, using the NPS substrate severity classification (p = 0.034; Figure 4F). There were no differences in the total mass of C lost from the herbaceous layer due to fire among severity levels for any of the severity classification systems (Figure 4F).
Fire caused an overall loss of 19.3 ± 5.1 Mg ha−1 C from the downed wood pool across all severity levels (p < 0.0001 for pre-fire vs. post-fire comparison), as well as for low (p = 0.047), moderate (p = 0.008), and high (p = 0.004) RS severity classes (Figure 4G). When using NPS vegetation severity metrics, the only statistically significant changes between pre- and post-fire C stocks occurred for the lightly burned (p = 0.030) and heavily burned (p = 0.001) areas, whereas for the NPS substrate severity classes, we observed significant losses from both lightly burned (p = 0.002) and moderately burned (p < 0.0001) areas. There were no differences in downed wood C stocks among severity levels for either pre-fire or post-fire measurements for any of the severity classification systems. The gain in PyC in the downed wood component was 1.9 ± 0.8 Mg ha−1 across all severity levels; however, there were no differences in the magnitude of downed wood C mass loss or PyC gain due to fire among severity levels, for any of the severity classification systems (Figures 4G,H).
Total C and PyC Stocks in the Organic Horizon and Upper Mineral Soil
There was an overall effect of fire on forest floor C stocks, across all severity classes (loss of 25.9 ± 3.2 Mg ha−1; p < 0.0001), and for nearly every severity level in the three severity classification systems (p ≤ 0.001 for all RS classes; p = 0.051, p < 0.0001, p = 0.092, and p < 0.0001 for NPS vegetation scorched, lightly-, moderately-, and heavily burned severity classes; p = 0.002 and p < 0.0001 for lightly- and moderately burned NPS substrate classes; Figure 5A). The only difference in pre-fire forest floor C stock among severity levels was between the moderately and lightly burned substrate severity classes (p = 0.018; Figure 5A). There were no differences in post-fire forest floor C stocks among severity levels for the RS or substrate severity classification systems, whereas post-fire C stocks were 87% lower in lightly burned areas relative to areas classified as unburned using NPS vegetation indices (marginally significant at p = 0.094; Figure 5A).
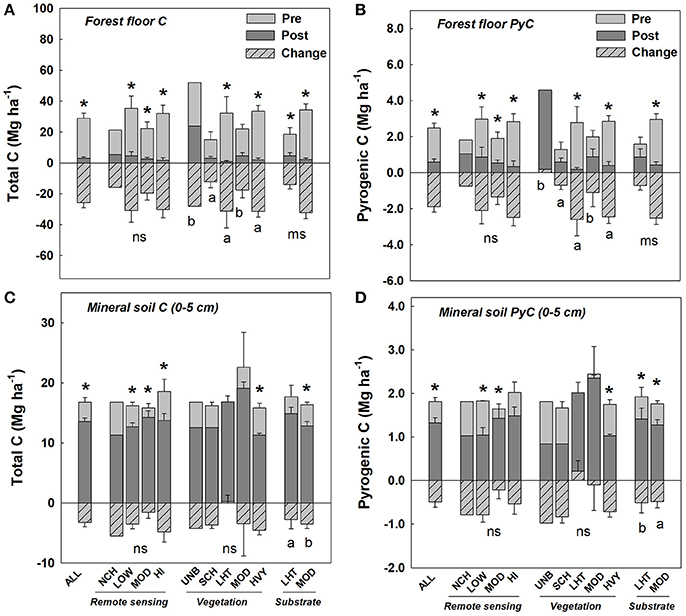
Figure 5. Mean (±s.e.) total C and PyC stocks (Mg ha−1, estimated as PyCCTR via chemical oxidation) for forest floor (A,B) and mineral soil (C,D), for pre-fire and post-fire measurements, and calculated differences between pre- and post-fire measurements, shown for overall severity levels (ALL) and for plots classified by three fire severity classification systems. Severity abbreviations follow those given in Figure 3. Asterisks (*) indicate significant differences between pre- and post-fire measurements, within severity level. Lowercase letters below the zero line indicate significant differences in the change between pre- and post-fire measurements (hatched bars) among severity levels within classification system; ns indicates no significant differences (p < 0.05) and ms indicates marginal significance (p = 0.08 for forest floor C, and p = 0.07 for forest floor PyC). Differences among severity levels for pre-fire and for post-fire measurements are described in the text.
Forest floor PyC stocks (in samples of post-fire forest floor which included the ash and all other fire-altered forest floor material) decreased by 77% (1.9 ± 0.3 Mg ha−1) due to fire across all severity levels (p < 0.0001), and also showed significant losses for the low, moderate and high RS severity classes (respectively p = 0.012, p = 0.006, and p < 0.001; Figure 5B). Only the lightly (p < 0.001) and heavily burned (p < 0.0001) NPS vegetation severity levels showed significant losses due to fire (Figure 5B). The substrate severity metrics indicated losses of 45% (0.7 ± 0.3 Mg ha−1; marginally significant at p = 0.081) and 86% (2.5 ± 0.4 Mg ha−1; p < 0.0001) in the lightly and moderately burned severity classes. The only differences in PyC stocks evident among severity levels for either the pre-fire or post-fire values for the three severity classification systems occurred for post-fire PyC stocks between the unburned and lightly burned NPS vegetation severity classes (p = 0.030; Figure 5B). The magnitude of forest floor total C and PyC loss due to fire showed non-significant increases across the NPS vegetation classes from scorched < moderately burned < heavily burned; the greatest variability in C and PyC losses occurred in the lightly burned class which did not differ significantly from unburned areas (Figure 5A). The magnitude of loss also increased with NPS substrate severity, with 18.1 Mg ha−1 greater C, and 1.8 Mg ha−1 greater PyC, lost from moderately burned areas compared to lightly burned areas, and these differences between severity classes were marginally significant (Figures 5A,B).
We found that fire caused an overall C loss of 20% (3.3 ± 0.5 Mg ha−1) from the upper mineral soil (Figure 5C); with statistically significant differences between pre- and post-fire measurements evident for RS low (p = 0.017), moderate (p = 0.043), and high (p = 0.035) severity classes, the heavily burned NPS vegetation severity class (p < 0.0001), and the moderately burned NPS substrate severity classes (p < 0.0001; Figure 5C). No differences in mineral soil C stocks among severity levels existed before fire. Although post-fire C stocks differed by only 2.34 Mg ha−1 between NPS substrate lightly and moderately burned severity classes, this difference was statistically significant (p = 0.04).
Fire decreased mineral soil PyC stocks by 23% (0.4 ± 0.1 Mg ha−1) relative to pre-fire stocks across all severity classes (p = 0.003; Figure 5D). Significant losses within individual severity levels were evident for the RS low (p = 0.003) and moderate (p = 0.008) severity classes, for the NPS vegetation heavily burned class (0.008), and for both of the NPS substrate severity classes (p < 0.0001 and p = 0.0014 for lightly and moderately burned areas, respectively; Figure 5D). There were no differences in pre-fire or post-fire mineral soil PyC stocks among severity levels, for any of the three severity classification systems. Similarly, our calculated mineral soil C and PyC stocks showed that moderately burned areas lost 38% (1.0 Mg ha−1) more total C than lightly burned areas (p = 0.038), whereas lightly burned areas lost 57% (0.2 Mg ha−1) more PyC than moderately burned areas (p = 0.003) for the NPS substrate severity classification system. In contrast, the RS and NPS vegetation severity systems failed to indicate statistically significant differences in the magnitude of mineral soil C or PyC between pre- and post-fire measurements.
Contributions of PyC to Fire-Affected C by Forest Compartment and Across Fire Severity Levels
The PyC proportion of post-fire C (PyC/postfire C) was greatest in the downed wood, forest floor and mineral soil layers for all severity classification systems and overall (Tables 3–5). The total mass of C affected by fire (i.e., the sum of pre-fire C emitted to the atmosphere or transformed to PyC), was greatest in the downed wood and forest floor pools for all severity classification, although differences among severity levels were evident only for the forest floor layer in the NPS substrate severity system (Table 4). The NPS substrate severity classification system indicated that the mass of C affected in the forest floor increased with severity, and was more than two-fold greater in moderately burned areas relative to lightly burned areas (Table 5). Our calculations showed that C affected was only 0.93 Mg ha−1 greater in moderately burned areas than lightly burned areas, but this difference was statistically significant (Table 5).
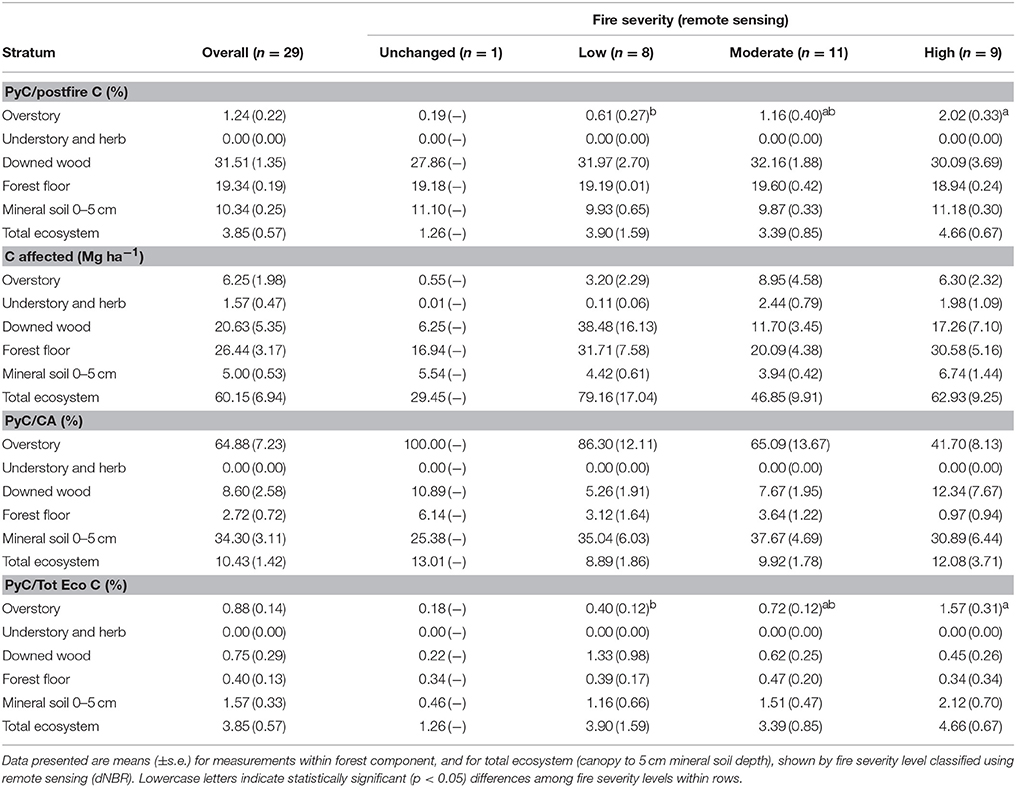
Table 3. Post-fire PyC (estimated as PyCCTR via chemical oxidation) proportions of post-fire C, C affected, and post-fire total ecosystem C for plots measured before and after fire in mixed-conifer forest type.
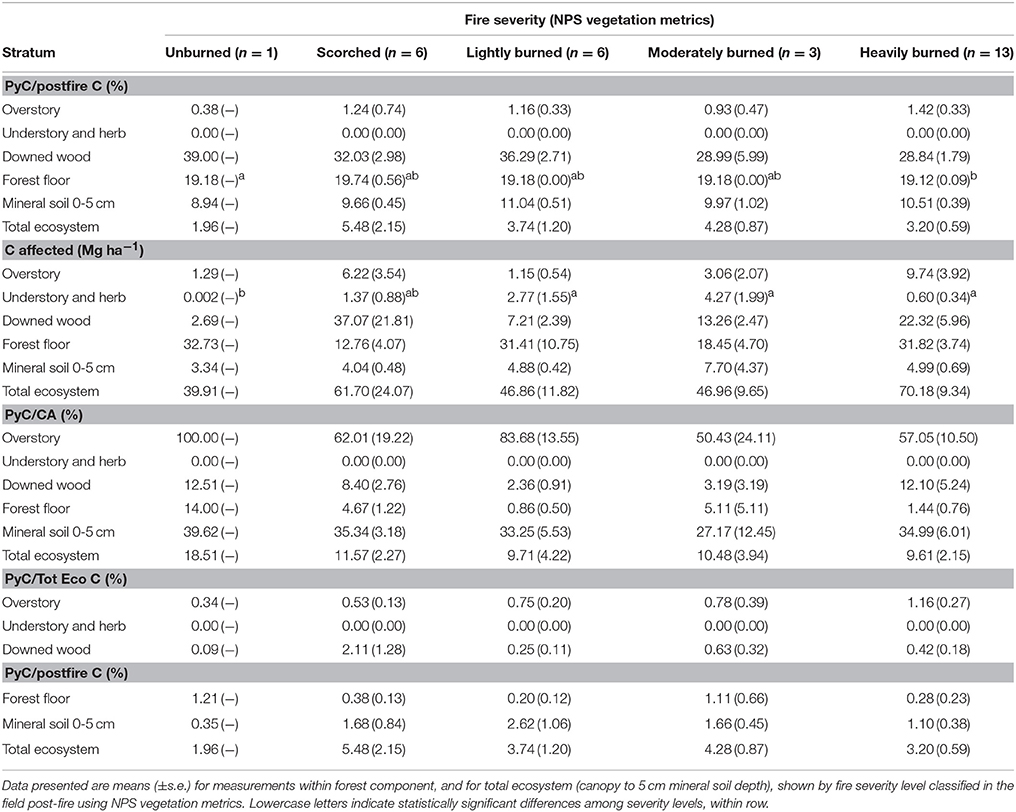
Table 4. Post-fire PyC (estimated as PyCCTR via chemical oxidation) proportions of post-fire C, C affected, and post-fire total ecosystem C for plots measured before and after fire in mixed-conifer forest type.
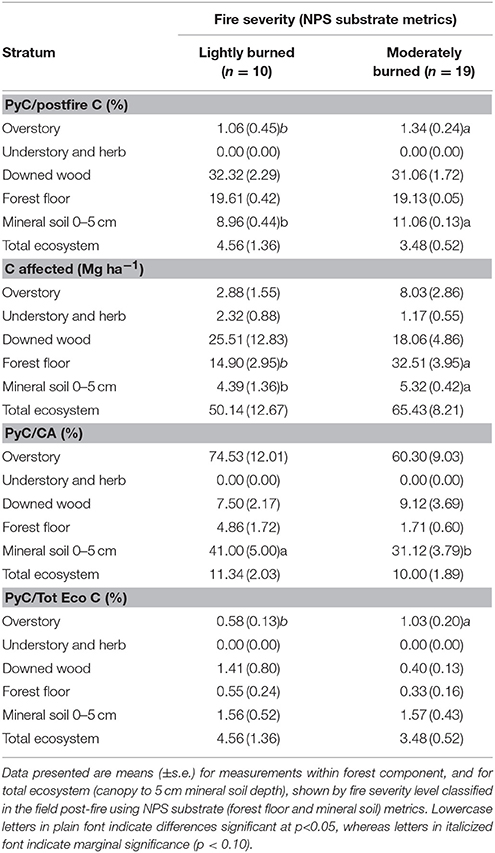
Table 5. Post-fire PyC (estimated as PyCCTR via chemical oxidation) proportions of post-fire C, C affected, and post-fire total ecosystem C for plots measured before and after fire in mixed-conifer forest type.
Across all severity classes, the proportion of fire-affected C transformed to PyC (PyC/CA) was greatest in the overstory (65% of C affected), and 0–5 cm mineral soil (34% of C affected), relative to the other three forest layers (Table 3). The overall mean contribution of PyC to fire-affected C for the total ecosystem was only 10% (Table 3). There were no statistically significant differences in PyC/CA among severity levels for individual forest components for the RS and NPS vegetation severity methods (Tables 3, 4). For the NPS substrate severity metrics, our calculations indicated that mineral soil PyC/CA was 32% greater in lightly burned areas relative to moderately burned areas (Table 5). The contribution of PyC to total post-fire ecosystem C was quite small, ranging from 0 to 2.6% across the different individual forest components (Tables 3–5). For the total ecosystem, PyC accounted for between only 1.3 and 5.5% of total ecosystem C across the three severity methods (Tables 3–5). The mineral soil PyC proportion of total ecosystem C showed a trend of increasing with RS severity; however, the only statistically significant among-severity differences we observed within an individual forest component occurred for the forest overstory when using RS metrics. This showed greater PyC contribution to total ecosystem C in areas of high severity relative to all other severity levels (although the pairwise contrast between high and moderate severity classes was only marginally significant at p = 0.073; Table 3), and also for the forest overstory when using NPS substrate metrics, with nearly 2-fold greater PyC contribution in moderately burned than in lightly burned areas (Table 5).
Distribution of C and PyC in Burned Mixed-Conifer Forest
When evaluating the distribution of post-fire forest C and PyC materials that are likely susceptible to subsequent fires, we found that 72–93% of total ecosystem C (as determined up to 5 cm mineral soil depth) occurs in the forest overstory, and up to 24% occurs in the 0–5 cm mineral soil layer (Figure 6A). In contrast, <3% of post-fire ecosystem C occurred in either the understory, downed wood, or forest floor (including ash layer) pools, when considering the grand mean across all severity classes (Figure 6A). The 0–5 cm mineral soil layer accounted for the greatest proportion of PyC out of total post-fire ecosystem PyC stocks, contributing 40% of total ecosystem PyC across all severity levels (Figure 6B). The overstory contributed 29% of total ecosystem PyC, whereas only 18 and 12% of ecosystem PyC occurred in the downed wood and forest floor, respectively (Figure 6B). The contribution of forest floor PyC to total measured PyC stocks decreased with increasing severity levels for all systems, whereas there was no clear pattern of change across NPS vegetation severity levels.
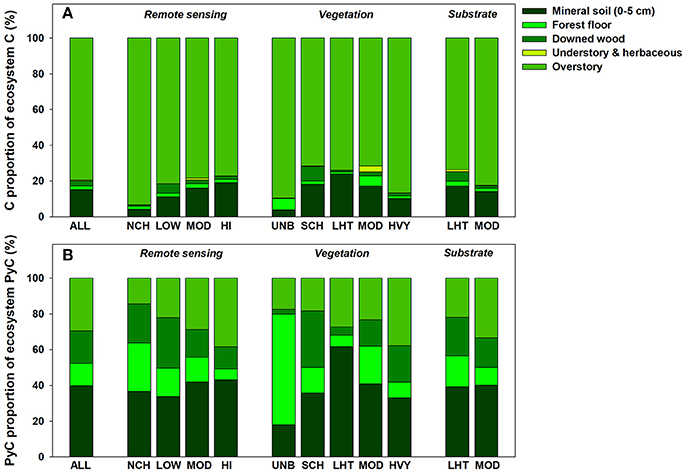
Figure 6. (A) Proportions of total measured ecosystem C stocks contributed by C stocks in each forest component; (B) proportions of total measured ecosystem PyC stocks contributed by PyC stocks in each forest component (for PyC estimated as PyCCTR via chemical oxidation), in post-fire mixed-conifer forest, shown by fire severity levels classified using remote sensing and field observation (vegetation, substrate) approaches. Total ecosystem PyC and C stocks included the 0–5 cm mineral soil depth increment to the tree layer, to represent the pool of C most directly exposed to fire or heating during fire. Severity abbreviations follow those given in Figure 3.
Between pre-fire and post-fire samples, our results indicated a loss of C and net loss of PyC from the forest floor (post-fire samples included the ash layer as part of the post-fire forest floor). Contrary to our expectations, the mass fraction of PyC in forest floor mass did not show an increase between pre-fire (30 g kg−1) and post-fire (25 g kg−1) samples, whereas the contribution of PyC to forest floor C increased from 8.46 to 19.6% between pre-fire and post-fire sampling events. The overall mass fraction of PyC in mineral soil was 6 g kg−1 pre-fire and 5 g kg−1 post-fire, contributing only 15 and 13% of mineral soil C pre- and post-fire, respectively (data not shown).
Discussion
Our study provides data on three primary ways that fire affects forest C: C emissions; PyC formation, and C transfer from live to dead biomass pools. The lack of available data for PyC from a full range of fire-prone forest types has been a challenge identified in the literature, especially in regards to data needed for modeling fire and carbon dynamics (North et al., 2009; Liu et al., 2011). Important advancements in providing this much-needed data (Bird et al., 2015; Santín et al., 2015a; Reisser et al., 2016) led to a recent modeling study of global PyC cycling in contrasting climate scenarios, although the authors still emphasize that the relatively limited existing data cause uncertainties in their estimates (Landry and Matthews, 2017). Our study contributes to advancements in data availability by providing measurements of direct effects of fire on forest C and PyCCTR for each forest component susceptible to fire impacts, in a widespread forest type in the western US that historically experienced frequent fires of primarily low- to moderate-severity (Van de Water and Safford, 2011). This dataset is unique because it provides pre- and post-fire measurements for plots across five active wildfire incidents, and allows comparison of fire impact across severity levels using three contrasting systems for classifying the magnitude of fire's impacts in forested ecosystems. To our knowledge, this is the first study using measurements collected very close to the timing of actual burning in active wildfire incidents (i.e., in contrast to prescribed fire studies and to wildfire studies relying only on post-fire measurements) to determine direct impacts of fire on forest C and PyC.
Wildfire Impacts on Aboveground Forest C and PyC
Much concern exists about the increasing scale of high-severity fires in this and similar forest types of the western US as well as globally (Attiwill and Binkley, 2013; Stephens et al., 2013; Millar and Stephenson, 2015), but limited information exists about how increases in wildfire severity will affect forest C emissions during fire, or potential for C stabilization as PyC. The majority of forest C in our study (overstory to 5 cm mineral soil depth) occurred in the forest overstory; however, the contribution of the overstory to C emissions during fire was relatively low compared to C lost from the downed wood and forest floor components, which contributed the most to total C affected by fire. The more frequent occurrence of statistically significant effects of fire on C in forest components closer to the ground (i.e., progressing from forest overstory to the understory, herbaceous vegetation, downed wood, and forest floor layers) indicates greater magnitude of relative change in C stocks in lower forest components. Our results indicated that although these fires caused an overall loss of 54.8 ± 6.6 Mg ha−1 C to the atmosphere, there was no clear pattern of increased C loss with fire severity. Even though more than half of the different forest C pools we measured showed significant differences in C stocks between pre- and post-fire measurements, the lack of overall difference in total ecosystem C stocks was caused by the relatively minimal loss of C from the overstory, which was by far the largest C pool before and after fire. The overstory is mostly unaffected by fire because the main component of mass (and C) is the standing live tree stems. Because the majority of trees in our study areas were alive at the time of fire, PyC in the overstory was formed primarily as charred bark. Although these fires killed 74% of trees overall, charring of stemwood occurs only when the stemwood tissue is dead and exposed (i.e., exposed dead wood present on a live tree), or when trees are dead prior to fire (personal observation). Therefore, the effects of fire on overstory C are typically limited to the foliage and fine branches, which comprise a relatively small proportion of overstory C.
Similar to our results, Meigs et al. (2009) reported overall C emissions of 22% of forest C across severity levels in mixed-conifer and ponderosa pine (P. ponderosa) forests in Oregon, USA and no differences in post-fire total ecosystem C among severity levels, using the same approach we used for RS severity. However, their measurements were taken 4–5 years post-fire and they attributed the lack of change in total ecosystem C to increased vegetation production post-fire, whereas our measurements taken nearly immediately post-fire capture direct effects of fire. Although their study did not address erosion, they observed no evidence of severe erosion between burned and unburned sites. In contrast to our results, the modeling approach used by Meigs et al. (2009) indicated that C emissions increased with fire severity.
In general, post-fire overstory PyCCTR stocks exhibited the strongest trend toward increased stocks across fire severity gradients. Maestrini et al. (2017) also observed greater PyCCTR stocks in areas classified as high severity relative to low-to-moderate severity using remote sensing metrics, in another mixed-conifer forest 3 years after fire. These patterns result from greater charring on tree stems (i.e., indicating greater flame height) in higher severity areas relative to lower-severity areas, but fire effects and severity are influenced more by total heat output, maximum temperature, and/or duration of heating than by fire intensity, especially for soils (Hartford and Frandsen, 1992; Keeley, 2009). Although the greatest losses of PyCCTR in our study occurred from the two largest pre-fire PyC pools (i.e., forest floor and mineral soil), there was a net gain of total ecosystem PyCCTR, overall and for most of the individual fire severity levels, as a result of gains in the overstory and downed wood components.
Wildfire Impacts on Organic Horizon and Mineral Soil C and PyC
The gains observed in the forest overstory and downed wood components, compared to the PyCCTR losses observed from the forest floor and 0–5 cm mineral soil support previous observations that although fires have created PyC for millennia, PyC can also be consumed during fire (Santin et al., 2013; Saiz et al., 2014). Our results on the magnitude of PyC loss during fire are much greater than loss estimates presented by Santin et al. (2013), who used two size classes of macroparticle jack pine (P. banksiana) wood charred during a pile burn to determine loss in subsequent fire by exposing particles to a prescribed burn, and others to laboratory heating in a muffle furnace. In contrast, the pre-fire forest floor PyC in our study system likely represents a greater diversity of natural PyC types and particle sizes, which contribute to a total PyC pool formed incrementally over multiple (presumably low- to moderate-severity) fires prior to the time that US fire suppression policy began. Small or microscopic PyC in our study would be present inside the forest floor, and likely would have experienced greater combustion and loss, especially given that this region was in a prolonged drought when the fires occurred. It is also possible that the chemical oxidation method we used may overestimate PyC in pre-fire samples; for example, Maestrini and Miesel (2017) determined that 5.4% of C in unpyrolyzed pine needle material may be erroneously indicated as PyC using this method. Assuming that 100% of the pre-fire forest floor material was derived from pine needle litter, this would translate to an over-estimation of 1.6 ± 0.2 Mg ha−1 PyC in the pre-fire forest floor, and an over-estimation of PyC loss of 0.4 Mg ha−1 between pre- and post-fire measurement events.
Because our study measured forest floor C and PyCCTR stocks before rainfall occurred, our results overestimate the pool of PyC that will persist in the ecosystem and/or become incorporated into mineral soil. However, even the PyC produced during these fires and eroded and deposited elsewhere in the landscape—or ultimately in aquatic and marine sediments—still represents a C pool with increased chemical stability relative to the original biomass materials. PyC fluxes between sites do not represent PyC losses at larger scales (Santín et al., 2016). In efforts to quantify the role of fires and PyC in global C cycles it will be important to avoid double accounting issues that may arise if estimates of direct formation during fire (such as we present here) are coupled with PyC stock estimates obtained in older fire sites that have already experienced PyC loss via erosion. The lack of change in PyCCTR mass fraction of forest floor material in our study was likely caused by the presence of mineral ash present in the post-fire residual forest floor material, much of which erodes downslope and/or downstream during post-fire rainfall events (Bodí et al., 2014). Some proportion of the lightweight/transient mineral ash component likely would have been omitted if we had collected the post-fire forest floor samples at a later time after fire, and especially after rainfall and/or significant erosion events. For example, results from Maestrini et al. (2017) indicate increased PyCCTR concentration in post-fire forest floor mass collected 3 years post-fire, relative to unburned areas. Although forest soil is a major C pool, the depth of heat penetration into mineral soil (and consequently the impact on soil properties) depends on the amount of heat produced as well as its duration, which are influenced by aboveground fuel load (Massman et al., 2010; Bento-Gonçalves et al., 2012; Massman, 2012). Significant heating at depths greater than a few centimeters is unlikely during fire, except in localized areas of heavy fuel load (Neary et al., 2008; Bento-Gonçalves et al., 2012), or where duff is consumed (Hartford and Frandsen, 1992). Our study limited estimates of total ecosystem C to the upper 5 cm of mineral soil to best represent the forest ecosystem components that typically experience direct impact from fire, rather than sampling to greater depth where the effects of fire may be diluted. The statistically significant 23% overall loss of total C and PyCCTR from the 0 to 5 cm mineral soil layer suggest that total C and PyCCTR in the uppermost mineral soil were either consumed by fire, or lost via convection of fine mineral particles (Bormann et al., 2008; Homann et al., 2011).
Our measurements indicating loss of C and PyC from the upper mineral soil agree with those of Bormann et al. (2008), Homann et al. (2011), and Pingree et al. (2012) from similar mixed-conifer forests, and contrast with the general assumption that fire has minimal impacts on mineral soil C (for example, see reviews from Certini (2005) and González-Pérez et al. (2004). The apparent discrepancy can be explained by differences in sampling depth, as most studies have investigated mineral soil C to >5 cm sampling depth. For example, Buma et al. (2014) sampled mineral soil to 10 cm in a mixed forest 9 years after wildfire in subalpine mixed conifer forest in Colorado, USA and found no effect of fire on C stock, and Miesel et al. (2015) found no effect of fire on 0–10 cm mineral soil C in southern boreal forest. In contrast, Homann et al. (2011) reported a loss of 10–50% (depending on the pre-fire forest management) of mineral soil C stock in the upper 6 cm after wildfire in an Oregon Douglas-fir (P. menziesii) forest, and estimates from Campbell et al. (2007) indicate 2–8% loss of C in the top 10 cm mineral soil in an Oregon mixed conifer forest, where surface temperatures of >700°C were recorded during fire. They remarked that “… it is also reasonable to believe that soil carbon could have completely combusted to depths of up to 5 cm or that complete combustion never exceeded 2 cm.” (Campbell et al., 2007). Therefore, although there are multiple literature reports that fire does not decrease mineral soil C stock, an actual decrease in C stock may be observed if the analysis is limited to the first few centimeters of the mineral soil, where SOM is more likely to be directly impacted during the fire.
Losses of this magnitude from the mineral soil seem surprising because the substrate severity at all plots was classified either as only lightly burned or moderately burned, even while the physical post-fire forest floor samples consisted primarily of mineral ash, with few to no recognizable plant-derived structures. The explanation for the apparent disparity in our results is likely based on the much broader scale of substrate severity classification in the plots relative to the location of forest floor and mineral soil samples. Because soil sampling was time-consuming during potentially hazardous pre-fire sampling, only a few physical samples per plot could be collected and it would be challenging to substantially increase the pre-fire soil sampling intensity. It is also possible that the substrate severity classification system has low accuracy for characterizing impacts on C and PyC pools. Because our fuels data were collected for the plot scale, we do not have spatially explicit relationships between downed wood biomass and C or PyCCTR loss from soil at the scale of soil sample locations. However, Weichman et al. (2015) found no correlation between PyC stock and distance (up to 60 cm) from charred logs 12 years after a prescribed fire in mixed conifer forest. They suggest that charcoal shed from large-diameter downed wood either takes more than a decade to slough off the bark, or is rapidly redistributed away from the logs. Therefore, we recommend that future studies assess post-fire substrate severity level and woody fuel load at the precise soil sampling locations, immediately before collecting the physical samples, to maximize agreement between changes in C and PyCCTR concentrations and observed substrate severity. Finally, it is also possible that a systematic bias may have also influenced our mineral soil C results, i.e., if the combustion of the duff (Oe+Oa) layer reduced subjectivity in identifying the boundary between the organic layer and mineral soil, relative to pre-fire conditions, leading to post-fire samples being collected from a slightly lower depth than pre-fire samples. However, the same team of individuals collected both sets of samples within fires.
Our results indicate that mineral soil provides a large proportion of total ecosystem PyCCTR even after fire. This agrees with Buma et al. (2014), who used the same PyCCTR method we did to investigate total C and PyC stocks in high-severity burn areas. Their results contrast with our in that they found significantly less PyC in the 0–10 cm mineral soil in unburned reference areas compared to burned areas. Previous estimates have shown that PyC contributes between <1 and 60% of total soil organic C in mineral soils of conifer forests (Preston and Schmidt, 2006; DeLuca and Aplet, 2008; Reisser et al., 2016). PyC formed in aboveground components of forests and in the forest floor during fire provides a source of input into mineral soil, where it has potential to become further stabilized via physical protection and influence soil physical, chemical and biological properties (DeLuca et al., 2006; MacKenzie et al., 2008; Ball et al., 2010; Bird et al., 2015), and, ultimately, post-fire forest recovery (MacKenzie et al., 2008; Makoto et al., 2011).
This and previous studies suggest that fire and fire severity influences the distribution of PyC in forests, although PyC stocks in mineral soil likely reflect inputs from past fires occurring over long time periods rather than recent single fire events (DeLuca and Aplet, 2008; Miesel et al., 2015; Reisser et al., 2016). Over time, PyC can be added to the newly re-developing forest floor layer as charred bark separates from fire-killed tree stems and falls to the ground surface. We expect that PyC from charred downed wood will also become incorporated into the re-developing forest floor layer and possibly the mineral soil, depending on the rate of physical fragmentation of charred downed wood. The downed wood pool of forest C will also increase over time as fire-killed trees fall to the ground, providing woody fuel for subsequent fires. Thus, the pattern of increased tree mortality across fire severity gradients we observed in this study may contribute to greater C release during a subsequent fire. Although we would assume that greater downed wood biomass would also result in greater impacts to forest floor and mineral soil C, pre-fire downed wood biomass was not a significant covariate in our analyses of C affected in forest floor or mineral soil, for any of the severity classification systems (although it was marginally significant at p < 0.10 in the analysis using NPS substrate severity metrics).
Evaluation of Contrasting Fire Severity Metrics
Efforts to define and classify fire severity are relatively recent, and the diverse existing metrics each have strengths and weaknesses when evaluating the type and magnitude of fire effects within specific ecosystem components, and for the total ecosystem. Keeley (2009) emphasizes that remote sensing has limited ability to predict ecosystem response, and recommends using field studies to better interpret ecosystem response across remote sensing-derived severity levels. Our results showed that neither post-fire total ecosystem stocks, nor the magnitude of stock change due to fire, corresponded well with remotely sensed estimates of fire severity, for either total C or PyCCTR. The presence of pre-existing (pre-fire) differences in C stocks among areas classified with contrasting fire severity levels indicates that knowledge of pre-fire forest conditions is important for interpreting fire impacts. Our study shows that using post-fire severity estimates does not give a complete picture of fire effects on forest C; for example, areas classified as high severity using RS imagery were not necessarily associated with greater C losses, or greater PyCCTR gains or losses. Low agreement between field-estimated severities and RS severities can result from mis-alignment due to the registration accuracy of satellite images, the location of field plots relative to mapped severity polygons, variability in fire effects within the 30 m pixel scale of Landsat-derived images, and the proportion of ground covered by ash (Miller and Quayle, 2015).
The high tree stem density yet low tree biomass and C, combined with high pre-fire seedling and shrub C stocks, in areas classified as moderate and high RS severity are an example of the limitations of this approach that challenge efforts to extrapolate fire severity to C release across broader scales. In particular, relatively low agreement among the three types of severity classification indicates that fire severity determined from RS metrics may not be a good indication of impacts to the organic and mineral horizons of soil, where the majority of PyCCTR occurred. In contrast, Kolka et al. (2017) reported that forest floor C loss increased with soil burn severity after a wildfire in southern boreal forest in Minnesota, USA, and combined remote sensing with field observations of burn severity to scale up plot-level measurements to whole-fire C emissions. Although Meigs et al. (2009, 2011) extrapolated C emissions across severity levels in a similar forest type to our mixed-conifer sites, our results highlight some of the challenges likely to arise in efforts to predict C loss at large scales, given the variability at smaller scales (among plots within severity level, and among individual ecosystem components) and poor differentiation among severity levels.
The RS severity classifications we used represent composite impacts of fire across forest components including soil and surface char, but are heavily weighted to vegetation. Greater uncertainty in the low- and moderate-severity classes (relative to high-severity) results from fire effects on surface vegetation and substrate being obscured by live canopy cover (Miller and Thode, 2007; Meigs et al., 2009, 2011; Miller et al., 2009a), and this uncertainty may contribute to difficulty resolving differences in C stocks and losses among severity classes. Landsat-based indices of fire effects correlate well with forest overstory characteristics, and can show relatively good relationships with understory vegetation and soil severity when canopy severity is also high; however, the correlations with surface severity weaken when there is high post-fire live vegetation cover (Hudak et al., 2007; Robichaud et al., 2007).
Our results showing that C emissions from forest floor combustion can be high even in areas of relatively low severity and low change in component C stocks or overstory mortality agree with studies in similar forest types (Campbell et al., 2007; Meigs et al., 2011), and illustrate that fire also creates vertical heterogeneity in terms of effects on forest C. Our observations of large differences in pre-fire overstory and understory C stocks between plots burned at low RS severity vs. those burned at moderate or high RS severity also illustrate that loss of shrub or seedling cover, not just tree cover, can also contribute to classification as high severity (Miller et al., 2009a). A relatively high number of smaller trees contributed to the high pre-fire live tree stem density in these areas.
In general, the NPS vegetation severity metrics corresponded with patterns of C loss in the understory (seedling and shrub), and for the downed wood components, whereas NPS substrate severity metrics corresponded with the magnitude of forest floor C and PyCCTR loss, and with tree mortality. Together, our results show that the influence of severity level on the magnitude of change in C or PyCCTR in a burned forest depends on the ecosystem component(s) being evaluated. Our study shows that any one of these published methods does not show strong informative potential for evaluating whole-ecosystem impacts of fire, at least for forest C and PyCCTR and for our sites representing single fire events.
Additional Data Needs
Continued efforts to improve accuracy in ecosystem and global C accounting, especially in the context of changes in historic disturbance regimes, depends on the availability of information on PyC stocks and distribution in burned forests (Lehmann et al., 2008; Stockmann et al., 2013; Santín et al., 2015b). Additional data are needed to advance the research community's ability to quantify fire's impact on forest C and PyC. For example, knowing how to best characterize fire severity within and across ecosystem components and scales will be important for relating fire impacts to forest C pools, and to short- and longer-term C flux to the atmosphere. Although significant advancements in standardizing severity assessments have been made in recent years, data on ecosystem response (i.e., process rates) remains much more limited and will be essential for understanding how shifts in fire regimes are likely to affect the pattern and timeframe of forest recovery.
Greater resolution in charring depth and extent in downed wood across standard woody fuel size classes would improve estimates of PyC stocks. Standard methods have been developed but can be time-consuming (Lutes et al., 2006; Donato et al., 2009) and are therefore not suitable for use in active fire situations such as our study used. Standardization of methods for quantifying PyC in environmental samples remains challenging (see Zimmerman and Mitra, 2017): we presented PyCCTR estimates based on a chemical oxidation method for all forest components, whereas visual quantification of post-fire charred bark or forest floor samples would have indicated near-total quantification of mass as charred material or “black ash” (Bodí et al., 2014). However, our chemical analyses showed that the C and PyC mass fractions were much lower than expected. Weather conditions during a fire may also influence where particulate matter—including PyC particles—become deposited, and longer-term conditions such as drought can influence fuel moisture content and, therefore, the amount of C emitted vs. converted to PyC. Finally, information on the rate of PyC transfer across forest components over time after fire—especially in areas of contrasting fire severity using any severity classification system—remains limited, and represents an important area of research need in ongoing efforts to understand the full life cycle of C and PyC in fire-affected ecosystems. Additional whole-ecosystem investigations of PyC stocks will improve our understanding of PyC production in vegetation fires, and its role in the global C and PyC budgets. These data will become increasingly important given the ecologically important role of fires historically in this ecosystem type, and the expected increases in warming temperatures and record-setting droughts in the future (Belmecheri et al., 2016). These factors will likely contribute to increased burn severity and PyC formation conditions that differ from historical fires in ways that influence the physical and chemical persistence of PyC, and its role in ecosystem processes.
Conclusions
Our study evaluated fire effects on forest C and PyCCTR using pre- and post-fire measurements and samples from plots across five wildfire incidents in California mixed-conifer forest that occurred during drought years. This study is unique in that we were able to install and re-measure study plots within days before and after fire, by working within the US wildfire incident management system to access active wildfire incidents. Our results indicated that even severe fire effects to an ecosystem during drought years may not directly relate to major forest C loss during a given fire, because the ecosystem components consumed during fire represent a small proportion of forest C. Stabilization of C as PyC was also relatively minor. However, tree mortality converted the largest pool of forest C from the live to dead tree pool. Extensive tree mortality raises concern about a delayed relationship between fire severity and C emissions because overstory C in fire-killed trees, when transferred to the downed wood pool, will be available for major release in a subsequent fire. Thus, C emissions may be influenced more by the severity of past fire events than the severity of a current fire. Extensive mortality caused by increasingly large and high-severity fire raises concern about the potential for altered successional trajectories and ecosystem type conversion (Hurteau and Brooks, 2011; Loudermilk et al., 2013), with consequences for the rate of C uptake and, ultimately, C sequestration by a potentially novel ecosystem (Millar and Stephenson, 2015; Trumbore et al., 2015). Therefore, managers and policymakers should pursue the use of prescribed burns and managed wildfires as part of a strategy to manage forest ecosystems to promote long-term resilience to fire (i.e., supporting survival of the forest overstory through multiple fires) as the optimal approach to avoiding wildfire emissions, and potential ecosystem conversion, in subsequent fires. Forest management actions taken now—even those that produce minor C emissions—will be essential for enabling mature tree survival, and avoiding major C emissions in the next wildfire. Forest recovery is the fundamental process necessary to uphold the assumption that wildfires are (or will continue to be) net zero emissions events. Continued improvements in methods for relating fire severity to specific ecosystem properties such as forest C stocks will be important to support scaling-up of fire impacts to landscapes and regions, and for anticipating C and PyC dynamics over the longer term.
Author Contributions
JM: conceived the study in consultation with AR, oversaw sample analysis, conducted the data analysis, and wrote the manuscript; AR and CE: conducted and led field measurement and sampling activities, and contributed to the manuscript; BM: calculated overstory PyC stocks and contributed to the manuscript. MD: contributed to planning and conducting field measurement and sampling activities.
Conflict of Interest Statement
The authors declare that the research was conducted in the absence of any commercial or financial relationships that could be construed as a potential conflict of interest.
Acknowledgments
We thank Eleanor Domer, Merissa Strawsine, and Dominic Uhelski for laboratory assistance, and FBAT personnel for field assistance. We thank Joe Scott (Pyrologix) for development of the spreadsheet used to calculate understory and herbaceous biomass. Jaron Adkins and two reviewers provided helpful comments that improved the quality of the manuscript. This study was supported by funding from Michigan State University (MSU), MSU AgBioResearch, and the USDA Forest Service Northern Research Station.
Supplementary Material
The Supplementary Material for this article can be found online at: https://www.frontiersin.org/articles/10.3389/feart.2018.00041/full#supplementary-material
References
Attiwill, P., and Binkley, D. (2013). Exploring the mega-fire reality: a ‘Forest Ecology and Management' conference. For. Ecol. Manage. 294, 1–3. doi: 10.1016/j.foreco.2012.12.025
Baldock, J. A., and Smernik, R. J. (2002). Chemical composition and bioavailability of thermally-altered Pinus resinosa (Red Pine) wood. Org. Geochem. 33, 1093–1109. doi: 10.1016/S0146-6380(02)00062-1
Ball, P. N., MacKenzie, M. D., DeLuca, T. H., and Holben, W. E. (2010). Wildfire and charcoal enhance nitrification and ammonium-oxidizing bacterial abundance in dry montane forest soils. J. Environ. Qual. 39, 1243–1253. doi: 10.2134/jeq2009.0082
Barbero, R., Abatzoglou, J. T., Larkin, N. K., Kolden, C. A., and Stocks, B. (2015). Climate change presents increased potential for very large fires in the contiguous United States. Int. J. Wildland Fire 24, 892–899. doi: 10.1071/WF15083
Belmecheri, S., Babst, F., Wahl, E. R., Stahle, D. W., and Trouet, V. (2016). Multi-century evaluation of Sierra Nevada snowpack. Nat. Clim. Change 6, 2–3. doi: 10.1038/nclimate2809
Bento-Gonçalves, A., Vieira, A., Úbeda, X., and Martin, D. (2012). Fire and soils: key concepts and recent advances. Geoderma 191, 3–13. doi: 10.1016/j.geoderma.2012.01.004
Bird, M. I., Wynn, J. G., Saiz, G., Wurster, C. M., and McBeath, A. (2015). The pyrogenic carbon cycle. Annu. Rev. Earth Planet. Sci. 43, 273–278. doi: 10.1146/annurev-earth-060614-105038
Bodí, M. B., Martin, D. A., Balfour, V. N., Santín, C., Doerr, S. H., Pereira, P., et al. (2014). Wildland fire ash: production, composition and eco-hydro-geomorphic effects. Earth Sci. Rev. 130, 103–127. doi: 10.1016/j.earscirev.2013.12.007
Bond-Lamberty, B., Peckham, S. D., Ahl, D. E., and Gower, S. T. (2007). Fire as the dominant driver of central Canadian boreal forest carbon balance. Nature 450, 89–92. doi: 10.1038/nature06272
Boot, C. M., Haddix, M., Paustian, K., and Cotrufo, M. F. (2015). Distribution of black carbon in ponderosa pine forest floor and soils following the High Park wildfire. Biogeosciences 12, 3029–3039. doi: 10.5194/bg-12-3029-2015
Bormann, B. T., Homann, P. S., Darbyshire, R. L., and Morrissette, B. A. (2008). Intense forest wildfire sharply reduces mineral soil C and N: the first direct evidence. Can. J. For. Res. 38, 2771–2783. doi: 10.1139/X08-136
Breshears, D. D., Cobb, N. S., Rich, P. M., Price, K. P., Allen, C. D., Balice, R. G., et al. (2005). Regional vegetation die-off in response to global-change-type drought. Proc. Natl. Acad. Sci. U.S.A. 102, 15144–15148. doi: 10.1073/pnas.0505734102
Brewer, N. W., Smith, A. M. S., Hatten, J. A., Higuera, P. E., Hudak, A. T., Ottmar, R. D., et al. (2013). Fuel moisture influences on fire-altered carbon in masticated fuels: an experimental study. J. Geophysic. Res. Biogeosci. 118, 30–40. doi: 10.1029/2012JG002079
Brown, J. K. (1974). Handbook for inventorying downed woody material. GTR-INT-16. Ogden, UT: USDA Forest Service, Intermountain Forest and Range Experiment Station.
Buma, B., Poore, R. E., and Wessman, C. A. (2014). Disturbances, their interactions, and cumulative effects on carbon and charcoal stocks in a forested ecosystem. Ecosystems 17, 947–959. doi: 10.1007/s10021-014-9770-8
Burgan, R. E., and Rothermel, R. C. (1984). “BEHAVE: fire behavior prediction and fuel modeling system - FUEL subsystem,” in USDA Forest Service Gen. Tech. Rep. INT-167 (Ogden, UT: USDA Forest Service, Intermountain Forest and Range Experiment Station).
Campbell, J., Alberti, G., Martin, J., and Law, B. E. (2009). Carbon dynamics of a ponderosa pine plantation following a thinning treatment in the northern Sierra Nevada. For. Ecol. Manage. 257, 453–463. doi: 10.1016/j.foreco.2008.09.021
Campbell, J., Donato, D. C., Azuma, D., and Law, B. (2007). Pyrogenic carbon emission from a large wildfire in Oregon, United States. J. Geophys. Res. Biogeosci. 112:G04014. doi: 10.1029/2007JG000451
Certini, G. (2005). Effects of fire on properties of forest soils: a review. Oecologia 143, 1–10. doi: 10.1007/s00442-004-1788-8
Covington, W. W., and Moore, M. M. (1994). Southwestern ponderosa forest structure: changes since Euro-American settlement. J. For. 92, 39–47.
Czimczik, C. I., Preston, C. M., Schmidt, M. W. I., and Schulze, E. D. (2003). How surface fire in Siberian Scots pine forests affects soil organic carbon in the forest floor: stocks, molecular structure, and conversion to black carbon (charcoal). Glob. Biogeochem. Cycles 17:1020. doi: 10.1029/2002GB001956
DeLuca, T. H., and Aplet, G. H. (2008). Charcoal and carbon storage in forest soils of the Rocky Mountain West. Front. Ecol. Environ. 6, 18–24. doi: 10.1890/070070
DeLuca, T. H., MacKenzie, M. D., Gundale, M. J., and Holben, W. E. (2006). Wildfire-produced charcoal directly influences nitrogen cycling in ponderosa pine forests. Soil Sci. Soc. Am. J. 70, 448–453. doi: 10.2136/sssaj2005.0096
Domke, G. M., Woodall, C. W., and Smith, J. E. (2011). Accounting for density reduction and structural loss in standing dead trees: implications for forest biomass and carbon stock estimates in the United States. Carbon Balance Manag. 6:14. doi: 10.1186/1750-0680-6-14
Donato, D. C., Campbell, J. L., Fontaine, J. B., and Law, B. E. (2009). Quantifying char in postfire woody detritus inventories. Fire Ecol. 5, 104–115. doi: 10.4996/fireecology.0502104
Earles, J. M., North, M. P., and Hurteau, M. D. (2014). Wildfire and drought dynamics destabilize carbon stores of fire-suppressed forests. Ecol. Appl. 24, 732–740. doi: 10.1890/13-1860.1
Eckmeier, E., van der Borg, K., Tegtmeier, U., Schmidt, M. W. I., and Gerlach, R. (2009). Dating charred soil organic matter: comparison of radiocarbon ages from macrocharcoals and chemically separated charcoal carbon. Radiocarbon 51, 437–443. doi: 10.1017/S0033822200055831
Eidenshink, J., Schwind, B., Brewer, K., Zhu, Z.-L., Quayle, B., and Howard, S. (2007). A project for monitoring trends in burn severity. Fire Ecol. 3, 3–21. doi: 10.4996/fireecology.0301003
Eskelson, B. N. I., Monleon, V. J., and Fried, J. S. (2016). A 6 year longitudinal study of post-fire woody carbon dynamics in California's forests. Can. J. For. Res. 46, 610–620. doi: 10.1139/cjfr-2015-0375
Fearnside, P. M., Graca, P., and Rodrigues, F. J. A. (2001). Burning of Amazonian rainforests: burning efficiency and charcoal formation in forest cleared for cattle pasture near Manaus, Brazil. For. Ecol. Manage. 146, 115–128. doi: 10.1016/S0378-1127(00)00450-3
Folke, C., Carpenter, S., Walker, B., Scheffer, M., Elmqvist, T., Gunderson, L., et al. (2004). Regime shifts, resilience, and biodiversity in ecosystem management. Annu. Rev. Ecol. Evol. Syst. 35, 557–581. doi: 10.1146/annurev.ecolsys.35.021103.105711
González-Pérez, J. A., González-Vila, F. J., Almendros, G., and Knicker, H. (2004). The effect of fire on soil organic matter - a review. Environ. Int. 30, 855–870. doi: 10.1016/j.envint.2004.02.003
Hammes, K., Schmidt, M. W. I., Smernik, R. J., Currie, L. A., Ball, W. P., Nguyen, T. H., et al. (2007). Comparison of quantification methods to measure fire-derived (black/elemental) carbon in soils and sediments using reference materials from soil, water, sediment and the atmosphere. Glob. Biogeochem. Cycles 21:GB3016. doi: 10.1029/2006GB002914
Hammes, K., Smernik, R. J., Skjemstad, J. O., Herzog, A., Vogt, U. F., and Schmidt, M. W. I. (2006). Synthesis and characterisation of laboratory-charred grass straw (Oryza saliva) and chestnut wood (Castanea sativa) as reference materials for black carbon quantification. Org. Geochem. 37, 1629–1633. doi: 10.1016/j.orggeochem.2006.07.003
Harmon, M. E. (2001). Carbon sequestration in forests - addressing the scale question. J. For. 99, 24–29. doi: 10.1093/jof/99.4.24
Harmon, M. E., Kromack, K. Jr., and Smith, B.G. (1987). Coarse woody debris in mixed-conifer forests, Sequioa National Park, California. Can. J. For. Res. 17, 1265–1272. doi: 10.1139/x87-196
Hartford, R., and Frandsen, W. (1992). When it's hot, it's hot…or maybe it's not! (surface flaming may not portend extensive soil heating). Int. J. Wildland Fire 2, 139–144. doi: 10.1071/WF9920139
Hatton, P.-J., Chatterjee, S., Filley, T. R., Dastmalchi, K., Plante, A. F., Abiven, S., et al. (2016). Tree taxa and pyrolysis temperature interact to control the efficacy of pyrogenic organic matter formation. Biogeochemistry 130, 103–116. doi: 10.1007/s10533-016-0245-1
Homann, P. S., Bormann, B. T., Darbyshire, R. L., and Morrissette, B. A. (2011). Forest soil carbon and nitrogen losses associated with wildfire and prescribed fire. Soil Sci. Soc. Am. J. 75, 1926–1934. doi: 10.2136/sssaj2010-0429
Hudak, A. T., Morgan, P., Bobbitt, M. J., Smith, A. M. S., Lewis, S. T., Lentile, L. B., et al. (2007). The relationship of multispectral satellite imagery to immediate fire effects. Fire Ecol. 3, 64–90. doi: 10.4996/fireecology.0301064
Hurteau, M. D., and Brooks, M. L. (2011). Short- and long-term effects of fire on carbon in US dry temperate forest systems. Bioscience 61, 139–146. doi: 10.1525/bio.2011.61.2.9
Jain, T. B., and Graham, R. T. (2007). “The relation between tree burn severity and forest structure in the Rocky Mountains,” in Restoring Fire-Adapted Ecosystems: Proceedings of the 2005 National Silviculture Sorkshop. Gen. Tech. Rep. PSW-GTR-203, ed R. F. Powers (Albany, CA: USDA Forest Service, Pacific Southwest Research Station), 213–250.
Jain, T. B., Pilliod, D. S., Graham, R. T., Lentile, L. B., and Sandquist, J. E. (2012). Index for characterizing post-fire soil environments in temperate coniferous forests. Forests 3, 445–466. doi: 10.3390/f3030445
Jenkins, J. C., Chojnacky, D. C., Heath, L. S., and Birdsey, R. A. (2004). Comprehensive database of diameter-based biomass regressions for North American tree species,” in Gen. Tech. Rep. NE-319 (Newton Square, PA: U.S. Department of Agriculture, Forest Service, Northeastern Research Station.
Keeley, J. E. (2009). Fire intensity, fire severity and burn severity: a brief review and suggested usage. Int. J. Wildland Fire 18, 116–126. doi: 10.1071/WF07049
Keiluweit, M., Nico, P. S., Johnson, M. G., and Kleber, M. (2010). Dynamic molecular structure of plant biomass-derived black carbon (Biochar). Environ. Sci. Technol. 44, 1247–1253. doi: 10.1021/es9031419
Key, C. H., and Benson, N. C. (2006). “Landscape Assessment (LA) sampling and analysis methods,” in FIREMON: Fire Effects Monitoring And Inventory System, Gen. Tech. Rep. RMRS-GTR-164-CD, eds D. C. Lutes, R. E. Keane, J. F. Caratti, C. H. Key, N. C. Benson, S. Sutherland, and L. J. Gangi (Fort Collins, CO: U.S. Department of Agriculture, Forest Service, Rocky Mountain Research Station), LA1–LA55.
Kolka, R. K., Sturtevant, B. R., Miesel, J. R., Singh, A., Wolter, P. T., Fraver, S., et al. (2017). Emissions of forest floor and mineral soil carbon, nitrogen and mercury pools and relationships with fire severity for the pagami creek fire in the boreal forest of northern Minnesota. Int. J. Wildland Fire 26, 296–305. doi: 10.1071/WF16128
Kurth, V. J., MacKenzie, M. D., and DeLuca, T. H. (2006). Estimating charcoal content in forest mineral soils. Geoderma 137, 135–139. doi: 10.1016/j.geoderma.2006.08.003
Landry, J. S., and Matthews, H. D. (2017). The global pyrogenic carbon cycle and its impact on the level of atmospheric CO2 over past and future centuries. Glob. Chang. Biol. 23, 3205–3218. doi: 10.1111/gcb.13603
Lauvaux, C. A., Skinner, C. N., and Taylor, A. H. (2016). High severity fire and mixed conifer forest-chaparral dynamics in the southern Cascade Range, USA. For. Ecol. Manage. 363, 74–85. doi: 10.1016/j.foreco.2015.12.016
Lehmann, J., Skjemstad, J., Sohi, S., Carter, J., Barson, M., Falloon, P., et al. (2008). Australian climate-carbon cycle feedback reduced by soil black carbon. Nat. Geosci. 1, 832–835. doi: 10.1038/ngeo358
Littell, J. S., Peterson, D. L., Riley, K. L., Liu, Y., and Luce, C. H. (2016). A review of the relationships between drought and forest fire in the United States. Glob. Chang. Biol. 22, 2353–2369. doi: 10.1111/gcb.13275
Liu, S. G., Bond-Lamberty, B., Hicke, J. A., Vargas, R., Zhao, S. Q., Chen, J., et al. (2011). Simulating the impacts of disturbances on forest carbon cycling in North America: processes, data, models, and challenges. J. Geophysic. Res. Biogeosci. 116:G00K08. doi: 10.1029/2010JG001585
Liu, Y. Q., Goodrick, S., and Heilman, W. (2014). Wildland fire emissions, carbon, and climate: wildfire-climate interactions. For. Ecol. Manage. 317, 80–96. doi: 10.1016/j.foreco.2013.02.020
Loehman, R. A., Reinhardt, E., and Riley, K. L. (2014). Wildland fire emissions, carbon, and climate: seeing the forest and the trees - a cross-scale assessment of wildfire and carbon dynamics in fire-prone, forested ecosystems. For. Ecol. Manage. 317, 9–19. doi: 10.1016/j.foreco.2013.04.014
Loudermilk, E. L., Scheller, R. M., Weisberg, P. J., Yang, J., Dilts, T. E., Karam, S. L., et al. (2013). Carbon dynamics in the future forest: the importance of long-term successional legacy and climate-fire interactions. Glob. Chang. Biol. 19, 3502–3515. doi: 10.1111/gcb.12310
Lutes, D. C., Keane, R. E., Caratti, J. F., Key, C. H., Benson, N. C., Sutherland, S., et al. (2006). FIREMON: Fire Effects Monitoring And Inventory System, Gen. Tech. Rep. RMRS-GTR-164-CD. Fort Collins, CO: U.S. Department of Agriculture, Forest Service, Rocky Mountain Research Station.
MacKenzie, M. D., McIntire, E. J. B., Quideau, S. A., and Graham, R. C. (2008). Charcoal distribution affects carbon and nitrogen contents in forest soils of California. Soil Sci. Soc. Am. J. 72, 1774–1785. doi: 10.2136/sssaj2007.0363
Maestrini, B., Alvey, E. C., Hurteau, M., Safford, H., and Miesel, J. (2017). Fire severity alters the distribution of pyrogenic carbon stocks across ecosystem pools in a Californian mixed-conifer forest. J. Geophysic. Res. Biogeosci. 122, 2338-2355. doi: 10.1002/2017JG003832
Maestrini, B., and Miesel, J. R. (2017). Modification of the weak nitric acid digestion method for the quantification of black carbon in organic matrices. Org. Geochem. 103, 136–139. doi: 10.1016/j.orggeochem.2016.10.010
Makoto, K., Hirobe, M., DeLuca, T. H., Bryanin, S. V., Procopchuk, V. F., and Koike, T. (2011). Effects of fire-derived charcoal on soil properties and seedling regeneration in a recently burned Larix gmelinii/Pinus sylvestris forest. J. Soils Sediments 11, 1317–1322. doi: 10.1007/s11368-011-0424-6
Masiello, C. A. (2004). New directions in black carbon organic geochemistry. Mar. Chem. 92, 201–213. doi: 10.1016/j.marchem.2004.06.043
Massman, W. J. (2012). Modeling soil heating and moisture transport under extreme conditions: forest fires and slash pile burns. Water Resour. Res. 48:W10548. doi: 10.1029/2011WR011710
Massman, W. J., Frank, J. M., and Mooney, S. J. (2010). Advancing investigation and physical modeling of first-order fire effects on soils. Fire Ecol. 6, 36–54. doi: 10.4996/fireecology.0601036
McBeath, A. V., and Smernik, R. J. (2009). Variation in the degree of aromatic condensation of chars. Org. Geochem. 40, 1161–1168. doi: 10.1016/j.orggeochem.2009.09.006
McBeath, A. V., Smernik, R. J., and Krull, E. S. (2013). A demonstration of the high variability of chars produced from wood in bushfires. Org. Geochem. 55, 38–44. doi: 10.1016/j.orggeochem.2012.11.006
McBeath, A. V., Smernik, R. J., Schneider, M. P. W., Schmidt, M. W. I., and Plant, E. L. (2011). Determination of the aromaticity and the degree of aromatic condensation of a thermosequence of wood charcoal using NMR. Org. Geochem. 42, 1194–1202. doi: 10.1016/j.orggeochem.2011.08.008
Meigs, G. W., Donato, D. C., Campbell, J. L., Martin, J. G., and Law, B. E. (2009). Forest fire impacts on carbon uptake, storage, and emission: the role of burn severity in the eastern cascades, oregon. Ecosystems 12, 1246–1267. doi: 10.1007/s10021-009-9285-x
Meigs, G. W., Turner, D. P., Ritts, W. D., Yang, Z., and Law, B. E. (2011). Landscape-scale simulation on heterogeneous fire effects on pyrogenic carbon emissions, tree mortality, and net ecosystem production. Ecosystems 14, 758–775. doi: 10.1007/s10021-011-9444-8
Michelotti, L. A., and Miesel, J. R. (2015). Source material and concentration of wildfire-produced pyrogenic carbon influence post-fire nutrient dynamics. Forests 6, 1325–1342. doi: 10.3390/f6041325
Miesel, J. R., Hockaday, W. C., Kolka, R. K., and Townsend, P. A. (2015). Soil organic matter composition and quality across fire severity gradients in coniferous and deciduous forests of the southern boreal region. J. Geophysic. Res. Biogeosci. 120, 1124–1141. doi: 10.1002/2015JG002959
Millar, C. I., and Stephenson, N. L. (2015). Temperate forest health in an era of emerging megadisturbance. Science 349, 823–826. doi: 10.1126/science.aaa9933
Miller, J. D., Knapp, E. E., Key, C. H., Skinner, C. N., Isbell, C. J., Creasy, R. M., et al. (2009a). Calibration and validation of the relative differenced Normalized Burn Ratio (RdNBR) to three measures of fire severity in the Sierra Nevada and Klamath Mountains, California, USA. Remote Sens. Environ. 113, 645–656. doi: 10.1016/j.rse.2008.11.009
Miller, J. D., and Safford, H. (2012). Trends in wildfire severity: 1984 to 2010 in the Sierra Nevada, Modoc Plateau, and southern Cascades, California, USA. Fire Ecol. 8, 41–57. doi: 10.4996/fireecology.0803041
Miller, J. D., Safford, H. D., Crimmins, M., and Thode, A. E. (2009b). Quantitative evidence for increasing forest fire severity in the Sierra Nevada and southern Cascade mountains, California and Nevada, USA. Ecosystems 12, 16–32. doi: 10.1007/s10021-008-9201-9
Miller, J. D., and Thode, A. E. (2007). Quantifying burn severity in a heterogeneous landscape with a relative version of the delta Normalized Burn Ratio (dNBR). Remote Sens. Environ. 109, 66–80. doi: 10.1016/j.rse.2006.12.006
Miller, J., and Quayle, B. (2015). Calibration and validation of immediate post-fire satellite-derived data to three severity metrics. Fire Ecol. 11, 12–30. doi: 10.4996/fireecology.1102012
Miller, J. D., Skinner, C. N., Safford, H. D., Knapp, E. E., and Ramirez, C. M. (2012). Trends and causes of severity, size, and number of fires in northwestern California, USA. Ecol. Appl. 22, 184–203. doi: 10.1890/10-2108.1
Morgan, P., Keane, R. E., Dillon, G. K., Jain, T. B., Hudak, A. T., Karau, E. C., et al. (2014). Challenges of assessing fire and burn severity using field measures, remote sensing and modelling. Int. J. Wildland Fire 23, 1045–1060. doi: 10.1071/WF13058
Moritz, M. A., Parisien, M., Batllori, E., Krawchuk, M. A., Van Dorn, J., Ganz, D. J., et al. (2012). Climate change and disruptions to global fire activity. Ecosphere 3:49. doi: 10.1890/ES11-00345.1
Neary, D. G., Ryan, K. C., and DeBano, L. F. (2008). “Wildland fire in ecosystems: effects of fire on soils and water,” in General Technical Report RMRS-GTR-42-Vol. 4, Ogden, UT: USDA Forest Service, Rocky Mountain Research Station.
North, M., Hurteau, M., and Innes, J. (2009). Fire suppression and fuels treatment effects on mixed-conifer carbon stocks and emissions. Ecol. Appl. 19, 1385–1396. doi: 10.1890/08-1173.1
NPS (2003). Fire Monitoring Handbook. Boise, ID: USDI National Park Service, Fire Management Program Center, National Interagency Fire Center.
NRCS (2018). Web Soil Survey. Soil Survey Staff, Natural Resources Conservation Service, United States Department of Agriculture. Available online at http://websoilsurvey.nrcs.usda.gov/ (Accessed January 18, 2018).
Pan, Y., Birdsey, R. A., Fang, J. Y., Houghton, R., Kauppi, P. E., Kurz, W. A., et al. (2011). A large and persistent carbon sink in the world's forests. Science 333, 988–993. doi: 10.1126/science.1201609
Pingree, M. R. A., Homann, P. S., Morrissette, B., and Darbyshire, R. (2012). Long and short-term effects of fire on soil charcoal of a conifer forest in southwest Oregon. Forests 3, 353–369. doi: 10.3390/f3020353
Preston, C. M., and Schmidt, M. W. I. (2006). Black (pyrogenic) carbon: a synthesis of current knowledge and uncertainties with special consideration of boreal regions. Biogeosciences 3, 397–420. doi: 10.5194/bg-3-397-2006
Reisser, M., Purves, R. S., Schmidt, M. W. I., and Abiven, S. (2016). Pyrogenic carbon in soils: a literature-based inventory and a global estimation of its content in soil organic carbon and stocks. Front. Earth Sci. 4:80. doi: 10.3389/feart.2016.00080
Robichaud, P. R., Lewis, S. A., Laes, D. Y. M., Hudak, A. T., Kokaly, R. F., and Zamudio, J. A. (2007). Postfire soil burn severity mapping with hyperspectral image unmixing. Remote Sens. Environ. 108, 467–480. doi: 10.1016/j.rse.2006.11.027
Saiz, G., Goodrick, L., Wurster, C. M., Zimmermann, M., Nelson, P. N., and Bird, M. I. (2014). Charcoal re-combustion efficiency in tropical savannas. Geoderma 219, 40–45. doi: 10.1016/j.geoderma.2013.12.019
Saiz, G., Wynn, J. G., Wurster, C. M., Goodrick, I., Nelson, P. N., and Bird, M. I. (2015). Pyrogenic carbon from tropical savanna burning: production and stable isotope composition. Biogeosciences 12, 1849–1863. doi: 10.5194/bg-12-1849-2015
Santín, C., Doerr, S. H., Kane, E. S., Masiello, C. A., Ohlson, M., de la Rosa, J. M., et al. (2015a). Towards a global assessment of pyrogenic carbon from vegetation fires. Glob. Chang. Biol. 22, 76–91. doi: 10.1111/gcb.12985
Santín, C., Doerr, S. H., Merino, A., Bryant, R., and Loader, N. J. (2016). Forest floor chemical transformations in a boreal forest fire and their correlations with temperature and heating duration. Geoderma 264, 71–80. doi: 10.1016/j.geoderma.2015.09.021
Santín, C., Doerr, S. H., Merino, A., Bucheli, T. D., Bryant, R., Ascough, P., et al. (2017). Carbon sequestration potential and physicochemical properties differ between wildfire charcoals and slow-pyrolysis biochars. Sci. Rep. 7:11233. doi: 10.1038/s41598-017-10455-2
Santin, C., Doerr, S. H., Preston, C., and Bryant, R. (2013). Consumption of residual pyrogenic carbon by wildfire. Int. J. Wildland Fire 22, 1072–1077. doi: 10.1071/WF12190
Santín, C., Doerr, S. H., Preston, C. M., and González-Rodríguez, G. (2015b). Pyrogenic organic matter production from wildfires: a missing sink in the global carbon cycle. Glob. Chang. Biol. 21, 1621–1633. doi: 10.1111/gcb.12800
Schmidt, M. W. I., Skjemstad, J. O., and Jager, C. (2002). Carbon isotope geochemistry and nanomorphology of soil black carbon: black chernozemic soils in central Europe originate from ancient biomass burning. Global Biogeochem. Cycles 16, 70.1–70.8. doi: 10.1029/2002GB001939
Schmidt, M. W. I., Torn, M. S., Abiven, S., Dittmar, T., Guggenberger, G., Janssens, I. A., et al. (2011). Persistence of soil organic matter as an ecosystem property. Nature 478, 49–56. doi: 10.1038/nature10386
Schoennagel, T., Veblen, T. T., and Romme, W. H. (2004). The interaction of fire, fuels, and climate across rocky mountain forests. Bioscience 54, 661–676. doi: 10.1641/0006-3568(2004)054[0661:TIOFFA]2.0.CO;2
Scott, J. (2018). Personal communication, January 18, 2018. Founder and Principal Consultant, Pyrologix LLC (http://www.pyrologix.com), Missoula, MT, USA.
Seiler, W., and Crutzen, P. J. (1980). Estimates of gross and net fluxes of carbon between the biosphere and the atmosphere from biomass burning. Clim. Change 2, 207–247. doi: 10.1007/BF00137988
Stephens, S. L., Agee, J. K., Fulé, P., North, M., Romme, W. H., Swetnam, T. W., et al. (2013). Managing forests and fire in changing climates. Science 342, 41–42. doi: 10.1126/science.1240294
Stockmann, U., Adams, M. A., Crawford, J. W., Field, D. J., Henakaarchchi, N., Jenkins, M., et al. (2013). The knowns, known unknowns and unknowns of sequestration of soil organic carbon. Agric. Ecosystems Environ. 164, 80–99. doi: 10.1016/j.agee.2012.10.001
Trumbore, S., Brando, P., and Hartmann, H. (2015). Forest health and global change. Science 349, 814–818. doi: 10.1126/science.aac6759
Uhelski, D., and Miesel, J. R. (2017). Physical location in the tree during forest fire influences element concentrations of bark-derived pyrogenic carbon from charred jack pines (Pinus banksiana Lamb.). Org. Geochem. 110, 87–91. doi: 10.1016/j.orggeochem.2017.04.014
Van de Water, K. M., and Safford, H. D. (2011). A summary of fire frequency estimates for California vegetation before Euro-American settlement. Fire Ecol. 7, 26–58. doi: 10.4996/fireecology.0703026
Van Mantgem, P. J., Nesmith, J. C. B., Keifer, M., Knapp, E. E., Flint, A., and Flint, L. (2013). Climatic stress increases forest fire severity across the western United States. Ecol. Lett. 16, 1151–1156. doi: 10.1111/ele.12151
Van Mantgem, P. J., Stephenson, N. L., Byrne, J. C., Daniels, L. D., Franklin, J. F., Fulé, P. Z., et al. (2009). Widespread increase of tree mortality rates in the western United States. Science 323, 521–524. doi: 10.1126/science.1165000
Van Wagtendonk, J. W., Benedict, J. M., and Sydoriak, W. M. (1998). Fuel bed characteristics of Sierra Nevada conifers. West. J. Appl. For. 13, 73–84.
Weichman, M. L., Hurteau, M. D., Kaye, J. P., and Miesel, J. R. (2015). Macro-particle charcoal C content following prescribed burning in a mixed-conifer forest, Sierra Nevada, California. PLoS ONE 10:e0135014. doi: 10.1371/journal.pone.0135014
Westerling, A. L., Bryant, B. P., Preisler, H. K., Holmes, T. P., Hidalgo, H. G., Das, T., et al. (2011). Climate change and growth scenarios for California wildfire. Clim. Change 109, 445–463. doi: 10.1007/s10584-011-0329-9
Westerling, A. L., Hidalgo, H. G., Cayan, D. R., and Swetnam, T. W. (2006). Warming and earlier spring increase western US forest wildfire activity. Science 313, 940–943. doi: 10.1126/science.1128834
Keywords: California, fire behavior assessment team, charcoal, pyrogenic organic matter, black carbon, fire effects, burn severity
Citation: Miesel J, Reiner A, Ewell C, Maestrini B and Dickinson M (2018) Quantifying Changes in Total and Pyrogenic Carbon Stocks Across Fire Severity Gradients Using Active Wildfire Incidents. Front. Earth Sci. 6:41. doi: 10.3389/feart.2018.00041
Received: 09 October 2017; Accepted: 06 April 2018;
Published: 14 May 2018.
Edited by:
Cristina Santin, Swansea University, United KingdomReviewed by:
Matthew William Jones, University of Exeter, United KingdomGustavo Saiz, Imperial College London, United Kingdom
Copyright © 2018 Miesel, Reiner, Ewell, Maestrini and Dickinson. This is an open-access article distributed under the terms of the Creative Commons Attribution License (CC BY). The use, distribution or reproduction in other forums is permitted, provided the original author(s) and the copyright owner are credited and that the original publication in this journal is cited, in accordance with accepted academic practice. No use, distribution or reproduction is permitted which does not comply with these terms.
*Correspondence: Jessica Miesel, bWllc2VsamVAbXN1LmVkdQ==
†Present Address: Jessica Miesel, Department of Plant, Soil and Microbial Sciences, Michigan State University, East Lansing, MI, United States