 Theophilus A. Adagunodo1*
 Margaret K. Akinloye2Lukman A. Sunmonu2Ahzegbobor P. Aizebeokhai1Kehinde D. Oyeyemi1Felicia O. Abodunrin2
- 1Department of Physics, Covenant University, Ota, Nigeria
- 2Department of Pure and Applied Physics, Ladoke Akintola University of Technology, Ogbomosho, Nigeria
Groundwater plays a fundamental role in human life. Despite its indispensable characteristics, it is unfortunate that groundwater is often associated with low yield. The expanding demand for water and the cost involved in drilling boreholes therefore require the application and the proper use of groundwater investigation techniques to locate high yielding aquifers. A geophysical investigation involving an electrical resistivity method using a Schlumberger electrode array was conducted around Aaba residential area, a basement terrain of southwestern Nigeria. Sixteen Vertical Electrical Sounding (VES) stations were applied across the study area using a maximum current electrode separation of 100 m. The geoelectrical imaging from this study revealed that the lithologies are divided into topsoil, lateritic soil, Sandy clay/clayey sand/clay/weathered rock and the bedrock. Subsurface geoelectrical maps (overburden thickness, weathered layer isothickness, weathered layer isoresistivity, bedrock relief, bedrock resistivity, and correlations from geoelectric sections) were used to generate information about the groundwater potential of the study area. It was inferred that the eastern (VESs 1, 2, 8, 10, and 11) and the southwestern (VESs 13 and 14) regions are associated with high groundwater yield. Boreholes can be drilled to an average depth of 22.0 m (72.6 ft) on these axes. The groundwater potential of the northern (VES 5), central (VES 9), and southern (VES 12) parts of the study area were inferred to be of medium potential. The borehole drilling along these axes can be extended to the depth of 30.0 m (99.0 ft), with medium groundwater yield. However, the northeastern (VES 3 and VES 4) and the western (VESs 6, 7, 15, and 16) zones are characterized by low groundwater potential. This present study has been able to detect the drillable zones and depths for optimum groundwater yield in a crystalline terrain of Aaba residential area, Akure using VES. The resistivity sounding is efficient in characterization of aquifers for groundwater exploration.
Introduction
Water is described as the most indispensable natural resource which life depends on (Oladejo et al., 2013, 2015; Badejo et al., 2015; Akinrinade and Adesina, 2016; Anomohanran et al., 2017; Emenike et al., 2017). It can be obtained from the troposphere as rain, surface flow as rivers and streams, and subsurface flow as groundwater (Akinrinade and Adesina, 2016; Anomohanran et al., 2017). Rain and surface water are easily contaminated by human activities and at times insufficiently distributed for human use (Oladejo et al., 2015). Shortage of surface water has been predicted over the next decades, especially in sub Saharan African countries due to exhaustion of existing supplies, increase in consumption and contamination (Oladejo et al., 2013). This has made groundwater a proven substitute for human use (Adagunodo, 2017a). It has been found useful in domestic and industrial settings, as well as agricultural sectors (Olafisoye et al., 2012).
Groundwater is located within the pores and fractured rock formation in the subsurface. Groundwater exploration involves the use of scientific methods to locate and extract groundwater (Todd, 1980; Adagunodo, 2017b), it helps to understand the aquifer's nature; type and quality, as well as its groundwater quality.
The study area is bounded by latitude 7.7905° to 7.7942° N and longitude 5.6470° to 5.6505° E. It is a residential area in Akure, Ondo state, Nigeria. The hydrogeological settings of Aaba are chiefly composed of PreCambrian basement rocks, one of the four hydrogeological provinces in Sub-Saharan Africa (SSA) (Sunmonu et al., 2012). These provinces are: PreCambrian basement, consolidate sedimentary rocks, unconsolidated sediments, and volcanic rocks. The land areas of these provinces in SSA are 40, 32, 22, and 6% respectively. The weathered rocks or fractured bedrocks are the prospects for groundwater in the PreCambrian basement, limestones and sandstones are the aquifers in the consolidated sedimentary environment, the aquifers in the unconsolidated sediments are composed of gravels and sands, while the fracture zones with the lava flow and palaeosoils are the major housing for groundwater in the volcanic rock settings (MacDonald and Davies, 2000). Groundwater potential mapping in basement terrain is complex due to the geological nature of the terrain, especially where aquifers are compartmentalized (Sunmonu et al., 2012; Abudulawal et al., 2015; Bayewu et al., 2017). Identification of fractures in the bedrock and/or thick overburden, as well as the degree of pore spaces and interconnectivity of the subsurface rocks have been described as the most relevant variables to understand groundwater accumulation in PreCambrian basement terrain (Adagunodo et al., 2013a; Adelusi et al., 2014; Akinrinade and Adesina, 2016).
The evaluation, development and management of groundwater for water supply involve different stages which include: exploration, drilling, development, and well completion. This study focuses on the exploration stage. The proper exploration of groundwater involves deep and comprehensive techniques to provide valuable information with respect to distribution, thickness, and depth of groundwater bearing formation. Various surface geophysical techniques are used in groundwater exploration which includes the electrical resistivity method, seismic refractive method, magnetic method, radioactivity method, gravity method, and electromagnetic method. These techniques are capable of mapping overburden thickness, aquiferous zones, as well as bedrock architecture and topography (Adagunodo and Sunmonu, 2013; Adagunodo et al., 2014, 2017; Joel et al., 2016; Oyeyemi et al., 2017). This current study is based on the application of electrical resistivity for groundwater exploration.
The use of the resistivity method for groundwater exploration helps to locate the correct point that is suitable for groundwater exploration. The inhabitants of Aaba community solely depend on groundwater for their daily activities. The socio-economic activities in this area, which vary from agriculture to industrial settings (such as cottage industries) all rely on water for their sustainability. Generally, “groundwater has been the major source of water for domestic, industrial and agricultural activities in Akure, southwestern Nigeria” (Asiwaju-Bello et al., 2013). During the dry season, most of the hand-dug wells in the study area dry off as a result of the complexity of the basement terrain. The success rate of groundwater exploration in Aaba residential area, Akure, Ondo state, Nigeria has been relatively low due to inappropriate exploration or interpretation methods resulting from an incomplete understanding of its hydrogeology.
Aquifers in crystalline rocks are housed by weathered layers or fractured bedrock. In some cases, combination of weathered layers and fractured bedrock are needed for optimum groundwater accumulation (Sunmonu et al., 2012; Adagunodo et al., 2013a; Adepelumi et al., 2013; Akinrinade and Adesina, 2016). The electrical resistivity method is one of the most adopted techniques in geophysical campaigns for groundwater exploration. Though applications of 2D and 3D electrical resistivity surveys to groundwater exploration and other near surface features have been reported by some authors (Aizebeokhai, 2010; Loke et al., 2013; Adagunodo et al., 2015), VES has been the most widely used configuration out of other electrical resistivity configurations, especially in the developing nations (Abudulawal et al., 2015). This is justified by its cost effectiveness, usefulness in deep subsurface mapping, and ability to image large expanse of land through geoelectrical parameters (Riss et al., 2011; Abudulawal et al., 2015). Although VES only measures resistivity variations in one-dimension, it has been found very effective in the characterization of basement geology as well as groundwater exploration (Olayinka et al., 2004; Nwankwo, 2011; Adagunodo et al., 2013b; Abudulawal et al., 2015). This justifies adopting VES for groundwater exploration in the study area.
This method has been employed by Ekine and Oku (2008) to delineate into the aquiferous zone of Akure South Local Government Area, Akure. Akintorinwa and Olowolafe (2013) also employed the same method (VES) to examine the effective groundwater yield and protective competency of overburden overlying the aquifers of Zion estate, Akure, southwestern Nigeria. They reported that the potential of having a high yield of groundwater in Zion estate is low. However, the aquifer's protective analysis showed that 75% of Zion estate fell within poor overburden protective capacity. Adeoye-Oladapo et al. (2015) used integrated geoelectric arrays to evaluate the groundwater potential of the campus of the school of earth and mineral sciences, FUTA, Nigeria. The combined results of Dipole-Dipole and VES have revealed a disappointing hydrogeologic characteristic prevalent within the vicinity of the study area. In dipole-dipole configuration, the potential electrodes are closely spaced and remote from the current electrodes, which are also close to each other (Adagunodo and Sunmonu, 2013). Though its field data is easy to acquire and fast, the major drawback is the shallow depth of investigation due to low signal strength (Loke, 1997; Hago, 2000). Furthermore, Shendi and Elrayes (1992), Yadav et al. (1997), Muchingami et al. (2012), Meena (2011), NagaGouda et al. (2012), Adagunodo and Sunmonu (2013), Adagunodo et al. (2013a,b), Aizebeokhai and Oyebanjo (2013), Adelusi et al. (2014), Obiabunmo et al. (2014), Abudulawal et al. (2015), Sunmonu et al. (2015), Aizebeokhai et al. (2016); Akinrinade and Adesina (2016), Joel et al. (2016), Sunmonu et al. (2016), Aizebeokhai et al. (2017); Bayewu et al. (2017), Mohamaden and Ehab (2017), and Sultan et al. (2017) have adopted the Geoelectrical technique either as a stand-alone method, or integrated with other geophysical methods to search for groundwater occurrence in the subsurface. Hence, this study is aimed at using Vertical Electrical Sounding (VES) to establish drillable zone(s) for groundwater and recommend the appropriate depth to which boreholes can be sunk in the area to exploit an appreciable volume of water in the subsurface. This method has been the most widely used electrical resistivity array in groundwater investigation due to its ability to map the subsurface structures and lithologic variations at satisfactory depths (Anomohanran et al., 2017).
The Study Area and Its Geology
The study area is experiencing population increase due to its proximity to the Federal University of Technology, Akure (FUTA). This is revealed in the location map presented in Figure 1A. The base map of the study area is presented in Figure 1B. The climate of Akure is distinguished by a rainy season and a dry season. The precipitation regime is bimodal, with one wet season from March to Mid-July and a second wet season from late-August to Mid-November. Two dry seasons occur in between the rainy season, with the occurrence of short dry season from Mid-July to early-August, and long dry season from late-November to March (Ogunrayi et al., 2016). The annual temperature varies from 21 to 29°C, with relatively high annual humidity.
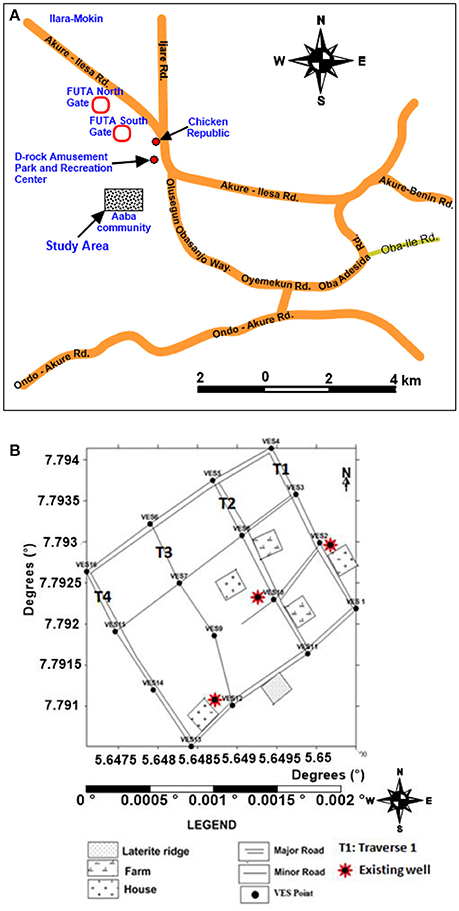
Figure 1. (A) Location of the study area. (B) Base map of the study area.
The geology of Nigeria is part of the remobilized part of basement rocks of West Africa (Adagunodo et al., 2018a,b,c,d). As reported by Ademeso (2009), “the major rock types in Akure are the schist belts which are low to medium grade supracrustal, the gneiss-migmatite-quartzite complex, the Pan African granitoids (Older Granites) and other related rocks such as charnockite rocks and syenites, meta-igneous rocks, minor felsic and mafic intrusive.” The rocks have been found as intrusive bodies in the migmatite-gneiss-quartzite complex.
The study area geology is composed of migmatite, older granite, and charnockite. The basement bedrocks are associated with low porosity and trivial permeability. This is as a result of their composition. Thus, accessibility of groundwater in crystalline bedrock is attributed to the formation of secondary porosity and interconnected pores as a result of weathering and fractures. Figure 2 shows the geological formations of Akure, Nigeria.
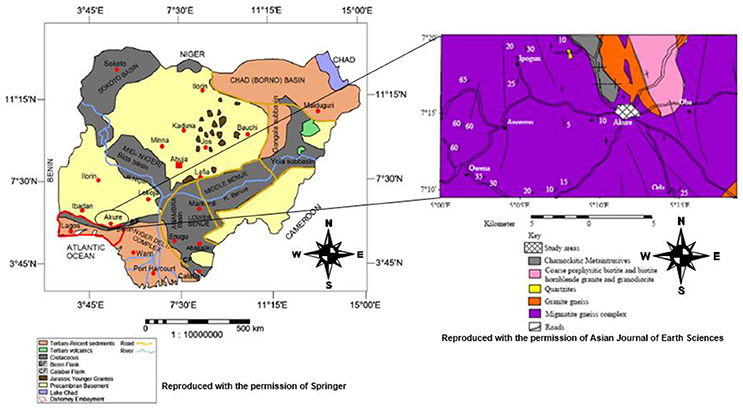
Figure 2. Geological terrains in Nigeria revealing the geology of Akure and its environs. Source: Obaje (2015) and Ademeso (2009).
However, past research on groundwater in crystalline bedrock of Nigeria has focused on the weathered formations, which are believed to be a very reliable aquifer in those places where it is deep enough. The water yield may be further enhanced where the weathered basement is underlain by fracture zones, porous and deep network of joints and fracture or fissures in the parent rock and some of the greatest water needs occur in regions underlain by basement complex (King et al., 1997).
Materials and Methods
Geophysical investigation involving VES was carried out in Aaba residential area in Akure using a Schlumberger array. The study area was chosen because the inhabitants suffer shortage of water for their daily and economic activities due to low yield of surround wells. The geoelectrical method was used because of its effectiveness in understanding subsurface geology (Tizro et al., 2012; Anomohanran et al., 2017). The study was designed such that the VES points were carried out in traverses to allow for spatial mapping of the geoelectrical parameters (Sunmonu et al., 2012; Adagunodo and Sunmonu, 2013; Adagunodo et al., 2013a,b; Abudulawal et al., 2015; Anomohanran et al., 2017). A total number of sixteen (16) VES by applying the Schlumberger array were randomly acquired along four (4) traverses (Figure 1B) in order to cover the area of study. VES 2, VES 10, and VES 12 were carried out at the vicinity of the existing wells of about 9 m deep. This study is the first documented attempt to assess the groundwater potential of the study area. Despite the “water for life by 2015” campaign by the United Nations (United Nations, 2006; Callahan et al., 2013; Oladejo et al., 2013, 2015; Abudulawal et al., 2015), the study area still suffered from water shortage in 2017.
Among the techniques that are globally adopted for groundwater exploration, Very Low Frequency Electromagnetic (VLF-EM) and VES have been the most utilized geophysical tools. The VLF-EM technique is capable of penetrating hard rock terrain to greater depth because of its sensitivity in highly resistive terrain, and has proven effective where other geophysical techniques may not be found useful (Parasnis, 1979; McNeill and Labson, 1991; Sundararajan et al., 2007; Adelusi et al., 2014; Oladejo et al., 2015). It is fast, and useful as a reconnaissance tool (Hutchinson and Barta, 2002; Olorunfemi et al., 2005; Bayewu et al., 2012; Oladejo et al., 2013; Akinrinade and Adesina, 2016). The electrical resistivity employing VES configuration is effective due to its simplicity (Sunmonu et al., 2012), easy interpretation, and the ruggedness of the field equipment (Adelusi et al., 2014; Sunmonu et al., 2016). The technique has been found useful both in soft rock terrain (Aizebeokhai et al., 2016, 2017; Oyeyemi et al., 2017) and hard rock domain (Adagunodo and Sunmonu, 2012; Sunmonu et al., 2012, 2015; Adelusi et al., 2014; Abudulawal et al., 2015; Anomohanran et al., 2017; Mohamaden and Ehab, 2017) respectively.
The field procedure involves passing current through a pair of current electrode into the subsurface, with the measurement of the resulting potential difference through the other pair of potential electrode. The methods is implemented by incrementing the electrode array about a fixed point for deeper subsurface probing and to establish the resistivity variations with depth (Koefoed, 1979; Patra and Nath, 1999; Sunmonu et al., 2012, 2015, 2016; Adagunodo et al., 2013a,b; Akinrinade and Adesina, 2016; Adagunodo et al., 2017). The precautions to ensure accurate data acquisition in electrical resistivity survey were followed as reported by Patra and Nath (1999) and Adeniji (2014). The maximum current electrode spacing used in the area was 100 m. An IGIS DDR1 resistivity meter was employed for the ground resistance measurements while the apparent resistivity (ρa) values of each sounding station were obtained from Equation (1) as obtained from Ako (1979).
where “G” is the geometric factor, and “R” is the ground resistance.
The apparent resistivity estimated from Equation (1) was used for the partial curve matching. The field data obtained were plotted on a bi-log paper for a preliminary check whether the data obtained are noisy or not prior to data processing. Partial curve matching was performed on the field data to obtain the initial values of each layer's apparent resistivity and thickness. The obtained layers' parameters were iterated using a Computer-aided program (WinResist) in order “to reduce the errors to a desired limit and improve the goodness of fit” (Sunmonu et al., 2016). WinResist an iterative computer programme was used to obtain the Dar Zarrouk parameters, which are the second-order geoelectric parameters (that is, the true resistivity and thickness of each layer encountered). The results of the geoelectrical parameters were used to produce maps and geoelectric sections used for the description of geological framework in this study (Tizro et al., 2012; Akinrinade and Adesina, 2016; Sunmonu et al., 2016; Anomohanran et al., 2017).
Results and Discussions
The results acquired from the geophysical survey through VES of the 16 stations are presented in Table 1. However, the true resistivity and thickness of each layer (Anomohanran et al., 2017) obtained in the study area were classified into curve-types as presented by Sunmonu et al. (2015). The obtained Dar Zarrouk parameters and other field data such as coordinates and elevations of the sampling points were used to generate a curve-types distribution chart (Figure 3), maps of various groundwater related parameters (Figures 4a–f), and geoelectric sections (Figures 5a–d) of the study area.
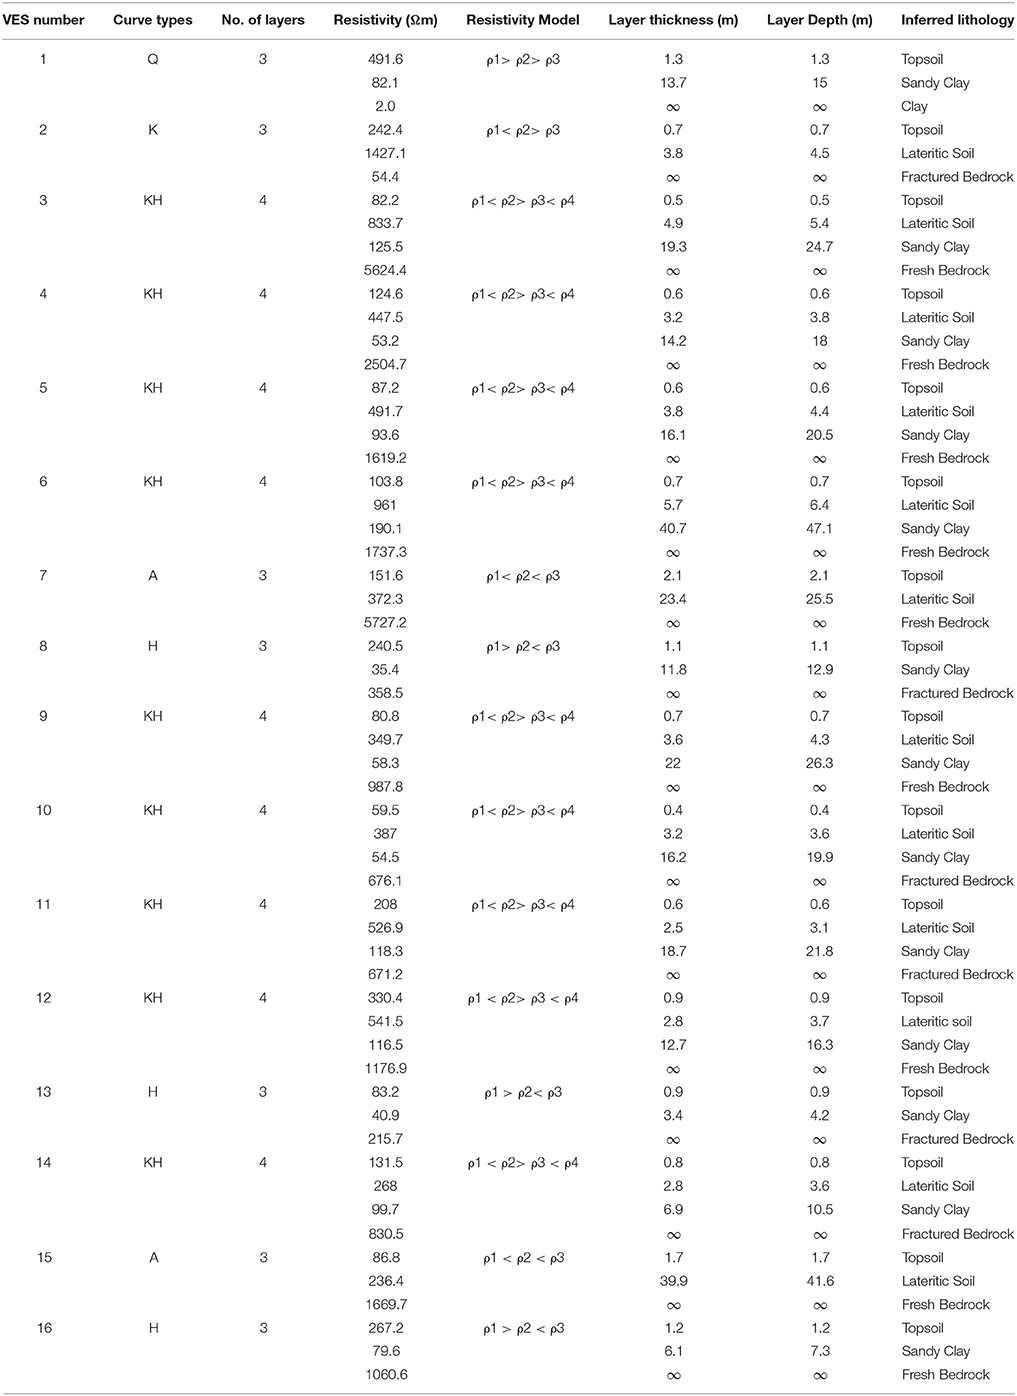
Table 1. Geoelectrical sequence of Aaba community.
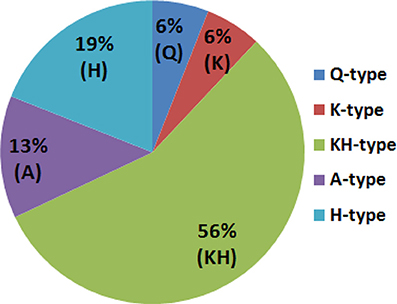
Figure 3. Percentage Distribution of Curves in the study area.
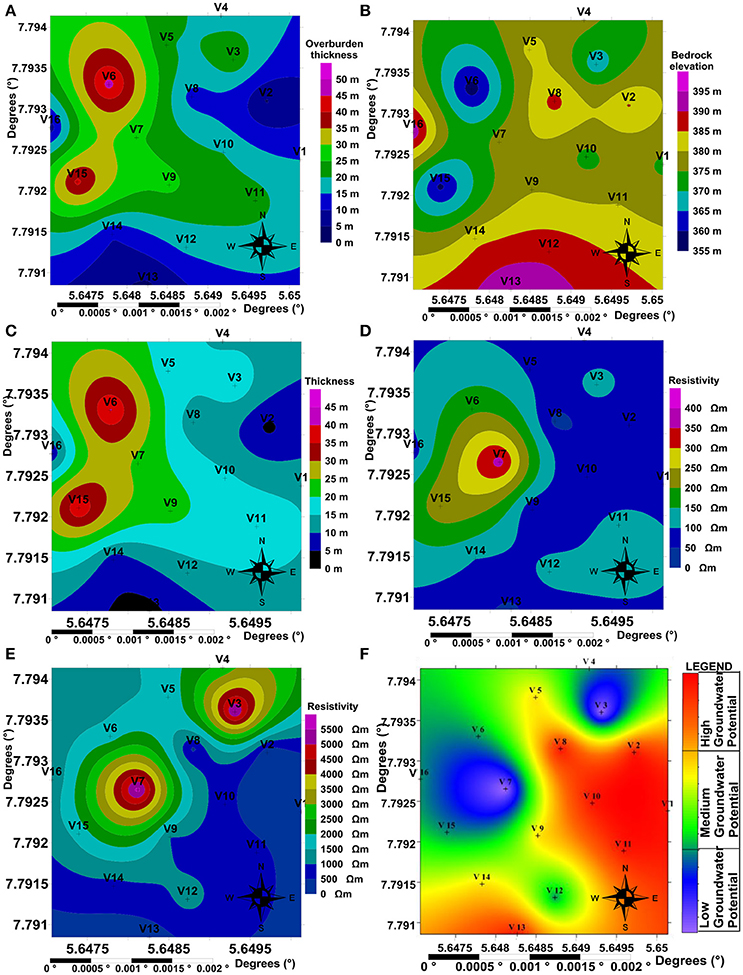
Figure 4. Maps of various groundwater related parameters. (A) Overburden Isopach Map. (B) Bedrock Relief Map. (C) Weathered Layer Isothickness Map. (D) Weathered layer isoresistivity map. (E) Bedrock isoresistivity map. (F) Final Groundwater potential map.
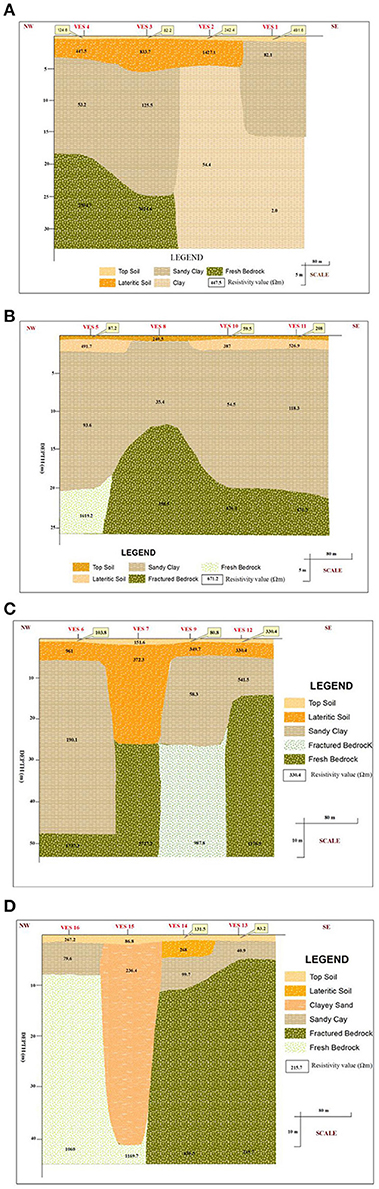
Figure 5. (A) Geoelectric Section along Traverse 1. (B) Geoelectric Section along Traverse 2. (C) Geoelectric Section along Traverse 3. (D) Geoelectric Section along Traverse 4.
Distribution of Curves
The curve types (Figure 3) consist of four (4) three-layer models (that is, Q, K, A, and H-type) and one (1) four-layer earth model (that is, KH-type). Q-type and K-type covered 6% of the total study area (as presented in Figure 3), A-type covered 13%, H-type covered 19%, while KH-type covered 56% of the VES stations in the study area (Figure 3). Characterization of a VES curve is based on its resistivity values. A three-layer model consists of ρ1, ρ2, and ρ3, which are grouped into four types namely: A, H, K, and Q (Sunmonu et al., 2015). An A-type is the double ascending curve, with the model ρ1 < ρ2 < ρ3; H-type is the minimum curve, with the model ρ1 > ρ2 < ρ3; K-type is the maximum curve, with the model ρ1 < ρ2 > ρ3; while Q-type is the double descending curve, with the model ρ1 > ρ2 > ρ3. The ρ1, ρ2, and ρ3 are the resistivity values of layer 1, layer 2, and layer 3 respectively (Table 1: Column 4). The produces a four-layer model. The possible types of four-layer model are: HK, HA, AK, AA, KQ, KH, QQ, and QH (Patra and Nath, 1999; Sunmonu et al., 2015). The models of all the VES stations are presented in Table 1: Column 5. The Geoelectrical parameters of Table 1 were based on Sunmonu et al. (2015) aquifer pattern and bedrock characterization.
From Table 1, 44% of the study area showed three layers lithology varying from topsoil, sandy clay or laterites, and bedrock (fresh or fractured bedrock). However, the remaining 56% belong to four-layer lithologic group varying from topsoil, laterites, sandy clay, and bedrock. The geologic classification of each layer is essential, because it is required in assessing the groundwater potential of Aaba, which is presented in subsequent Subsections. The resistivity of topsoil (first layer) varied from 59.5 (VES 10) to 491.6 Ωm (VES 1). In a basement terrain where groundwater accumulation is a function of weathered layer's thickness and fractured bedrock, the layer's thickness is used to classify the vertical extent at which each geological type can be covered in the subsurface. The thickness and depth of the last layer in geoelectrical analysis is infinite (Patra and Nath, 1999; Obiabunmo et al., 2014; Anomohanran et al., 2017; Sultan et al., 2017). In a crystalline terrain, the thicker the overburden, the more viable the groundwater exploration becomes in such environment. In another case, fractured bedrock has been the most promising factor for groundwater exploration in crystalline terrain (Obiabunmo et al., 2014).
Sandy clay and fractured bedrock are identified as the water holding layers in the study area. It is imperative to assess the fitness of the overlying materials above these water holding rocks. In order to do this, Aquifer's Overburden Model (AOM) was used. The AOM is used to define the vulnerability of aquifers to contamination (from anthropogenic source) through the unconsolidated materials (overburden) overlying the aquifer. This model is based on the evaluation of the resistivity value of topsoil (Adagunodo and Sunmonu, 2012), and assessment of the lithologic unit covering the aquifer whether it is made up of clay or laterites (Sunmonu et al., 2015; Adeyemo et al., 2016). For an aquifer not to be vulnerable to anthropogenic contamination, the topsoil has to be composed of clay. Out of the sixteen (16) sampling points in the study area, 38% of the topsoil is made up of clay (VES 3, VES 5, VES 9, VES 10, VES 13, and VES 15). Apart from VES 1, VES 8, and VES 16, other aquifers are covered by lateritic layer, convincing evidence that the aquifers in Aaba are safe from anthropogenic contamination. Furthermore, the aquifer in the fractured bedrock of VES 1 is also considered as safe due to the geoelectrical signature of its bedrock.
Overburden Thickness
The overburden thicknesses overlying the bedrock of Aaba were contoured using Surfer 11 as depicted in Figure 4A. The generation of an overburden thickness map reveals the aquifer geometry of subsurface. The overburden encapsulates the topsoil, laterites, and weathered zone. The overburden thickness ranged from 4.2 to 47.1 m. As reported by Sunmonu et al. (2012) that, “areas with thick overburden equivalent to basement depression have been identified as zones of high potential for groundwater exploration especially in the Precambrian basement terrain.” The overburden is very thick at the western and northwest zones of the study area, and hence has a probable high groundwater potential. Although all other VES points have an overburden greater than 15 m, which is associated with high groundwater potential, except for VESs 2, 8, 13, 14, and 16 that are encapsulated with thin overburden, which could result to low groundwater potential. Table 2 summarizes the potential of aquifer's yield in relation to the overburden thicknesses according to Sunmonu et al. (2012).
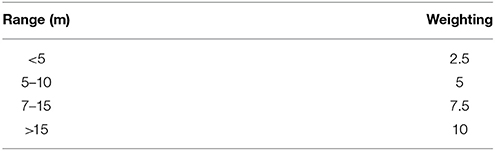
Table 2. Aquifer potential as a function of overburden thickness [modified with the permission of “RMZ—Materials and Geoenvironment” after (Sunmonu et al., 2012)].
Bedrock Relief
A map that helps to image the suspected zones for groundwater prospects is known as a bedrock relief map as shown in Figure 4B. Bedrock elevation is obtained from the subtraction of overburden thickness from the surface elevation. The generated bedrock relief map reveals the bedrock topography of Aaba community that has been concealed by overburden thickness. The collecting trough (that is, zone of basement depression) is the promising location for groundwater prospects. The map displays a sequence of basement ridges and depressions as revealed in Figure 4B. The western to the northwestern zone as well as some parts toward the eastern and northeastern part of the study area are the areas of depressions while all other locations are the ridges. The basement depression corresponds to thick overburden, while the basement ridge corresponds to thin overburden. Sunmonu et al. (2015) revealed that a depression zone within the basement complex is the collecting trough for groundwater. Therefore, these zones would be cogent locations to explore the development stage of groundwater project in Aaba community, Akure.
Isothickness of Weathered Layer
The weathered layer in relation to this study is the thickness of the materials between topsoil and fresh or fractured bedrock. The thickness of this layer varies from 3.8 to 40.7 m. The essence of generating Figure 4C is to examine the contribution of weathered basement to aquifer's prospect. VES 6 and VES 15 are the two pronounced peaks on the map, and this could result in high groundwater potential. VESs 2, 3, 4, 5, 7, 9, 10, 11, and 12 have thicker (medium) weathered layers and could result in medium groundwater potential. The region with thin weathered layer thickness might result in medium to low groundwater potential. VESs 1, 8, 13, 14, and 16 points fall into this category.
Weathered Layer Isoresistivity
The weathered layer resistivity as defined in this work is the resistivity of the rock layer between the topsoil and fractured or fresh bedrock. The purpose of generating Figure 4D is to differentiate between zones of high water—bearing to low water—bearing within the weathered layer, and to determine point-to-point variation in the degree of weathering/saturation.
The peak of the aquifer's resistivity (>300 Ωm) is recorded at VES 7, the high resistivity value associated with these parts is possibly due to the sandy nature of the aquifers, which suggests a negligible potential. VESs 6 and 15 have aquifer resistivity range from 151 to 300 Ωm, which suggests poor groundwater potential. VESs 3, 11, and 12 have aquifer resistivity range of 100 to 150 Ωm. This suggests a clayey sand aquifer of medium groundwater potential. VESs 2, 4, 5, 8, 9, 10, 13, 14, and 16 have aquifer resistivity range from 21 to 100 Ωm, which suggests sandy clay aquifer of medium—to—good groundwater potential. This is probably due to high weathered nature of the weathered basement layer, which is tending toward clay as reported by Sunmonu et al. (2015). VES 1 has very low resistivity (< 20 Ωm), which suggests clay with limited groundwater potential. Table 3 summarizes the potential of aquifer's yield due to the contributions of weathered layer isoresitivity according to Sunmonu et al. (2012).
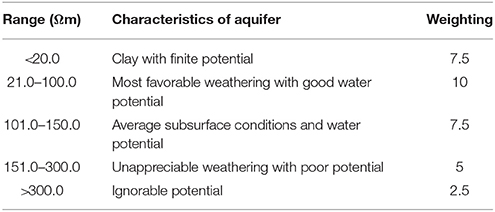
Table 3. Contributions of weathered layer isoresistivity to aquifer's potential [modified with the permission of “RMZ—Materials and Geoenvironment” after (Sunmonu et al., 2012)].
Bedrock Resistivity
The bedrock isoresistivity is a map that reveals the distribution of bedrock resistivity in the subsurface as shown in Figure 4E. The resistivity of the bedrock is high (>5,000 Ωm) at VES 3 and VES 7. This could result in poor aquifer potential if the aquifer is housed in the bedrock. However, the basement rocks at VESs 8, 9, 10, 11, and 13 are fractured as depicted from the low basement resistivity (< 750 Ωm) in Figure 4E. It can be inferred that some amount of water is contained within the fractures which further support the groundwater potential of these points. VESs 9, 12, 14, and 16 have resistivity that range from 750 to 1500 Ωm. This suggests a medium aquifer potential. VESs 5, 6, 7, and 15 have resistivity that range from 1,500 to 3,000 Ωm. This infers a low aquifer potential. Table 4 summarizes the potential of aquifer's yield due to the contributions of bedrock resistivity according to Sunmonu et al. (2012).
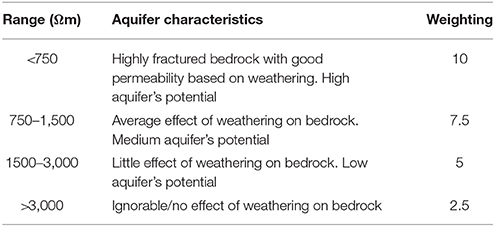
Table 4. Aquifer's yield due to the contributions of bedrock resistivity [modified with the permission of “RMZ—Materials and Geoenvironment” after (Sunmonu et al., 2012)].
Geoelectric Sections
The geoelectric sections of Aaba were drawn from the result of the geoelectrical parameters along Traverses 1 and 4 (Figures 5A–D). This was done to visualize the vertical and lateral distributions of ρa layer-by-layer in the subsurface (Adagunodo and Sunmonu, 2013), which is a revelation of the lateral and vertical facies changes inferred from the geoelectrical parameters (Adagunodo et al., 2013a,b). A maximum of four geoelectrical sequences were demarcated underneath these sections. The lithologies demarcated are: topsoil, laterites, sandy clay/clayey sand/clay/weathered rocks, and bedrock.
Figure 5A shows that the areas within VES 1 and 2 (from middle to the southeastern end of traverse 1) are the best for groundwater prospect. The weathering here is very thick, and it is expected that this was caused by the relatively deep seated fracture. Boreholes are encouraged to be drilled up to the depth of 18.0 m (59.4 ft) on this zone.
Figure 5B shows that sections beneath VES 8, VES 10, and VES 11 are highly prospective for groundwater. This is due to thick weathering at VES 10 and 11, and fractured bedrock at VES 8, VES 10, and VES 11. Boreholes can be drilled to the depth of 22.0 m (72.6 ft) along this path. Although VES 5 has thick overburden; low resistivity in its weathered layer; and fresh bedrock, these signatures cannot be convincingly interpreted as good zone for groundwater prospect.
Figure 5C shows that VES 6 has high prospect for groundwater exploration. This is because of the thick weathering. VES 9 is another point on the geosection that is considered suitable for groundwater exploration, due to presence of fracture in the bedrock. The borehole is recommended to be drilled up to 30.0 m (99.0 ft) depth on this axis. VES 7 and VES 12 could result to low groundwater potential zone when probed further, because it has thin overburden, high resistivity weathered layer, and fresh basement.
Figure 5D shows that the region around VES 15 showed thick overburden; high resistivity weathered layer; and fresh basement, which could result to poor groundwater potential. The thin weathered layer in VES 13 and VES 14 are underlain by fractured bedrock, which could serve as good aquifer. Boreholes will be productive at depth greater than 15.0 m (49.5 ft) on this axis.
The geoelectrical parameters around the three (3) wells were able to reveal that drilling of borehole would have been favorable at VES 2 and VES 10 than the existing wells on these locations. The geoelectrical signature beneath VES 12 justifies the reason why the well at the proximity of this station produces the least yield in the study area. Based on the geoelectric section imaging, borehole drilling is not encouraged at this station.
Overall Groundwater Potential Map
A groundwater potential map generated from the arithmetic mean of all the evaluated maps and geoelectric sections was produced as shown in Figure 4F. Three weights of low, medium and high potentials were used as reported by Sunmonu et al. (2012). The map is based on spatial distributions of anomalies in the study area as depicted by variations of color in Figure 4F. The prolific-to-unprolific zones are determined based on the mean of aquifer's characteristic weighting from Tables 2–4 and the geoelectric sections' classification. High groundwater potential is assigned weight > 7.5, low groundwater potential is assigned weight < 5, and the medium groundwater potential are the weights between 5 and 7.5 respectively. The eastern (VESs 1, 2, 8, 10, and 11) and the southwestern (VESs 13 and 14) regions are associated with high yield of groundwater. Boreholes can be drilled to an average depth of 22.0 m (72.6 ft) on these axes. The groundwater potential of the northern (VES 5), central (VES 9), and southern (VES 12) parts of the study area were inferred to be of medium potential. The borehole drilling along these axes can be extended to the depth of 30.0 m (99.0 ft), with medium groundwater yield. However, the northeastern (VES 3 and VES 4) and the western (VESs 6, 7, 15, and 16) zones depict low groundwater potential.
Conclusion
The application of the Electrical resistivity method for exploration of groundwater in Aaba residential area, Akure, southwestern Nigeria has been carried out in this study by interpreting acquired VES data via maps (3D imaging) and geoelectric sections (2D imaging). This work has provided reliable information on the application of electrical resistivity method in groundwater exploration, which will be indispensable for developing an efficient water supply schemes and groundwater success rate in the study area. The subsurface layers are composed of three (3) and four (4) layer—earth models which is in agreement with groundwater exploration studies from Basement terrain in southwestern Nigeria such as Mohammed et al. (2012), Sunmonu et al. (2012), Adepelumi et al. (2013), Abudulawal et al. (2015), Sunmonu et al. (2016), and Bayewu et al. (2017). The overburden thickness varied from 4.2 to 47.1 m. Weathered layer and fractured bedrock constitute the aquifer units in Aaba. The geoelectric sections corroborated the apparent resistivity data's interpretations and established the resistivity variations' pattern of the subsurface. The evaluation of aquifers' vulnerability to contaminants through geoelectric parameters showed that the aquifers are safe from anthropogenic pollution. This is in agrreement with the work of Adeyemo et al. (2016) that was carried out at Ipinsa and Okeodu via Akure southwestern Nigeria. Their model showed that only 10% of the study area is highly vulnerable to near surface pollution. The analyses in this sudy have made the work to be qualitative and quantitative in nature. The exempted information in one scope is revealed through the other scope which necessitate justifiable conclusion. Conclusively, the thick overburden that corresponds to basement depression is associated with high yield of groundwater. This zone which serves as collecting trough for groundwater would be the most efficient zone for groundwater exploitation in Aaba.
Efforts aimed at ensuring adequate groundwater supply in the area should be concentrated at zones where the bedrock is deep. Furthermore, the regions of fractured basement rocks and bedrock depression (thick overburden) are zones with high groundwater accumulation capacity and are therefore recommended for extracting groundwater in substantial quantities.
Author Contributions
TA and MA Designed the study and vetted the paper. TA and FA Did the literature review and wrote the first draft. TA, MA, LS, and FA Conducted the field investigations. TA Analyzed the dataset. TA, MA, LS, AA, KO, and FA Prepared the final version of the manuscript for submission, and gave technical support as well as conceptual advice on the paper's quality.
Conflict of Interest Statement
The authors declare that the research was conducted in the absence of any commercial or financial relationships that could be construed as a potential conflict of interest.
Acknowledgments
The authors are grateful to the management of Covenant University, Ota, Ogun State, Nigeria for partial sponsorship. The authors are also grateful to Springer and Asian Journal of Earth Sciences for the permission given to reproduce Figure 2 from Obaje (2015) and Ademeso (2009), as well as RMZ—Materials and Geoenvironment' for allowing us to modify and reproduce Tables 2−4 from Sunmonu et al. (2012). Furthermore, contributions from the handling editor, Dr. Wouter Buytaert and the reviewers of this paper are highly appreciated.
References
Abudulawal, L., Amidu, S. A., Apanpa, K. A., Adeagbo, O. A., and Akinbiyi, O. A. (2015). Geophysical investigation of subsurface water of Erunmu and its environs, southwestern Nigeria using electrical resistivity method. J. Appl. Sci. 15, 741–751. doi: 10.3923/jas.2015.741.751
Adagunodo, A., and Sunmonu, A. (2013). The Study of Basement Pattern of an Industrial Estate. Saarbrucken: LAP Lambert Academic Publishing GmbH & Co. KG Heinrich-Bocking. Available online at: https://www.lap-publishing.com
Adagunodo, T. A. (2017a). “Groundwater contamination: performance, effects, limitations and control,” in Groundwater Contamination: Performance, Limitations and Impacts, ed A. L. Powell (New York, NY: Nova Science Publishers, Inc), 33–64.
Adagunodo, T. A. (2017b). “Groundwater pollution and control: an overview,” in Groundwater Contamination: Performance, Limitations and Impacts, ed A. L. Powell (New York, NY: Powell Nova Science Publishers, Inc), 1–12.
Adagunodo, T. A., Adeniji, A. A., Erinle, A. V., Akinwumi, S. A., Adewoyin, O. O., Joel, E. S., et al. (2017). Geophysical investigation into the integrity of a reclaimed open dumsite for civil engineering purpose. Interciencia J. 42, 324–339.
Adagunodo, T. A., George, A. I., Ojoawo, I. A., Ojesanmi, K., and Ravisankar, R. (2018a). Radioactivity and radiological hazards from a kaolin mining field in Ifonyintedo, Nigeria. MethodsX 5, 362–374. doi: 10.1016/j.mex.2018.04.009
Adagunodo, T. A., Hammed, O. S., Usikalu, M. R., Ayara, W. A., and Ravisankar, R. (2018b). Data on the radiometric survey over a Kaolinitic Terrain in Dahomey Basin, Nigeria. Data Brief 18, 814–822. doi: 10.1016/j.dib.2018.03.088
Adagunodo, T. A., Lüning, S., Adeleke, A. M., Omidiora, J. O., Aizebeokhai, A. P., Oyeyemi, K. D., et al. (2018c). Evaluation of 0 ≤ M ≤ 8 Earthquake data sets in African-Asian region during 1966–2015. Data Brief 17, 588–603. doi: 10.1016/j.dib.2018.01.049
Adagunodo, T. A., and Sunmonu, L. A. (2012). Geoelectric assessment of groundwater prospect and vulnerability of overburden aquifers at Adumasun area, Oniye, southwestern Nigeria. Arch. Appl. Sci. Res. 4, 2077–2093.
Adagunodo, T. A., Sunmonu, L. A., and Adeniji, A. A. (2015). Effect of dynamic pattern of the saprolitic zone and its basement on building stability: a case study of a high-rise building in Ogbomoso. J. Appl. Phys. Sci. Int. 3, 106–115.
Adagunodo, T. A., Sunmonu, L. A., and Emetere, M. E. (2018d). Heavy metals' data in soils for agricultural activities. Data Brief 18, 1847–1855. doi: 10.1016/j.dib.2018.04.115
Adagunodo, T. A., Sunmonu, L. A., Ojoawo, A., Oladejo, O. P., and Olafisoye, E. R. (2013a). The hydro geophysical investigation of Oyo state industrial estate Ogbomosho, southwestern Nigeria using vertical electrical soundings. Res. J. Appl. Sci. Eng. Technol. 5, 1816–1829. doi: 10.19026/rjaset.5.4944
Adagunodo, T. A., Sunmonu, L. A., and Oladejo, O. P. (2014). Effect of constructing high-rise buildings without a geophysical survey. Nigerian J. Phys. Spec. Edition 2014, 91–100.
Adagunodo, T. A., Sunmonu, L. A., Oladejo, O. P., and Ojoawo, I. A. (2013b). Vertical electrical sounding to determine fracture distribution at Adumasun Area, Oniye, Southwestern Nigeria. J. Appl. Geol. Geophys. 1, 10–22. doi: 10.9790/0990-0131022
Adelusi, A. O., Ayuk, M. A., and Kayode, J. S. (2014). VLF-EM and VES: an application to groundwater exploration in a PreCambrian basement terrain SW Nigeria. Ann. Geophys. 57:s0184. doi: 10.4401/ag-6291
Ademeso, O. A. (2009). Deformation traits in the charnockitic rocks of Akure area, Southwestern Nigeria. Asian J. Earth Sci. 2, 113–120. doi: 10.3923/ajes.2009.113.120
Adeniji, A. A. (2014). Integrated Geophysical Techniques for Investigating Subsurface Structural Analysis Around Ogbagba, Southwestern Nigeria. M. Tech. thesis, Ladoke Akintola University of Technology, Ogbomoso.
Adeoye-Oladapo, O. O., Mogaji, K. A., and Oladapo, M. I. (2015). Multi-array hydro-geoelectric characterization of a crystalline besement complex environment. Phys. Sci. Int. J. 8, 1–18. doi: 10.9734/PSIJ/2015/17444
Adepelumi, A. A., Akinmade, O. B., and Fayemi, O. (2013). Evaluation of groundwater potential of Baikin Ondo state, Nigeria using resistivity and magnetic techniques: a case study. Univ. J. Geosci. 1, 37–45. doi: 10.13189/ujg.2013.010201
Adeyemo, I. A., Olowolafe, T. S., and Fola-Abe, A. O. (2016). Aquifer vulnerability assessment at Ipinsa-Okeodu area, near Akure, southwestern Nigeria, using GODT. J. Environ. Earth Sci. 6, 9–18.
Aizebeokhai, A. P. (2010). 2D and 3D geoelectrical resistivity imaging theory and field design. Sci. Res. Essays 5, 3592–3605. doi: 10.5897/IJPS2013.4017
Aizebeokhai, A. P., and Oyebanjo, O. A. (2013). Application of vertical electrical soundings to characterize aquifer potential in Ota, southwestern Nigeria. Int. J. Phys. Sci. 8, 2077–2085.
Aizebeokhai, A. P., Oyeyemi, K. D., and Joel, E. S. (2016). Groundwater potential assessment in a sedimentary terrain, southwestern Nigeria. Arab. J. Geosci. 9, 496. doi: 10.1007/s12517-016-2524-5
Aizebeokhai, A. P., Oyeyemi, K. D., Noiki, F. R., Etete, B. I., Arere, A. U. E., Eyo, U. J., et al. (2017). Geoelectrical resistivity data sets for subsurface characterisation and aquifer delineation in Iyesi, southwestern Nigeria. Data Brief 15, 828–832. doi: 10.1016/j.dib.2017.10.057
Akinrinade, O. J., and Adesina, R. B. (2016). Hydrogeophysical investigation of groundwater potential and aquifer vulnerability prediction in Basement complex terrain – a case study from Akure, southwestern Nigeria. RMZ-M G 63, 55–66. doi: 10.1515/rmzmag-2016-0005
Akintorinwa, O. J., and Olowolafe, T. S. (2013). Geoelectric evaluation of groundwater prospect within Zion estate, Akure, Southwestern, Nigeria. Int. J. Water Resour. Environ. Eng. 5, 12–28. doi: 10.4236/gep.2017.53017
Ako, B. D. (1979). Geophysical Prospecting for Groundwater in Parts of Southwestern Nigeria. Unpublished Ph.D. thesis, O.A.U. Ife.
Anomohanran, O., Ofomola, M. O., and Okocha, F. O. (2017). Investigation of groundwater in parts of Ndokwa district in Nigeria using geophysical logging and electrical resistivity methods: implications for groundwater exploration. J. Afr. Earth Sci. 129, 108–116. doi: 10.1016/j.jafrearsci.2016.12.008
Asiwaju-Bello, Y. A., Olabode, F. O., Duvbiama, O. A., Iyamu, J. O., Adeyemo, A. A., and Onigbinde, M. T. (2013). Hydrochemical evaluation of groundwater in Akure area, south-western Nigeria, for irrigation purpose. Eur. Int. J. Sci. Technol. 2, 235–249.
Badejo, A. A., Ndambuki, J. M., Kupolati, W. K., Adekunle, A. A., Taiwo, S. A., and Omole, D. O. (2015). Appraisal of access to safe drinking water in Southwest Nigeria. Afr. J. Sci. Technol. Innov. Dev. 7, 441–445. doi: 10.1080/20421338.2015.1096669
Bayewu, O. O., Oloruntola, M. O., Mosuro, G. O., Laniyan, T. A., Ariyo, S. O., and Fatoba, J. O. (2017). Geophysical evaluation of groundwater potential in part of southwestern basement complex terrain of Nigeria. Appl. Water Sci. 7, 4615–4632. doi: 10.1007/s13201-017-0623-4
Bayewu, O. O., Oloruntola, M. O., Mosuro, G. O., and Watabuni, F. G. (2012). Groundwater exploration in Ago-Iwoye area of southwestern Nigeria, using very low frequency electromagnetic (VLF-EM) and electrical resistivity methods. Int. J. Appl. Sci. Eng. Res. 1, 452–462. doi: 10.6088/ijaser.0020101046
Callahan, K., Bolton, B., Hopkins, D. R., Ruiz-Tiben, E., Withers, P. C., and Meagley, K. (2013). Contributions of the guinea worm disease eradication campaign towards achievement of the millennium development goals. PLoS Neglected Trop. Dis. 7, doi: 10.1371/journal.pntd.0002160
Ekine, A. E., and Oku, V. (2008). Geoelectric investigation for the delineation of aquiferous zones in a basement complex area, Akure South Local Government Area, Akure, Nigeria. Nigerian J. Phys. 20, 45–51. doi: 10.4314/njphy.v20i2.45986
Emenike, C. P., Tenebe, I. T., Omole, D. O., Igene, B. U., Oniemayin, B. I., Omeje, M., et al. (2017). Accessing safe drinking water in sub-saharan africa: issues and challenges in South-West Nigeria. Sustain. Cities Soc. 30, 263–272. doi: 10.1016/j.scs.2017.01.005
Hago, A. H. (2000). Application of Electrical Resistivity Method in Quantitative Assessment of Groundwater Reserve of Unconfined Aquifer. Unpublished, M.Sc. thesis, University Putra Malaysia.
Hutchinson, P. J., and Barta, L. S. (2002). VLF surveying to delineate longwall mine induced fractures. Leading Edge 21, 491–493. doi: 10.1190/1.1481250
Joel, E. S., Olasehinde, P. I., De, D. K., Omeje, M., and Adewoyin, O. O. (2016). Estimation of aquifer transmissivity from geo-physical data. A case study of Covennat University and environs, Southwestern Nigeria. Sci. Int. 28, 3379–3385.
King, P. L., White, A. J. R., Chappell, B. W., and Allen, C. M. (1997). Characterization and origin of aluminous A-type granites from the Lachlan fold, Southwestern Australia. J. Petrol. 38, 371–391. doi: 10.1093/petroj/38.3.371
Koefoed, O. (1979). Geosounding Principles. I. Resistivity Sounding Measurements. Amsterdam: Elsevier Scientific Publishing.
Loke, M. H. (1997). Electrical Imaging Surveys for Environmental and Engineering Studies (a Practical Guide to 2-D and 3-D Surveys). Unpublished report University Putra Malaysia.
Loke, M. H., Chambers, J. E., Rucker, D. F., Kuras, O., and Wilkinson, P. B. (2013). Recent developments in the direct-current geoelectrical imaging method. J. Appl. Geophys. 95, 135–156. doi: 10.1016/j.jappgeo.2013.02.017
MacDonald, A. M., and Davies, J. (2000). A Brief Review of Groundwater for Rural Water Supply in Sub-Saharan Africa. B.G.S. Technical Report, Department for International Development, British Geological Survey, UK.
McNeill, J. D., and Labson, V. F. (1991). “Geological mapping using VLF radiofields,” in Geotechnical and Environmental Geophysics, Vol. 1. Review and Tutorial, Society of Exploration Geophysicists, ed M. N. Nabighian (Tulsa, OK: Society of Exploration Geophysics), 191–218.
Meena, A. K. (2011). Exploration of Ground Water Using Electrical Resistivity Method. B.Tech. thesis, National Institute of Technology (Deemed University), Rourkela.
Mohamaden, M. I. I., and Ehab, D. (2017). Application of electrical resistivity for groundwater exploration in Wadi Rahaba, Shalateen, Egypt. NRIAG J. Astro. Geophys. 6, 201–209. doi: 10.1016/j.nrjag.2017.01.001
Mohammed, M. Z., Ogunribido, T. H. T., and Funmilayo, A. T. (2012). Electrical resistivity sounding for subsurface delineation and evaluation of groundwater potential of Araromi Akungba-Akoka Ondo state southwestern Nigeria. J. Environ. Earth Sci. 2, 29–40.
Muchingami, I., Hlatywayo, D. J., Nel, J. M., and Chuma, C. (2012). Electrical resistivity survey for groundwater investigations and shallow subsurface evaluation of the Basaltic-Greenstone formation of the urban bulawayo aquifer. Phys. Chem. Earth 50–52, 44–51. doi: 10.1016/j.pce.2012.08.014
NagaGouda, B. V., Lakkundi, T. K., Ugarkar, A. G., and Puranik, S. C. (2012). Geo-electrical approach for groundwater prospecting in Deccan Trap terrain around Mudalgi Village, Gokak Taluk, Belgaum District, Karnataka. Int. J. Earth Sci. Eng. 5, 457–462.
Nwankwo, L. I. (2011). 2D resistivity survey for groundwater exploration in a hard rock terrain: a case study of MAGDAS observatory, UNILORIN, Nigeria. Asian J. Earth Sci. 4, 46–53. doi: 10.3923/ajes.2011.46.53
Obaje, N. G. (2015). “Geology and Mineral Resources of Nigeria,” in Lecture notes in Earth Sciences 120, eds S. B Brooklyn, H. J. N. Bonn, J. R. Gottingen, and K. S Graz (New York, Ny: Springer), 221.
Obiabunmo, O. C., Umego, M. N., Obiekezie, T. N., and Chinwuko, A. I. (2014). Application of electrical resistivity method for groundwater exploration in Oba and environs, Anambra state, Nigeria. Adv. Phys. Theor. Appl. 37, 19–29.
Ogunrayi, O. A., Akinseye, F. M., Goldberg, V., and Bernhofer, C. (2016). Desriptive analysis of rainfall and temperarure trends over Akure, Nigeria. J. Geogr. Reg. Plann. 9, 195–202. doi: 10.5897/JGRP2016.0583
Oladejo, O. P., Sunmonu, L. A., and Adagunodo, T. A. (2015). Groundwater prospect in a typical precambrian basement complex using Karous-Hjelt and fraser filtering Techniques. J. Ind. Eng. Res. 1, 40–49.
Oladejo, O. P., Sunmonu, L. A., Ojoawo, A., Adagunodo, T. A., and Olafisoye, E. R. (2013). Geophysical investigation for groundwater development at Oyo state housing estate Ogbomosho, southwestern Nigeria. Res. J. Appl. Sci. Eng. Technol. 5, 1811–1815. doi: 10.19026/rjaset.5.4943
Olafisoye, E. R., Sunmonu, L. A., Ojoawo, A., Adagunodo, T. A., and Oladejo, O. P. (2012). Application of very low frequency electromagnetic and hydro-physicochemical methods in the investigation of groundwater contamination at Aarada waste disposal site, Ogbomoso, Southwestern Nigeria. Aust. J. Basic Appl. Sci. 6, 401–409.
Olayinka, A. I., Amidu, S. A., and Oladunjoye, M. A. (2004). Use of electromagnetic profiling and resistivity sounding for groundwaterexploration in the crystalline basement area of Igbeti, southwestern Nigeria. Global J. Geol. Sci. 2, 243–253. doi: 10.4314/gjgs.v2i2.18701
Olorunfemi, M. O., Fatoba, J. O., and Ademilua, L. O. (2005). Integrated VLF-electromagnetic and electrical resistivity survey for groundwater in a crystalline basement complex terrain of southwest Nigeria. Global J. Geol. Sci. 3, 71–80. doi: 10.4314/gjgs.v3i1.18714
Oyeyemi, K. D., Aizebeokhai, A. P., Adagunodo, T. A., Olofinnade, O. M., Sanuade, O. A., and Olaojo, A. A. (2017). Subsoil characterization using geoelectrical and geotechnical investigations: implications for foundation studies. Int. J. Civil Eng. Technol. 8, 302–314.
Patra, H. P., and Nath, S. K. (1999). Schlumberger Geoelectric Sounding in Groundwater (Principle, Interpretation and Application. Rotterdam: A A Balkema Publisher.
Riss, J., Fernandez-Martinez, J. L., Sirieix, C., Harmouzi, O., Marache, A., and and Essahlaoui, A. (2011). A methodology for converting traditional vertical electrical soundings into 2D resistivity models: applications to the Saiss Basin, Morocco. Geophysics 76, B225–B236. doi: 10.1190/geo2010-0080.1
Shendi, E. H., and Elrayes, A. E. (1992). Geophysical prospecting for groundwater in Wadi Sibaiya-Wadi El Sheikh area, South Sinai. M.E.R.C. Ain Shams Univ. Earth Sci. Ser. 6, 55–61.
Sultan, S. A., Essa, K. S. A., Khalil, M. H., El-Nahry, A. E. H., and Galal, A. N. H. (2017). Evaluation of groundwater potentiality survey in south Ataqa-Northwestern part of Gulf of Suez by using resistivity data and site-selection modelling. NRIAG J Astro. Geophys. 6, 230–243. doi: 10.1016/j.nrjag.2017.02.002
Sundararajan, N., Nandakumar, G., Chary, M. N., Ramam, K., and Srinivas, Y. (2007). VES and VLF – an application to groundwater exploration, Khammam, India. Leading Edge 26, 708–716. doi: 10.1190/1.2748489
Sunmonu, L. A., Adagunodo, T. A., Adeniji, A. A., Oladejo, O. P., and Alagbe, O. A. (2015). Geoelectric delineation of aquifer pattern in crystalline Bedrock. Open Trans. Geosci. 2, 1–16. doi: 10.15764/GEOS.2015.01001
Sunmonu, L. A., Adagunodo, T. A., Bayowa, O. G., and Erinle, A. V. (2016). Geophysical mapping of the proposed Osun state housing estate, Olupona for subsurface competence and groundwater potential. J. Basic. Appl. Res. 2, 27–47.
Sunmonu, L. A., Adagunodo, T. A., Olafisoye, E. R., and Oladejo, O. P. (2012). The groundwater potential evaluation at industrial estate Ogbomoso, Southwestern Nigeria. RMZ Mater. Geoenviron. 59, 363–390.
Tizro, A. T., Voudouris, K., and Basami, Y. (2012). Estimation of porosity and specific yield by application of geoelectrical method – a case study in western Iran. J. Hydrol. 454–455, 160–172. doi: 10.1016/j.jhydrol.2012.06.009
United Nations (2006). The Millennium Development Goals Report (2006). United Nations Development Programme. United Nations Department of Economic and Social Affairs, New York, NY.
Keywords: basement complex terrain, groundwater exploration, geoelectrical parameters, Pre-drilling investigation, vertical electrical sounding, Nigeria
Citation: Adagunodo TA, Akinloye MK, Sunmonu LA, Aizebeokhai AP, Oyeyemi KD and Abodunrin FO (2018) Groundwater Exploration in Aaba Residential Area of Akure, Nigeria. Front. Earth Sci. 6:66. doi: 10.3389/feart.2018.00066
Received: 29 May 2017; Accepted: 14 May 2018;
Published: 06 June 2018.
Edited by:
Wouter Buytaert, Imperial College London, United KingdomReviewed by:
Ahmed M. ElKenawy, Mansoura University, EgyptHongkai Gao, Sun Yat-sen University, China
Copyright © 2018 Adagunodo, Akinloye, Sunmonu, Aizebeokhai, Oyeyemi and Abodunrin. This is an open-access article distributed under the terms of the Creative Commons Attribution License (CC BY). The use, distribution or reproduction in other forums is permitted, provided the original author(s) and the copyright owner are credited and that the original publication in this journal is cited, in accordance with accepted academic practice. No use, distribution or reproduction is permitted which does not comply with these terms.
*Correspondence: Theophilus A. Adagunodo, dGFhZGFndW5vZG9AeWFob28uY29t; dGFhZGFndW5vZG9AZ21haWwuY29t; dGhlb3BoaWx1cy5hZGFndW5vZG9AY292ZW5hbnR1bml2ZXJzaXR5LmVkdS5uZw==; bWtha2lubG95ZUBsYXV0ZWNoLmVkdS5uZw==