The Importance of Snow Sublimation on a Himalayan Glacier
 Emmy E. Stigter1*
  Maxime Litt1,2
  Jakob F. Steiner1
  Pleun N. J. Bonekamp1
  Joseph M. Shea2,3,4
  Marc F. P. Bierkens1,5
  Walter W. Immerzeel1
- 1Department of Physical Geography, Utrecht University, Utrecht, Netherlands
- 2International Centre for Integrated Mountain Development, Kathmandu, Nepal
- 3Centre for Hydrology, University of Saskatchewan, Canmore, AB, Canada
- 4University of Northern British Columbia, Prince George, BC, Canada
- 5Deltares, Utrecht, Netherlands
Snow sublimation is a loss of water from the snowpack to the atmosphere. So far, snow sublimation has remained unquantified in the Himalaya, prohibiting a full understanding of the water balance and glacier mass balance. Hence, we measured surface latent heat fluxes with an eddy covariance system on Yala Glacier (5,350 m a.s.l) in the Nepalese Himalaya to quantify the role snow sublimation plays in the water and glacier mass budget. Observations reveal that cumulative sublimation is 32 mm for a 32-day period from October to November 2016, which is high compared to observations in other regions in the world. Multiple turbulent flux parameterizations were subsequently tested against this observed sublimation. The bulk-aerodynamic method offered the best performance, and we subsequently used this method to estimate cumulative sublimation and evaporation at the location of the eddy covariance system for the 2016–2017 winter season, which is 125 and 9 mm respectively. This is equivalent to 21% of the annual snowfall. In addition, the spatial variation of total daily sublimation over Yala Glacier was simulated with the bulk-aerodynamic method for a humid and non-humid day. Required spatial fields of meteorological variables were obtained from high-resolution WRF simulations of the region in combination with field observations. The cumulative daily sublimation at the location of the eddy covariance system equals the simulated sublimation averaged over the entire glacier. Therefore, this location appears to be representative for Yala Glacier sublimation. The spatial distribution of sublimation is primarily controlled by wind speed. Close to the ridge of Yala Glacier cumulative daily sublimation is a factor 1.7 higher than at the location of the eddy covariance system, whereas it is a factor 0.8 lower at the snout of the glacier. This illustrates that the fraction of snowfall returned to the atmosphere may be much higher than 21% at wind-exposed locations. This is a considerable loss of water and illustrates the importance and need to account for sublimation in future hydrological and mass balance studies in the Himalaya.
Introduction
Snow sublimation is a loss of water from the snowpack to the atmosphere due to the direct phase transition of snow to water vapor. Sublimation can occur from a static snow surface, and is enhanced under drifting and blowing snow conditions. Several studies have shown the importance of sublimation to the water balance in the Arctic (Box and Steffen, 2001), Antarctic (Van Den Broeke, 1997), Canadian Prairies (Pomeroy and Li, 2000), and alpine areas (Wagnon et al., 2003; Strasser et al., 2008; MacDonald et al., 2009, 2010; Bernhardt et al., 2012; Gascoin et al., 2013; Marks et al., 2013; Vionnet et al., 2014; Zhou et al., 2014). Snow mass losses due to sublimation have been estimated to vary between 0.1 and 90% of total snowfall (Strasser et al., 2008; MacDonald et al., 2010; Groot Zwaaftink et al., 2013), depending on model approach, location and period of observation. For example, the sublimation due to blowing snow is also largely unknown (e.g., Brun et al., 2013), resulting in a wide variety of sublimation estimates. Based on previous research it is expected that the conditions at high altitude in the Himalaya favor sublimation, i.e., low atmospheric pressure, high wind speed and dry air (Wagnon et al., 2013). However, sublimation rates in the high-altitude Himalaya remain unquantified and the significance of sublimation to the high-altitude water balance is unknown. Consequently, quantifying high-altitude sublimation rates is essential to improve our understanding of the water balance in Himalayan catchments.
Many studies rely on simulated sublimation and lack validation with direct observations (e.g., Bowling et al., 2004; Gordon et al., 2006; MacDonald et al., 2010; Groot Zwaaftink et al., 2013). Two different methods for observing sublimation can be distinguished. The first is a gravimetric method, where the weight of a part of a snowpack is continuously monitored with a sublimation pan (Wagnon et al., 2003; Herrero and Polo, 2016). For conditions without snowmelt the decrease in weight is assigned to sublimation. However, wind-induced erosion of the snowpack also leads to reduced weight of the snowpack, which can be incorrectly interpreted as sublimation, resulting in high inaccuracies in the measurements. The second method is the eddy covariance method (e.g., Litt et al., 2015; Sexstone et al., 2016; Radić et al., 2017), which provides “direct” observations of turbulent fluxes that can be used to obtain the energy and mass exchange between the snow surface and atmosphere (Molotch et al., 2007; Reba et al., 2012). This method derives turbulent fluxes based on statistical analysis of high frequency data of the vertical wind component, air temperature and water vapor. The derived latent heat fluxes can be converted to sublimation rates using the latent heat of sublimation. Eddy covariance instrumentation is a proven methodology to quantify snow sublimation (Sexstone et al., 2016). However, this data needs extensive post-processing to derive reliable turbulent fluxes (Reba et al., 2009). The method relies on assumptions of both stationarity and homogeneity of the flow, which are violated in complex terrain and for stable boundary layers which are frequently found over snow-covered surfaces. Nevertheless, eddy covariance measurements have been successfully used to quantify snow sublimation over snow-covered surfaces in complex terrains (Reba et al., 2012; Sexstone et al., 2016) due to careful post-processing of the data.
Sublimation measurements give an estimate at the point-scale, while it has been found to vary significantly in space (e.g., Strasser et al., 2008). Turbulent fluxes have high spatial variability in complex terrain, which is mainly induced by local flow (Pohl et al., 2006; Gascoin et al., 2013; Mott et al., 2015). Parameterizations have been developed at the point-scale to quantify sublimation. These parameterizations can be used to simulate and quantify spatially distributed sublimation at regional and catchment scales when meteorological input in space is available. Simple empirical relations between sublimation and nominal meteorological variables have been developed previously (Kuchment and Gelfan, 1996; Strasser et al., 2008). However, empirical relations are often region-specific and may not be transferable between geographic regions. The more sophisticated Penman-Monteith approach combines the energy balance with mass transfer equations and is commonly used to estimate evapotranspiration and snow sublimation (Nakai et al., 1994; Mahrt and Vickers, 2005; Wimmer et al., 2009; Knowles et al., 2012). Other methods to estimate sublimation include the bulk-aerodynamic method and the aerodynamic profile method. The bulk-aerodynamic method requires measurements of meteorological variables at one measurement level and snow surface parameters, whereas the aerodynamic profile method requires measurements of meteorological variables at multiple levels. The bulk-aerodynamic method is commonly used in energy balance models to calculate turbulent fluxes between the surface and atmosphere, in which the models are forced with either meteorological distributed forecast or reanalysis data instead of point measurements. The bulk-aerodynamic method is associated with uncertainties that are related to the assumption of a logarithmic vertical wind profile and roughness lengths (Fitzpatrick et al., 2017). The assumption of a logarithmic wind profile is often violated over a snow covered surface as typically strongly stable atmospheric conditions, such as katabatic flow, suppress turbulent fluxes. Stability corrections are often applied to account for this (e.g., Radić et al., 2017; Schlögl et al., 2017). Many stability corrections have been developed, but the Monin-Obukhov length L is commonly applied to account for changing stability (Fitzpatrick et al., 2017; Radić et al., 2017; Schlögl et al., 2017). Though, the Monin-Obukhov similarity theory assumes a stationary, horizontally homogenous flow and constant flux layer. These assumptions are often violated in complex terrain and over snow cover, which makes application of the bulk-aerodynamic method challenging on glaciers in complex terrain.
In this study eddy covariance observations were collected above the surface of a snow-covered glacier in Nepal at an altitude of 5,350 m above sea level (a.s.l) for a 32-day period in October-November 2016. Three parameterizations are compared to these measurements. The best performing parameterization is used to derive sublimation at the location of the eddy covariance system for the winter season 2016–2017. In addition, daily sublimation is estimated over Yala Glacier for two characteristic days, i.e., a humid and non-humid day, using a series of meteorological stations and high-resolution meteorological fields simulated with the Weather Research and Forecasting model (WRF; Skamarock and Klemp, 2008) with the aim to assess the importance of sublimation in the high-altitude water balance and glacier mass balance.
Study Area
This study was conducted on Yala Glacier (Figure 1), a south-southwest facing clean-ice glacier. Yala Glacier is located in the central Himalaya in Nepal in Langtang Valley, and is part of the Trishuli River system. The surface area of Yala Glacier is approximately 1.5 km2 and the elevation ranges from 5,120 to 5,615 m a.s.l. Baral et al. (2014) calculated a negative mass balance of −0.89 m w.e. for 2011–2012 based on observations. Over the last three decades Yala Glacier experienced a negative mass balance due to a decrease in accumulation area, a shift from snow to rainfall and accelerated glacier melt in the ablation zone as result of a warming climate (Fujita and Nuimura, 2011). The climate is characterized by monsoon precipitation in June, July, and August, and infrequent westerly storm events that bring snowfall during winter. 68 to 89% of the annual precipitation falls during the monsoon (Immerzeel et al., 2014). The elevation of the zero degree isotherm varies between approximately 6,000 and 3,500 m a.s.l. in monsoon and winter, respectively, in the Langtang catchment (Shea et al., 2015).
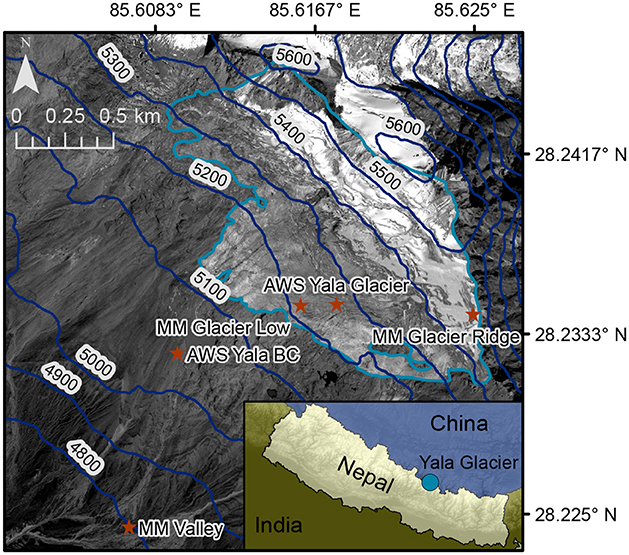
Figure 1. Study area, including the outline of Yala glacier (light blue), elevation contour lines (dark blue) and the locations of the three micro-met stations (MM), AWS Yala Glacier and AWS Yala Base Camp (stars). The inset shows the location of Yala Glacier in the central Himalaya, Nepal.
Data and Methods
Instrument and Data Description
Meteorological data were collected between October 2016 and April 2017 with several automatic weather stations (AWSs) located on or adjacent to Yala Glacier (Figures 1, 2, Table 1). AWS Yala Glacier and AWS Yala Base Camp, positioned on- and off-glacier respectively, recorded hourly shortwave and longwave radiation, air temperature, relative humidity, wind speed and wind direction. AWS Yala Base Camp also recorded atmospheric pressure. Additionally, an open-path infrared analyzer and 3-d anemometer (Campbell Scientific IRGASON) measured the 3-d wind components, sonic temperature and water vapor density (eddy covariance system) at the AWS Yala Glacier site. These measurements were recorded at 10Hz frequency in the 2016–2017 winter period, but available measurements were limited to 15 October-17 November due to a corrupt data collection card. In addition to the AWSs, three small meteorological stations were installed on- and off-glacier. These micro-met stations recorded air temperature, relative humidity, atmospheric pressure, wind speed and wind direction with a 15-min time interval. A pluviometer, located approximately 9 km south of Yala Glacier, monitored precipitation.
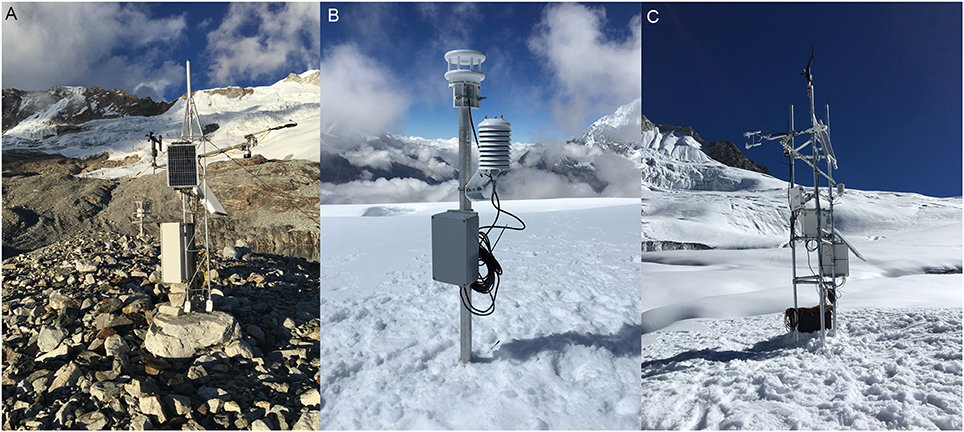
Figure 2. Pictures of (A) AWS Yala Base Camp, (B) micro-met station Yala Ridge, and (C) AWS Yala Glacier, including eddy covariance system (Photos: W. Immerzeel).
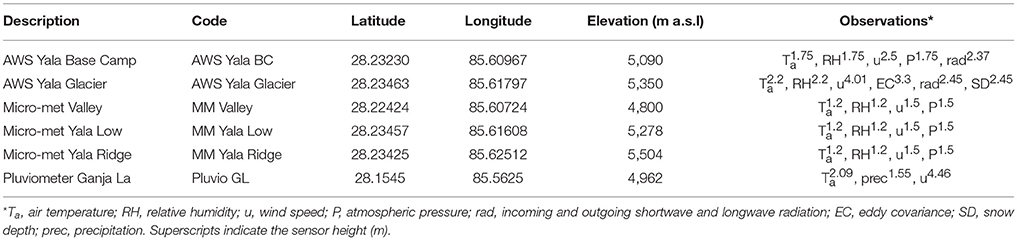
Table 1. Description of the meteorological stations.
Derivation of Sublimation Rates From Eddy Covariance Measurements
Post-processing of eddy covariance data is required to derive reliable turbulent fluxes (Reba et al., 2009). Uncertainties in the latent heat and sensible heat fluxes derived by the eddy covariance method over snow-covered surfaces have been estimated to vary between approximately 10 and 20% (Sexstone et al., 2016). In this study, post-processing was performed using the EddyPro software LI-COR (2016). This consisted of multiple steps. First, wind direction filtering was applied to exclude wind data from behind the eddy covariance system. Second, planar fit tilt ratioing (Wilczak et al., 2001), density correction (Webb et al., 1980), spike/count removal (Vickers and Mahrt, 1997), correction of low-pass filtering effects (Massman, 2000) and detrending using block averaging were applied to the data. Then, the quality of the data was checked based on criteria defined by Mauder and Foken (2004). These criteria test the assumption of stationarity, classifying data as high-quality, moderate-quality or low-quality data. Low-quality data (16%) were excluded from the calculation of the turbulent fluxes. A flux averaging interval of 10 min was chosen which met the stationarity criteria (Vickers and Mahrt, 1997). The 10-min turbulent fluxes were aggregated to hourly fluxes to reduce flux sampling errors (Vickers and Mahrt, 1997). Finally, the hourly latent heat fluxes were converted to sublimation or evaporation using the latent heat of sublimation or latent heat of evaporation, respectively. The division between sublimation and evaporation was based on the surface temperature. It is assumed that sublimation occurs when the surface temperature is below 0°C, whereas evaporation occurs when the surface temperature equals 0°C. In addition, it is assumed that all sublimation and evaporation originates from a static surface. After installation of the eddy covariance system some snowmelt occurred in the afternoon, resulting in a compacted snow surface and unlikely conditions for blowing snow events.
Data gaps were not filled as the amount of missing data in the 1-month time series was limited (2.5%). In addition, the few data gaps only occur during precipitation events when snow sublimation is assumed to be insignificant due to saturation of the air with water vapor.
Latent Heat Flux Parameterizations
Existing Parameterizations
Different methods are used to simulate the surface latent heat flux. Three existing parameterizations for latent heat flux were tested against the observed latent heat flux at AWS Yala Glacier. The tested parameterizations are the bulk-aerodynamic method, the Penman-Monteith equation, and an empirical relation developed by Kuchment and Gelfan (1996). These parameterizations were chosen as they have variable complexity and/or are commonly applied to calculate the surface latent heat fluxes. The energy fluxes were converted to mass fluxes using the latent heat of sublimation (2.838 MJ kg−1) or latent heat of evaporation L (2.501 MJ kg−1). Different statistical measures were calculated for the fit between hourly simulated and observed sublimation to assess the performance of the different parameterizations. These measures are bias, root mean square error, Nash-Sutcliffe efficiency and the correlation coefficient. The tested parameterizations are described below.
Kuchment and Gelfan (1996) empirical relation
The empirical relation developed by Kuchment and Gelfan (1996), and more recently adopted by Strasser et al. (2008), calculates the latent heat flux LE (W m−2) based on the wind speed u (m s−1; usually at 2 m level) and difference between the actual vapor pressure ea (hPa) at measurement level and the water vapor saturation pressure at the snow surface esurf (hPa), Equation (1):
The saturation vapor pressure esat (hPa) at the surface and at measurement level was calculated with Tetens (1930) relationship between air/surface temperature Ta/Ts (°C) and esat. The snow surface was assumed to be saturated whereas at the measurement level ea was obtained from esat and the measured relative humidity RH (–). Ts was derived from observed outgoing longwave radiation and the Stefan-Boltzmann relationship, assuming an emissivity of 1.0 (Vionnet et al., 2012).
Penman-Monteith equation
The Penman-Monteith equation is commonly used to calculate evapotranspiration, but several studies have also applied this equation to estimate sublimation (Nakai et al., 1994; Mahrt and Vickers, 2005; Wimmer et al., 2009; Knowles et al., 2012). Equation 2 gives the Penman-Monteith equation:
Where Δ (kPa °C−1) is the gradient of the saturation vapor pressure curve, Rn (MJ) is the net radiation, G (MJ) is the ground heat flux, ρa (kg m−3) is the air density, cp (MJ kg−1) is the specific heat of dry air at constant pressure, γ (kPa °C−1) is the psychometric constant, and ra and rs (s m−1) are the aerodynamic and surface resistance respectively. Mahrt and Vickers (2005) showed that G plays a minor role in explaining the variance in observed sublimation over a snow-covered surface. Therefore, G is assumed to be zero. rs is also set to zero as the sublimation is calculated over a snow surface and there is no resistance imposed by leaf stomata. ra was set to 400 s m−1 and this value is discussed in section Performance of the Parameterizations.
Bulk-aerodynamic method
Previous comparisons of eddy covariance observed latent heat flux over snow covered surfaces with different parameterizations show that the bulk-aerodynamic method performs well (Reba et al., 2012; Sexstone et al., 2016). The bulk-aerodynamic method as adopted by Litt et al. (2015) was used here to estimate the turbulent fluxes. It consists of a set of four Equations (3–6) that solve the Monin-Obukhov length L* (m) with an iterative process:
Where H (W m−2) is the sensible heat flux, u* (m s−1) is the friction velocity, k (0.4) is the von Karman constant, Tv (K) is the virtual air temperature, zv, zt and zq (m) are the wind speed, temperature and humidity measurement levels respectively, qs and qa (kg kg−1) are the specific humidity at the snow surface and measurement level respectively, and were calculated with observed temperature and relative humidity. z0, zt0, zq0 (m) are the roughness lengths for momentum, sensible heat and humidity respectively. zt0 and zq0 are typically one or two orders of magnitude smaller than z0 (Smeets et al., 1998; Cullen et al., 2007; Radić et al., 2017). The roughness lengths were used to optimize the fit between modeled and observed latent heat fluxes. zt and zq were forced to be one order of magnitude smaller than z0 in the optimization procedure. After optimization, by minimizing the root mean square error between simulated and observed sublimation, z0, zt, and zq were 0.013m, 0.0013m and 0.0013m respectively. ψm, ψh, and ψq are stability corrections for momentum, heat and vapor transfer respectively. These stability corrections were defined according to Paulson (1970) and Webb (1970), Equations (7–10):
If :
If 0 < :
If :
Where x is defined as .
Evaluation of Meteorological Drivers of Sublimation
Before testing the different parameterizations described above, it was first assessed which meteorological variables are “driving” sublimation on Yala Glacier. Linear regressions and multiple linear regressions were applied to the eddy covariance derived sublimation and hourly observed meteorological variables measured at AWS Yala Glacier to determine which variables have the greatest influence on sublimation rates. To investigate whether on-glacier measurements are required to predict on-glacier sublimation, linear and multiple linear regressions were also applied to hourly meteorological data measured at the off-glacier AWS Yala Base Camp. Based on these assessments a relation was derived between sublimation and meteorological observations that drive the process. The relation was evaluated using the coefficient of determination (R2) of the regressions. In addition, cross-validation was used to estimate the fit of the relation between sublimation and different meteorological variables. For the cross-validation, a single sublimation measurement was omitted before applying linear and multiple linear regressions to the data set with measurements of sublimation and meteorological variables. This procedure was repeated for all sublimation measurements.
Spatial and Seasonal Simulation of Snow Sublimation
The best performing sublimation parameterization was used to simulate the seasonal sublimation (15 October 2016–20 April 2017) at the location of the eddy covariance system. In addition, this parameterization was used to simulate the spatial distribution of sublimation over Yala Glacier for two characteristic days with low and high atmospheric humidity, i.e., 12 November 2016 and 1 January 2017, respectively. To simulate the spatial variability, distributed fields of meteorological variables are required. Surface observations and station elevations were used to estimate temperatures, which can be reliably extrapolated using observed temperature lapse rates (Immerzeel et al., 2014). Other meteorological variables were estimated using high-resolution WRF simulations for two characteristic days.
Daily temperature lapse rates were derived from linear regression through air temperature observations at the two AWSs and the three micro-met stations. Air temperature was extrapolated from AWS Yala Glacier to the entire glacier using an 8-m digital elevation model (Noh and Howat, 2015) and the derived temperature lapse rates. Consequently, the simulations of sublimation have a spatial resolution of 8 m.
The spatial distributions of wind speed, humidity and surface temperature were based on WRF simulations. Collier and Immerzeel (2015) successfully applied WRF over complex terrain and simulated the spatial distribution of precipitation in the Langtang catchment in Nepal. Rai et al. (2017) used WRF in a large-eddy-simulation-mode to simulate turbulence over complex terrain at very high spatial resolution (30 m), showing good agreement with observations. For this study WRF settings were largely based on the settings adopted by Collier and Immerzeel (2015). WRF was used in large-eddy-simulation-mode and nested in a larger domain to enable high-resolution simulations (30 m) for Yala Glacier. The WRF fields were downscaled to 8 m resolution using the cubic spline interpolation method. Details of the WRF configurations are given in the Supplementary material. It was computationally not feasible to run WRF for the entire winter period. Hence, WRF was run for two characteristic days; (i) clear sky, low atmospheric humidity and (ii) cloudy, high atmospheric humidity. The threshold for a humid or non-humid day was set to 60%. 12 November 2016 and 1 January 2017 were chosen as two representative days for a non-humid and humid day, respectively. The hourly spatial patterns for both days were then scaled with meteorological observations from the three on-glacier stations. Hourly ratios were calculated between field observations and the WRF meteorological fields at the location of the three on-glacier meteorological stations. The average ratio was used to scale the WRF meteorological fields. Surface temperature is however only measured at one location on the glacier, and spatial patterns of surface temperature were therefore scaled based on a single observation.
Results
Observed Surface Energy Balance, Meteorology and Sublimation
At AWS Yala Glacier, all radiation components and turbulent fluxes were measured from 15 October to 17 November 2016 (Figure 3). This period consists mainly of clear-sky days with a strong diurnal pattern of incoming and outgoing shortwave radiation. A diurnal pattern was also observed for the outgoing longwave radiation due to warming and cooling of the snowpack during day and night. Incoming longwave radiation is higher during the first 5 days compared to the complete time series, which is caused by the high humidity of the atmosphere. On these humid days, the latent heat flux is approximately zero, whereas the latent heat flux on dry days shows a clear diurnal cycle with a peak in the early afternoon (Figure 3). Both the sensible and latent heat fluxes are smaller than the radiation components, with daily average values of 5.5 and −31.6 W m−2 respectively. The surface energy balance is positive on every day of the time series (Figure 3).
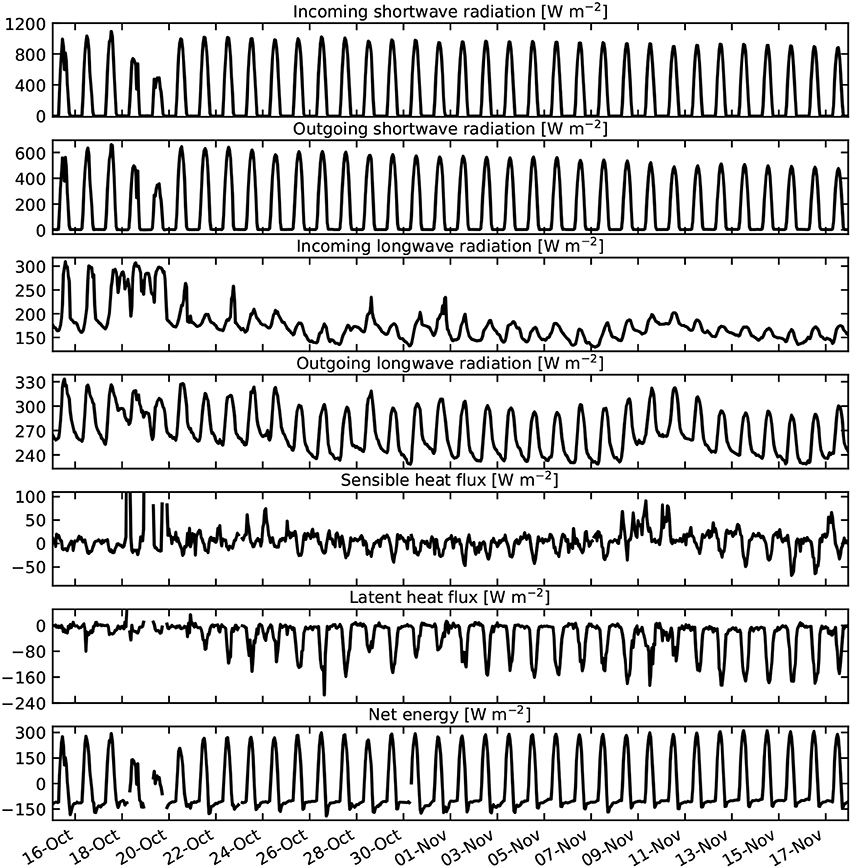
Figure 3. Time series of observed turbulent fluxes and radiation components at AWS Yala Glacier. The turbulent fluxes are positive for fluxes pointing from the atmosphere to the snow surface and negative for fluxes pointing from the surface to the atmosphere.
For the 32-day period, the observed cumulative loss of water due to sublimation is 31.6 mm, whereas deposition during the nights is negligible (1.3 mm). The sublimation rate is approximately zero on the first 5 days of the time series, whereas daily cumulative sublimation varies between approximately 1.0 and 1.5 mm day−1 on days with a clear diurnal cycle. On days with low atmospheric humidity the daily maximum sublimation rate varies between 0.1 and 0.27 mm h−1. Figure 4 shows the observed sublimation rate, wind speed and actual vapor pressure for characteristic humid and non-humid days, which illustrates that higher sublimation rates coincide with higher wind speeds and that high near surface vapor pressure constrains sublimation.
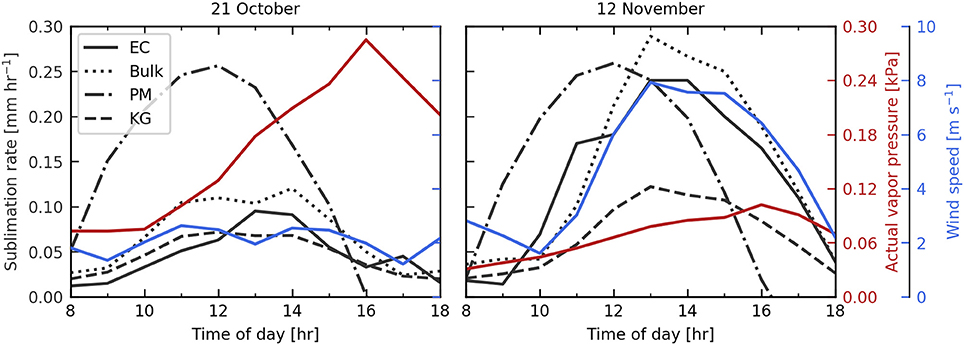
Figure 4. Observed and simulated sublimation rate (black), wind speed (blue), and actual vapor pressure (red) at AWS Yala Glacier for 21 October and 12 November 2016 with relatively low (< 1.0 mm day−1) and high sublimation rates (>1.0 mm day−1). EC refers to the eddy covariance measurements. Bulk, PM and KG refer to the simulated sublimation with the bulk-aerodynamic method, Penman-Monteith equation and Kuchment and Gelfan (1996) empirical relation, respectively.
Figure 5 shows the meteorology observed at AWS Yala Glacier for the 2016–2017 winter season. The monthly mean air temperature decreases from October to January with lowest observed temperatures (−13.8°C) in January. In spring the air temperature increases again. The monthly mean wind speeds show no considerable change throughout the winter period. The monthly mean relative humidity is lowest in November and December, whereas it is approximately 60% in October and April.
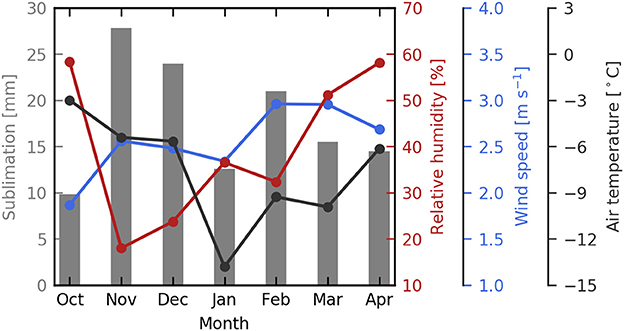
Figure 5. Monthly values of air temperature, relative humidity and wind speed observed at AWS Yala Glacier for the 2016–2017 winter season. The bars indicate the monthly cumulative sublimation simulated with the bulk-aerodynamic for 15 October 2016–20 April 2017.
Latent Heat Flux Parameterizations and the Importance of Different Meteorological Variables
To examine the influence of meteorological variables on sublimation rates we first excluded nighttime observations (when sublimation and deposition are negligible) and periods where the surface temperature equals 0°C. Air temperature and surface temperature do not show a clear relation with the sublimation rate (Figure 6). At low air temperatures the sublimation rate is almost equal to zero while for higher air temperatures the range of sublimation rates increases. This is likely related to low wind speeds coinciding with low temperatures (Figure 6). Net radiation does not show a strong relation with the sublimation rate. However, when net radiation becomes negative (late afternoon until early morning), sublimation rates are reduced. Relative humidity shows two clusters related to sublimation rate: near-saturation conditions (RH > 90%) have very low sublimation rates, but at lower values of RH there is a weakly positive relation between RH and sublimation rate. Vapor pressure deficit (D; kPa) and wind speed both show clear positive relations with sublimation rate. The vapor pressure deficit is defined as the difference between ea at measurement level and esurf.
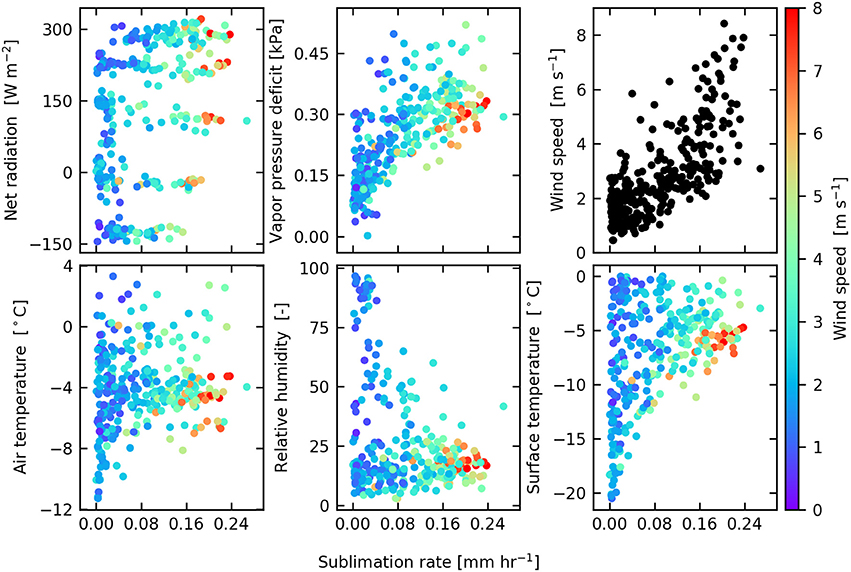
Figure 6. Scatter plots of meteorological variables against sublimation rate, observed at AWS Yala Glacier. The color of the data points refers to the observed wind speed.
Results of the linear and multiple linear regressions show that wind speed and vapor pressure deficit are the best sublimation predictors (Table 2). Linear regressions through wind speed and vapor pressure deficit explain 54 and 48% of the total variance in sublimation, respectively, based on on-glacier observations. 61 and 38% of the total variance is explained by off-glacier wind speed and vapor pressure deficit observations. In general, sublimation is better predicted by meteorological variables measured on-glacier than off-glacier, but differences are small (Table 2). The combination of wind speed, vapor pressure deficit and air temperature yields the highest coefficient of determination for the regression and cross-validation based on on-glacier meteorological data and explains 80% of the total variance in sublimation.
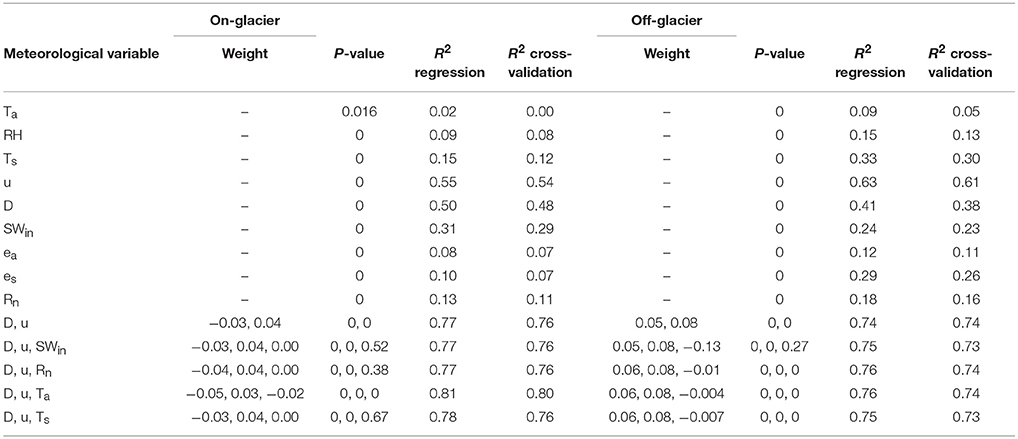
Table 2. Results of the various linear regressions and multiple linear regressions through the meteorological data and sublimation rate observed at AWS Yala Glacier (on-glacier) and AWS Yala Base Camp (off-glacier).
The three parameterizations were used to calculate sublimation at the location of the eddy covariance tower using on-glacier AWS data (Figure 7). There is considerable variation between the performance of the different parameterizations. The Penman-Monteith parameterization gives a strong diurnal cycle of sublimation for each day, but does not capture the low sublimation rates during the first days of the time series when relative humidity is high (Figure 4). In addition, the observed diurnal peak in sublimation rate for the Penman-Monteith parameterization is consistently too early. In contrast to this parameterization the empirical relation of Kuchment and Gelfan (1996) results in a correct timing of peak sublimation (Figure 4). However, sublimation is strongly underestimated (Figure 7). The bulk-aerodynamic method offers an improved estimate of sublimation, but still slightly underestimates hourly rates and sublimation totals. The calculated cumulative sublimation is 16.4, 43.0, and 28.6mm by the Kuchment and Gelfan (1996) empirical relation, Penman-Monteith parameterization and the bulk-aerodynamic method, respectively for the time period 15 October−17 November. For this period the observed cumulative sublimation is 32 mm.
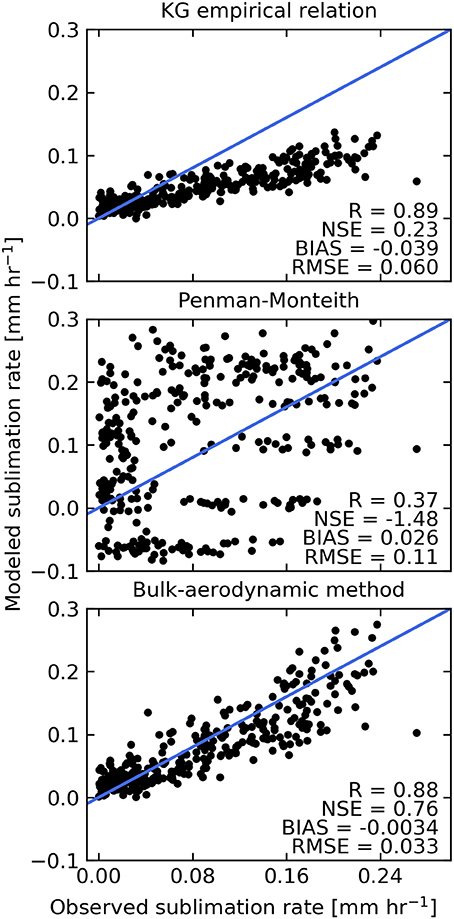
Figure 7. Scatter plots of observed and simulated sublimation for different parameterizations. R, NSE, BIAS, and RMSE refer to the correlation coefficient, Nash-Sutcliffe efficiency, bias and root mean square error, respectively.
Different statistical measures were calculated for the fit between simulated and observed sublimation to assess the performance of the different parameterizations (Figure 7). The bulk-aerodynamic method has the lowest bias (−0.0034 mm h−1), lowest root mean square error (0.033 mm h−1) and highest Nash-Sutcliffe efficiency (0.76). Therefore, this parameterization was used to simulate spatially distributed sublimation on Yala Glacier.
To study the model performance in more detail, sublimation residuals for the bulk-aerodynamic method were evaluated. The residuals show no relationship with wind speed, vapor pressure deficit and air temperature (Figure 8). However, the bulk-aerodynamic method overestimates sublimation rates in the morning, whereas it slightly underestimates sublimation in the afternoon (Figure 8).
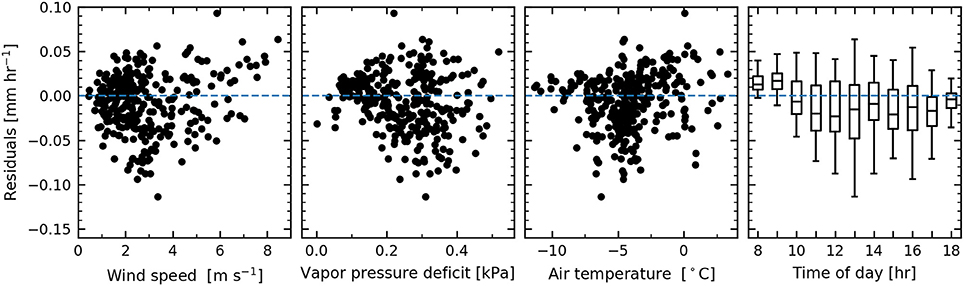
Figure 8. Sublimation residuals (observed–modeled) for the bulk-aerodynamic method against observed wind speed, vapor pressure deficit, air temperature and time of day.
Spatial Distribution of Sublimation and Seasonal Estimation of Sublimation at the Location of the Eddy Covariance System
Spatial fields of wind speed, actual vapor pressure, surface temperature and air temperature are required for the spatial simulation of sublimation. Figure 9 shows the daily average meteorological fields for the humid and non-humid day. The spatial fields for the humid and non-humid day show both highest wind speeds close to the ridge (Figure 9). On both days the wind speed increases with increasing altitude and the wind speed is relatively higher at the northeastern side of the glacier. The actual vapor pressure and surface temperature also show decreasing patterns with increasing elevations (Figure 9). The wind speed and surface temperature are lower on the humid day compared to the non-humid day, whereas the actual vapor pressure is higher. The hourly WRF fields were scaled with hourly meteorological observations at the three on-glacier stations for the sublimation simulations with the bulk-aerodynamic method. The average scaling factor for both days is 1.87 and 1.28 for the wind speed and actual vapor pressure, respectively. The surface temperature is on average corrected with −1.53°C. Simulated over the entire glacier, cumulative daily sublimation varies between 0.0 and 1.2 mm for the humid and non-humid day, with higher sublimation totals at higher elevations (Figure 9). Cumulative sublimation is highest near the ridge, where the greatest wind speeds occur.
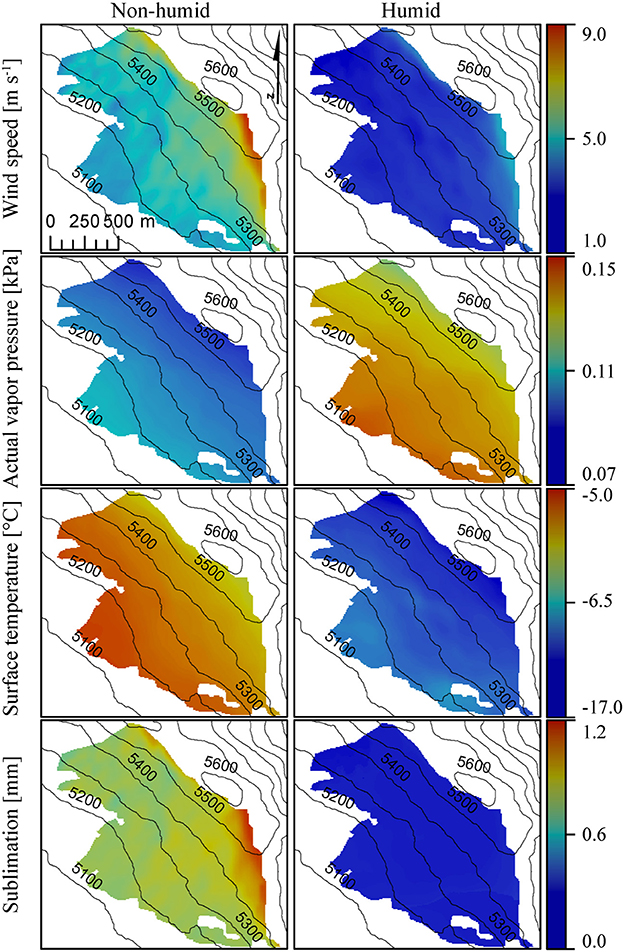
Figure 9. Daily cumulative sublimation, simulated with the bulk-aerodynamic method, and daily average WRF fields of (10 m) wind speed, (2 m) actual vapor pressure and surface temperature for a humid day (1 January 2017) and a non-humid day (12 November 2016) at Yala Glacier. The black lines represent the elevation contour lines.
The simulated cumulative sublimation and evaporation at AWS Yala Glacier are 125 and 9 mm, respectively for 15 October 2016–20 April 2017. Figure 5 shows the simulated monthly sublimation with the bulk aerodynamic method for the 2016–2017 winter season. The cumulative sublimation is highest in the months November (27.8 mm) and December (24.0 mm), whereas January has relatively low cumulative sublimation (12.6 mm). The monitored cumulative snowfall is 484 mm at pluviometer Ganja La, located 9 km south of Yala Glacier at an elevation of 4,962 m, between 1 October 2016 and 1 September 2017. The precipitation measurements were corrected for undercatch, according to Wolff et al. (2015). The snowfall at AWS Yala Glacier was derived from Ganja La precipitation and the observed air temperature at AWS Yala Glacier to distinguish between snowfall and rainfall. This method resulted in 634 mm snowfall at the location of AWS Yala Glacier. The fraction of snowfall returned to the atmosphere due to sublimation and evaporation is 21%.
Discussion
Observed Surface Energy Balance and Sublimation
The observed surface energy balance at AWS Yala Glacier is positive on each day of the time series. Theoretically, this surplus in energy would result in snowmelt. A simple calculation reveals that the surplus energy results in approximately 505 mm (w.e.) snowmelt over the measurement period. However, based on observed changes in snow surface height at AWS Yala Glacier (−0.20 m) and an assumed snow density of 350 kg m−3, the actual melt is estimated to be approximately 70 mm. This discrepancy is likely explained by pressure melting causing sinking of the tower into the ice which reduces measured surface lowering, even though we attempted to eliminate sinking by capping the ends of the tower. Assuming that sinking did not occur, the overestimation of the snow melt could potentially be explained by several other factors. In the melt estimate based on the surface energy balance it is assumed that all meltwater drains the snowpack while it may be retained and potentially refreezes within the snowpack. Melt of the refrozen meltwater requires additional energy and may explain part of the energy surplus. Other explanations can be the cold content of the snowpack and the heat flux from the snowpack into the glacier ice or vice versa, but these processes can only partly explain the energy surplus. Besides the process-based explanations, measurement errors could explain a part of the energy surplus. We observed condensation in the downward-looking radiation sensor that potentially results in underestimation of the outgoing shortwave radiation. Moreover, the derived turbulent fluxes are also uncertain and that could influence the energy balance closure as well. These uncertainties of turbulent fluxes have previously been quantified to be approximately 10- 20% over snow covered surfaces (Sexstone et al., 2016).
Sublimation rates peak in early afternoon (Figure 3), which coincides with findings of Reba et al. (2012) and Sexstone et al. (2016), and they also increase with increasing wind speed (Figure 6). Positive net radiation in the daytime results in an increase in the turbulence in the surface boundary layer (Wagnon et al., 2003), and higher sublimation rates. However, sublimation is strongly reduced on days where atmospheric humidity is high. High humidity prohibits sublimation as the atmosphere is saturated and near-surface water vapor pressure gradients are weak. On days with low atmospheric humidity, wind speeds tend to be higher. Higher wind speeds result in a well-mixed layer above the snow surface and sustained vapor pressure gradients that support sublimation. The primary driver for sublimation is the shortwave radiation and soon after the glacier is sunlit the sublimation increases, conditioned by an initial vapor pressure deficit. Once the wind speeds increase the sublimation is further enhanced and both sublimation and wind peak around 13.00 in the afternoon.
The observed average daily sublimation rate (1.0 mm day−1) and the maximum hourly sublimation rate (0.27 mm h−1) are high compared to other studies that measured sublimation with an eddy covariance system. Reba et al. (2012) observed sublimation rates ranging from 0.37 to 0.53 mm day−1 and from 0.17 to 0.28 mm day−1 for an exposed and sheltered site respectively in the Owyhee Mountains, USA. Sublimation rates of 0.05–0.23 mm day−1 were observed by Stössel et al. (2010) in the Swiss Alps. In the Sierra Nevada, Spain, maximum sublimation rates of 0.11 mm h−1 were observed (Herrero and Polo, 2016). Sexstone et al. (2016) observed a mean sublimation rate of 0.33–0.36 mm day−1 in the Colorado Rocky Mountains, USA. However, Cullen et al. (2007) observed high sublimation rates of 1.4 mm day−1 on the top of Kilimanjaro (5,794 m a.s.l), Tanzania, for a 2-day measurement campaign. Also, high sublimation rates have been observed in the Andes at high altitude. Wagnon et al. (2003) observed sublimation rates ranging between 0.7 and 1.2 mm day−1 during multiple days in the winter in 1999, 2001, and 2002 with a sublimation pan at 6,340 m a.s.l. Litt et al. (2015) observed a latent heat flux of −34 W m−2 for a 42-day period on a tropical glacier in Bolivia at 5,080 m a.s.l., which is comparable to what we observed at Yala Glacier (−31.6 W m−2). The favorable climate conditions at high altitude, i.e., low atmospheric pressure, high wind speed and low near-surface vapor pressures support the higher observed sublimation rates in our study and the studies of Cullen et al. (2007), Litt et al. (2015), and Wagnon et al. (2003).
Performance of the Parameterizations
The bulk-aerodynamic method underestimates the latent heat flux in this study (Figure 7), whereas Fitzpatrick et al. (2017) and Radić et al. (2017) showed overestimation of turbulent fluxes with the bulk-aerodynamic method, as the assumptions of the Monin-Obukhov similarity theory may be not valid for a strongly stable atmosphere during katabatic flow (Fitzpatrick et al., 2017). Radić et al. (2017) showed that a combination of a bulk-aerodynamic method with a katabatic model yielded the best results on a temperate glacier in mountain BC, Canada. However, katabatic flow occurs mainly during night on Yala Glacier, which is excluded from the analysis as sublimation is negligible. Therefore, we excluded the method of Radić et al. (2017) from our study and we assumed that the Monin-Obukhov theory is valid for our specific application. The tuned roughness values (z0 = 0.013 m, zt = 0.0013 m, and zq = 0.0013 m) are relatively high, but are within the range that has been reported in literature for snow surfaces (Brock et al., 2006; Cullen et al., 2007; Radić et al., 2017). The residuals for the bulk-aerodynamic method show no relation with meteorological variables (Figure 8), but only show a relation with the time of day. In the early morning the sublimation is overestimated, whereas in the afternoon it is underestimated. The overestimation in the morning could be explained by stable atmospheric conditions which occur in the early morning. Simulated heat fluxes with the bulk-aerodynamic method are in general sensitive to the chosen stability corrections and these corrections may lead to additional errors compared to eddy covariance observations (Schlögl et al., 2017).
The discrepancies between observed and modeled peak sublimation by the Penman-Monteith equation are explained by high-altitude conditions. This equation is driven by two terms, i.e., the net radiation and vapor pressure deficit. The net radiation typically peaks earlier than the sublimation rate, indicating that the Penman-Monteith equation is stronger driven by the net radiation than the vapor pressure deficit. This a direct result of the air density which is approximately half of the air density at this altitude compared to sea level. The air density is a factor multiplied with the vapor pressure deficit, reducing the weight of this term for calculation of sublimation. The net radiation is negative during the late afternoon, which results in deposition instead of sublimation and, therefore, we omitted these values in Figure 7. The low performance may also be partly explained by the uncertainties regarding the observed net radiation (section Observed Surface Energy Balance, Meteorology and Sublimation) as it is strongly driven by this variable. The aerodynamic resistance (ra) in the Penman-Monteith equation was used for calibration. Values of ra for sublimation of snow strongly vary in literature and relations between wind speed and ra have been used to estimate ra over a snow surface (Nakai et al., 1994; Wimmer et al., 2009; Knowles et al., 2012). However, all these relations gave no satisfactory results. Nakai et al. (1994) inversed the Penman-Monteith equation to derive ra from measured sublimation and wind speed. A similar approach was tested, but no relation was found between ra and wind speed. Finally, a constant ra of 400 s m−1 gave the best results, after minimization of the root mean square error between observed and predicted sublimation.
The Kuchment and Gelfan (1996) empirical relation strongly underestimates the sublimation, which indicates that this empirical relation is not transferrable between regions. The use of an empirical relation is often region-specific or even glacier-specific due to different climate and topographical conditions in other geographic regions and glaciers. However, linear regressions and multiple linear regressions show that sublimation at AWS Yala Glacier can be predicted with reasonable accuracy by wind speed and vapor pressure deficit (Table 2). Interestingly, off-glacier meteorological data has almost equal predicting capabilities as on-glacier data. This shows that off-glacier stations may be used to predict sublimation/latent heat fluxes on-glacier, which is valuable as AWSs are generally positioned off-glacier.
Spatial Distribution of Sublimation and Seasonal Sublimation at the Location of the Eddy Covariance System
Spatially distributed sublimation is strongly related to variations of wind speed in space (Figure 9). Close to the ridge, wind speed is typically high (Figure 9), resulting in high daily sublimation totals. This illustrates a high spatial variability of sublimation on Yala Glacier. The humid day shows lower sublimation totals than the non-humid day as high humidity leads to smaller near-surface vapor pressure gradients, resulting in lower sublimation rates. The surface temperature is lower on the humid day compared to the non-humid day (Figure 9). On high-humidity days the observed net radiation is lower than on low-humidity days, resulting in less warming of the snow surface. On high-humidity days cloud cover is often present, which reduces the incoming shortwave radiation and therefore reduces the net shortwave radiation. Although the net longwave radiation is larger on humid days, the shortwave radiation dominates the net radiation, leading to less warming of the surface and consequently colder snow surfaces on high-humidity days. This occurs regularly on Yala Glacier on the humid days and reduces near-surface vapor pressure gradients.
The sublimation totals may differ considerably when extrapolated to the whole winter season, and the quality of the sublimation estimates is largely dependent on the quality of the WRF fields (see Supplementary Material). For example, wind speeds are typically overestimated over crests using atmospheric modeling at very high resolution (e.g., Mott and Lehning, 2010; Vionnet et al., 2017). This could lead to overestimation of our sublimation totals close to the ridge. The used scaling method, in which an average scaling factor is calculated between the WRF fields and the in situ observations, does not take into account the complex and potential non-linearity of the system, which may increase the uncertainty.
The monthly cumulative sublimation shows large temporal variation (Figure 5). The monthly sublimation is highest in October and December when the relative humidity is lowest. Dry air enhances sublimation as it results in a steep near-surface vapor pressure gradient. Contrastingly, in January the monthly sublimation is relatively low when the relative humidity is also low. This is likely explained by the coldest surface temperatures in January compared to the other months. Cold surface temperatures lead to lower saturation vapor pressure at the surface, reducing the near-surface vapor pressure gradient and therefore sublimation.
The fraction of snowfall returned to the atmosphere due to sublimation and evaporation (21%) at the location of AWS Yala Glacier is substantial. The sublimation at the location of AWS Yala Glacier equals the simulated sublimation averaged over the entire glacier. This indicates that the seasonal estimates of sublimation at AWS Yala Glacier may be representative for Yala Glacier. The simulated sublimation fields show high spatial variability, where sublimation totals are approximately a factor 1.7 higher close to the ridge of Yala Glacier and a factor 0.8 smaller at the lower part of Yala Glacier compared to the location of AWS Yala Glacier. This illustrates that the fractions of snowfall returned to the atmosphere may have high spatial variability as well. It is likely that the fraction is higher at more wind-exposed locations, such as the ridge. However, the cumulative winter snowfall has uncertainties that are related to (i) undercatch of snowfall by the pluviometer, (ii) the actual snow-rain point, and (iii) spatial variability in precipitation. Collier and Immerzeel (2015) showed with WRF simulations that, at the location of the pluviometer used in this study, the snowfall is 1.5 times more than at Yala Glacier. This would indicate even higher importance of sublimation to the water balance. Even though cumulative winter snowfall is uncertain, our results show that sublimation (and evaporation) is a significant component of the water balance. Therefore, it is crucial to include this component in future hydrological and mass balance studies. Studies should be performed to estimate the importance of high-altitude sublimation at both catchment and regional scales. The bulk-aerodynamic method can for example be implemented in existing hydrological models and applied on a larger scale, either forced by WRF simulations, a meteorological monitoring network, or a combination of both.
This study quantifies only surface snow sublimation while blowing snow sublimation may also play an important role. A wide variation of blowing snow sublimation rates have been reported in literature. This variety is a result of different climate regions and blowing snow model setup (Groot Zwaaftink et al., 2013). For example, it has been reported that the sublimation of suspended particles is several factors higher than surface sublimation, as there is more ventilation and supply of dry air (Strasser et al., 2008; MacDonald et al., 2010; Vionnet et al., 2014). However, most models do not include temperature and humidity feedbacks and therefore lack the self-limiting process of blowing snow sublimation (Groot Zwaaftink et al., 2011; Vionnet et al., 2014). Simulating blowing snow sublimation is beyond the scope of this study and might have resulted in an underestimation of the sublimation in this study. Therefore, future research should focus on quantifying the occurrence of blowing snow events and corresponding sublimation rates in the Himalaya.
Conclusions
An eddy covariance experiment was conducted to measure snow sublimation on Yala Glacier at an altitude of 5,350 m a.s.l. The eddy covariance measurements show that the cumulative sublimation is 32 mm for a 32-day period. The average sublimation rate of 1.0 mm per day is relatively high and can be explained by favorable conditions at high altitude, i.e., low atmospheric pressure, high wind speed and low near-surface vapor pressures. The performance of parameterizations of different complexity (i.e., Penman-Monteith equation, bulk-aerodynamic method and an empirical relation) were tested against the measurements. The bulk-aerodynamic method outperformed the other parameterizations and was used to simulate sublimation at the location of the eddy covariance system from 15 October 2016 to 20 April 2017. The simulated cumulative sublimation and evaporation are 125 and 9 mm, respectively, which is 21% of the annual snowfall. Furthermore, the spatial variability of sublimation was simulated with the bulk-aerodynamic method for a humid and non-humid day. Required meteorological field were obtained from WRF simulations and field observations. The sublimation at the location of the eddy covariance system equals the simulated sublimation averaged over the entire glacier and is therefore representative for the seasonal sublimation on Yala Glacier. The spatial patterns of sublimation are strongly linked to the modeled wind speed patterns. The sublimation totals on the non-humid day are a factor 1.7 higher close to the ridge and a factor 0.8 lower at the lower part of Yala Glacier compared to the location of the eddy covariance system. This illustrates that the fraction of snowfall returned to the atmosphere due to sublimation may be much higher close to the ridge that is more wind-exposed. This study quantifies surface sublimation only and future research should focus on including the sublimation of blowing snow as this may increase the sublimation estimate. We conclude that sublimation is an important component of the water balance and glacier mass balance; future hydrological and mass balance studies in the Himalaya can no longer ignore this component.
Author Contributions
ES wrote the initial version of the manuscript. ML, JFS, PB, JMS, MB, and WI commented on the initial manuscript and helped improving this version. ES developed the methodology with inputs from WI, MB, and ML. ES performed the analysis with support from WI, ML, and JFS. PB performed the WRF simulations. All authors participated in fieldwork during autumn 2016 or spring 2017 or both.
Funding
This project was supported by funding from the European Research Council (ERC) under the European Union's Horizon 2020 research and innovation program (grant agreement no. 676819) and by the research programme VIDI with project number 016.161.308 financed by the Netherlands Organization for Scientific Research (NWO). This study was also supported through the core funds of the International Center for Integrated Mountain Development (ICIMOD; contributed by the governments of Afghanistan, Australia, Austria, Bangladesh, Bhutan, China, India, Myanmar, Nepal, Norway, Pakistan, Switzerland and the United Kingdom). The views and interpretations in this publication are those of the authors and are not necessarily attributable to ICIMOD.
Conflict of Interest Statement
The authors declare that the research was conducted in the absence of any commercial or financial relationships that could be construed as a potential conflict of interest.
The reviewer VV declared a shared affiliation, with no collaboration, with one of the authors, JS, to the handling editor at time of review.
Acknowledgements
We are grateful to the Norwegian Water Resources and Energy Directorate (NVE) for providing the Ganja La precipitation data. We thank the four reviewers for their constructive comments that helped improving the manuscript.
Supplementary Material
The Supplementary Material for this article can be found online at: https://www.frontiersin.org/articles/10.3389/feart.2018.00108/full#supplementary-material
References
Baral, P., Kayastha, R. B., Immerzeel, W. W., Pradhananga, N. S., Bhattarai, B. C., Shahi, S., et al. (2014). Preliminary results of mass-balance observations of yala glacier and analysis of temperature and precipitation gradients in Langtang valley, Nepal. Ann. Glaciol. 55, 9–14. doi: 10.3189/2014AoG66A106
Bernhardt, M., Schulz, K., Liston, G. E., and Zängl, G. (2012). The influence of lateral snow redistribution processes on snow melt and sublimation in alpine regions. J. Hydrol. 424–425, 196–206. doi: 10.1016/j.jhydrol.2012.01.001
Bowling, L. C., Pomeroy, J. W., and Lettenmaier, D. P. (2004). Parameterization of blowing-snow sublimation in a macroscale hydrology model. J. Hydrometeorol. 5, 745–762. doi: 10.1175/1525-7541(2004)005<0745:POBSIA>2.0.CO;2
Box, J. E., and Steffen, K. (2001). Sublimation on the Greenland ice sheet from automated station observations. J.Geophys. Res. 106, 33965–33981. doi: 10.1029/2001JD900219
Brock, B. W., Willis, I. C., and Sharp, M. J. (2006). Measurement and parameterisation of aerodynamic roughness length variations at Haut Glacier d'Arolla, Switzerland. J. Glaciol. 52, 281–297. doi: 10.3189/172756506781828746
Brun, E., Vionnet, V., Boone, A., Decharme, B., Peings, Y., Valette, R., et al. (2013). Simulation of Northern Eurasian local snow depth, mass, and density using a detailed snowpack model and meteorological reanalyses. J. Hydrometeorol. 14, 203–219. doi: 10.1175/JHM-D-12-012.1
Collier, E., and Immerzeel, W. W. (2015). High-resolution modeling of atmospheric dynamics in the Nepalese Himalaya. J. Geophys. Res. Atmos. 120, 9882–9896. doi: 10.1002/2015JD023266
Cullen, N. J., Mölg, T., Kaser, G., Steffen, K., and Hardy, D. R. (2007). Energy-balance model validation on the top of Kilimanjaro, Tanzania, using eddy covariance data. Ann. Glaciol. 46, 227–233. doi: 10.3189/172756407782871224
EddyPro software LI-COR (2016). EddyPro. Lincoln, NE: LI-COR, Inc; Infrastructure for Measurements of the European Carbon Cycle Consortium.
Fitzpatrick, N., Radić, V., and Menounos, B. (2017). Surface energy balance closure and turbulent flux parameterization on a mid-latitude mountain glacier, purcell mountains, Canada. Front. Earth Sci. 5:67. doi: 10.3389/feart.2017.00067
Fujita, K., and Nuimura, T. (2011). Spatially heterogeneous wastage of Himalayan glaciers. Proc. Natl. Acad. Sci. U.S.A. 108, 14011–14014. doi: 10.1073/pnas.1106242108
Gascoin, S., Lhermitte, S., Kinnard, C., Bortels, K., and Liston, G. E. (2013). Wind effects on snow cover in Pascua-Lama, dry andes of chile, adv. Water Resour. 55, 25–39. doi: 10.1016/j.advwatres.2012.11.013
Gordon, M., Simon, K., and Taylor, P. (2006). On snow depth predictions with the Canadian land surface scheme including a parametrization of blowing snow sublimation. Atmos. Ocean 44, 239–255. doi: 10.3137/ao.440303
Groot Zwaaftink, C. D., Löwe, H., Mott, R., Bavay, M., and Lehning, M. (2011). Drifting snow sublimation: A high-resolution 3-D model with temperature and moisture feedbacks. J. Geophys. Res. Atmos. 116, 1–14. doi: 10.1029/2011JD015754
Groot Zwaaftink, C. D., Mott, R., and Lehning, M. (2013). Seasonal simulation of drifting snow sublimation in Alpine terrain. Water Resour. Res. 49, 1581–1590. doi: 10.1002/wrcr.20137
Herrero, J., and Polo, M. J. (2016). Evaposublimation from the snow in the Mediterranean mountains of Sierra Nevada (Spain). Cryosphere 10, 2981–2998. doi: 10.5194/tc-10-2981-2016
Immerzeel, W. W., Petersen, L., Ragettli, S., and Pellicciotti, F. (2014). The importance of observed gradients of air temperature and precipitation for modeling runoff from a glacierized watershed in the Nepalese Himalaya. Water Resour. Res. 50, 2212–2226. doi: 10.1002/2013WR014506
Knowles, J. F., Blanken, P. D., Williams, M. W., and Chowanski, K. M. (2012). Energy and surface moisture seasonally limit evaporation and sublimation from snow-free alpine tundra. Agric. For. Meteorol. 157, 106–115. doi: 10.1016/j.agrformet.2012.01.017
Kuchment, L. S., and Gelfan, A. N. (1996). The determination of the snowmelt rate and the meltwater outflow from a snowpack for modelling river runoff generation. J. Hydrol. 179, 23–36. doi: 10.1016/0022-1694(95)02878-1
Litt, M., Sicart, J. E., and Helgason, W. (2015). A study of turbulent fluxes and their measurement errors for different wind regimes over the tropical Zongo Glacier (16 ° S) during the dry season. Atmos. Meas. Tech. 8, 3229–3250. doi: 10.5194/amt-8-3229-2015
MacDonald, M. K., Pomeroy, J. W., and Pietroniro, A. (2009). Parameterizing redistribution and sublimation of blowing snow for hydrological models: tests in a mountainous subarctic catchment. Hydrol. Process. 23, 2570–2583. doi: 10.1002/hyp.7356
MacDonald, M. K., Pomeroy, J. W., and Pietroniro, A. (2010). On the importance of sublimation to an alpine snow mass balance in the Canadian rocky mountains. Hydrol. Earth Syst. Sci. 14, 1401–1415. doi: 10.5194/hess-14-1401-2010
Mahrt, L., and Vickers, D. (2005). Moisture fluxes over snow with and without protruding vegetation. Q. J. R. Meteorol. Soc. 131, 1251–1270. doi: 10.1256/qj.04.66
Marks, D., Winstral, A., Reba, M., Pomeroy, J., and Kumar, M. (2013). Advances in water resources an evaluation of methods for determining during-storm precipitation phase and the rain / snow transition elevation at the surface in a mountain basin. Adv. Water Resour. 55, 98–110. doi: 10.1016/j.advwatres.2012.11.012
Massman, W. J. (2000). A simple method for estimating frequency response corrections for eddy covariance systems. Agric. For. Meteorol. 104, 185–198. doi: 10.1016/S0168-1923(00)00164-7
Mauder, M., and Foken, T. (2004). Documentation and Instruction Manual of the Eddy Covariance Software Package TK2. Bayreuth: University of Bayreuth.
Molotch, N. P., Blanken, P. D., Williams, M. W., Turnipseed, A. A., Monson, R. K., and Margulis, S. A. (2007). Estimating sublimation of intercepted and sub-canopy snow using eddy covariance systems. Hydrol. Process. 21, 1567–1575. doi: 10.1002/hyp.6719
Mott, R., Daniels, M., and Lehning, M. (2015). Atmospheric flow development and associated changes in turbulent sensible heat flux over a patchy mountain snow cover. J. Hydrometeorol. 16, 1315–1340. doi: 10.1175/JHM-D-14-0036.1
Mott, R., and Lehning, M. (2010). Meteorological modeling of very high-resolution wind fields and snow deposition for mountains. J. Hydrometeorol. 11, 934–949. doi: 10.1175/2010JHM1216.1
Nakai, Y., Sakamoto, T., Terajima, T., Kitahara, H., and Saito, T. (1994). “Snow interception by forest canopies: weighing a conifer tree, meteorological observation and analysis by the Penman-Monteith formula,” in Snow and Ice Covers: Interactions With the Atmosphere Ecosystems (IAHS Publication), 227–236. Available online at: http://ks360352.kimsufi.com/redbooks/a223/iahs_223_0227.pdf
Noh, M., and Howat, I. M. (2015). Automated stereo-photogrammetric DEM generation at high latitudes : surface extraction with tin-based search-space minimization (SETSM) validation and demonstration over glaciated regions. GISci. Remote Sens. 52, 198–217. doi: 10.1080/15481603.2015.1008621
Paulson, C. A. (1970). The mathematical representation of wind speed and temperature profiles in the unstable atmospheric surface layer. J. Appl. Meteorol. 9, 857–861. doi: 10.1175/1520-0450(1970)009<0857:TMROWS>2.0.CO;2
Pohl, S., Marsh, P., and Liston, G. E. (2006). Spatial-temporal variability in turbulent fluxes during spring snowmelt. Arctic, Antarct. Alp. Res. 38, 136–146. doi: 10.1657/1523-0430(2006)038[0136:SVITFD]2.0.CO;2
Pomeroy, J. W., and Li, L. (2000). Prairie and arctic areal snow cover mass balance using a blowing snow model. J. Geophys. Res. 105, 26619–26634. doi: 10.1029/2000JD900149
Radić, V., Menounos, B., Shea, J., Fitzpatrick, N., Tessema, M. A., and Déry, S. J. (2017). Evaluation of different methods to model near-surface turbulent fluxes for an alpine glacier in the Cariboo Mountains. B. C., Canada. Cryosphere 11, 2897–2918. doi: 10.5194/tc-11-2897-2017
Rai, R. K., Berg, L. K., Kosovic, B., Mirocha, J. D., Pekour, M. S., and Shaw, W. J. (2017). Comparison of measured and numerically simulated turbulence statistics in a convective boundary layer over complex terrain. Boundary Layer Meteorol. 163, 69–89. doi: 10.1007/s10546-016-0217-y
Reba, M. L., Link, T. E., Marks, D., and Pomeroy, J. (2009). An assessment of corrections for eddy covariance measured turbulent fluxes over snow in mountain environments. Water Resour. Res. 45, 1–15. doi: 10.1029/2008WR007045
Reba, M. L., Pomeroy, J., Marks, D., and Link, T. E. (2012). Estimating surface sublimation losses from snowpacks in a mountain catchment using eddy covariance and turbulent transfer calculations. Hydrol. Process. 26, 3699–3711. doi: 10.1002/hyp.8372
Schlögl, S., Lehning, M., Nishimura, K., Huwald, H., Cullen, N. J., and Mott, R. (2017). How do stability corrections perform in the stable boundary layer over snow? Boundary-Layer Meteorol. 165, 161–180. doi: 10.1007/s10546-017-0262-1
Sexstone, G. A., Clow, D. W., Stannard, D. I., and Fassnacht, S. R. (2016). Comparison of methods for quantifying surface sublimation over seasonally snow-covered terrain. Hydrol. Process. 30, 3373–3389. doi: 10.1002/hyp.10864
Shea, J. M., Wagnon, P., Immerzeel, W. W., Biron, R., Brun, F., and Pellicciotti, F. (2015). A comparative high-altitude meteorological analysis from three catchments in the Nepalese Himalaya. Intl. J. Water Resour. Dev. 31, 174–200. doi: 10.1080/07900627.2015.1020417
Skamarock, W. C., and Klemp, J. B. (2008). A time-split nonhydrostatic atmospheric model for weather research and forecasting applications. J. Comput. Phys. 227, 3465–3485. doi: 10.1016/j.jcp.2007.01.037
Smeets, C. J. P. P., Duynkerke, P. G., and Vugts, H. F. (1998). Turbulence characteristics of the stable boundary layer over a mid-latitude glacier. Part I: A combination of katabatic and large scale forcing conditions. Boundary-Layer Meteorol. 87, 117–145. doi: 10.1023/A:1000860406093
Stössel, F., Guala, M., Fierz, C., Manes, C., and Lehning, M. (2010). Micrometeorological and morphological observations of surface hoar dynamics on a mountain snow cover. Water Resour. Res. 46, 1–11. doi: 10.1029/2009WR008198
Strasser, U., Bernhardt, M., Weber, M., Liston, G. E., and Mauser, W. (2008). Is snow sublimation important in the alpine water balance? Cryosphere 2, 53–66. doi: 10.5194/tc-2-53-2008
Van Den Broeke, M. R. (1997). Spatial and temporal variation of sublimation on Antarctica: results of a high-resolution general circulation model. J. Geophys. Res. 102, 29765–29777. doi: 10.1029/97JD01862
Vickers, D., and Mahrt, L. (1997). Quality control and flux sampling problems for tower and aircraft data. J. Atmos. Ocean. Technol. 14, 512–526. doi: 10.1175/1520-0426(1997)014<0512:QCAFSP>2.0.CO;2
Vionnet, V., Brun, E., Morin, S., Boone, A., Faroux, S., Le Moigne, P., et al. (2012). The detailed snowpack scheme crocus and its implementation in SURFEX v7.2. Geosci. Model Dev. 5, 773–791 doi: 10.5194/gmd-5-773-2012
Vionnet, V., Martin, E., Masson, V., Guyomarch, G., Naaim-Bouvet, F., Prokop, A., et al. (2014). Simulation of wind-induced snow transport and sublimation in alpine terrain using a fully coupled snowpack/atmosphere model. Cryosphere 8, 395–415. doi: 10.5194/tc-8-395-2014
Vionnet, V., Martin, E., Masson, V., Lac, C., Naaim Bouvet, F., and Guyomarch, G. (2017). High-resolution large eddy simulation of snow accumulation in alpine terrain J. Geophys. Res. Atmos. 122, 11005–11021. doi: 10.1002/2017JD026947
Wagnon, P., Sicart, J. E., Berthier, E., and Chazarin, J. P. (2003). Wintertime high-altitude surface energy balance of a Bolivian glacier, Illimani, 6340 m above sea level. J. Geophys. Res. 108, 4177. doi: 10.1029/2002JD002088
Wagnon, P., Vincent, C., Arnaud, Y., Berthier, E., Vuillermoz, E., Gruber, S., et al. (2013). Seasonal and annual mass balances of Mera and Pokalde glaciers (Nepal Himalaya) since 2007. Cryosphere 7, 1769–1786. doi: 10.5194/tc-7-1769-2013
Webb, E. K. (1970). Profile relationships: the log-linear range, and extension to strong stability. Q. J. R. Meteorol. Soc. 96, 67–90. doi: 10.1002/qj.49709640708
Webb, E. K., Pearman, G., and Leuning, R. (1980). Correction of flux measurements for density effects due to heat and water vapour transfer. Q. J. R. Meteorol. Soc. 106, 85–100. doi: 10.1002/qj.49710644707
Wilczak, J., Oncley, S., and Stage, S. (2001). Sonic anemometer tilt correction algorithms. Boundary Layer Meteorol. 99, 127–150. doi: 10.1023/A:1018966204465
Wimmer, F., Schlaffer, S., aus der Beek, T., and Menzel, L. (2009). Distributed modelling of climate change impacts on snow sublimation in Northern Mongolia. Adv. Geosci. 21, 117–124. doi: 10.5194/adgeo-21-117-2009
Wolff, M. A., Isaksen, K., Petersen-ØVerleir, A., Ødemark, K., Reitan, T., and Brækkan, R. (2015). Derivation of a new continuous adjustment function for correcting wind-induced loss of solid precipitation: results of a Norwegian field study. Hydrol. Earth Syst. Sci. 19, 951–967. doi: 10.5194/hess-19-951-2015
Keywords: snow sublimation, eddy covariance, surface energy balance, mountain glacier, Himalaya
Citation: Stigter EE, Litt M, Steiner JF, Bonekamp PNJ, Shea JM, Bierkens MFP and Immerzeel WW (2018) The Importance of Snow Sublimation on a Himalayan Glacier. Front. Earth Sci. 6:108. doi: 10.3389/feart.2018.00108
Received: 02 February 2018; Accepted: 16 July 2018;
Published: 24 August 2018.
Edited by:
Michael Lehning, École Polytechnique Fédérale de Lausanne, SwitzerlandReviewed by:
Rebecca Mott, Institut für Meteorologie und Klimaforschung Atmosphärische Umweltforschung (IMK-IFU), GermanyEmanuel Dutra, Universidade de Lisboa, Portugal
Vincent Vionnet, University of Saskatchewan, Canada
Varun Sharma, École Polytechnique Fédérale de Lausanne, Switzerland
Copyright © 2018 Stigter, Litt, Steiner, Bonekamp, Shea, Bierkens and Immerzeel. This is an open-access article distributed under the terms of the Creative Commons Attribution License (CC BY). The use, distribution or reproduction in other forums is permitted, provided the original author(s) and the copyright owner(s) are credited and that the original publication in this journal is cited, in accordance with accepted academic practice. No use, distribution or reproduction is permitted which does not comply with these terms.
*Correspondence: Emmy E. Stigter, e.e.stigter@uu.nl