Aerosol Concentrations in Relationship to Local Atmospheric Conditions on James Ross Island, Antarctica
 Jan Kavan
 Pavla Dagsson-Waldhauserova
 Jean Baptiste Renard4
  Kamil Láska
 Klára Ambrožová
- 1Department of Geography, Faculty of Science, Masaryk University, Brno, Czechia
- 2Faculty of Agricultural and Environmental Sciences, Agricultural University of Iceland, Reykjavik, Iceland
- 3Faculty of Environmental Sciences, Czech University of Life Sciences Prague, Prague, Czechia
- 4Laboratoire de Physique et Chimie de l’Environnement et de l’Espace, CNRS, Orléans, France
Several important ice-free areas (e.g., Seymour Island, Cape Lamb on Vega Island, Terrapin Hill) are located in the Eastern Antarctic Peninsula region. The largest of these ice-free areas can be found on the Ulu Peninsula, James Ross Island, where this study was undertaken. The Ulu Peninsula covers an area of 312 km2, and has been found to be an important active High Latitude Dust source. In this study, aerosol concentrations and local wind properties are described together with their linkages and typical synoptic situations. The highest aerosol concentrations of 57 μg m-3 for PM10 were detected during high wind speed events that exceeded 10 m s-1, which is also a threshold level for activating local mineral material sources. Surface deposition of dust particles can have significant environmental impacts such as changes in properties of atmosphere or enhanced snow melting.
Introduction
Antarctica is the largest polar desert in the world, of which approximately 2% of its surface area is ice-free and contains active High Latitude Dust sources (HLD, Bullard et al., 2016). It is the coldest, windiest (maximum speed of 90 m s-1) and driest continent, with annual precipitation reaching approximately 300 mm in the coastal areas (King and Turner, 1997; van Lipzig et al., 2004). However, mean annual precipitation is greatly reduced at the dust sources in Antarctica, ranging between 3–50 mm per year (Fountain et al., 2009). One of the most important ice-free landscape shaping processes, apart fluvial activities, is aeolian transport. Aeolian processes acting in high latitudes develop a specific range of surface landforms, such as ripples or small-scale dunes. However, these landforms are spatially restricted to areas with low surface moisture contents and an absence of vegetation cover (Bullard et al., 2016). These conditions enable the mineral material to be uplifted by wind and transported for long distances. Consequently, in periglacial environments where glaciers have recently receded and left large amounts of unsortedmineral material, wind erosion processes frequently occur (Ballantyne, 2002). Wiggs et al. (2004) identified surface moisture content as the second most important critical variable influencing aeolian transport apart wind velocity.
High wind velocities are usually required to trigger wind transportation processes of large particles and grains. Antarctica is more prone to wind erosion than other areas, as a result of its prevailing strong katabatic winds (Nylen et al., 2004; Bullard et al., 2016). However, the development of large aeolian landforms in periglacial environments is limited by the presence of permafrost. The thickness of the active layer ranges between 50 and 150 cm in the Antarctic islands and maritime East Antarctica, and 15 to 50 cm in the Antarctic interior (Bockheim, 1995). As a result, there is only a limited amount of surface material available for aeolian processes. Weathering (predominantly freeze-thaw processes) plays a crucial role in preparing the surface for further exogenic processes; however, the right combination of rock temperature and moisture can cause salt, insolation, hydration, or chemical weathering to be dominant (Elliot, 2003). Hedding et al. (2015) observed the evolution of aeolian landforms (megaripples) on Marion Island, and suggested that aeolian processes are also actively modifying solifluction landforms. Ripples with a height of several decimeters were found in several localities, with the annual (horizontal) aeolian sediment flux estimated at 0.36–3.85 kg cm-2 year-1 (Hedding et al., 2015). Aeolian deposition also plays a vital role as an input vector of material to the surface of glaciers. Fortner et al. (2011) identified aeolian trace elements on the surface of Taylor Glacier as well as in its glaciofluvial system. Concentrations of these elements are often an important variable for the development of organisms in lakes and rivers. A similar study was undertaken by Šabacká et al. (2012) in Taylor Valley resulting in the identification of foehn winds as a main factor controlling the input of mineral and biotic material to the valley ecosystem. For example, Bristow et al. (2010) identified dunes in Victoria Valley that were composed mainly from coarse sand. In contrast, Arctic aeolian material sources are limited to areas located close to glaciers or floodplains, where material is freely available and is not covered by vegetation (Ballantyne, 2002), with the exception of Iceland where volcanic material input can be independent of wind speed (Dagsson-Waldhauserova et al., 2014). Bullard and Austin (2011) studied dust generation from glaciofluvial sediments in a proglacial flood plain in West Greenland. They found that wind speeds of 6 m s-1 only moved the finest sediment fractions during the summer. Furthermore, Prospero et al. (2012) identified proglacial systems as the main source of material for major dust storms from a 6-year record in Iceland.
As Antarctica is almost entirely ice covered, most of the previous studies undertaken are geographically constrained to sparse ice-free areas, such as the McMurdo Dry Valleys (e.g., Lancaster, 2002; Fortner et al., 2011; Šabacká et al., 2012) and locations in the Antarctic Peninsula (e.g., Asmi et al., 2018). The best-known local dust sources are located in West Antarctica, with the McMurdo Dry Valleys being the largest ice-free area (approximately 4,800 km2) with documented frequent dust suspension (Lancaster, 2002; Ayling and McGowan, 2006; Atkins and Dunbar, 2009; Bullard et al., 2016). Bory et al. (2010) suggested that there are dust sources in the ice-free areas of East Antarctica based on dust samples collected in snow pits on Berkner Island. Coastal ice-free areas have also been identified as active dust sources around the Maitri Station, Larsemann Hills, and Neumayer Station in East Antarctica (Weller et al., 2008; Chaubey et al., 2011; Budhavant et al., 2015), as well as in the Antarctic Peninsula region (Artaxo and Rabello, 1992; Kavan et al., 2017; Asmi et al., 2018). Alternately, aeolian material can be resuspended from the surface of glaciers where sediments that were previously incorporated into the ice re-emerge at the surface as a result of ablation (Atkins and Dunbar, 2009). Long-range transport of dust from other HLD sources, such as South America (Patagonia), New Zealand, and deserts in Australia and Africa, contribute to the dust depositions in Antarctica (Neff and Bertler, 2015; Bullard et al., 2016; Asmi et al., 2018). The main non-Antarctic dust sources for the Antarctic Peninsula region are in Patagonia - Tierra del Fuego, Provinces of Chubut (e.g., Lago Colhué Huapi), and Santa Cruz (Bullard et al., 2016). Patagonian dust sources consist of fine dust material and are extremely active, with >120 dust days per year since 2012 (Gassó and Torres, 2018, unpublished). Patagonian dust was found in ice cores and snow samples in the Antarctic Peninsula and in East Antarctica, showing the possibility of long-range transport of dust to Antarctica (Basile et al., 1997; Pereira et al., 2004; McConnell et al., 2007; Bory et al., 2010; Delmonte et al., 2017). There is a lack of research investigating long-range transport of Patagonian dust to the Antarctic as a result of sparse direct measurements of aerosols in Antarctica. However, during the measurement period of this study (January-March 2018) several dust storms occurred in Patagonia (SYNOP data from the local weather stations and MODIS satellite images obtained from Santiago Gassó, NASA).
High latitude dust sources produce at least 5% of the global dust budget (100 mil tons per year), where, for instance, dust emissions from Iceland range between 31–40 mil tons per year (Arnalds et al., 2014; Bullard et al., 2016). Measured dust deposition rates reported from the HLD sources seem to reach higher values than those from the global deserts (Hugenholtz and Wolfe, 2010; Arnalds et al., 2013; Bullard, 2013). The most extreme wind erosion event recorded on Earth was measured in Iceland in 2010 when aeolian transport of 11 t m-1 occurred during one 23-h storm (Arnalds et al., 2013). Deposition rates of >33,000 g m-2 year-1 were recorded in Canada, while rates >100 gm-2 year-1 were reported from New Zealand, Iceland, and Patagonia (Bullard, 2013; Bullard et al., 2016). Deposition rates measured in Greenland and McMurdo Dry Valleys are lower than other HLD sources with rates of <8 g m-2 year-1 (Lancaster, 2002; Bullard, 2013). Atkins and Dunbar (2009) measured dust fluxes of 7.8–24.5 g m-2 year-1 while Chewings et al. (2014) reported fluxes of 0.2–55 g m-2 year-1 in the McMurdo Dry Valleys, West Antarctica.
Direct aerosol measurements in Antarctica are sparse although Particulate Matter (PM) properties provide crucial information on the impact of particles on the climate in Antarctica. For the coastal areas in East Antarctica, the main identified particles were sea salt, sulfate, and crustal components. The mass concentrations of PM10 (particles with a diameter of <10 μm) and PM2.5 (particles with a diameter of <2.5 μm) were 5.1 and 4.3 μg m-3, respectively in the Larsemann Hills during summer (Budhavant et al., 2015), and 8.3 and 6.03 μ gm-3 at the Maitri station (Chaubey et al., 2011). PM10 concentrations from McMurdo station during two summers in 1995–1997 were 3.4 and 4.1 μg m-3 on average (Mazzera et al., 2001). Mean PM10 and PM2.5 concentrations of 4.4 μg m-3 and 2.4 μ gm-3, respectively were measured in the Antarctic Peninsula during the late 1980s (Artaxo and Rabello, 1992). Seasonal variations in aerosol loadings showed increased concentrations in January and a decrease in February and March in Terra Nova Bay, West Antarctica in 2000–2001 (Truzzi et al., 2005). PM10 concentrations of 2.1–5 μg m-3 on average were reported from the Antarctic Peninsula, with higher concentration in summer (October to March) in 2013–2015 (Asmi et al., 2018). Asmi et al. (2018) emphasized that the concentrations of sea salt and soil particles nearly doubled on average in summer when winds were high.
The main purpose of this study was to identify summer aerosols and the physical properties of PM in the north-eastern sector of the Antarctic Peninsula. The objectives were to provide mass and number concentrations of PM with a diameter of 0.2–100 μm, typology of measured aerosols, sources of measured aerosols, and compare PM concentrations with Aerosol Optical Thickness (AOT). Comparison of local wind properties with PM and AOT should identify typical synoptic situations, where aerosol concentrations are particularly high and important. This study aims to provide more evidence to suggest that Antarctica’s ice-free desert surfaces are active HLD sources providing natural air pollution.
Materials and Methods
Study Site
James Ross Island (JRI) is situated in the Weddell Sea region on the eastern side of the Antarctic Peninsula. It constitutes one of the largest ice-free areas in Antarctica (BAS, 2005) which covers an area of 552 km2, representing 1.2% of the total ice-free area of the continent. More than half of the ice-free surfaces on JRI (312 km2; 12.5% of JRI) are located on the Ulu Peninsula (Kavan et al., 2017), in close proximity to the Johann Gregor Mendel (JGM) Station, where the presented LOAC measurements were undertaken (Figure 1). This ice-free area represents one of the largest Antarctic oases after the McMurdo Dry Valleys (4900 km2) and Bunger Oasis (450 km2), exceeding the size of both Schirmacher Oasis (34 km2) and the Larsemann Hills (40 km2). Large bare surface areas produce dust during frequent dust storms (Kavan et al., 2017). The JGM Station, located on the northern shore of JRI, is exposed to prevailing S-NW winds (Zvěřina et al., 2014) which cross active bare surfaces approximately 15 km away from the station. The surface predominantly constitutes unconsolidated fine sediments in the lower parts of the terrain, and bare rock on top of the volcanic mesas which reach an elevation of approximately 300–400 m a.s.l. An important source of aeolian material is derived from the braid plains of the Bohemian Stream (<100 m from JGM) and the adjacent Algal Stream, which serve as redistribution areas of fluvial and aeolian material (Kavan et al., 2017; Kavan and Nývlt, 2018).
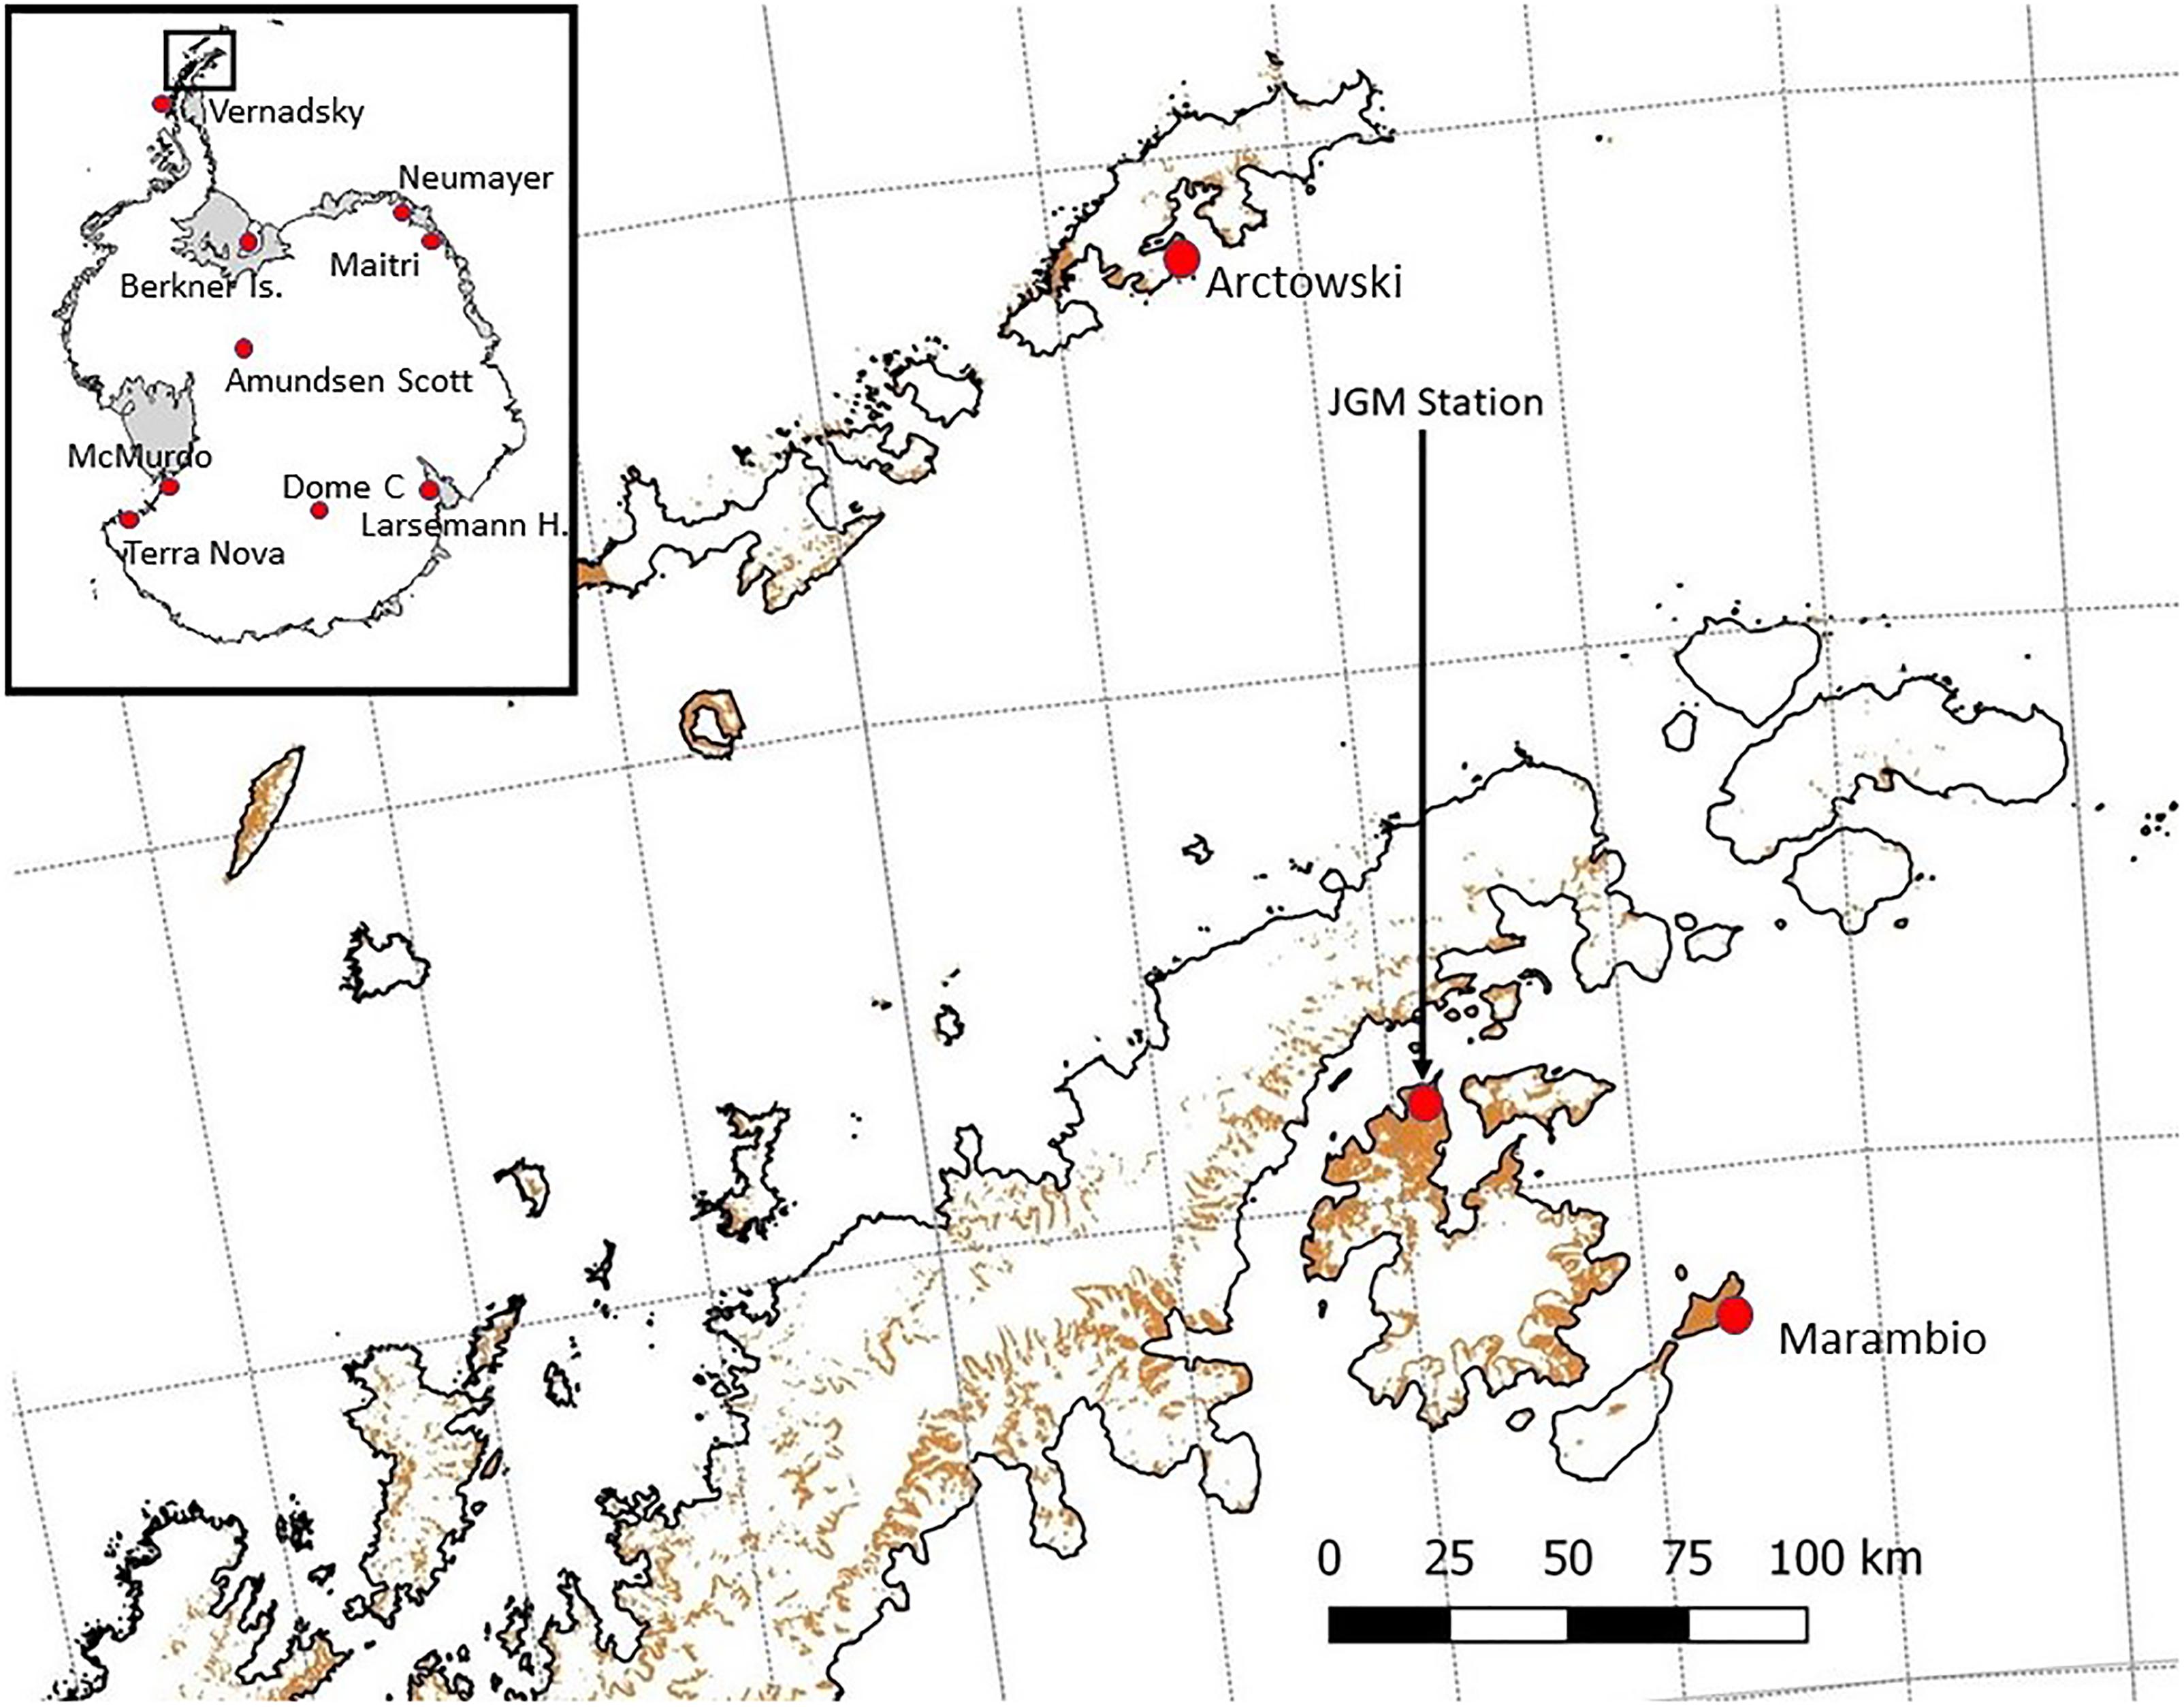
FIGURE 1. Study site location (JGM Station) and other Antarctic sites used in the text, ice free areas in brown.
The climate of JRI is affected by the regional-scale atmospheric circulation formed by the Antarctic Peninsula Mountains, which provide an effective barrier to westerly winds associated with cyclonic systems centered in the circumpolar trough (King et al., 2003). The mean annual air temperatures (2006–2015) in the northern part of JRI ranged from -7.0°C at the Johann Gregor Mendel Station (JGM) to less than -8.0°C in higher elevated areas (375 m a.s.l. on Bibby Hill) (Ambrožová and Láska, 2016; Hrbáček et al., 2018). The meteorological observations from Johnson Mesa (320 m a.s.l.) in the period 2008–2010 showed that the wind directions are mainly between southern and western sectors (Zvěřina et al., 2014). These directions correspond to the position and orography of the Antarctic Peninsula, which strongly affects the airflow along the eastern side of the peninsula, before approaching the northern coast of JRI. The summer and winter wind directions are slightly different, but they remain in the S-NW sector (Bohuslavová et al., 2018).
Wind Speed and Direction
Wind speed and direction were measured at 2 m above the ground using the USA-1 sonic anemometer (METEK GmbH, Germany) connected with the internal data system. The wind components were sampled at a frequency of 10 Hz and stored as 5-min averaged values. The mast with the USA-1 anemometer was placed 10 m southeast from the meteorological tower at the JGM Station. The temporal variability of the horizontal wind components was analyzed and visualized with the Grapher 13 software for 16 directional sectors of a wind rose.
Aerosol Optical Thickness
Aerosol Optical Thickness and water vapor measurements were obtained with the hand-held Microtops II sun photometer (referred to here as Sun photometer) manufactured by the Solar Light Inc., United States. It provides direct information on irradiance components in five spectral wave bands (340, 380, 500, 870, and 936 nm), giving automatically AOT and water vapor information. The field of view of each of the optical channels is 2.5° and the sun target assembly allows up to 0.1° pointing resolution. The Sun photometer calculates the AOT value at each wavelength based on the channel’s signal, its extra-terrestrial constant, atmospheric pressure, altitude, time, and location (Morys et al., 2001). Before the field campaign the instrument was calibrated in the laboratory of the Solar Light Company, Inc. Further information on the Microtops Sun photometer can be found in Morys et al. (2001). To avoid cloudiness influence, AOT measurements were conducted on cloud-free days with a cloud cover <30% or when the clouds were located >2.5° from the Sun disk. The instrument was set to carry out 32 rapid scan samples within one measurement, from which the average AOT was calculated and archive to the logger memory. During each measurement session, the Sun photometer was used to take a sequence of five measurements within 1 min. When possible, measurements were carried out between 11:00 and 13:00 UTC when solar zenith angles were <60°, in order to eliminate the effect of optical distortions by the atmosphere.
LOAC – Light Optical Aerosol Counter
The LOAC (Light Optical Aerosols Counter) is a light aerosol counter which is well adapted to detect dust particles, and provides size distributions as well as the main typologies of particles present The LOAC instrument uses a novel optical design to retrieve the particle number, mass concentration, size, and the typology of the particles in ambient air (Renard et al., 2016a,b). The particles get injected through an optical chamber by a pumping system and cross a laser beam, where two detectors record the scattered light. The first detector analyses the small scattering angles in the 10–15° range, where the light is scattered by irregular grains by diffraction, and is not dependent on the refractive index or the porosity (Lurton et al., 2014). A direct correlation is therefore established between the intensity of the light scattered and the optical diameter of the particles. The LOAC provides the concentration of particles for 19 size classes in the 0.2–100 μm range. The instrument was calibrated using latex and glass beads, as well as with irregular grains to better represent the solid particles that can be found in the ambient air. The second detector collects data at scattering angles that range between 50°–70°, recording scattered light that is very sensitive to the refractive index and the porosity of the particles. By combining the data from the two detectors, a “speciation index” that is representative of the ability of the particles to absorb light can be produced. Laboratory measurements were performed with reference samples, water droplets, sand, carbonaceous particles, and black carbon, to establish the speciation index of the particles. Subsequently, the speciation index retrieved is compared to these reference indices to provide the identification of the nature of the observed particles (transparent for the liquid droplets, semi-transparent for mineral/dust particles, strongly absorbent for carbonaceous and strongly porous particles). A good correlation was found between the LOAC measurements (counting and typology), other counting instruments, and satellite instruments, in particular during dust events (Renard et al., 2018).
The LOAC was operated directly in the ambient air. To take into consideration any possible changes in the electronic offset, mainly as a result of temperature variations, an automatic check was performed every 10 min. If an offset had evolved, an internal re-calibration of the instrument was undertaken.
The aerosols were collected with an omnidirectional collecting device and were subsequently injected in to the optical chamber though a vertical inlet measuring several cm in length to ensure that the collected particles will not fall out of suspension inside the instrument before crossing the laser beam. The sampling efficiency for large particles is near to 100% when the wind speed is lower than approximately 20 m s-1.
The uncertainty for the total aerosol concentration measurements is ±20% for concentration values greater than 1 particle per cm3 (for a 10-min integration time). In contrast, the uncertainty increases to approximately 60% for concentration values less than 10-2 particle per cm3. Finally, the precision in size calibration is ±0.025 μm for particles smaller than 0.6 μm, 5% for particles in the 0.7–2 μm range, and 10% for particles larger than 2 μm.
In this study, the LOAC was operated from 17 January 2018 to 21 March 2018. During this period, the LOAC encountered some strong electromagnetic perturbations; however, the data was kept where the perturbations were low so that the detection of particles was not altered by more than a few μm. The data was collected every 10 s and integrated over 5 min to reduce the dispersion of the measurements in case of low concentrations (data were integrated in a 5-min period together with the wind speed and direction data). The LOAC was temporally installed on the meteorological platform next to JGM station at the height of 3.5 m above the ground. During the study period, the power supply experienced several blackouts as a result of the electromagnetic interference created by other electric instruments in the vicinity. Therefore, post processing of the measured data resulted in an approximate data coverage of 60% the study period (compare with Figure 2).
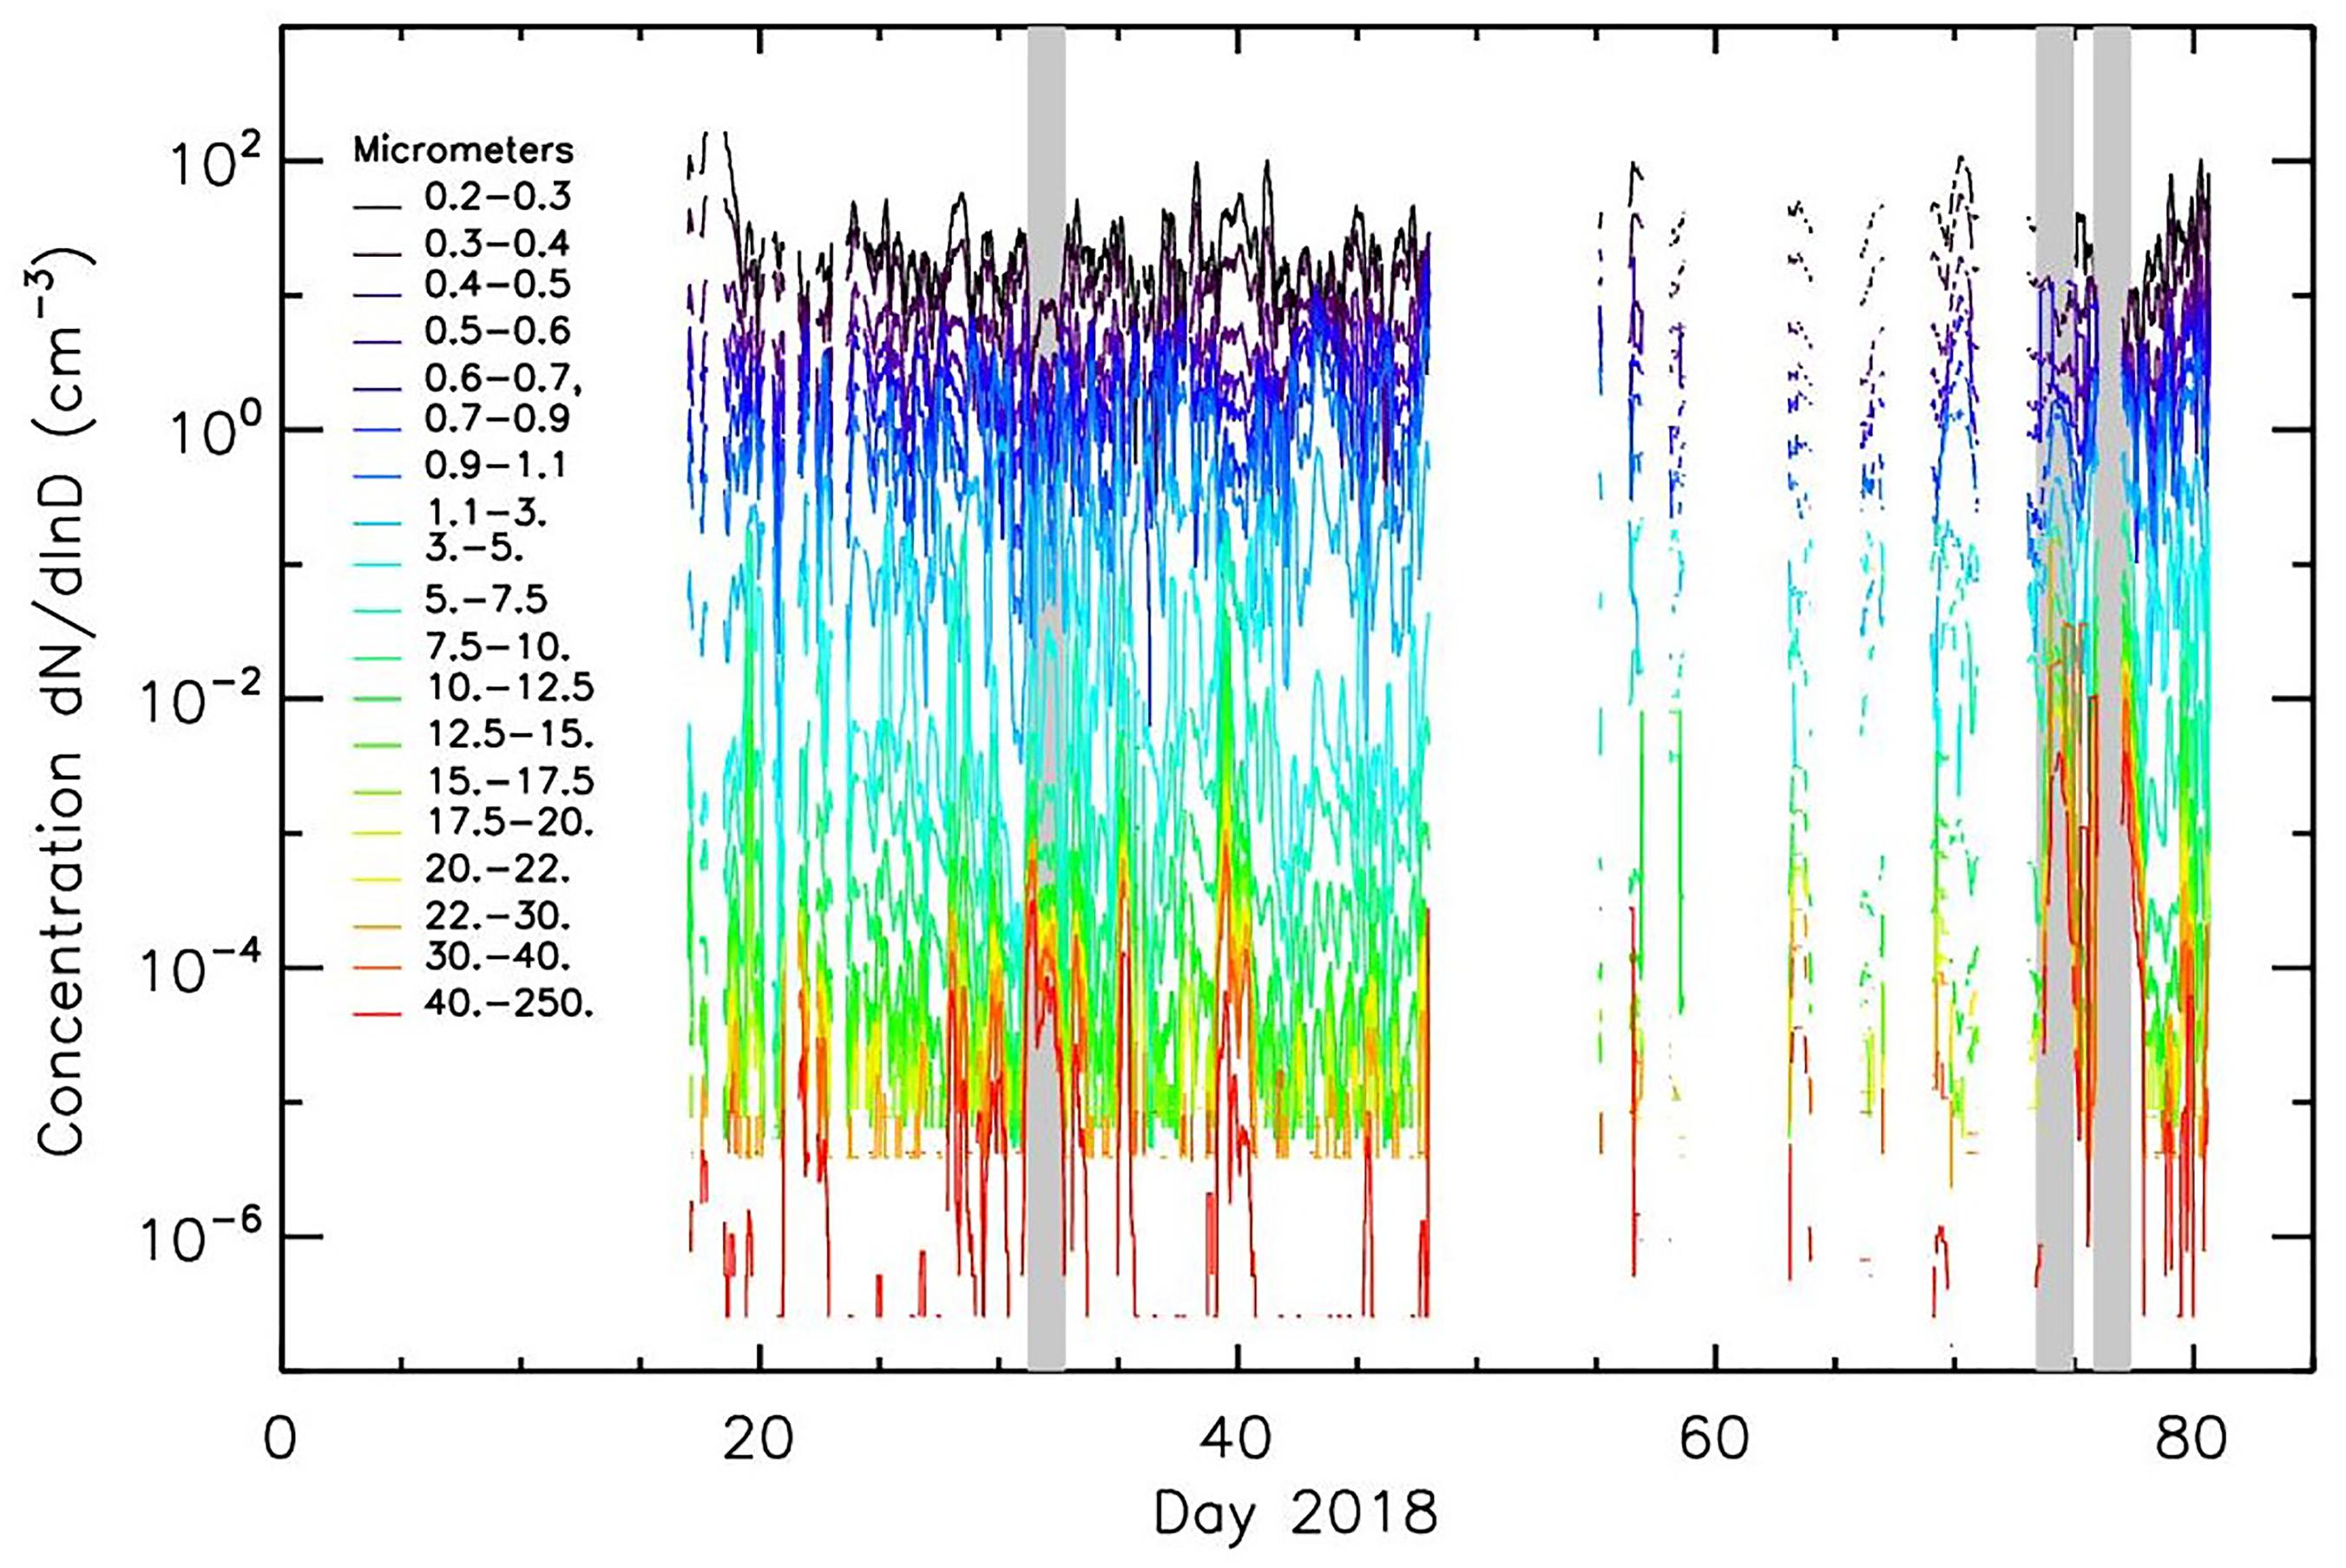
FIGURE 2. Evolution of the LOAC concentrations for the 19 size classes; the three events are indicated by gray zones.
Horizontal Aeolian Sediment Sampling
A passive horizontal aeolian sediment sampler (PHASS), based on the marble dust collector concept originally developed by Ganor (1975), was installed approximately 500 m from the LOAC site (to avoid interference with the station service activities). The PHASS was located on the ground surface to collect transported aeolian material during three periods in the 2018 summer season. The material was collected, filtered through a 3 μm filtration paper, and dried directly in the JGM Station laboratory. The dried material was weighed with the instrument precision of 0.0001 g, and the horizontal deposition was calculated.
Results
Aerosol Concentrations During the Study Period
Mean (median) mass concentrations of the PM10 were 6.4 ± 1.4 (3.9 ± 1) μg m-3, while the PM2.5 was 3.1 ± 1 (2.3 ± 0.9) μg m-3 for the whole measurement period in January-March 2018. The median values are representative of the mass concertation outside the dust episodes. These results are similar to those recorded for the Larsemann Hills (Budhavant et al., 2015); however, they are lower than reported from the Maitri station (Chaubey et al., 2011). Mean values from JRI are higher than those from McMurdo station in 1995–1997 (Mazzera et al., 2001), the Antarctic Peninsula in late 1980s (Artaxo and Rabello, 1992), as well as from Marambio station in the Antarctic Peninsula in 2013–2015 (Asmi et al., 2018). A mean PM10 value of 6.4 μg m-3 from the Antarctic Peninsula is also comparable to two stations in Norway (annual mean of 7.5 μg m-3), but higher than the annual mean of 4.4 μg m-3 in Sevettijarvi, Finland (Putaud et al., 2010). The mean PM2.5 value in Antarctica is, however, lower than stations in Northern Europe.
The mean particle number concentrations were low, while the submicron particles were typically ten to hundred times lower during the clean conditions than during dust pollution events. Over 15 high-dust episodes, particles greater than 10 μm (PM10 > 20 μg m-3) were detected (Figure 3), with concentrations similar to moderate Saharan dust events above the Mediterranean Sea (Renard et al., 2018). However, in contrast to the Mediterranean Sea region, the concentrations of submicron particles did not significantly increase during the dust events in Antarctica.
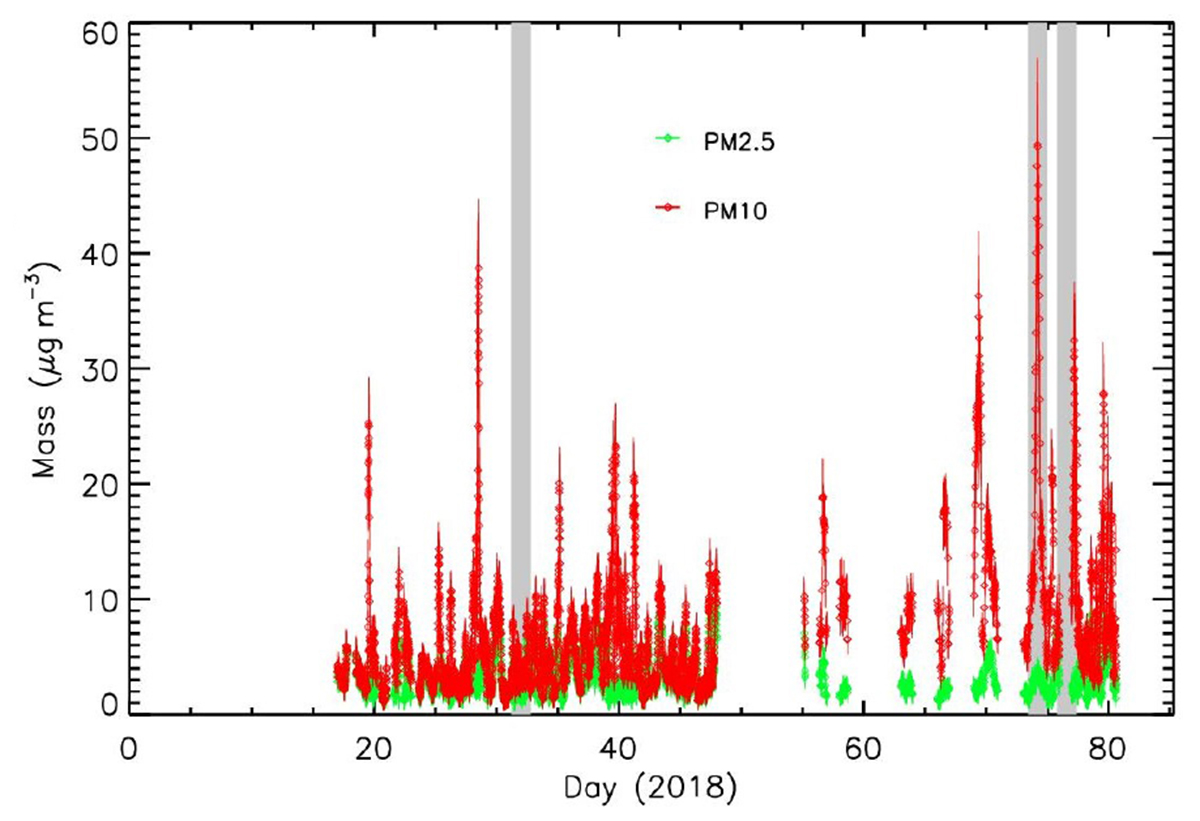
FIGURE 3. Evolution of the PM2.5 and PM10 masses; the three events are indicated by gray zones.
In the present study, we will focus on strong dust event recorded by LOAC in the 31 January – 2 February 2018, 14–16 March 2018 and the 18 March 2018. The dust events were characterized by strong concentration enhancements of particles larger than 10 μm (up to a thousand times greater than the background values). The LOAC typology indicates that the particles are indeed dust, with mean optical absorbing properties between “semi-transparent” and “absorbent,” typical of dark mineral. Nevertheless, some liquid particles are present, with average concentrations in the order of 10–20% for sizes below 20 μm (Figure 4).
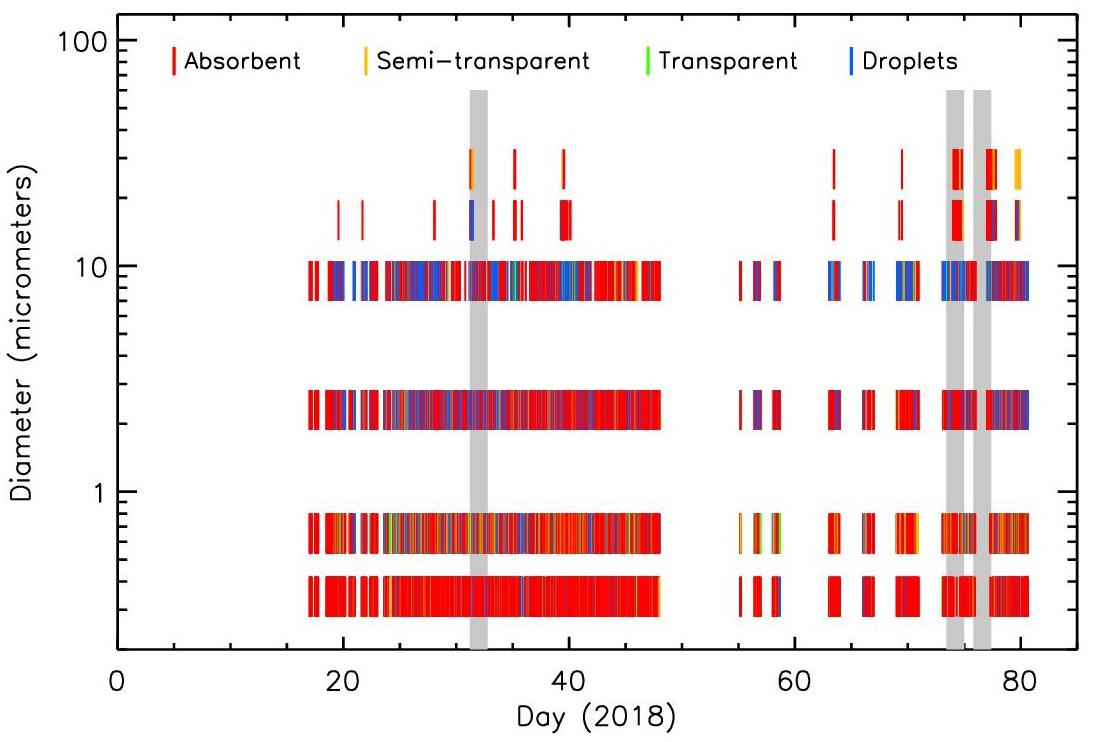
FIGURE 4. The LOAC typology measurements; the three events are indicated by gray zones.
Non-dust background conditions in the Antarctic Peninsula can be described by excluding selected dust events from the mean (median) mass concentrations of the whole measurement period. Mean (median) mass concentrations of the PM10 for non-dusty background conditions would decrease to 6.0 ± 1.3 (3.8 ± 1) μg m-3 while the PM2.5 concentrations would increase to 3.2 ± 1 (2.4 ± 0.9) μg m-3 for the period January-March 2018. There are small differences in the median values between the whole measurement period and the same period excluding the dust events, showing the importance of using medians for interpretation of aerosol data. The small increase in the PM2.5 background concentrations points to the different origin of the smaller particles in Antarctica than in the desert sources.
Near Surface Wind Conditions During the Summer 2018 Season
The average wind speed during the summer 2018 season was 5.2 m s-1. However, on 31 January and 1 February, 17 February (day 48), 25 February (day 55), 16 March (day 74), 18 and 19 March (day 76 and 77), the daily mean wind speed exceeded 15 m s-1 with a maximum value of 18.7 m s-1 on 19 March.
The main wind directions were south-south-western and western, which occurred for 21 and 14% of the summer season, respectively. The most frequent wind directions came from southerly to westerly directions (64% of the season), and these winds were also the strongest with the wind speeds >10 m s-1. The east-north-eastern and north-eastern winds were observed during 12% of the season, with wind speeds of <10 m s-1. Wind speed and direction during the study period are shown in Figures 5, 6.
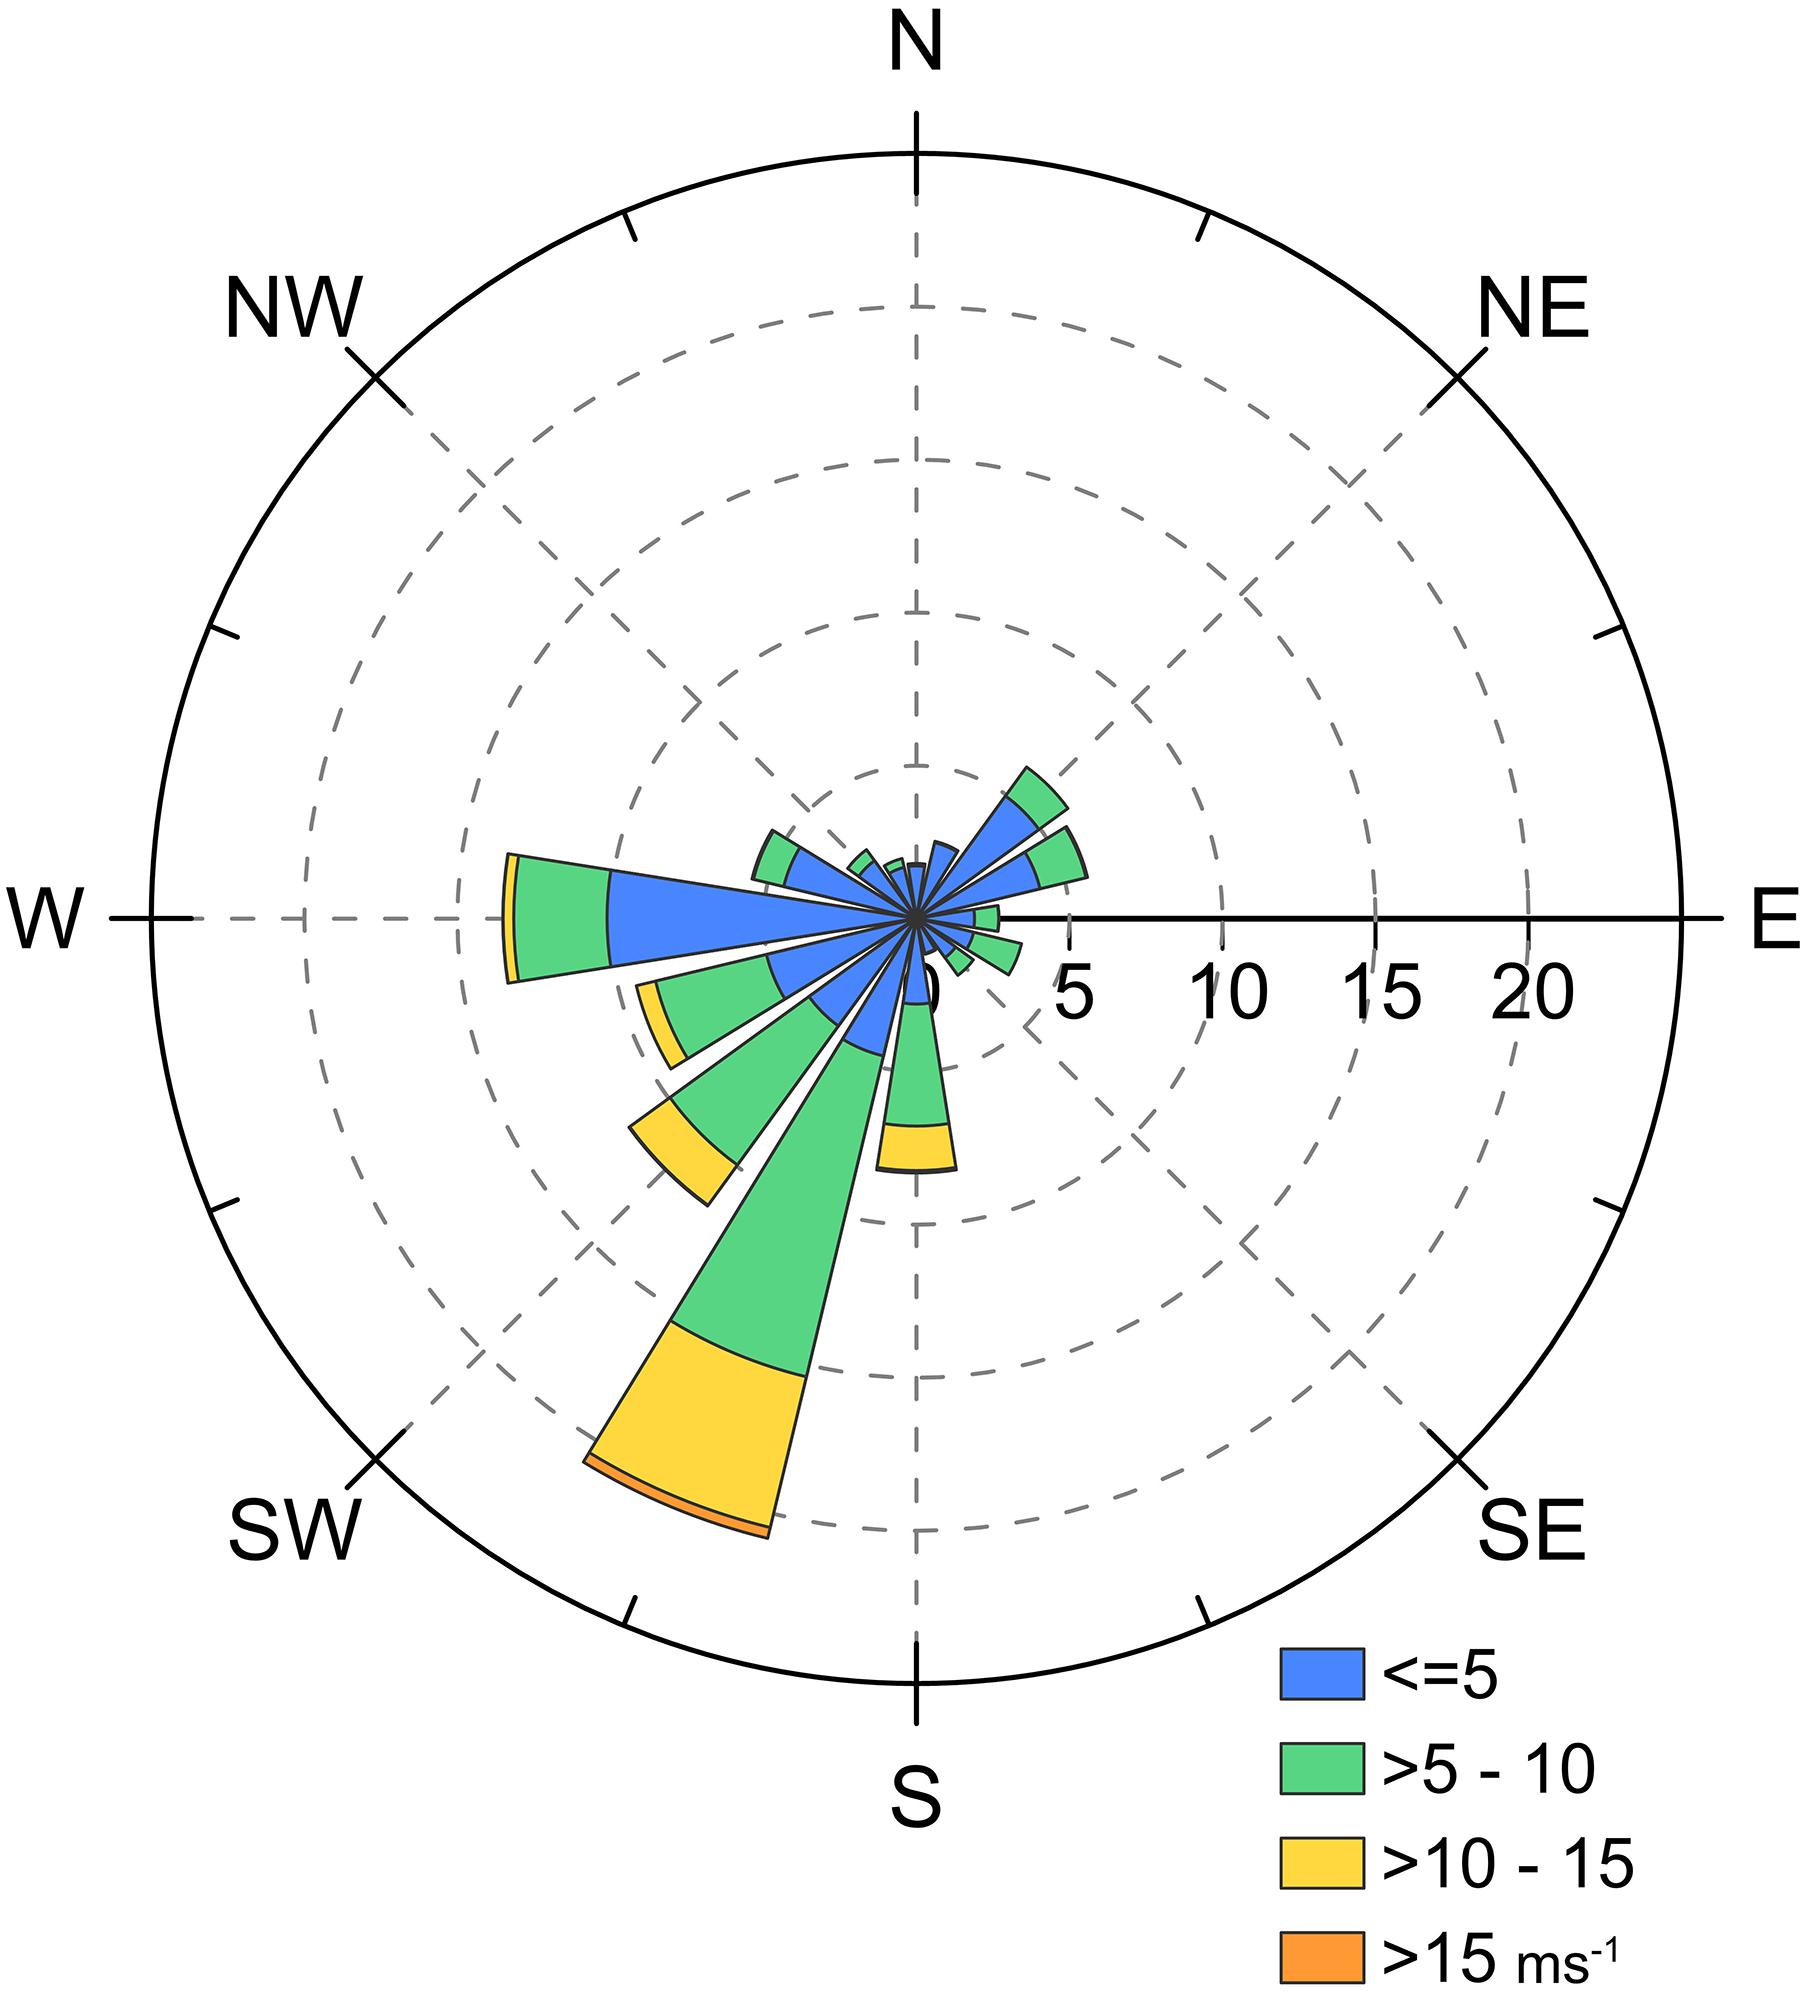
FIGURE 5. Wind rose indicating average wind speed and direction during the period from 26 January to 21 March 2018.
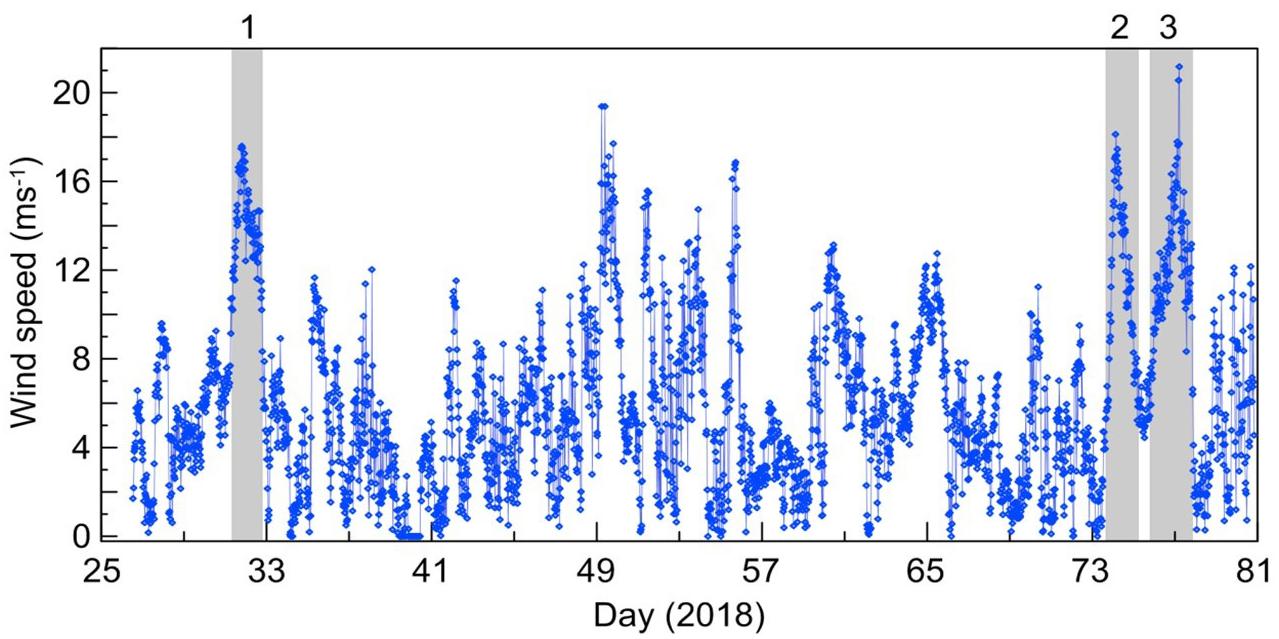
FIGURE 6. Wind speed during the study period with highlighted maximum wind speed events described more in detail.
Relationship Between Wind Properties and Aerosol Concentrations
Comparison of wind speed and aerosol concentration in different particle size classes shows a strong relationship during the study period. Concentration of aerosol particles >5 μm shows a positive correlation with wind speed above the wind speed threshold of approximately 10 m s-1. This correlation increases in strength with the increasing size of the particles. The table of correlation coefficients for individual classes (Table 1) shows that during high wind speed events (over 10 m s-1) the larger particles (larger than 5 μm) from local sources are uplifted and transported. These high wind speed events occurred during 7.8% of the study period.
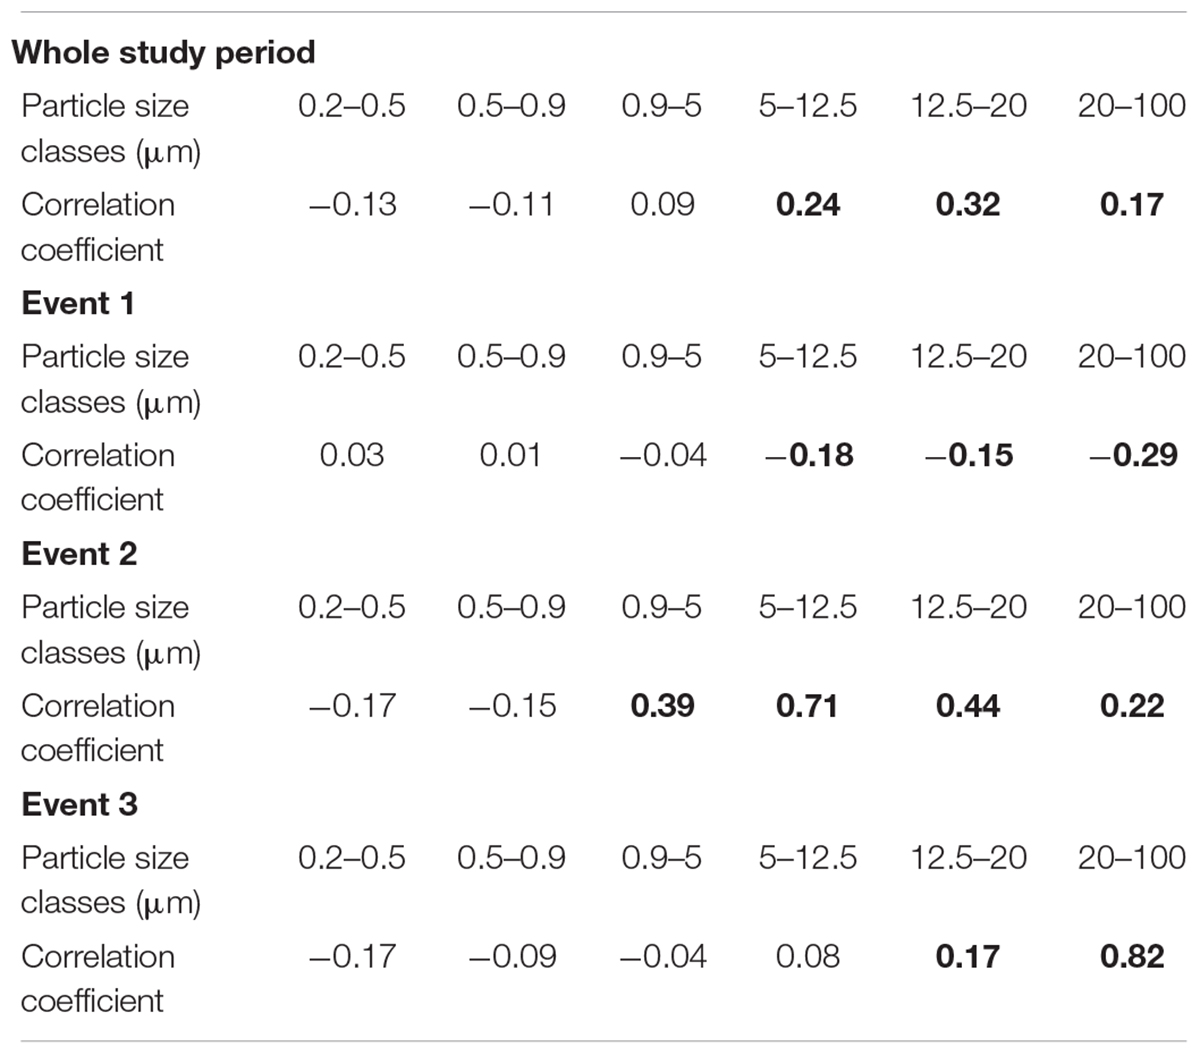
TABLE 1. Correlation coefficients of wind speed and aerosol concentration in individual particle size classes for wind speed >10 m s-1 (p < 0.02 in bold) for the whole study period and three major dust events.
Particles that range in size from 10–20 μm were rarely detected during the low wind speed episodes (wind speed <10 m s-1), suggesting that local material undergoes aeolian transport in short repeating periods. Approximately 83% of particles in the 10–20 μm size range were detected while wind speeds exceeded 10 m s-1.
Synoptic Situation During Major Dust Events
Three major dust events were detected by the LOAC during high wind speed events (Figure 7 for wind speed and direction). The wind speed was >8 m s-1 for the following events:
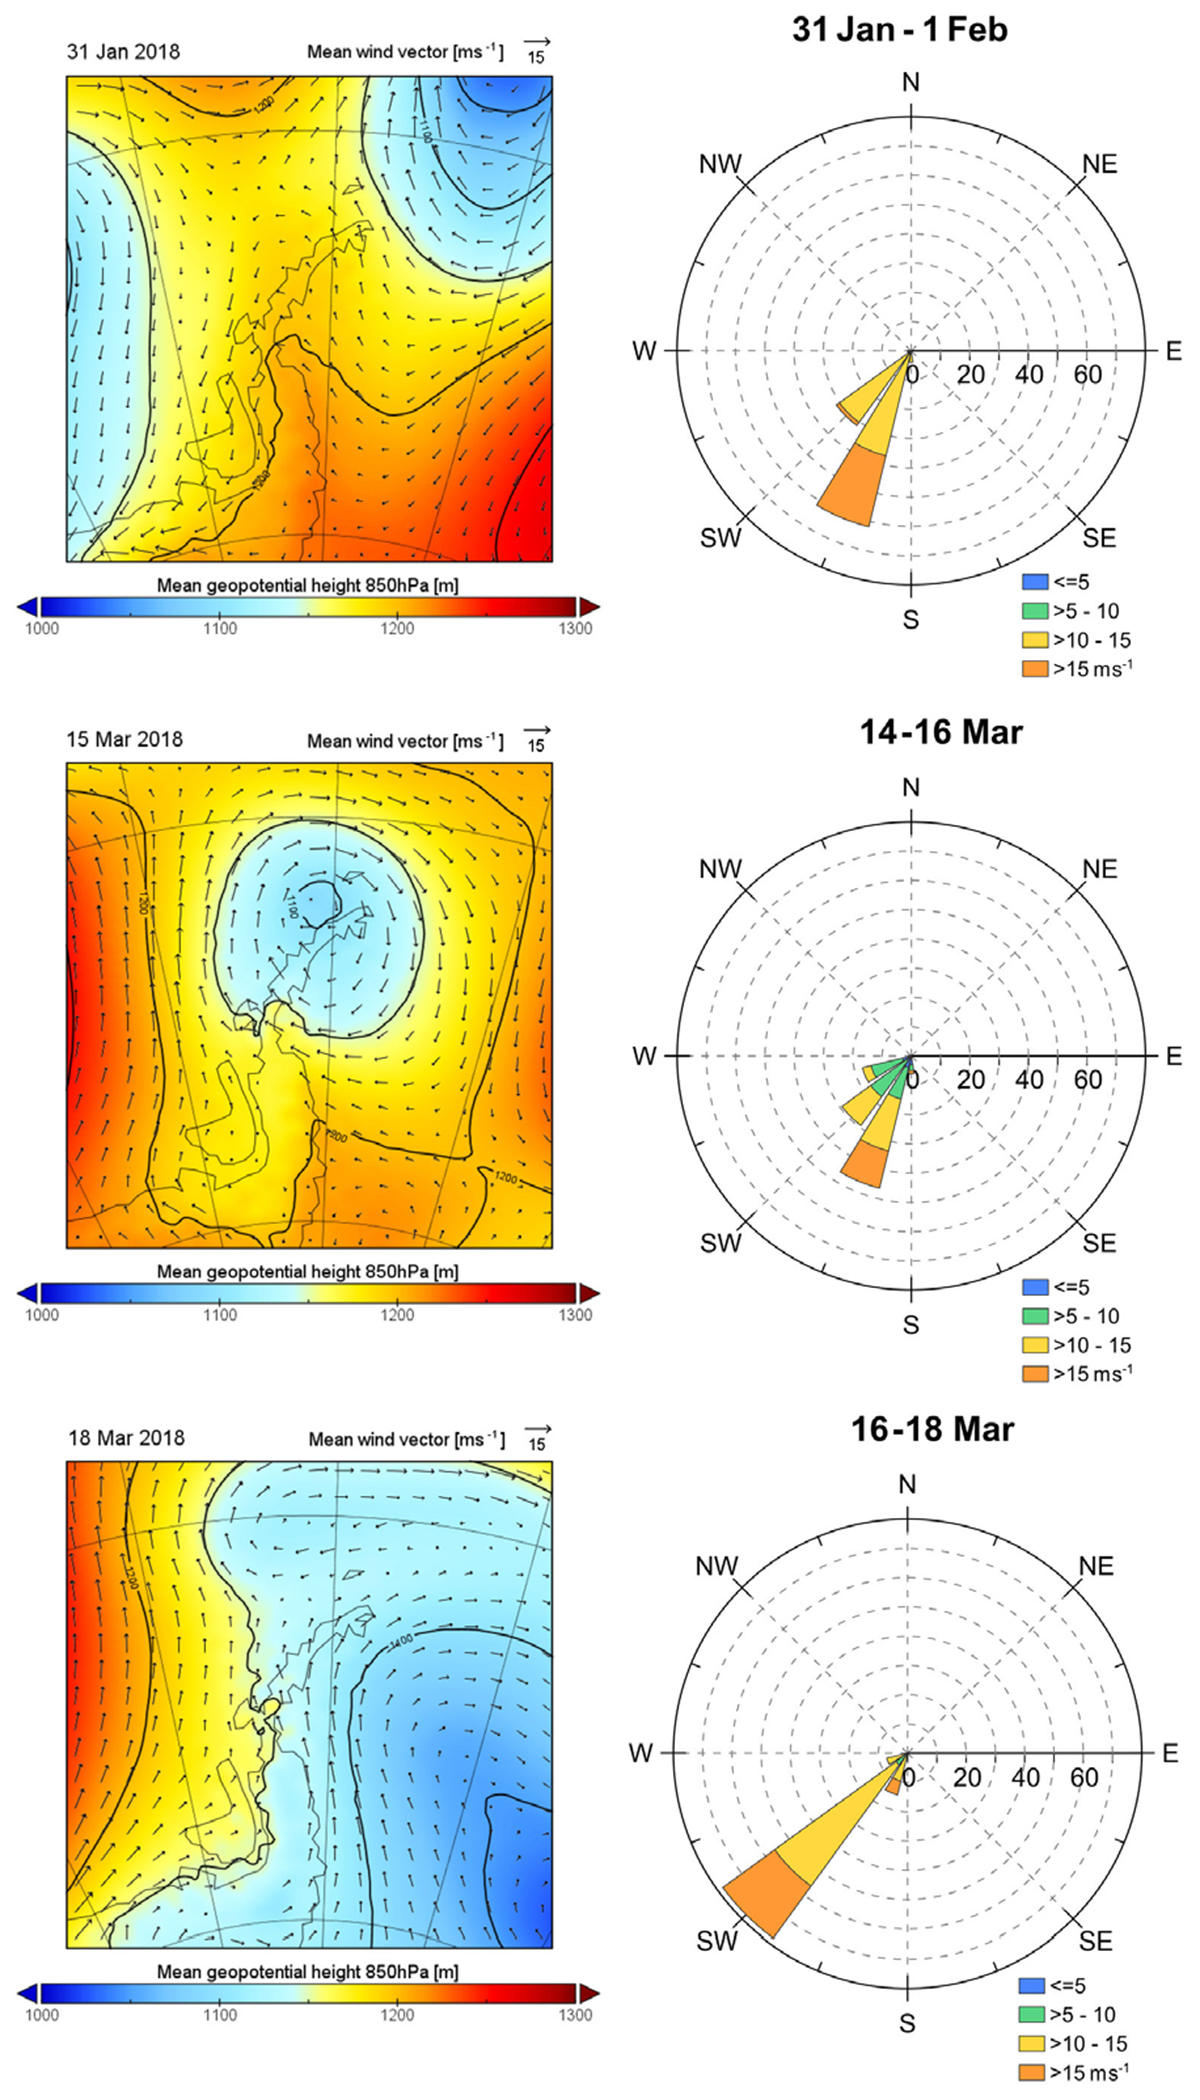
FIGURE 7. Synoptic situation over the Antarctic Peninsula, wind roses for all three major dust events.
1st event: 31 Jan 0600 – 1 Feb 1930 UTC.
2nd event: 14 Mar 1100 – 16 Mar 1200 UTC.
3rd event: 16 Mar 1300 – 18 Mar 2000 UTC.
The synoptic situation for the three case studies was described according to hourly 850-hPa level geopotential height data from the MERRA-2 reanalysis (Global Modeling and Assimilation Office, 2015). On 31 January, a deepening cyclone was moving from the southern Atlantic Ocean toward South Orkney Islands. The 850-hPa wind was predominantly south-eastern, and it strengthened up to 14 m s-1 before midnight as a result of an increasing pressure gradient. Wind speeds near to the surface were even stronger (>15 m s-1) and mainly coming from the south-south-west. The pressure field on 15 March was influenced by a cyclone approaching JRI from the South Shetland Islands, and continuing toward the central Weddell Sea, while still deepening. Consequently, the 850-hPa wind over JRI was the strongest in the morning, and as it weakened, it gradually changed from north-eastern to north-western. The wind near the surface exceeded 15 m s-1 less frequently than observed on 31 January, and despite the wind direction being predominantly south-south-western, it was variable. On 18 March, a low-pressure trough moved eastward in the Drake Passage, to the north of JRI. This situation resulted in the wind changing direction from the southwest to the west over JRI, which was accompanied by a wind speed increase that reached 19 m s-1. During this even, the near surface wind was almost entirely south-western and above 10 m s-1.
Major Dust Events in Detail
The three major dust events were analyzed in detail to identify relationship between wind speed and aerosol concentrations. An example of the influence that abrupt changes in wind direction has is illustrated on the 29 January 2018.
The two events that occurred in March show a good correlation, with a clear positive relationship; however, Event 1 (31 January – 1 February) does not correlate with the other two. The relationships between wind speed and aerosol concentration are shown on an example of an integrated particle class (5–12.5 μm) in Figure 8. Event 1 had significantly lower (approximately one order of magnitude) aerosol concentrations than both Events 2 and 3, probably as a result of higher ground surface moisture contents in the beginning of the summer season blocking the uplift of larger particles. The volumetric soil water content at a depth of 5 cm during the first Event reached 31%, whereas it only reached 22% during Events 2 and 3. The influence of ground surface moisture content is well illustrated when comparing Events 1 and 2, as both events experienced approximately the same wind speed and similar wind directions, resulted in concentrations up to 0.25 n cm-3. This influence can also explain why there is no significant correlation between aerosol concentration and wind speed, as is shown in Table 1. Significant and linear correlation was found during Event 3 at the end of the summer season.
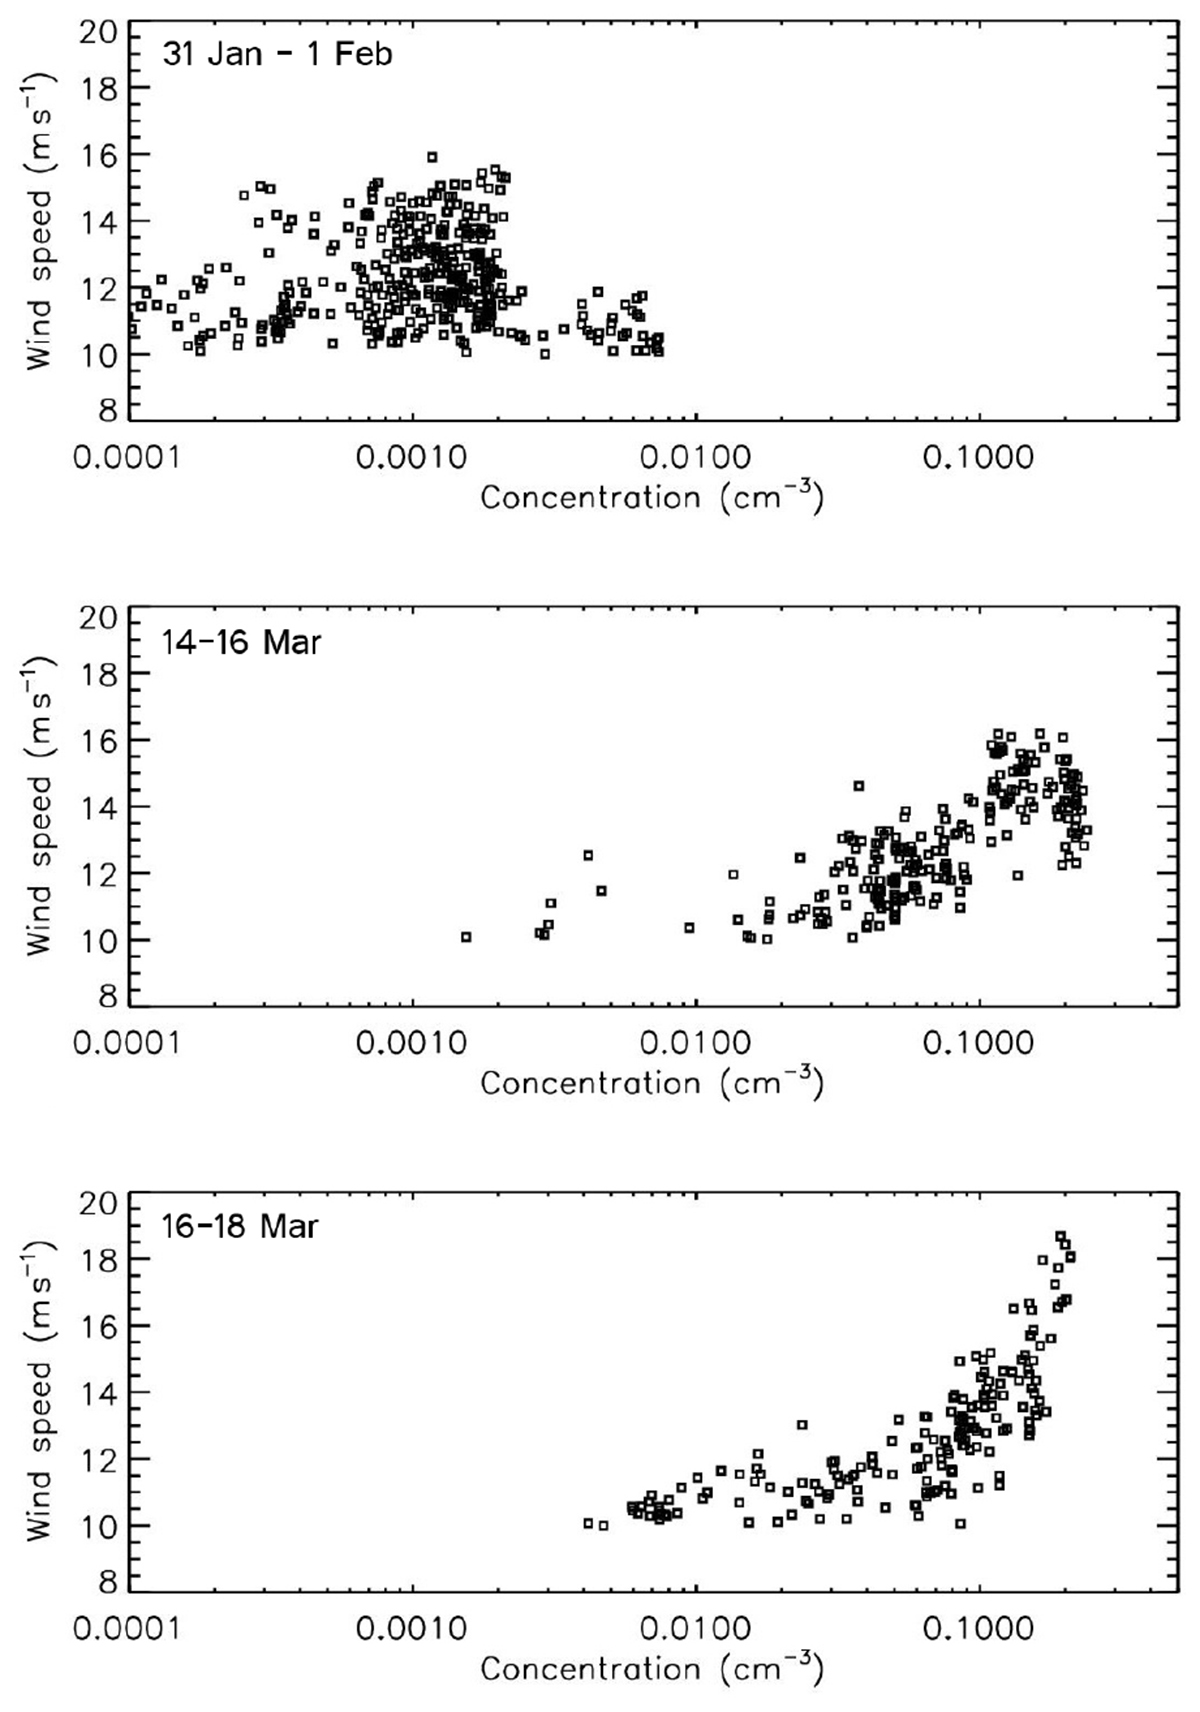
FIGURE 8. Particle size class 5–12.5 μm aerosol concentration and wind speed relationship for the three major dust Events.
Event 1 shows an unusual pattern in aerosol concentration. Contrary to the other two events, there is no clear correlation between wind speed and aerosol concentration of larger particle size classes. A detailed look at the dynamics of the event 1 (Figure 9) shows a rapid increase in aerosol concentration of larger particles (>5 μm) during the beginning of the high wind speed event, with peak concentrations occurring around 10:00 UTC when the wind speed was approximately 10 m s-1. However, during the wind speed maximum (approximately 16 m s-1) at 16:00–23:00 UTC, the concentrations were comparatively low. An interesting feature is the relatively high concentration of particle size class 5–12.5 μm at the end of the event, that may be associated with the change in wind direction.
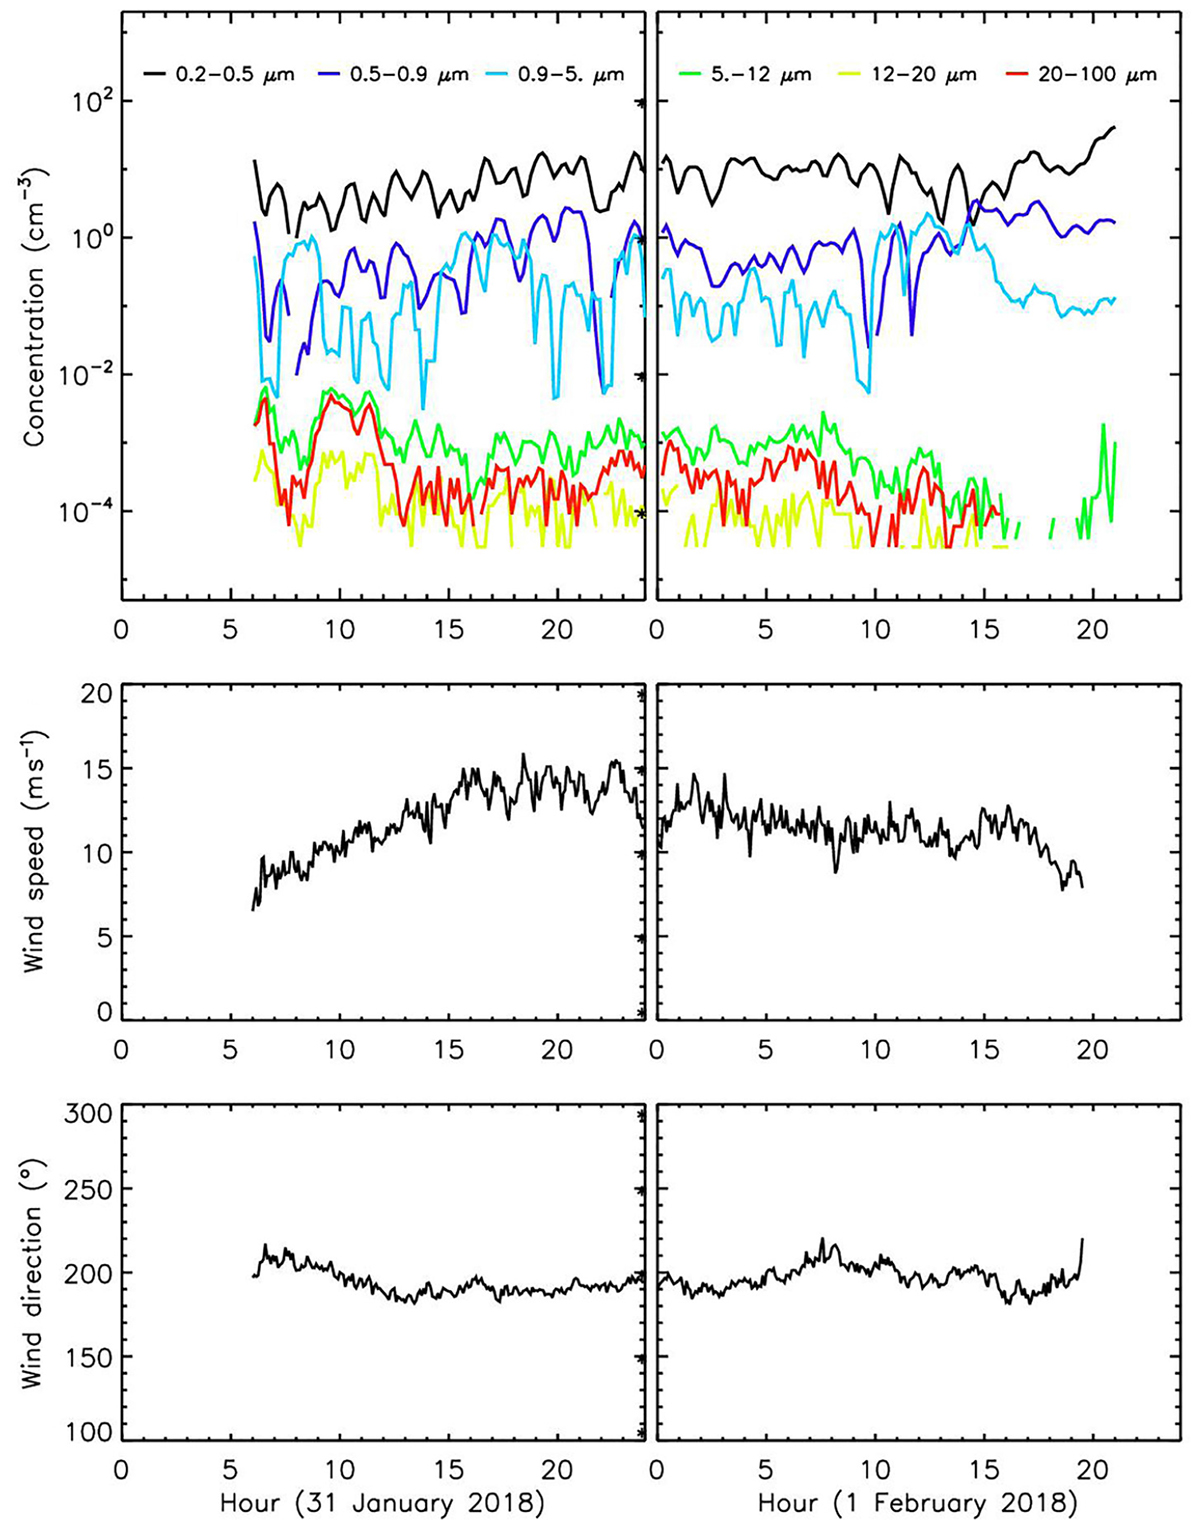
FIGURE 9. Event 1 – wind conditions and aerosol concentration.
A period of increased PM2.5 concentrations (>4.2 μg m-3) occurred at the JGM Station between 5 and 8 February 2018. PM2.5 concentrations contributed with high proportions to PM10 during this period. HYSPLIT backward trajectory analyses (Figure 10) shows air parcels arriving to JGM Station from the Patagonian Desert areas, where several weather stations had reported the SYNOP codes for dust observations from 5 February to 7 February 2018. There are unfortunately no clear satellite images showing dust plumes for this period as, for example, on 12 February 2018. We have not obtained aerosol samples for the chemical analyses to confirm that the dust could have been transported from the Patagonian dust sources to Antarctica. The Patagonian dust sources were, however, very active in producing dust from mid-January to the end of March 2018.
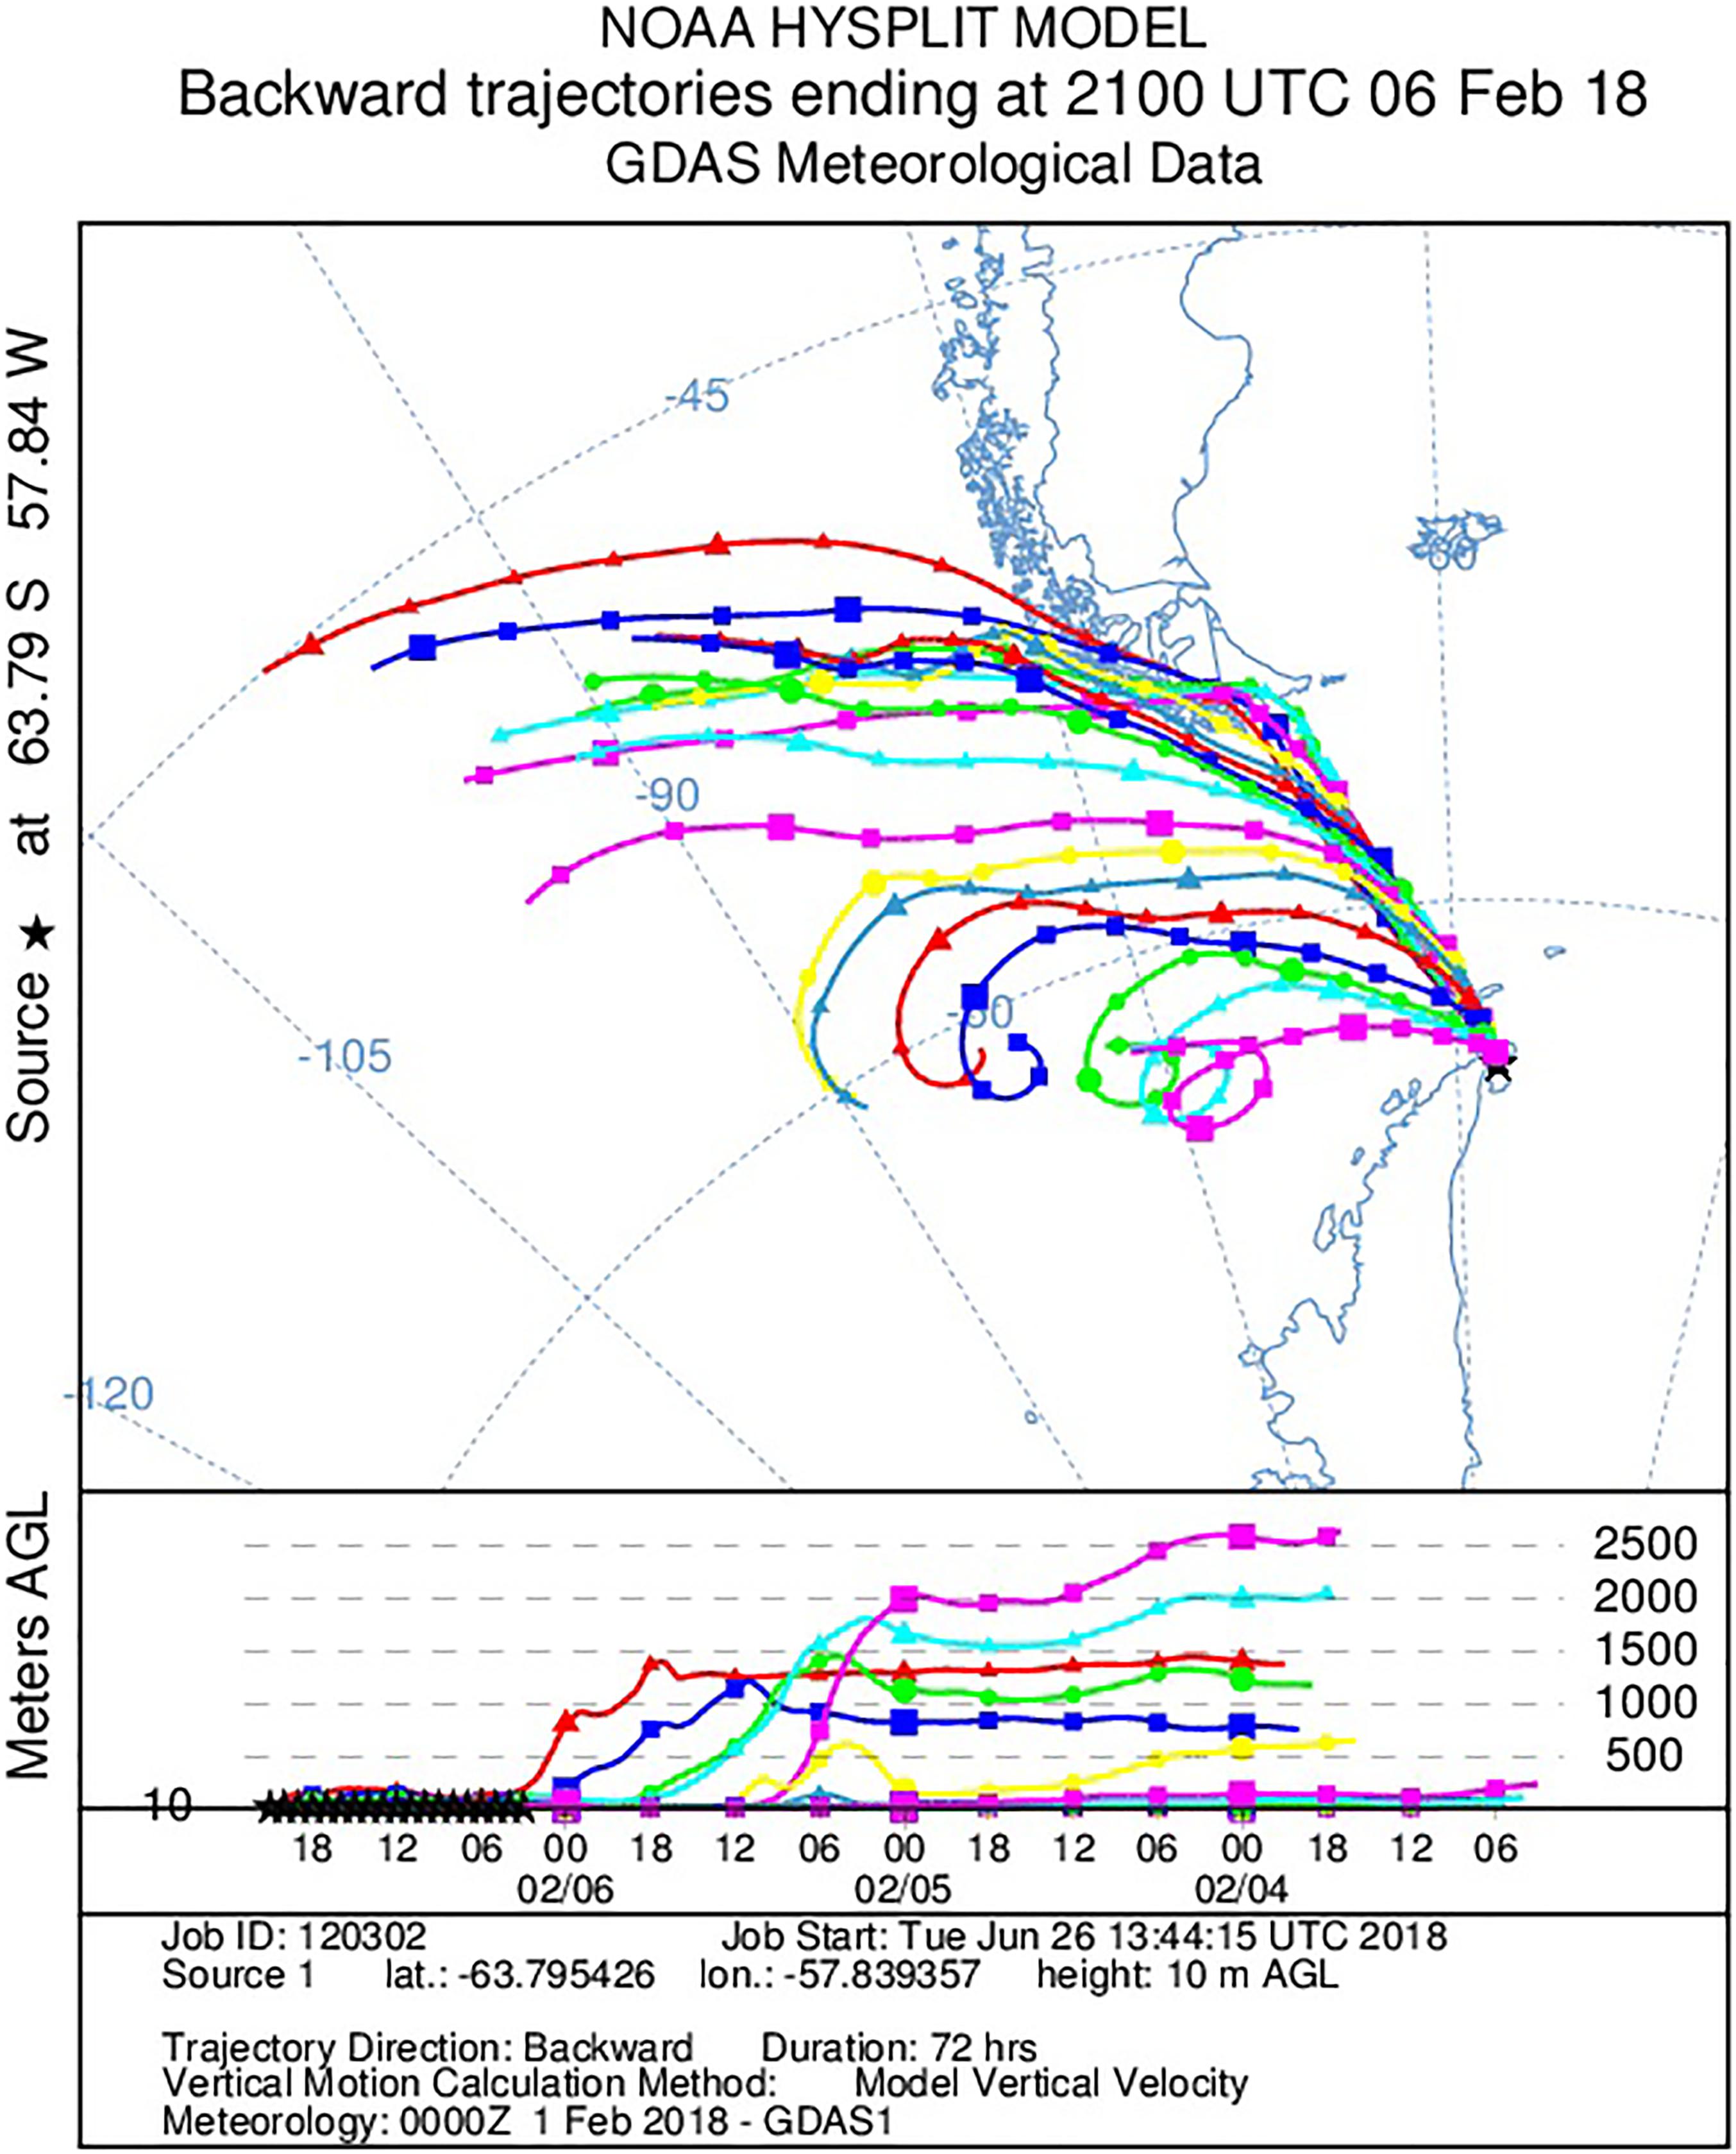
FIGURE 10. NOAA HYSPLIT model backward trajectories for beginning of February 2018 (ending at 21:00 UTC 6 February, 2018); source: NOAA Air Resources Laboratory.
The Event 2 (Figure 11) (14 March - 16 March 2018) has a well-defined peak period for both wind speed and aerosol concentration on 15 March from approximately 00:00 to 08:00 UTC. The maximum wind speed exceeded 16 m s-1 and aerosol concentrations in the size class 5–12.5 μm reached 0.23 n cm-3. Timing of peak concentrations of larger (but even smaller) particles relatively well correspond with the period of highest wind speed even though the concentration peak was delayed behind the wind speed maximum of several hours.
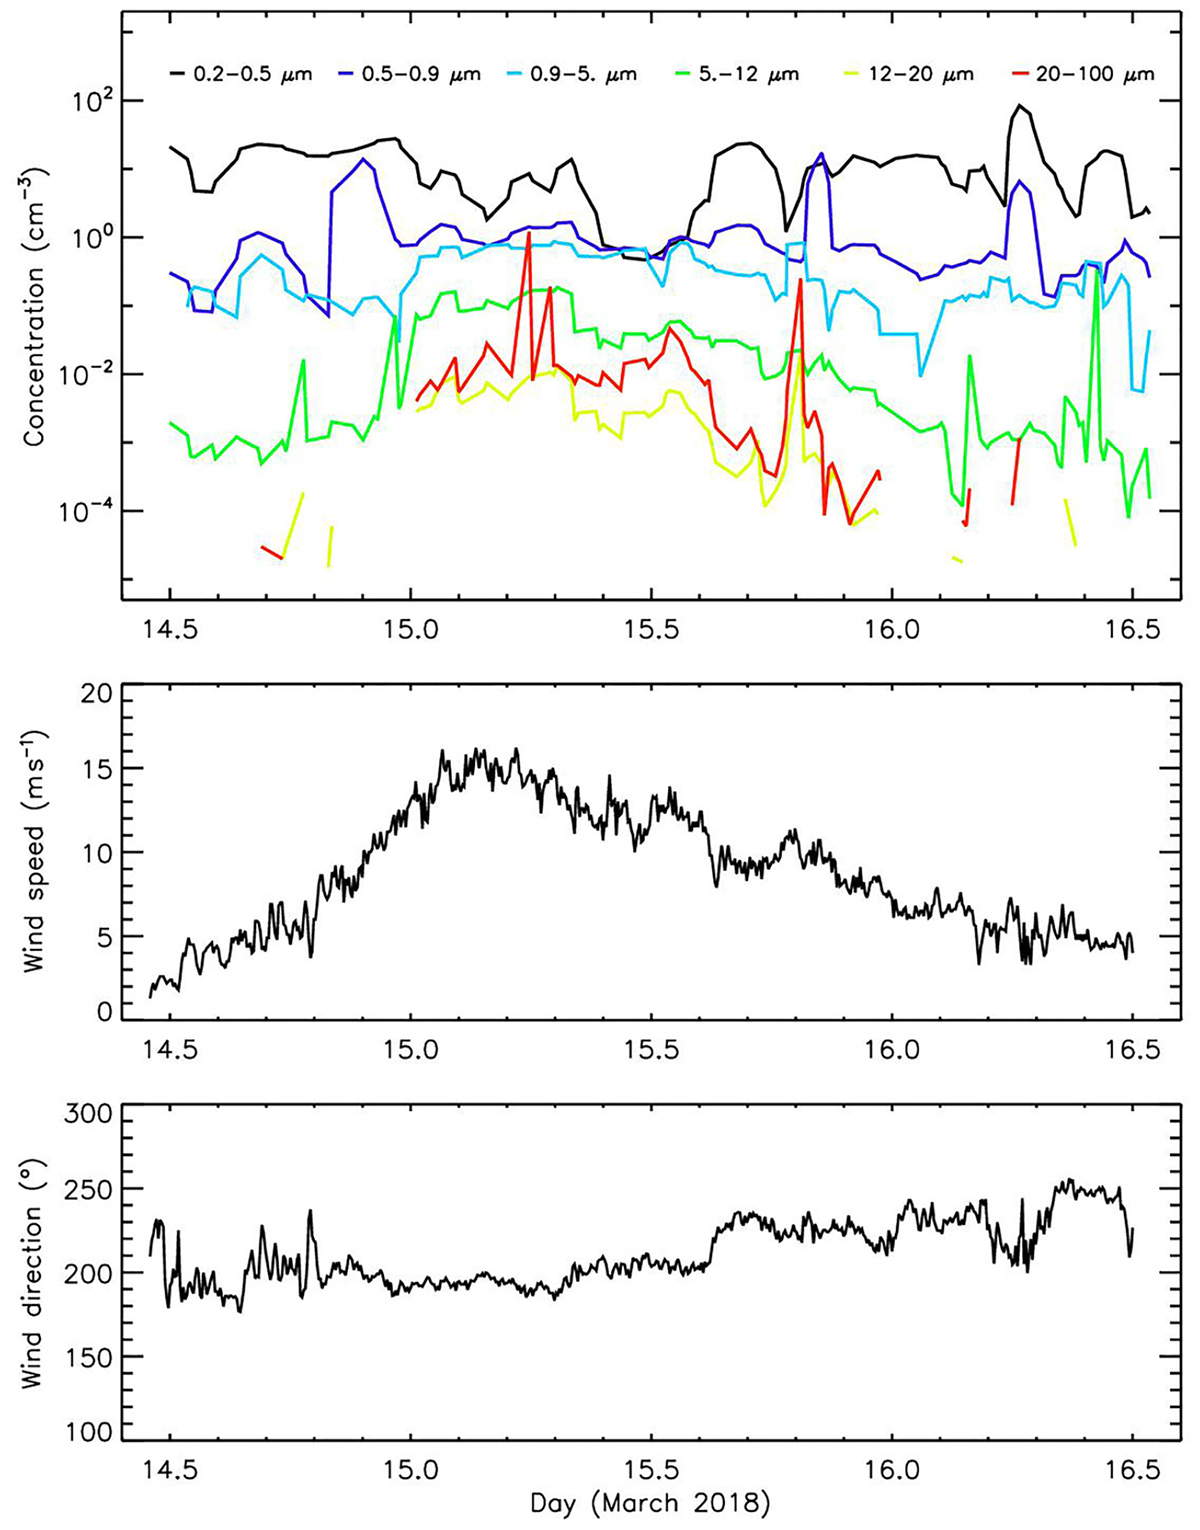
FIGURE 11. Event 2 – wind conditions and aerosol concentration.
Directly after the second event, another high wind speed episode (Event 3) occurred from 16 March to 18 March 2018 (Figure 12). This event is characterized by the highest wind speed recorded during the study period – 18.7 m s-1. The available aerosol concentration measurement corresponds well to the observed wind speeds (correlation coefficient for particles 12.5–20 μm and wind speed is 0.69), even though a middle section of the event is missing the LOAC measurements. The best fit of aerosol concentrations and wind speed is found again for the particles larger than 5 μm. Aerosol concentrations in size class 5–12.5 μm reaches 0.21 n cm-3 during the peak wind speed.
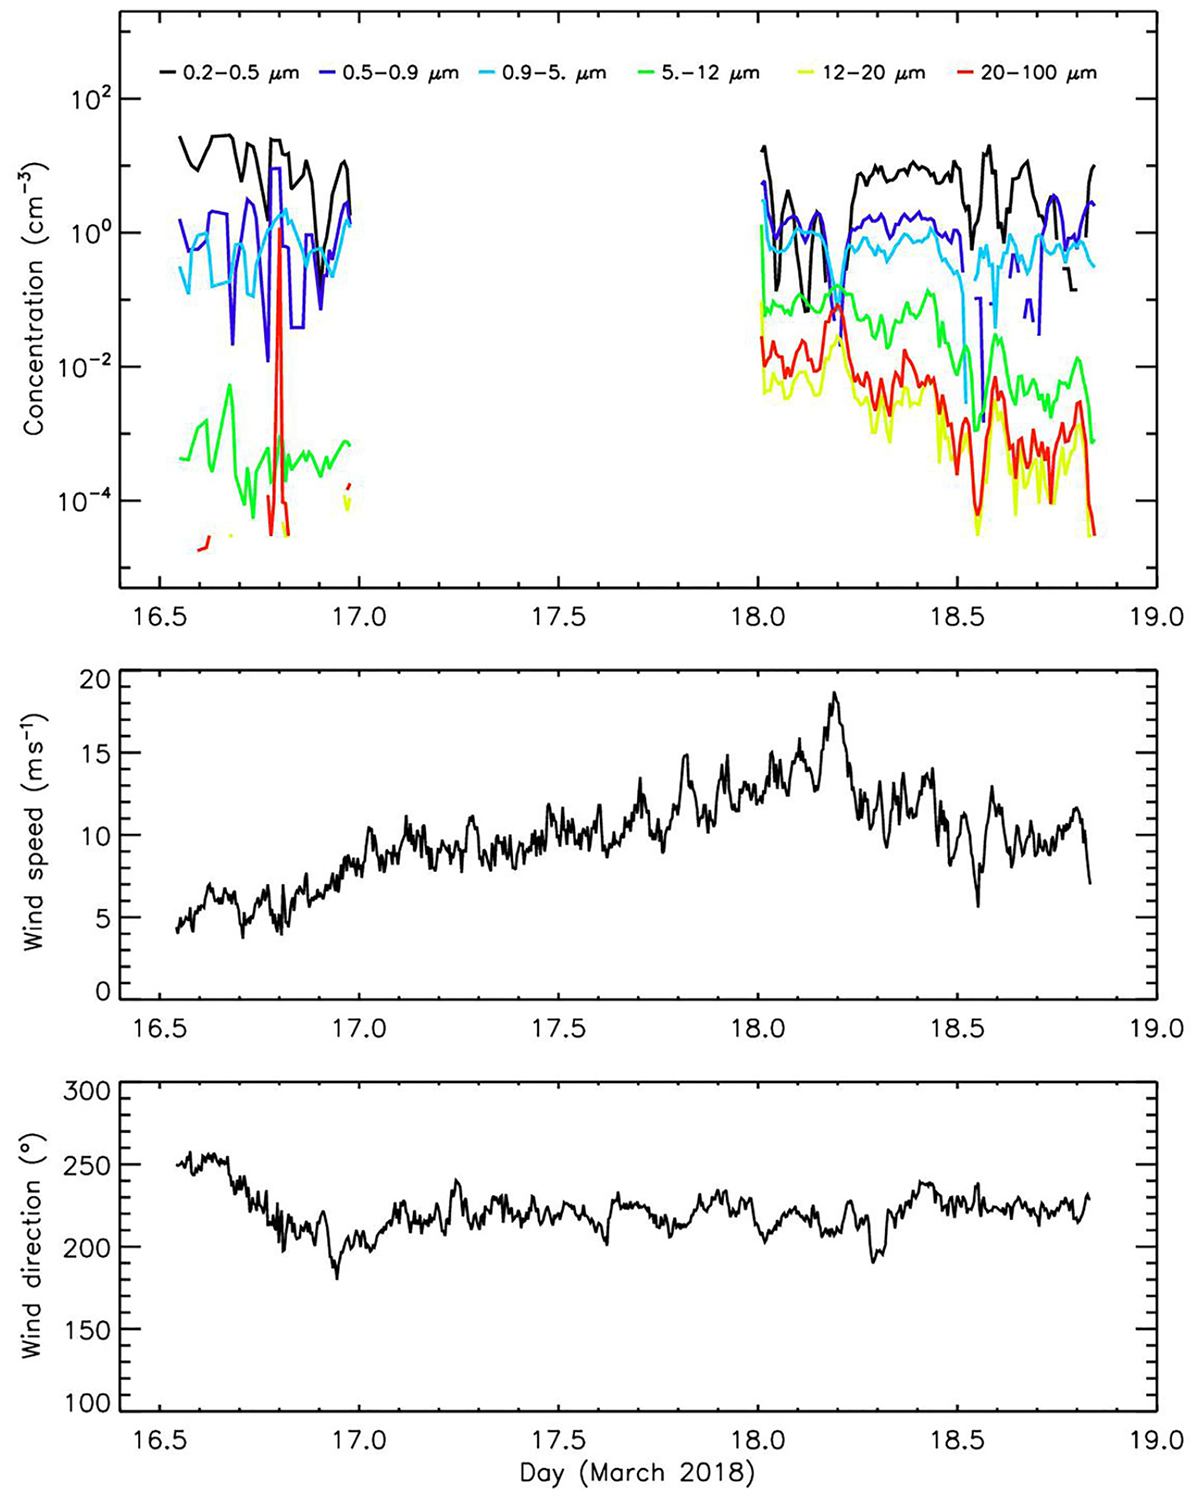
FIGURE 12. Event 3 – wind conditions and aerosol concentration.
Wind direction and aerosol concentrations were also associated as shown for example on 29 January 2018 (Figure 13). The day was not particularly windy, with an average wind speed of 4.1 m s-1 and a maximum wind speed of 6.0 m s-1. The most pronounced change in wind conditions was the switch from a southern wind to a western wind at around 12:00 UTC, which lasted until 21:00 UTC. This was accompanied by a gradual increase in aerosol concentration, especially in the case of larger particles (typically >5 μm). The positive correlation between wind direction and aerosol concentration is significant (p > 0.01) for particles larger than 7.5 μm (p > 0.02 for particles 5–7.5 μm).
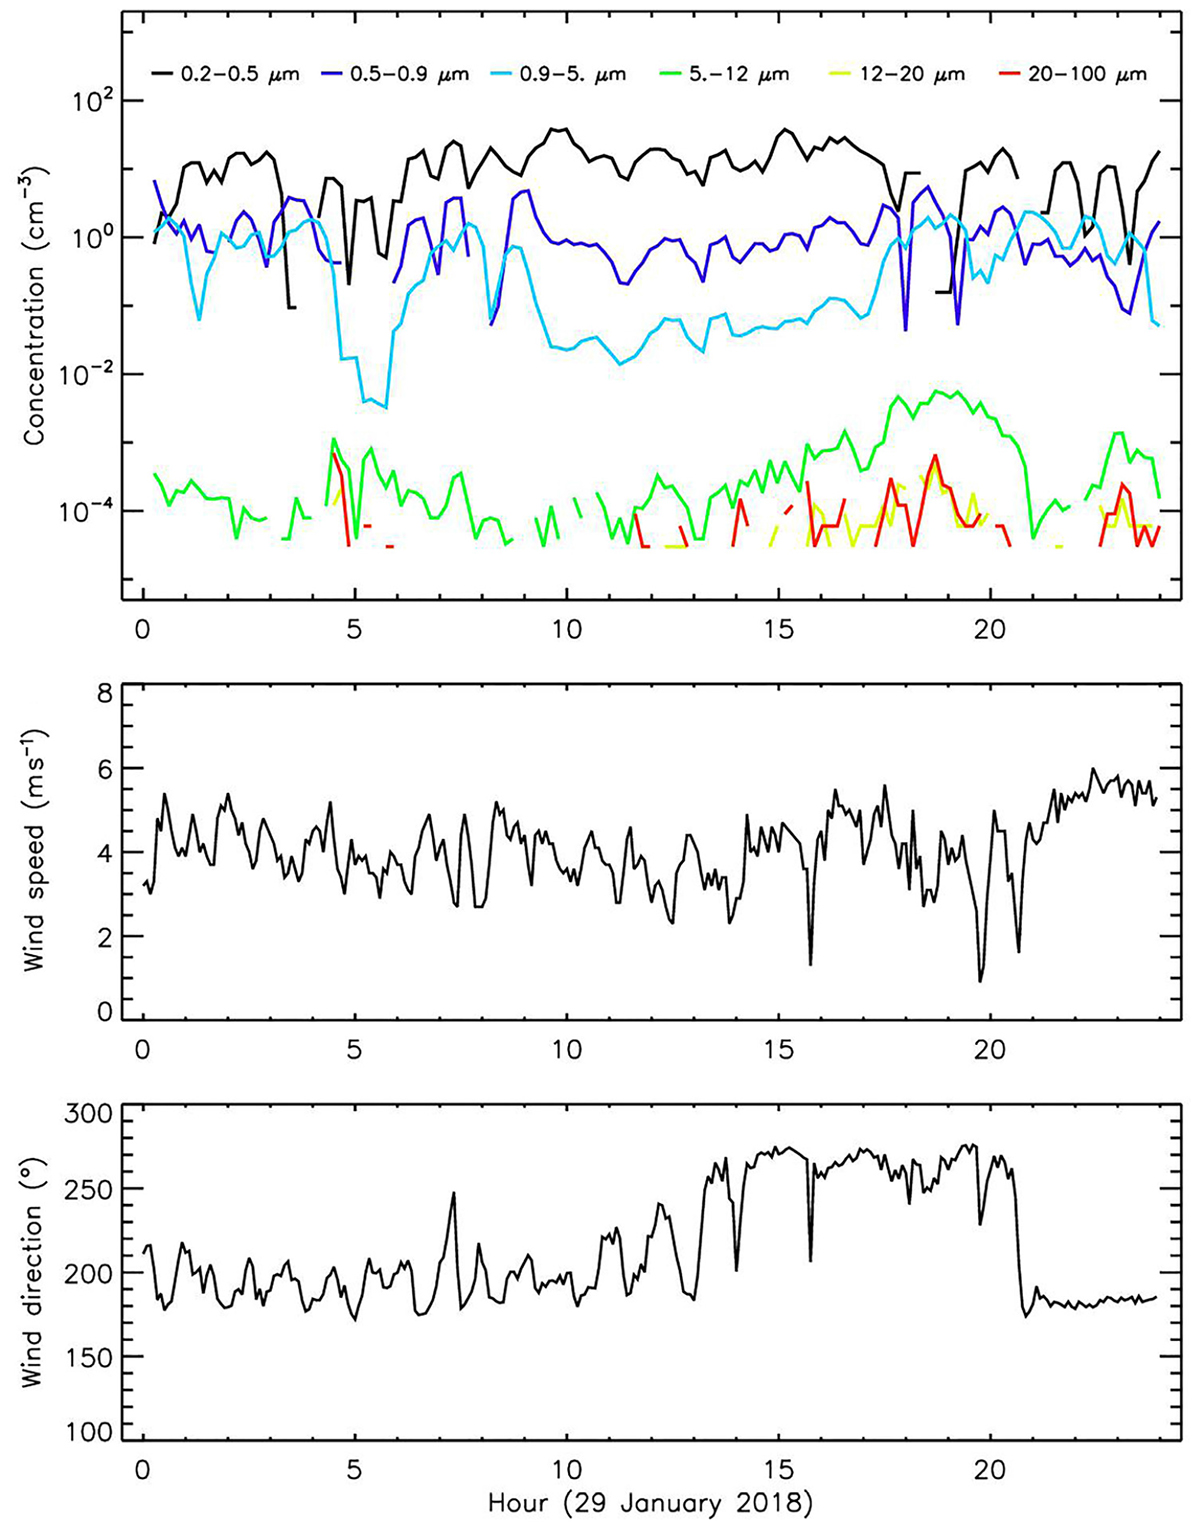
FIGURE 13. 29 January 2018 wind conditions and aerosol concentration.
AOT
Mean AOT during the study period ranged between 0.48 at 380 nm and 0.55 at 870 nm with an average mean AOT value of 0.50. Mean AOT for 500 nm (Figure 14A) showed remarkable day to day variations with a peak on 6 February (1.941) and a mean value of 0.51 ± 0.53; showing no obvious trend during the summer. However, a strong positive correlation was found between water vapor and mean AOT for 500 nm when water the vapor column was >0.8 cm (correlation coefficient 0.82; statistically significant at the significance level of 0.01). When the AOT for 500 nm were filtered to contain only measurements with the water vapor column ≤0.8 cm (Figure 14B), the mean AOT for 500 nm was 0.14 ± 0.14, with values only exceeding 0.300 on 15 January and 18 March. For 15 January, no wind or aerosol concentration data were available; however, on 18 March, the highest wind speed of the whole summer season was recorded, and increased PM10 concentrations were captured by the LOAC.
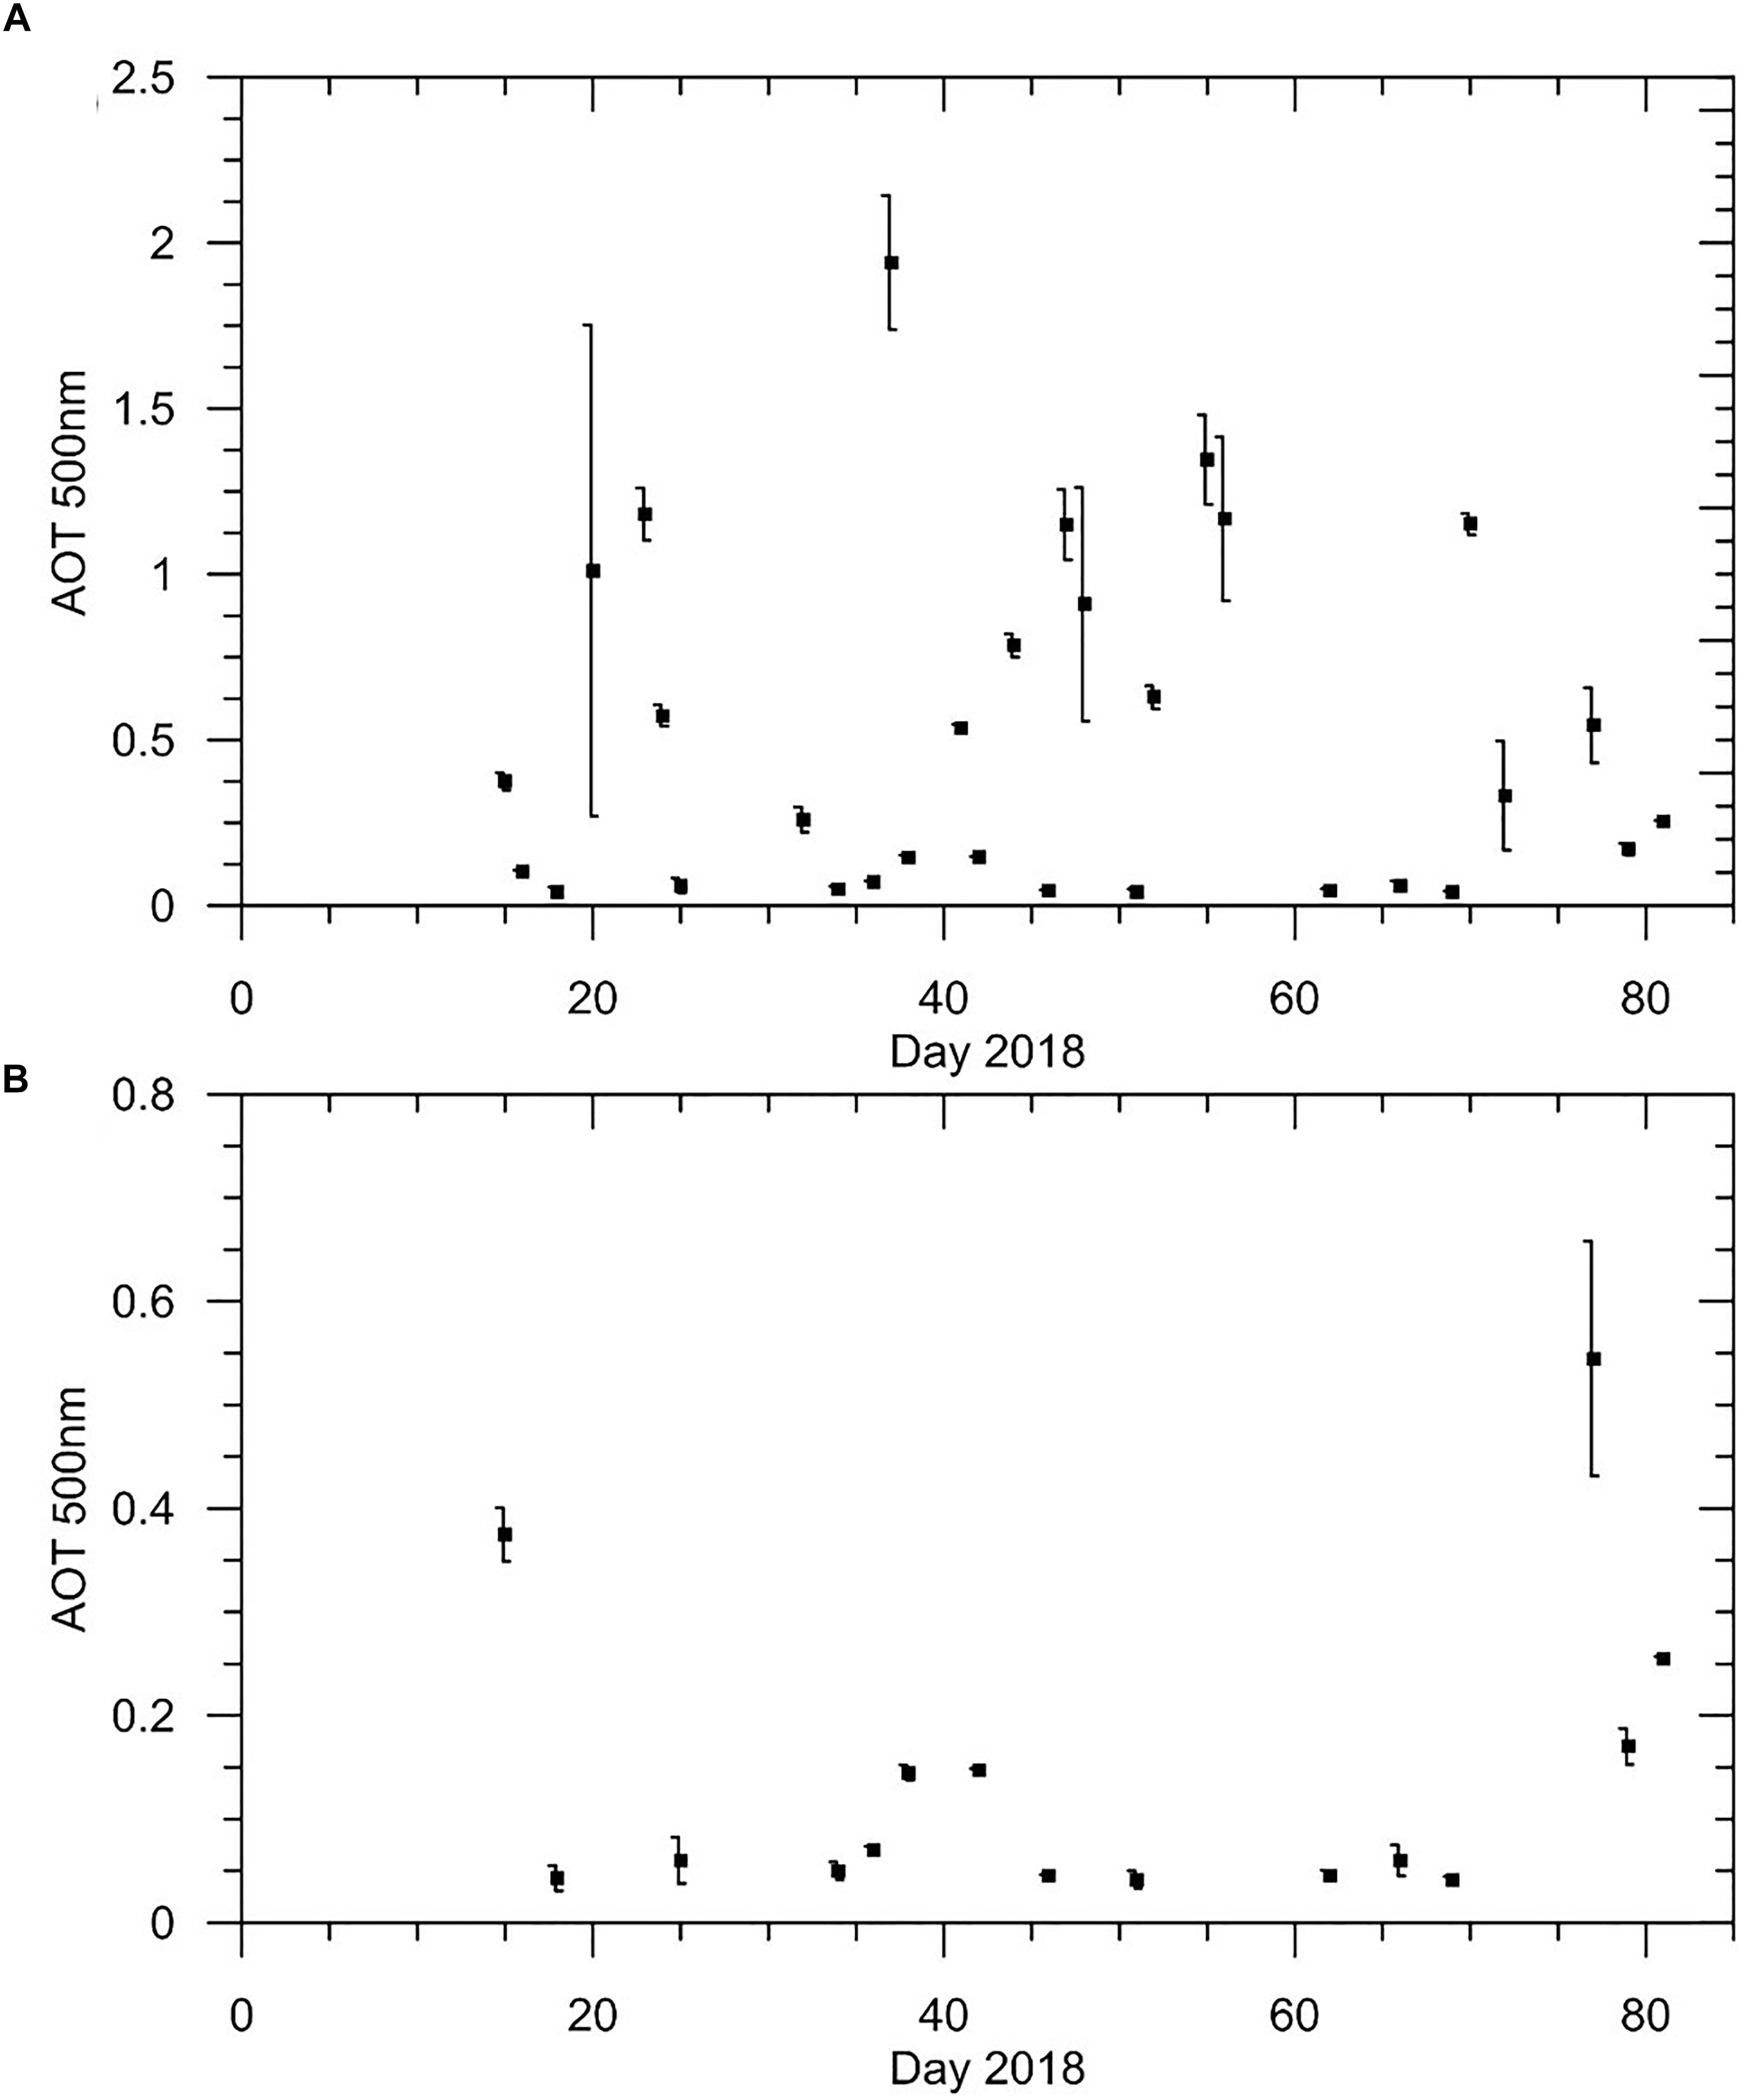
FIGURE 14. Mean AOT for 500 nm with standard deviation for each day (A) all measurements (B) when water vapor column was ≤0.8 cm.
Horizontal Aeolian Sediment Transport
A total of 11 days sampling from 23 January to 3 February 2018 resulted in 36.4 g m-2 of material. A total of 138.3 g m-2 was collected during the second period from 3 February to 25 February 2018, and 62.9 g m-2 from 25 February to 10 March 2018. In total 237.6 g m-2 was collected in the passive sediment sampler, makes an average of 4.95 g m-2 d-1. However, according to personal observation, most of the material was trapped during the high wind speed events. Installation during the whole year (February 2017 – January 2018) revealed an approximate sediment deposition rate of 1471 g m-2 year-1.
Discussion and Conclusion
It is challenging to obtain quality aerosol data (mass and number concentrations, typology of particles) from remote areas and/or areas that experience harsh conditions, such as in Antarctica. The LOAC instrument performed quite well in such conditions, and provided valuable PM measurements for background as well as high aerosol concentration conditions for the period January-March 2018. Mean mass concentrations of the PM10 and PM2.5 were similar to what has been reported from the Larsemann Hills (Budhavant et al., 2015), but lower than reported from the Maitri station (Chaubey et al., 2011). Mean values from JRI were higher than from McMurdo station in 1995–1997 (Mazzera et al., 2001), the Antarctic Peninsula in the late 1980s (Artaxo and Rabello, 1992), as well as Marambio station in the Antarctic Peninsula in 2013–2015 (Asmi et al., 2018). In a global context, a mean PM10 value of 6.4 μgm-3 from the Antarctic Peninsula is also comparable to two stations in Norway (annual mean of 7.5 μg m-3), but higher than the annual mean of 4.4 μg m-3 in Sevettijarvi, Finland (Putaud et al., 2010). The mean PM2.5 value presented here is, however, lower than stations in Northern Europe. Dust events caused during high wind events over barren areas impair the air quality in Antarctica significantly. There is no available literature reporting PM10 concentrations exceeding 50 μg m-3 from Antarctica. The frequency of dust events (15 events during 2 months) demonstrates the importance of HLD sources and their contribution to the global dust cycle (Bullard et al., 2016), provided that measurements can give a better estimate of the erosion activity and dust production from Antarctica ice-free zones.
The observed mean wind speed during the study period (5.2 m s-1) corresponds well to the general spatial pattern of Antarctic surface wind streamlines and the position of JRI in the Antarctic Peninsula region. Ramesh and Soni (2018) report a mean wind speed for the summer months at Maitri station as approximately 7.2 m s-1, and Lancaster (2002) observed mean wind speed ranging from 2.7 to 5.3 m s-1 at different sites in Taylor Valleys. Aristidi et al. (2005) observed a mean wind speed at Dome C of 2.9 m s-1, Lazzara et al. (2012) reported mean wind speeds of around 2 m s-1 in the summer rising to around 4–5 m s-1 at Amundsen Scott station at the South Pole (continent interior). The mean wind speed in the area of Antarctic Peninsula typically ranges from 4.3 m s-1 at Faraday/Vernadsky station to 6.6 m s-1 at Arctowski Station on King George Island (King and Turner, 1997; Marsz and Styszyńska, 2000). Mean wind speed data are summarized in Table 2. The observed wind speed and direction coincide well with the surface wind analysis from Johnson Mesa (3 km southwest of JGM station) that southerly and westerly winds were the most frequent in 2008–2010 and the strongest wind was found during a southerly flow (Zvěřina et al., 2014; Bohuslavová et al., 2018). Average wind speeds at Marambio station (the closest to JGM Station) reaches 5–7 m s-1 during the summer season (Asmi et al., 2018). This represents well the general pattern of low mean wind speed in the interior of the continent and high on the continent edges. The observed critical value of wind speed around 10 m s-1 when local material sources are activated differs dramatically among different sites [e.g., 20 m s-1 for Taylor Valleys in Šabacká et al. (2012)]. However, the wind speed threshold value for activating local sources depends on the particle size of the material, its availability (Lancaster, 2002) and also on the ground surface moisture conditions (Wiggs et al., 2004). Crusius et al. (2011) similarly observed the high frequency of dust events in autumn when the water level is low and fluvial sediments are exposed. A rapid increase of larger particles in the air is observed when a critical value of wind speed is exceeded, as confirmed also from the typology of aerosol (detection of mineral particles). The prevailing southerly winds, especially during the high wind speed events, bring material from distant (approximately 15 km) bare unglaciated surfaces of weathered rocks and sediments (e.g., Abernethy Flats). Horizontal sediment deposition on the surface level reaches an average of 4.95 g m-2 d-1 (1471 g m-2 year-1), showing very high deposition rates compared to other HLD areas (Bullard, 2013; Bullard et al., 2016). Such values are significantly higher than those reported by Atkins and Dunbar (2009) of 7.8–24.5 g m-2 year-1, or Chewings et al. (2014) of 0.2–55 g m-2 year-1 in the McMurdo Valleys, West Antarctica. Higher deposition rate of dust particles on Ulu Peninsula can be considered as an important factor contributing to changes of physical and optical properties of the snow. This can have further consequences for energy exchange between glaciers and atmosphere, enhanced snow melt and negative surface mass balance on several mountain glaciers in the investigated area (Engel et al., 2012; Láska et al., 2018).
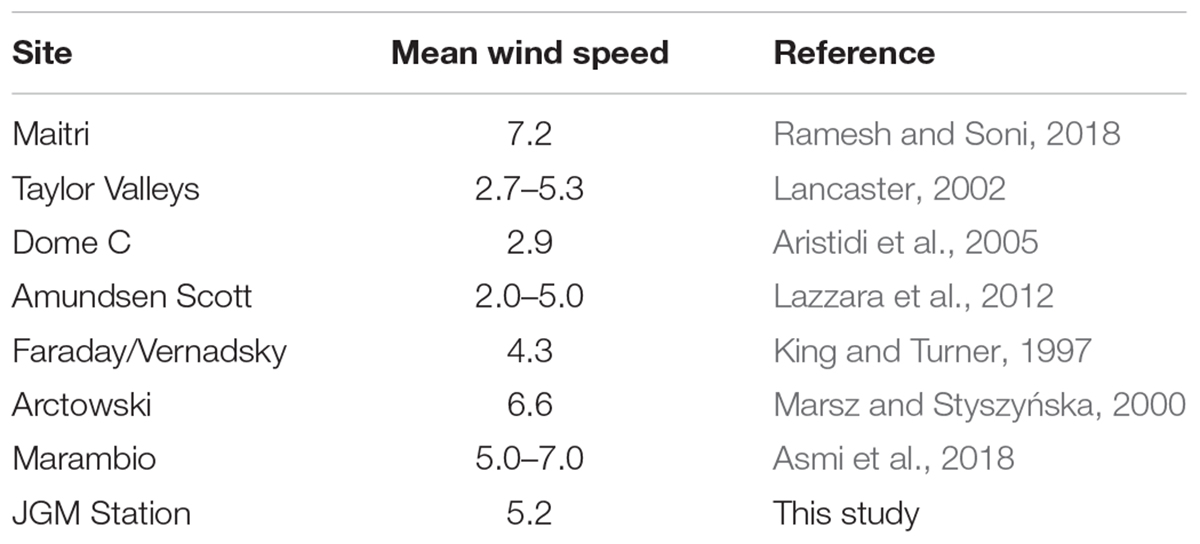
TABLE 2. Mean wind speed (m s -1) observed at different Antarctic location.
The aerosols optical properties measured by the Microtops II sun photometer showed high interdiurnal variation of AOT with the mean value of 0.139 ± 0.142 at a wavelength of 500 nm. The mean AOT was influenced by two Events with values above 0.300 (15 January and 18 March 2018), while the mean AOT in the rest of the period was 0.090. The observed AOT at 500 nm are higher than those measured during summer at Maitri station (123 m a.s.l.), which reached 0.034 ± 0.005 (Chaubey et al., 2011), or those being reported near to the Antarctic coast (south of 60°S) which reach values as low as 0.03–0.05 (Gadhavi and Jayaraman, 2004; Vinoj et al., 2007). This clearly confirms that local geographical features (i.e., altitude, distance of the study site from the coastline and size of the ice-free area) can significantly affect the AOT level and the range of its seasonal variation. An increase of the AOT up to 0.545 was documented during the third dust event on 18 March, which had the highest recorded PM10 and PM2.5 values. However, a major problem with AOT and LOAC data comparison in the Antarctic coastal areas was cloud cover and the fact that aerosol optical measurements can only be carried out during clear sky days. This reduced significantly the number of days suitable for comparison as well as possibilities to capture the dust event in the AOT observations.
Conclusion
Aerosol measurements in Antarctica are rare, especially for particles >1 μm. Most of the research on aeolian processes are concentrated to a few areas – the McMurdo Dry Valleys (e.g., Lancaster, 2002; Fortner et al., 2011; Šabacká et al., 2012), the Antarctic Peninsula (e.g., Artaxo and Rabello, 1992; Asmi et al., 2018), or at the edge of the continent (e.g., Weller et al., 2008; Chaubey et al., 2011; Budhavant et al., 2015). This study sheds new insight into aeolian transport in the eastern Antarctic Peninsula region. It relates the measured aerosol concentration to local atmospheric conditions and also to surface horizontal aeolian deposition.
A two-month summer campaign demonstrated that ice-free areas in Antarctica provide material supply, which is frequently suspended during high wind speed events. Over 15 dust events were measured with PM10 concentrations exceeding 20 μg m-3 and a maximum of up to 57 μg m-3. This study demonstrates that dust becomes suspended at wind speeds >10 m s-1 in the coastal zones of the largest ice-free area in the Antarctic Peninsula. Particles >20 μm can be lifted >3 m above surface and transported for long distances. Submicron particles do not contribute to increased PM concentrations during dust events, showing the predominance of coarse material available for suspension.
Our measurements show that PM10 concentrations on JRI are higher than in natural areas in the Northern Europe. Antarctica is an important HLD source contributing to the global dust budget, and more long-term measurements are needed to quantify how much material is transported. Local dust sources can play a significant role in the enrichment of Antarctic marine environment (Crusius et al., 2011), with iron as an important micronutrient in marine biota (Prospero et al., 2012). The uniquely large ice-free area of Ulu Peninsula has great potential for further study of aeolian processes.
Author Contributions
JK was responsible for the study design, field installation of LOAC, and writing and editing the manuscript. PD-W was responsible for interpretation of the results and partly writing the manuscript. JR processed the LOAC data and helped with interpretation of the results. KL and KA were in charge of wind properties + AOT measurements and preparation of the data also with contribution to the manuscript.
Funding
This work was in part funded by the Icelandic Research Fund (Rannis) Grant No. 152248-051; by the Czech Science Foundation project GC16-14122J and projects no. LM2015078, CZ.02.1.01/0.0/0.0/16_013/0001708; and the Masaryk University project MUNI/A/1251/2017. The LOAC instruments were funded by the French Labex VOLTAIRE. Field work was carried out with help of staff of the Johann Gregor Mendel Station.
Conflict of Interest Statement
The authors declare that the research was conducted in the absence of any commercial or financial relationships that could be construed as a potential conflict of interest.
Acknowledgments
We would like to thank Ewan O’Connor from the Finnish Meteorological Institute and Santiago Gassó from the NASA for providing us with supporting data. We also would like to thank to Yoav Y. Yair and Lucas Alados-Arboledas for useful comments and remarks during the review process. Many thanks also to Stephen Jennings for language corrections and improving the formal aspect of the paper.
Abbreviations
AOT, Aerosol Optical Thickness; HLD, high latitude dust sources; JGM, Johann Gregor Mendel Station; JRI, James Ross Island; LOAC, light optical aerosol counter; PM, particulate matter.
References
Ambrožová, K., and Láska, K. (2016). “The air temperature change on james ross island within the context of the Antarctic Peninsula,” in Proceedings of the Conference on Czech Geographical Society, 5-7 September 2016, ed. A. Novacek (Ceske Budejovice: Jihoceska univerzita).
Aristidi, E., Agabi, K., Azouit, M., Fossat, E., Vernin, J., Travouillon, T., et al. (2005). An analysis of temperatures and wind speeds above Dome C, Antarctica. Astron. Astrophys. 430, 739–746. doi: 10.1051/0004-6361:20041876
Arnalds, O., Olafsson, H., and Dagsson-Waldhauserova, P. (2014). Quantification of iron-rich volcanogenic dust emissions and deposition over the ocean from Icelandic dust sources. Biogeosciences 11, 6623–6632. doi: 10.5194/bg-11-6623-2014
Arnalds, O., Thorarinsdottir, E. F., Thorsson, J., Dagsson-Waldhauserova, P., and Agustdottir, A. M. (2013). An extreme wind erosion event of the fresh Eyjafjallajökull 2010 volcanic ash. Sci. Rep. 3:1257. doi: 10.1038/srep01257
Artaxo, P., and Rabello, M. L. C. (1992). Trace elements and individual particle analysis of atmospheric aerosols from the Antarctic Peninsula. Tellus B 44, 318–334. doi: 10.1034/j.1600-0889.1992.00010.x
Asmi, E., Neitola, K., Teinilä, K., Rodriguez, E., Virkkula, A., Backman, J., et al. (2018). Primary sources control the variability of aerosol optical properties in the Antarctic Peninsula. Tellus B Chem. Phys. Meteorol. 70:1414571. doi: 10.1080/16000889.2017.1414571
Atkins, C. B., and Dunbar, G. B. (2009). Aeolian sediment flux from sea ice into southern McMurdo sound, Antarctica. Global Planet. Change 69, 133–141. doi: 10.1016/j.gloplacha.2009.04.006
Ayling, B. F., and McGowan, H. A. (2006). Niveo-eolian sediment deposits in coastal South Victoria Land, Antarctica: indicators of regional variability in weather and climate. Arc. Antarct. Alp. Res. 38, 313–324. doi: 10.1657/1523-0430 (2006)38[313:NSDICS]2.0.CO;2
Ballantyne, C. K. (2002). Paraglacial geomorphology. Q. Sci. Rev. 21, 1935–2017. doi: 10.1016/S0277-3791(02)00005-7
BAS (2005). Antarctic Factsheet, Geographical Statistics. Available at: https://www.bas.ac.uk/wp-content/uploads/2015/05/factsheet_geostats_print.pdf
Basile, I., Grousset, F. E., Revel, M., Petit, J. R., Biscaye, P. E., and Barkov, N. I. (1997). Patagonian origin of glacial dust deposited in East Antarctica (Vostok and Dome C) during glacial stages 2, 4 and 6. Earth Planet. Sci. Lett. 146, 573–589. doi: 10.1016/S0012-821X(96)00255-5
Bockheim, J. (1995). Permafrost distribution in the southern circumpolar region and its relation to the environment: a review and recommendations for further research. Permafrost Periglacial Process. 6, 27–45. doi: 10.1002/ppp.3430060105
Bohuslavová, O., Macek, P., Redčenko, O., Láska, K., Nedbalová, L., and Elster, J. (2018). Dispersal of lichens along a successional gradient after deglaciation of volcanic mesas on northern James Ross Island, Antarctic Peninsula. Polar Biol. 41, 2221–2232. doi: 10.1007/s00300-018-2357-7
Bory, A., Wolff, E., Mulvaney, R., Jagoutz, E., Wegner, A., Ruth, U., et al. (2010). Multiple sources supply eolian mineral dust to the Atlantic sector of coastal Antarctica: evidence from recent snow layers at the top of Berkner Island ice sheet. Earth Planet. Sci. Lett. 291, 138–148. doi: 10.1016/j.epsl.2010.01.006
Bristow, C. S., Jol, H. M., Augustinus, P., and Wallis, I. (2010). Slipfaceless ‘whaleback’ dunes in a polar desert, Victoria valley, Antarctica: insights from ground penetrating radar. Geomorphology 114, 361–372. doi: 10.1016/j.geomorph.2009.08.001
Budhavant, K., Safi, P. D., and Rao, P. S. P. (2015). Sources and elemental composition of summer aerosols in the Larsemann Hills (Antarctica). Environ. Sci. Pollut. Res. 22, 2041–2050. doi: 10.1007/s11356-014-3452-0
Bullard, J. E. (2013). Contemporary glacigenic inputs to the dust cycle. Earth Surf. Process. Landf. 38, 71–89. doi: 10.1002/esp.3315
Bullard, J. E., and Austin, M. J. (2011). Dust generation on a proglacial floodplain, West Greenland. Aeolian Res. 3, 43–54. doi: 10.1016/j.aeolia.2011.01.002
Bullard, J. E., Baddock, M., Bradwell, T., Crusius, J., Darlington, E., Gaiero, D., et al. (2016). High-latitude dust in the Earth system. Rev. Geophys. 54, 447–485. doi: 10.1002/2016RG000518
Chaubey, J. P., Moorthy, K. K., Babu, S. S., and Nair, V. S. (2011). The optical and physical properties of atmospheric aerosols over the Indian Antarctic stations during southern hemispheric summer of the international Polar Year 2007–2008. Ann. Geophys. 29, 109–121. doi: 10.5194/angeo-29-109-2011
Chewings, J. M., Atkins, C., Dunbar, G., and Golledge, N. R. (2014). Aeolian sediment transport and deposition in a modern high-latitude glacial marine environment. Sedimentology 61, 1535–1557. doi: 10.1111/sed.12108
Crusius, J., Schroth, A. W., Gassó, S., Moy, C. M., Levy, R. C., and Gatica, M. (2011). Glacial flour dust storms in the Gulf of Alaska: hydrologic and meteorological controls and their importance as a source of bioavailable iron. Geophys. Res. Lett. 38:L06602. doi: 10.1029/2010GL046573
Dagsson-Waldhauserova, P., Arnalds, O., and Ólafsson, H. (2014). Long-term variability of dust events in Iceland (1949–2011). Atmos. Chem. Phys. 14, 13411–13422. doi: 10.5194/acp-14-13411-2014
Delmonte, B., Paleari, C. I., Andò, S., Garzanti, E., Andersson, P. S., Petit, J. R., et al. (2017). Causes of dust size variability in central East Antarctica (Dome B): atmospheric transport from expanded South American sources during marine isotope stage 2. Q. Sci. Rev. 168, 55–68. doi: 10.5194/acp-14-13411-2014
Elliot, C. (2003). Rock weathering processes in antarctica: a comparison of some recent studies with those from the Northern Hemisphere. N. Z. Geog. 59, 50–60. doi: 10.1111/j.1745-7939.2003.tb02113.x
Engel, Z., Nývlt, D., and Láska, K. (2012). Ice thickness, areal and volumetric changes of davies dome and whisky glacier (James Ross Island, Antarctic Peninsula) in 1979-2006. J. Glaciol. 58, 904–914. doi: 10.3189/2012JoG11J156
Fortner, S. K., Lyons, W. B., and Olesik, W. B. (2011). Eolian deposition of trace elements onto taylor valley Antarctic glaciers. Appl. Geochem. 26, 1897–1904. doi: 10.1016/j.apgeochem.2011.06.013
Fountain, A. G., Nylen, T. H., Monaghan, A., Basagic, H. J., and Bromwich, D. (2009). Snow in the McMurdo dry valleys, Antarctica. Int. J. Climatol. 30, 633–642. doi: 10.1002/joc.1933
Gadhavi, H., and Jayaraman, A. (2004). Aerosol characteristics and aerosol radiative forcing over Maitri. Antarct. Curr. Sci. 86, 296–304. doi: 10.1002/joc.1933
Ganor, E. (1975). Atmospheric Dust in Israel. Sedimentological and Meteorological Analysis of Dust Deposition. PhD. thesis, Hebrew University of Jerusalem, Israel.
Global Modeling and Assimilation Office. (2015). MERRA-2 tavg1_2d_slv_Nx:2d,1-Hourly, Time-Averaged, Single-Level, Assimilation, Single-Level Diagnostics V5.12.4. Greenbelt, MD: Goddard Earth Sciences Data and Information Services Center (GES DISC), doi: 10.5067/VJAFPLI1CSIV
Hedding, D. W., Nel, W., and Anderson, R. L. (2015). Aeolian processes and landforms in the sub-Antarctic: preliminary observations from Marion Island. Polar Res. 34:26365. doi: 10.3402/polar.v34.26365
Hrbáček, F., Vieira, G., Oliva, M., Balks, M., Guglielmin, M., de Pablo, M. A., et al. (2018). Active layer monitoring in Antarctica: an overview of results from 2006 to 2015. Polar Geogr. 41, 1–16. doi: 10.1080/1088937X.2017.1420105
Hugenholtz, C. H., and Wolfe, S. A. (2010). Rates and environmental controls of aeolian dust accumulation, Athabasca River Valley, Canadian rocky mountains. Geomorphology 121, 274–282. doi: 10.1016/j.geomorph.2010.04.024
Kavan, J., and Nývlt, D. (2018). “Blowing in the wind – where does the Antarctic fluvial suspended load come from?,” in Proceedings of the Polar 2018 – SCAR & IASC Conference, Davos. doi: 10.1080/04353676.2016.1257914
Kavan, J., Ondruch, J., Nývlt, D., Hrbáček, F., Carrivick, J. L., and Láska, K. (2017). Seasonal hydrological and suspended sediment transport dynamics in proglacial streams, James Ross Island, Antarctica. Geogr. Ann. 99, 38–55. doi: 10.1080/04353676.2016.1257914
King, J. C., and Turner, J. (1997). Antarctic Meteorology and Climatology. Cambridge: Cambridge University Press, 409.
King, J. C., Turner, J., Marshall, G. J., Connolley, W. M., and Lachlan-Cope, T. A. (2003). “Antarctic peninsula climate variability and its causes as revealed by analysis of instrumental records,” in Antarctic Peninsula Climate Variability: A Historical and Paleoenvironmental Perspective, eds E. W. Domack, A. Burnett, A. Leventer, P. Conley, M. Kirby, and R. Bindschadler (Washington, D.C: American Geophysical Union). doi: 10.1080/15230430.2002.12003500
Lancaster, N. (2002). Flux of eolian sediment in the McMurdo Dry Valleys, Antarctica: a preliminary assessment. Arct. Antarct. Alp. Res. 34, 318–323. doi: 10.1080/15230430.2002.12003500
Láska, K., Engel, Z., Nývlt, D., Stachoň, Z., Kavan, J., Smolíková, J., et al. (2018). Is the positive mass balance of north-eastern Antarctic peninsula glaciers persistent after 2015? Geophys. Res. Abstr. 20.
Lazzara, M. A., Keller, L. M., Markle, T., and Gallagher, J. (2012). Fifty-year Amundsen–Scott South Pole station surface climatology. Atmos. Res. 118, 240–259. doi: 10.1016/j.atmosres.2012.06.027
Lurton, T., Renard, J.-B., Vignelles, D., Jeannot, M., Akiki, R., Mineau, J.-L., et al. (2014). Light scattering at small angles by atmospheric irregular particles: modelling and laboratory measurements. Atmos. Meas. Tech.7, 931–939.
Marsz, A. A., and Styszyńska, A. (2000). “Główne cechy klimatu rejonu polskiej stacji antarktycznej,” in Antarktyka Zachodnia, Szetlandy Południowe, Wyspa Króla Jerzego, ed. H. Arctowskiego (Gdynia: WSM). doi: 10.1016/S1352-2310(00)00409-X
Mazzera, D. M., Lowenthal, D., Chow, J. C., Watson, J. G., and Grubisic, V. (2001). PM10 measurements at McMurdo station, Antarctica. Atmos. Environ. 35, 1891–1902. doi: 10.1016/S1352-2310(00)00409-X
McConnell, J. R., Aristarain, A. J., Banta, J. R., Edwards, P. R., and Simoes, J. C. (2007). 20th-Century doubling in dust archived in an Antarctic peninsula ice core parallels climate change and desertification in South America. Proc. Natl. Acad. Sci. U.S.A. 104, 5743–5748. doi: 10.1029/2001JD900103
Morys, M., Mims, F. M. III, Hagerup, S., Anderson, S. E., Baker, A., Kia, J., et al. (2001). Design, calibration, and performance of microtops II handheld ozone monitor and sun photometer. J. Geophys. Res. Atmos. 106, 14573–14582. doi: 10.1002/2015JD023304
Neff, P. D., and Bertler, N. A. N. (2015). Trajectory modeling of modern dust transport to the Southern Ocean and Antarctica. J. Geophys. Res. Atmos. 120, 9303–9322. doi: 10.1002/2015JD023304
Nylen, T. H., Fountain, A. G., and Doran, P. T. (2004). Climatology of katabatic winds in the McMurdo dry valleys, southern Victoria Land, Antarctica. J. Geophys. Res. 109:D03114. doi: 10.1029/2003JD003937
Pereira, K. C. D., Evangelista, H., Pereira, E. B., Simões, J. C., Johnson, E., and Melo, L. R. (2004). Transport of crustal microparticles from chilean patagonia to the Antarctic peninsula by SEM-EDS analysis. Tellus B 56, 262–275. doi: 10.3402/tellusb.v56i3.16428
Prospero, J. M., Bullard, J. E., and Hodgkins, R. (2012). High-latitude dust over the north atlantic: inputs from icelandic proglacial dust storms. Science 335, 1078–1082. doi: 10.1126/science.1217447
Putaud, J.-P., Van Dingenen, R., Alastuey, A., Bauer, H., Birmili, W., Cyrys, J., et al. (2010). A European aerosol phenomenology e 3: physical and chemical characteristics of particulate matter from 60 rural, urban, and kerbside sites across Europe. Atmos. Environ. 44, 1308–1320. doi: 10.1016/j.atmosenv.2009.12.011
Ramesh, K. J., and Soni, V. K. (2018). Perspectives of Antarctic weather monitoring and research efforts. Polar Sci. (in press). doi: 10.1016/j.polar.2018.04.005
Renard, J.-B., Dulac, F., Berthet, G., Lurton, T., Vignelles, D., Jégou, F., et al. (2016a). LOAC, a light aerosols counter for ground-based and balloon measurements of the size distribution and of the main nature of atmospheric particles, 1. Principle of measurements and instrument evaluation. Atmos. Meas. Tech. 9, 1721–1742. doi: 10.5194/amt-9-1721-2016
Renard, J.-B., Dulac, F., Berthet, G., Lurton, T., Vignelles, D., Jégou, F., et al. (2016b). LOAC, a light aerosols counter for ground-based and balloon measurements of the size distribution and of the main nature of atmospheric particles, 2. First results from balloon and unmanned aerial vehicle flights. Atmos. Meas. Tech. 9, 3673–3686. doi: 10.5194/amt-9-3673-2016
Renard, J.-B., Dulac, F., Durand, P., Bourgeois, Q., Denjean, C., Vignelles, D., et al. (2018). In situ measurements of desert dust particles above the western mediterranean sea with the balloon-borne light optical aerosol counter/sizer (LOAC) during the ChArMEx campaign of summer 2013. Atmos. Chem. Phys. 18, 3677–3699. doi: 10.5194/acp-18-3677-2018
Šabacká, M., Priscu, J. C., Basagic, H. J., Fountain, A. G., Wall, D. H., Virginia, R. A., et al. (2012). Aeolian flux of biotic and abiotic material in Taylor Valley, Antarctica. Geomorphology 15, 102–111. doi: 10.1016/j.geomorph.2011.12.009
Truzzi, C., Lambertucci, L., Illuminati, S., Annibaldi, A., and Scarponi, G. (2005). Direct gravimetric measurements of the mass of the antarctic aerosol collected by high volume sampler: PM10 summer seasonal variation at terra nova bay. Ann. Chim. 95, 867–876. doi: 10.1002/adic.200590099
van Lipzig, N. P. M., King, J. C., Lachlan-Cope, T. A., and van der Broeke, M. R. (2004). Precipitation, sublimation and snow drift in the Antarctic peninsula region from a regional atmospheric model. J. Geophys. Res. 109:D24106. doi: 10.1029/2004JD004701
Vinoj, V., Anjan, A., Sudhakar, M., Satheesh, S. K., Srinivasan, J., and Moorthy, K. K. (2007). Latitudinal variation of aerosol optical depths from northern Arabian Sea to Antarctica. Geophys. Res. Lett. 34:L10807. doi: 10.1029/2007GL029419
Weller, R., Wöltjen, J., Piel, C., Resenberg, R., Wagenbach, D., König-Langlo, G., et al. (2008). Seasonal variability of crustal and marine trace elements in the aerosol at neumayer station, Antarctica. Tellus B 60, 742–752. doi: 10.1111/j.1600-0889.2008.00372.x
Wiggs, G., Baird, A., and Atherton, R. (2004). The dynamic effects of moisture on the entrainment and transport of sand by wind. Geomorphology 59, 13–30. doi: 10.1016/j.geomorph.2003.09.002
Keywords: aerosol, surface wind, Antarctica, high latitude dust sources, atmospheric conditions, Antarctic Peninsula
Citation: Kavan J, Dagsson-Waldhauserova P, Renard JB, Láska K and Ambrožová K (2018) Aerosol Concentrations in Relationship to Local Atmospheric Conditions on James Ross Island, Antarctica. Front. Earth Sci. 6:207. doi: 10.3389/feart.2018.00207
Received: 30 July 2018; Accepted: 30 October 2018;
Published: 03 December 2018.
Edited by:
Gert-Jan Steeneveld, Wageningen University & Research, NetherlandsReviewed by:
Lucas Alados-Arboledas, Universidad de Granada, SpainYoav Yosef Yair, Interdisciplinary Center Herzliya, Israel
Copyright © 2018 Kavan, Dagsson-Waldhauserova, Renard, Láska and Ambrožová. This is an open-access article distributed under the terms of the Creative Commons Attribution License (CC BY). The use, distribution or reproduction in other forums is permitted, provided the original author(s) and the copyright owner(s) are credited and that the original publication in this journal is cited, in accordance with accepted academic practice. No use, distribution or reproduction is permitted which does not comply with these terms.
*Correspondence: Jan Kavan, jan.kavan.cb@gmail.com