Multi-Source Glacial Lake Outburst Flood Hazard Assessment and Mapping for Huaraz, Cordillera Blanca, Peru
 Holger Frey1*
  Christian Huggel1
  Rachel E. Chisolm2† Patrick Baer1† Brian McArdell3 Alejo Cochachin4 César Portocarrero5†
- 1Department of Geography, University of Zurich, Zurich, Switzerland
- 2Center for Research in Water Resources, University of Texas at Austin, Austin, TX, United States
- 3Mountain Hydrology and Mass Movements Research Unit, Swiss Federal Institute for Forest, Snow and Landscape Research (WSL), Birmensdorf, Switzerland
- 4Autoridad Nacional del Agua – Unidad de Glaciología y Recursos Hídricos (ANA-UGRH), Huaraz, Peru
- 5Área Glaciares, Instituto Nacional de Investigación en Glaciares y Ecosistemas de Montaña (INAIGEM), Huaraz, Peru
The Quillcay catchment in the Cordillera Blanca, Peru, contains several glacial lakes, including Lakes Palcacocha (with a volume of 17 × 106 m3), Tullparaju (12 × 106 m3), and Cuchillacocha (2 × 10⁶ m3). In 1941 an outburst of Lake Palcacocha, in one of the deadliest historical glacial lake outburst floods (GLOF) worldwide, destroyed large parts of the city of Huaraz, located in the lowermost part of the catchment. Since this outburst, glaciers, and glacial lakes in Quillcay catchment have undergone drastic changes, including a volume increase of Lake Palcacocha between around 1990 and 2010 by a factor of 34. In parallel, the population of Huaraz grew exponentially to more than 120,000 inhabitants nowadays, making a comprehensive assessment and mapping of GLOF hazards for the Quillcay catchment and the city of Huaraz indispensable. Here we present a scenario-based multi-source GLOF hazard mapping, applying a chain of interacting numerical models to simulate involved cascading mass movement processes. Susceptibility assessments for rock-ice avalanches and breach formation at moraine dams were used to define scenarios of different magnitudes and related probabilities, which are then simulated by corresponding mass movement models. The evaluation revealed, that (1) the three investigated lakes pose a significant GLOF hazard to the Quillcay Catchment and the city of Huaraz, (2) in some scenarios the highest hazard originates from the lake with the smallest volume (Cuchillacocha), and (3) current moraine characteristics of Lake Palcacocha cannot be compared to the situation prior and during the 1941 outburst. Results of outburst floods obtained by the RAMMS model were then converted into intensity maps and corresponding hazard levels according to national and international standards, and eventually combined into the GLOF hazard map for the entire Quillcay catchment, including the urban area of Huaraz. Besides technical aspects of such a multi-source model-based hazard mapping, special attention is also paid to approval and dissemination aspects in a complex institutional context. Finally, some general conclusions are drawn and recommendations are given, that go beyond the presented case of the Quillcay Catchment.
Introduction
Outburst floods of glacial lakes often involve cascades of interacting processes at, above, and below the lake (Richardson and Reynolds, 2000; Huggel et al., 2004b), posing particular challenges for the numerical modeling of such events (Worni et al., 2014; Mergili, 2016). Nevertheless, as glacier lake outburst floods (GLOFs) have the farthest potential reach among the various hazards in glacierized mountain regions, integrative hazard assessments of potentially critical glacier lakes are needed for efficient planning of effective disaster risk reduction measures.
Different components of the high mountain cryosphere have diverging response times to currently observed and projected future climatic changes. Glaciers are retreating worldwide and will largely disappear in mid and low latitudes during the coming decades (Huss and Hock, 2015; Zemp et al., 2015). At the same time new lakes are forming and growing behind moraine walls and in glacier bed depressions revealed by retreating glaciers (Gardelle et al., 2011; Linsbauer et al., 2015). On the other hand, permafrost degradation (Noetzli and Gruber, 2009; Haeberli et al., 2016) and de-buttressing of steep rock walls due to glacier retreat in the surrounding of such lakes are acting on century to millennia time scales (Fischer et al., 2010; McColl and Davies, 2013), leading to destabilized mountain flanks and increased availability of mobile loose material located above new and growing water bodies. In addition to the constantly changing environmental conditions, catastrophic events related to glaciers are often of a unique nature and not reoccurring, such as the failure of a dam, for instance. Therefore, the assessment of glacier related hazards cannot rely on historical records of past events. Potentially critical situations in high mountains, without historical precedence, thus, require scenario-based modeling approaches for the assessment of current and potential future hazards and risks (Schaub et al., 2013; Schneider et al., 2014; Allen et al., 2016). In GAPHAZ (2017), the Standing Group on Glacier and Permafrost Hazards (GAPHAZ) of the International Association of Cryospheric Sciences and International Permafrost Association (IACS/IPA) provides an overview of the related scientific state of the art together with recommendations for such quantitative hazard assessment and mapping.
The Cordillera Blanca in Peru is a global hot spot of high mountain hazards and risks. Extreme topography with peaks above 6,500 m a.s.l., extensive glaciation, a high number of glacier lakes, and the densely populated Santa Valley in close vicinity at its western foot result in a high-risk combination of vulnerable population and infrastructure directly exposed to high hazard potentials. Since 1941, this manifested in more than 30 glacier disasters in this mountain range, claiming more than 15,000 lives (Carey, 2005). Besides the catastrophic mass flows originating from Mount Huascaran in 1962 and 1970, with a death toll of about 7000 (Evans et al., 2009), the catastrophic outburst of lake Palcacocha, located above the regional capital of Huaraz, is to our knowledge the deadliest outburst event of a glacial lake in historic times. In December 1941 this GLOF destroyed about a third of the city of Huaraz and Independencia (hereafter only called Huaraz for convenience) and killed more than 1,800 people (Wegner, 2014). As a consequence of this disaster, a series of pioneer works in structural risk reduction measures at glacial lakes, such as lake volume control and dam reinforcements, have been implemented since the 1970s at more than 35 critical lakes in the Cordillera Blanca (Portocarrero, 2014; Emmer et al., 2016). In parallel, the high mountain environments of the Cordillera Blanca, including the Quillcay catchment above Huaraz with several glacial lakes, have undergone drastic changes. Since more than a decade, Lake Palcacocha along with two other glacial lakes in the Quillcay catchment pose again a significant threat to Huaraz and its population despite the implementation of remedial works, and requires new risk reduction measures.
In this paper we present a scenario-based elaboration of a GLOF hazard map for the entire Quillcay catchment, considering multiple hazard sources and using interacting numerical models in order to simulate involved chains of cascading processes. We illustrate how model results can be translated in a hazard map and also focus on institutional and practical aspects of disseminating this hazard map and related information to the potentially affected population, an important but challenging task in a context of low confidence and mistrust of the population toward governmental institutions and authorities (Carey, 2005, 2010; Carey et al., 2012).
Study Site
In 2003, glacier coverage in the Cordillera Blanca was reported to be between 530 km2 (ANA, 2014a) and 595 km2 (Racoviteanu et al., 2008), depending on the source, and 830 glacial lakes are registered in the national glacial lake inventory (ANA, 2014b). At the same time, half a million people in the Santa Valley live straight below these glacierized mountains in smaller settlements and larger towns like Caraz, Yungay, Carhuaz, or the city of Huaraz, the regional capital, with more than 120,000 inhabitants (Carey, 2005).
The Quillcay catchment, a sub-catchment of the Santa River basin, is located on the western flank of the Cordillera Blanca. It drains toward the city of Huaraz, where the confluence with the main Santa River is located. From northwest to southeast it can be further subdivided into the Cojup Valley with lake Palcacocha in its headwater, the Auqui Valley with the lakes Cuchillacocha and Tullparaju, and the minor Shallap Valley (Figure 1).
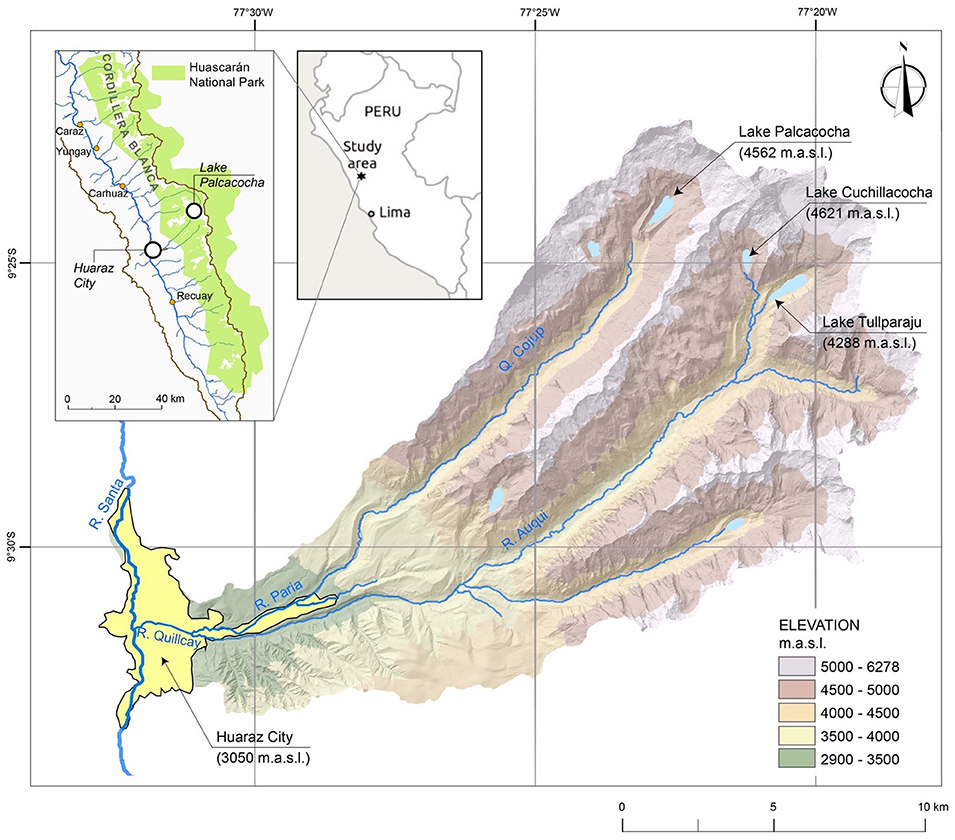
Figure 1. Location and overview of the Quillcay catchment in the Cordillera Blanca, Ancash region, Peru. (Modified after Somos-Valenzuela et al., 2016).
Based on aerial photography interpretations and topographic analyses, the volume of Lake Palcacocha before its outburst in 1941 is estimated to have been around 9 to 11 × 106 m3 (Vilímek et al., 2005). The trigger of the lake outburst event of 13 December 1941 is unclear; an impact of a larger ice or combined rock-ice avalanche is a likely explanation, considering the hanging glaciers in the steep faces of Mount Palcaraju (6,264 m a.s.l.) and Mount Pucaranra (6,156 m a.s.l.) straight above the lake (Vilímek et al., 2005; Emmer and Vilimek, 2014; Wegner, 2014). The overtopping water initiated retrogressive erosion at the moraine dam, leading to the formation of a breach and eventually draining Lake Palcacocha almost completely. After the outburst, a small lake with a volume of about 0.5 × 10⁶ m3 remained at the bottom of the valley, dammed by a younger, 8 m high moraine wall, with a lake level at about 47 m below pre-outburst conditions (Vilímek et al., 2005). In the 1970s the lake level was stabilized by installing a drainage pipe and the drainage channel was capped by an 8-m artificial dam. At the same time the secondary natural outflow at the right side of the moraine dam was reinforced in order to prevent erosion in case of overtopping displacement waves (Portocarrero, 2014). Since the 1990s, accelerated glacier retreat led to a strong increase of lake area and volume. In 2009 a bathymetric survey revealed a lake volume of more than 17 × 106 m3 (ANA, 2014b), i.e., an increase by a factor of 34 within <20 years (Figure 2).
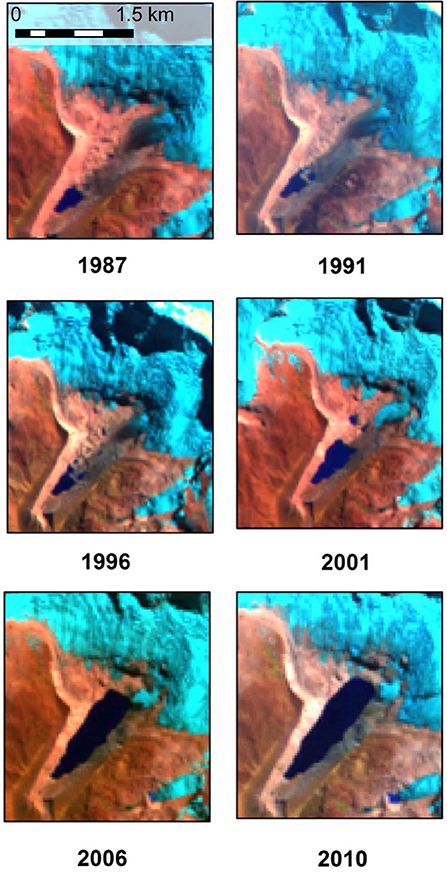
Figure 2. Satellite imagery documenting the evolution of Lake Palcacocha from 1987 to 2010. Glacier ice is shown in cyan, rock and debris in orange, and water in dark blue. The lake volume increased from about 2 × 10⁶ m3 in 1987 to 17 × 106 m3 in 2010. Images acquired by Landsat 5 (1987, 1991, 1996, and 2001) and Landsat 7 (2006 and 2010), all scenes from July or August.
In parallel to this extreme increase in lake volume, the city of Huaraz has undergone an enormous growth since the GLOF disaster in 1941, despite the destructions of large parts of the city by the Ancash Earthquake in 1970. According to census data from the National Statistical Institute (INEI), the population of Huaraz grew from <20,000 inhabitants in 1941 to more than 127,000 inhabitants in 2015 (INEI, 2015). This strong growth of the population can be used as a rough proxy for the increase in damage potential in the form of population and urban infrastructure located in the city of Huaraz, in the trajectories of potential outburst floods of glacial lakes.
Besides Lake Palcacocha, four other glacial lakes are located in the Quillcay catchment: Cuchillacocha, Tullparaju, Churup, and Shallap (from north to south). Due to their considerable hazard potential for the city of Huaraz, besides Lake Palcacocha, structural hazard mitigation measures have been undertaken as well at Lakes Cuchillacocha (2 × 10⁶ m3) and Tullparaju (12 × 106 m3) (ANA, 2014b, cf. Figure 1). These works include lake level lowering and stabilization by the construction of artificial drainage channels, capped by artificial dams reinforcing the natural moraine dams and ensuring a fixed freeboard (Portocarrero, 2014). All three lakes are considered for the hazard assessment and mapping presented here. Such a multi-source assessment of GLOF hazards considering different lakes of a catchment rather than a single lake, run though from a susceptibility assessment down to the final hazard mapping has to our knowledge so far not been done for any catchment worldwide. Schneider et al. (2014) presented a GLOF hazard map for the Chucchún catchment and the city of Carhuaz, located 30 km north of Huaraz. They applied a series of compatible numerical models to simulate the chain of involved processes. Somos-Valenzuela et al. (2016) applied a similar approach to Lake Palcacocha. Results of this study are also considered here as a reference and for model comparison.
Methods
Hazard assessments in general rely on the determination of (i) the probability of occurrence of a potential event and (ii) intensities of involved processes at a given point in space (UNISDR, 2009). Generally, these two components of hazard are determined either by historical data or scientific analyses. Due to the characteristics of glacier related hazards as outlined above, (i) should rely on scenarios of potential events, rather than historical records of past events. Despite the outburst in 1941, this is also true for Lake Palcacocha, where current conditions cannot be compared to the setting prior to the 1941 event, as the pre-1941 dam was destroyed by the formation of the dam breach, and the lake after 1941 until today has been dammed by a younger moraine with a different geometry and geotechnical characteristics (Vilímek et al., 2005; Somos-Valenzuela et al., 2016). Numerical models for the simulation of the involved processes can be applied to evaluate and quantify (ii), spatially distributed intensities of potential events. Hence, a scenario-based hazard assessment approach using interacting numerical models, was applied here as described below for the hazard mapping of the three lakes Palcacocha, Tullparaju, and Cuchillacocha.
Scenario Definitions
Considering past events at Lake Palcacocha and other glacial lakes in the Cordillera Blanca and taking into account structural remedial safety measures at all three lakes, the only potential outburst triggers are major ice or combined rock-ice avalanches impacting a glacial lake. The definition of GLOF scenarios therefore included (1) the identification of potential detachment zones for ice or rock-ice avalanches, and (2) the determination of involved avalanche volumes for the three scenarios to be modeled. For this, a susceptibility assessment similar to the approach presented by Schaub et al. (2015) was performed, based on analyses of glacier topography, crevasse patterns, and traces of recent avalanches combined with rough estimates of ice thicknesses. In view of displacement waves causing overtopping at the dam, impact directions parallel to the longitudinal axes of the lakes, i.e., perpendicular to the dam orientations, constitute the most unfavorable constellation, as the main kinetic energy from the avalanche impact is directed straight to the dam.
Since a definition of return periods is virtually impossible due to the lacking information of the frequency-magnitude relation of such avalanches (Schneider et al., 2014; GAPHAZ, 2017), only qualitative probabilities of occurrence (high, medium, low) were assigned to the three different magnitudes of the scenarios (small, medium, large, respectively) (Raetzo et al., 2002). For the evaluation of avalanche volumes for the three scenarios, current glacier surface geometry, topography, and crevasse patterns were analyzed. Average ice-thicknesses of hanging glaciers were assumed to be 20 to 40 m, according to on-site observations of exposed ice cliffs and evidences from recent ice avalanches in the Cordillera Blanca (cf. Schaub et al., 2015). For the determination of total avalanche volumes, it has to be taken into consideration that considerable volumes of underlying bedrock material, potentially under (warm) permafrost conditions (cf. Carey et al., 2012; Schneider et al., 2014), might be incorporated in a combined rock-ice avalanche. Corresponding total volumes were also set in relation to other comparable events as reported from around the world (Schneider et al., 2011). Avalanche volumes of the medium scenarios eventually were set in between the volumes of the large and small scenario, according to the topographic situation and geometry of the respective detachment zones.
The avalanches described above are the initial triggers of a chain of processes eventually leading to a GLOF. The only other process which needs to be evaluated separately in terms of a scenario, is the susceptibility of the involved moraine dams for breach formation. All other processes involved in the cascade of GLOF related mass movements are directly determined by the characteristics of these initial avalanches and therefore are not further considered in the definition of scenarios.
Numerical Modeling of Mass Movement Process Chains
Numerical modeling of cascading chains of mass movements is a relatively new field of research. There are models aiming at the integration of the different involved processes into single model frameworks (e.g., Mergili et al., 2017, 2018). Here, an approach to combine different models of the individual processes into a compatible model chain was chosen, using model results as input for subsequent modeling (Schneider et al., 2014; Westoby et al., 2014; Worni et al., 2014). For each scenario, the entire process chain of avalanche, displacement wave, and overtopping, down to the eventual outburst flood, was simulated (Figure 3, top).
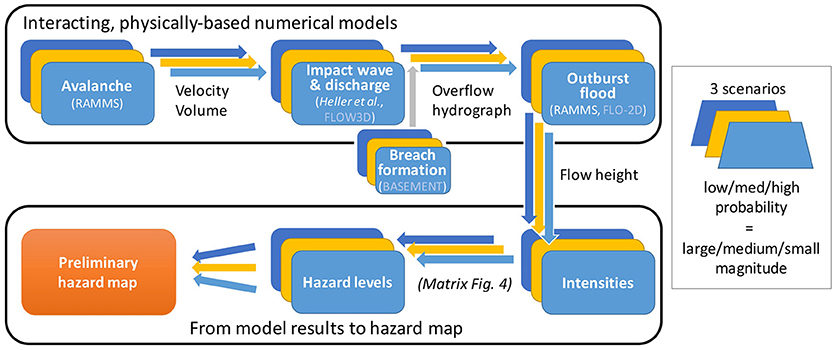
Figure 3. Chain of involved interacting processes and numerical models applied to each of the three scenarios. Each set of boxes corresponds to a process and related numerical models (in brackets). Italic model names represent empirical approaches, models that were not directly applied in this study in transparent letters. Arrows indicate results from the previous models that are used as input for the subsequent model. Breach formation, i.e., the evaluation of dam stability, is only applied to moraine dammed glacial lakes. Cf. matrix in Figure 4 for details of the translation of model results to hazard levels (bottom part of the chart).
Ice and rock-ice avalanches were modeled using the RAMMS model (Christen et al., 2010). This model is based on the 2-D shallow water equations, using a Voellmy approach incorporating a dry Coulomb friction μ and a turbulent friction ξ (Bartelt et al., 1999) and has been successfully applied to the simulation of large ice and rock-ice avalanches all around the world (Schneider et al., 2010, 2014; Worni et al., 2014), including the simulation of potential avalanches impacting Lake Palcacocha (Somos-Valenzuela et al., 2016).
Different hydrodynamic models are available for physically-based simulations of impact wave generation and propagation, and run-up height calculations at the dam. Such models include, for instance, IBER (IBER, 2010) or FLOW3D (Flow Science, 2012). Such models require 3D topographical information of the lake bathymetry, which was available for the three lakes investigated here from the Glaciology and Water Resources Unit of the Peruvian National Water Authority (Unidad de Glaciología y Recursos Hídricos, UGRH; Autoridad Nacional del Agua, ANA). However, besides bathymetry, these hydrodynamic models as well need a large number of parameters to be defined, typically not available for specific glacial lakes, implying considerable uncertainties, as discussed by Schneider et al. (2014) for the modeling of the displacement wave at Lake 513 with IBER. Somos-Valenzuela et al. (2016) applied FLOW3D to lake Palcacocha, replacing the impacting avalanche by a corresponding mass of water.
Empirically-based approaches for engineering purposes provide a valuable alternative to the above mentioned hydrodynamic models. Heller et al. (2009) provide a manual with a suite of equations allowing for the estimation a large variety of parameters of displacement waves in reservoirs generated by impacting landslide processes. Schneider et al. (2014) used Heller et al.'s 2009 approach for the calibration of the IBER model. Also Somos-Valenzuela et al. (2016) compared their FLOW3D results to Heller et al. (2009) estimates and concluded that FLOW3D is possibly overestimating wave height. In a more recent study Chisolm and McKinney (2018) further investigated the impact waves at Lake Palcacocha and came to a closer agreement of 3D modeling results and the empirical relations, but still with larger wave heights indicated by the numerical models. In this study, equations from Heller et al. (2009) were used to estimate wave heights, run-up heights at the dam, and overtopping volumes. Resulting hydrographs, which were later used as input for the GLOF modeling, were estimated based on overtopping volumes from the Heller et al. (2009) equations and typical durations of overtopping waves as simulated by the hydrodynamic models mentioned above. Furthermore, historical analyses of landslide and avalanche impacts on lakes revealed that in case of an impacting mass >10% of the lake volume, complete drainage of the lake is possible (Huggel et al., 2004a). This had to be considered in particular for Lake Cuchillacocha, with its relatively small volume compared to potential avalanches occurring form a hanging glacier straight above the lake.
Besides overtopping, such as typically observed for lakes with solid rock dams, it is important to evaluate the stability of moraine dams and to assess their susceptibility to the formation of a breach due to retrogressive erosion, which can increase the total flood volume dramatically compared to the volume of the overtopping wave, such as seen, for instance, during the 1941 outburst of lake Palcacocha. BASEMENT is a software able to simulate the erosional processes involved in the formation of a breach at a moraine dam (Worni et al., 2012; Vetsch et al., 2018). Somos-Valenzuela et al. (2016) applied BASEMENT to the dam of Lake Palcacocha; here we draw on the related findings from this study and adopt them to the other two lakes Tullparaju and Cuchillacocha.
For the final modeling of resulting lake outburst floods, again the RAMMS debris flow module was applied. RAMMS also in the past had been successfully applied to modeling of large debris flows (Hussin et al., 2012; Scheidl et al., 2013; Schraml et al., 2015) and GLOF modeling (Schneider et al., 2014; Frey et al., 2016). GLOFs typically undergo several flow type transformations along their trajectory, depending on slope, material, and water availability (Worni et al., 2012; Schneider et al., 2014; GAPHAZ, 2017). This was taken into account by using a RAMMS version allowing for the incorporation of erosional processes within predefined zones. These zones were defined based on field evidences of such flow type changes from the Palcacocha 1941 outburst and relating them to surface slope inclinations.
For both the avalanche and GLOF modeling, a LIDAR digital elevation model (DEM) from 2010 with 5 m spatial resolution, provided by the Peruvian Ministry of the Environment (Ministerio del Ambiente, MINAM) could be used.
Hazard Mapping Based on Numerical Model Results
For translating the GLOF modeling results into a hazard map (cf. lower panel of Figure 3), in a first step the spatially distributed GLOF flow heights for each of the three scenarios were translated to GLOF intensities. To do so, thresholds of modeled GLOF flow heights were set according to existing debris flow intensity definitions from Hürlimann et al. (2006) and Raetzo et al. (2002): High intensity corresponds to areas where maximum GLOF flow heights exceed 1 m, medium intensity corresponds to areas with maximum flow heights of <1 m. Low intensity does by definition not exist for debris flows. Then, in a second step, resulting GLOF intensities of each scenario were translated into hazard levels, according to the probability of occurrence (low, medium, high) of the respective scenario (cf. Figure 4).
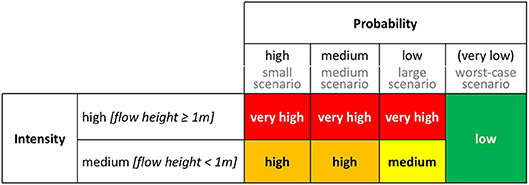
Figure 4. Matrix of hazard levels based on probability and intensity. Intensity levels are based on modeled flow heights; probability levels correspond to the different scenarios. The four hazard levels low, medium, high, and very high and related colors correspond to the Peruvian national standards.
The applied hazard classification matrix is based on three hazard levels, as used in different countries, including Switzerland (Raetzo et al., 2002). However, Peruvian national standards, determined by the National Center for Disaster Risk Estimation, Prevention, and Reduction (Centro Nacional de Estimación, Prevención y Reducción del Riesgo de Desastres, CENEPRED), consider four hazard levels (CENEPRED, 2015). In order to meet these national standards, the low hazard level was assigned to areas potentially affected by an extremely low probability, but possibly high impact event. With this modification of the hazard level matrix, a worst-case scenario could be included in the hazard assessment and mapping. This helped to reduce uncertainties induced by the scenario definitions significantly, as the formation of a dam-breach is still reflected in the resulting hazard map, although based on the moraine dam stability modeling it was excluded from the three main scenarios.
Results
Scenarios
Detachment zones of the different avalanche scenarios are shown in Figure 5. For Palcacocha (P) and Cuchillacocha (C) one detachment zone was considered (Somos-Valenzuela et al., 2016 used the same detachment zone for their modeling study at Palcacocha). For Tullparaju two situations were taken into account, as a smaller avalanche from the eastern part of the glacier (T2 in Figure 3) might cause a similar wave at the dam as a larger avalanche from the western detachment zone (T1), due to the different impact angles of the avalanche trajectories compared to the longitudinal lake axis of the lake.
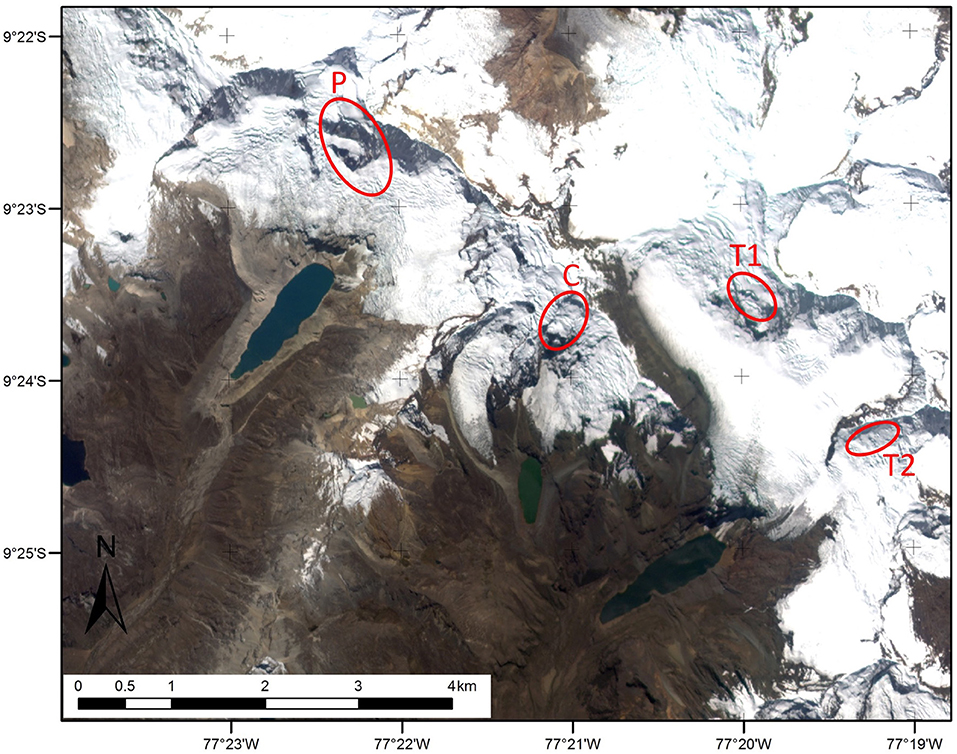
Figure 5. Release areas of modeled ice or rock-ice avalanches. P, Palcacocha avalanche; C, Cuchillacocha avalanche; T1, Tullparaju west avalanche; T2, Tullparaju east avalanche. Background: RapidEye scene from 14 July 2012.
Avalanche volumes for the three scenarios for each of the four detachment zones are given in Table 1. Volumes for the small scenario were defined based on experiences from the 1991 and 2010 avalanches at Mount Hualcán (Carey et al., 2012; Schneider et al., 2014; Schaub et al., 2015). Volumes of the large scenarios correspond to worst-case estimates, reaching volumes of up to 3 × 10⁶ m3 for the detachment zones above Palcacocha (P in Figure 5), and Tullparaju (T1 in Figure 5) based on potentially unstable parts of steep hanging glacies with areas of about 500,000 m2 and depths of 60 m (including ice and bedrock). For the medium scenario values in between the small and the large scenarios were chosen, based on the site specific topographic characteristics of involved hanging glaciers. For the Palcacocha avalanches, avalanche scenarios were defined in agreement with the scenarios used by Somos-Valenzuela et al. (2016).
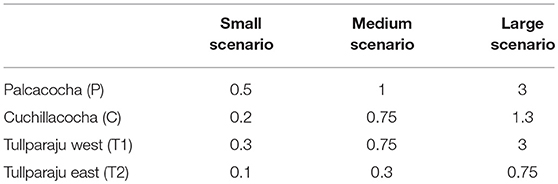
Table 1. Volumes of rock-ice avalanche scenarios (in 106 m3).
Numerical Modeling
Avalanche Simulations
Friction parameters for the RAMMS avalanche simulations were set to μ = 0.12 (dry Coulomb) and ξ = 1,000 m s−1 (turbulent), according to Schneider et al. (2014) and Somos-Valenzuela et al. (2016). At Cuchillacocha all three scenarios reach the lake, in the medium and large scenario the impacting avalanche volume is larger than 10% of the lake volume (impacting avalanche volume >200,000 m3; lake volume 2 × 10⁶ m3), which is important for lake drainage considerations (cf. above and below). The small avalanche scenario from the Tullparaju west detachment zone (T1 in Figure 5) does not reach the lake but stops in the flat glacier part between the peak and the lake. All other avalanche scenarios from the two detachment zones at Tullparaju reach the lake. Figure 6 shows maximum flow heights of the RAMMS modeling of the large avalanche scenarios at Tullparaju. It can also be seen, that besides impact volume, also impact direction plays a crucial role for the determination of potential overtopping at the dam. For Palcacocha results were identical to Somos-Valenzuela et al. (2016).
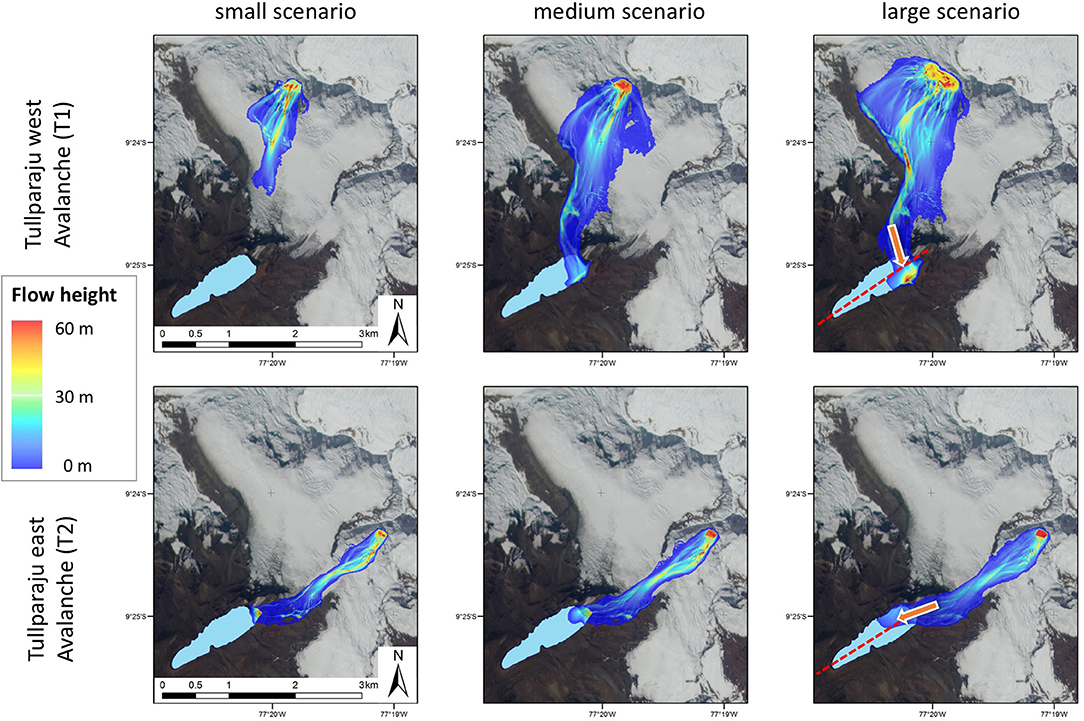
Figure 6. RAMMS results of the three scenarios for avalanches from the two detachment zones above Lake Tullparaju (T1 and T2 in Figure 5). Note the angle between the impact direction (orange arrow) and the longitudinal axis of the lake (dashed red line) in the two panels for the large scenarios (right). Background: RapidEye scene from 14 July 2012.
Impact Wave
Based on results from the RAMMS avalanche modeling, impact wave properties were estimated based on Heller et al.'s 2009 equations. Mass and angles of the impacting avalanche were extracted from RAMMS results and the DEM, density was set to 1,000 kg m−3, such as applied as well by Schneider et al. (2014) and Somos-Valenzuela et al. (2016). Geometrical properties of the reservoir and the dam were extracted from the bathymetric data, the DEM and topographic surveys, all provided by ANA. Evaluated wave parameters included HM, maximum wave height in the reservoir; R, run-up height at the dam (typically R is larger than HM); and V, the overtopping volume per unit length at the dam crest (in case R is higher than the freeboard F). Table 2 gives an overview of the estimated impact wave characteristics of the different avalanche scenarios for the three lakes.
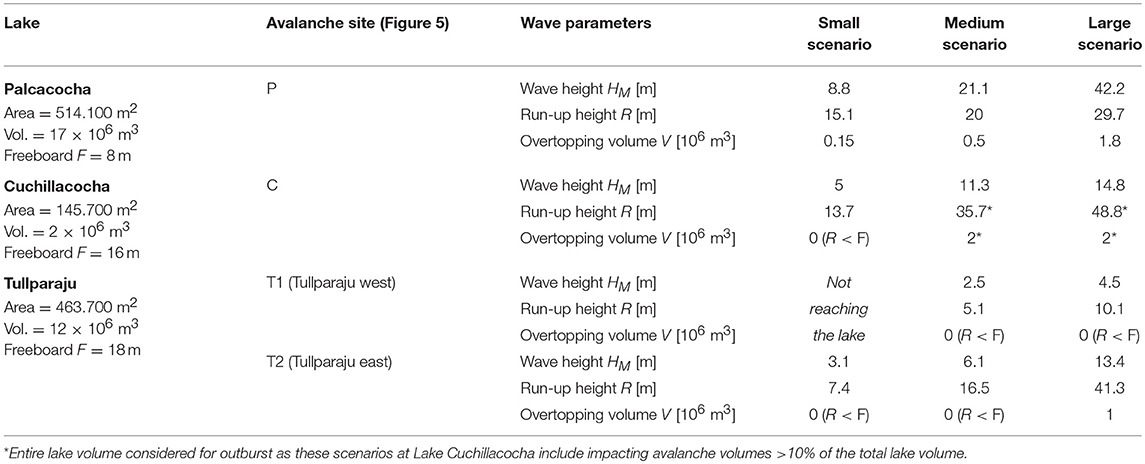
Table 2. Wave characteristics according to Heller et al. (2009) for the four avalanche sites, cf. Figure 5. Overtopping only occurs if wave run-up height R > Freeboard F. Lake characteristics according to ANA (2014b) and Portocarrero (2014).
It is noteworthy that none of the Tullparaju west (T1) scenarios result in overtopping at the dam, despite the much larger avalanche volumes compared to the Tullparaju east (T2) avalanches. The reason for this is the impact direction of the avalanche trajectories which in the case of the T1 avalanches are almost perpendicular to the longitudinal axis of the lake, as indicated in Figure 6. This leads to very high run-up height at the proximal moraine opposite to the impact, but much lower wave and run-up heights in the direction of the dam. For Cuchillacocha, both the medium and large scenarios lead to significant overtopping. However, due to the relatively small lake volume compared to the impacting avalanche mass, according to Huggel et al. (2004a), even complete drainage of the lake has to be considered for these two scenarios. Thus, both for the medium and the large scenario, the overtopping volume corresponds to the lake volume (2 × 10⁶ m3, cf. Table 2). This is remarkable, as—at least for the medium scenario—the highest GLOF volume originates from the smallest lake, which is contradicting assessment schemes that consider lake area as a criterion for hazard level determination.
Moraine Dam Stability
A detailed analysis of the susceptibly for breach formation with BASEMENT by Somos-Valenzuela et al. (2016) revealed that breach form at the moraine dam of Lake Palcacocha is very unlikely. For the large scenario, the simulation indicates significant erosion at the distal face of the dam, nevertheless the back-propagating of the erosion is not enough to reach the lake and thus form a breach. This result is based on the assumption of unfavorable, worst-case setting of related soil parameters (i.e., most favorable for erosion) (Somos-Valenzuela et al., 2016). Dam conditions at Lake Tullparaju are much more stable than at Lake Palcacocha, due to the predominance of clayish material that has a much higher resistance against erosion (Portocarrero, 2014). Given this, in combination with the much higher freeboard of the Tullparaju dam, breach formation is considered to be even more unlikely at the Tullparaju moraine than at Lake Palcacocha, and thus was not further considered here. For Lake Cuchillacocha, as mentioned above, drainage of the complete lake by overtopping was considered for the medium and large scenario due to the high avalanche impact volume compared to the lake volume, making a more detailed stability assessment of the dam obsolete.
To take uncertainties related to these evaluations into account and reflect them in the hazard map, an additional very low probability scenario has been considered, complementing the three scenarios defined and described above (section Scenarios). This scenario consists of the combination of the large avalanche scenario followed by the formation of a dam breach at Lake Palcacocha (cf. Somos-Valenzuela et al., 2016; Figure 4 above and section Hazard map below).
Outburst Flood Modeling
GLOF volumes have been determined based on overtopping volumes as described in Table 2. Eventual GLOFs have been modeled using the RAMMS debris flow module allowing for taking erosional processes into account. In this RAMMS version, sections of the mass movement trajectory can be selected, where erosion is considered by the model, and others where this is not the case. Traces of the 1941 Palcacocha outburst still visible in the field provide evidence for flow type transformations related to changes of the erosional regime: Erosion took place mainly in the breach of the moraine, but the eroded material was mainly deposited within several hundred meters below the dam. Then, in the relatively flat Cojup Valley no erosional traces are visible, supposing a hyperconcentrated flow of mainly water with only fine-grained sediment. After having washed away Lake Jircacocha on its way (Vilímek et al., 2005), erosion took place again at the lower mouth of the Cojup Valley, about 10 km upstream of the city of Huaraz, where surface slopes increase again. Field visits and comparisons of flow type evidences from the 1941 outburst to surface slope inclinations revealed that erosion occurred mainly on river sections with slopes of more than 10%. An analysis of the longitudinal valley profiles shows the characteristic shape of a first short but steep section straight blow the lakes, followed by a long and flat valley, and then again an increase in surface slope in the section between the lower mouths of the Cojup and Auqui valleys and the city of Huaraz (Figure 7). Thus, erosion was considered for the modeling in regions with an overall slope of more than 10%, indicated by the gray rectangle in Figure 7, and frictional parameters were set accordingly to simulate a viscous debris flow (μ = 0.08 and ξ = 500 m s−1) in these steeper regions, whereas for less inclined sections, i.e., the relatively flat valley floors below the lakes, erosion was neglected and friction parameters were set according to a hyperconcentrated flow with relatively high amounts of liquid water (μ = 0.04 and ξ = 500 m s−1) (cf. Schneider et al., 2014). Resulting maximum flow heights for the large GLOF scenarios from Lakes Palcacocha and Tullparaju are shown in Figure 8.
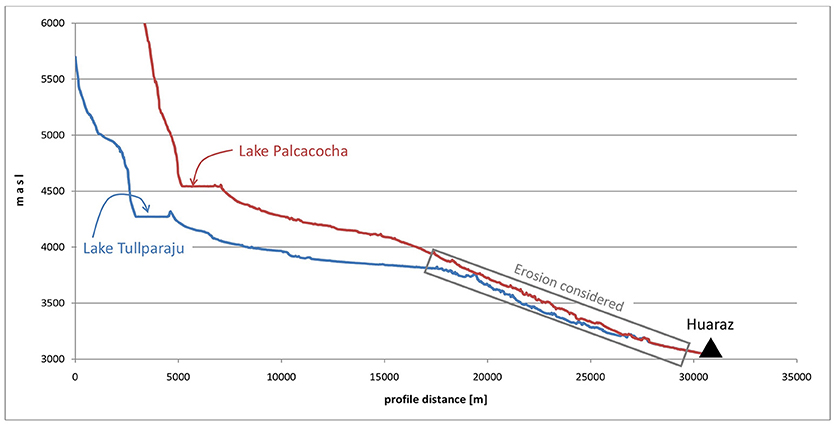
Figure 7. Longitudinal profiles of the Cojup Valley (red) with Lake Palcacocha and the Auqui Valley (blue) with Lakes Tullparaju (and Lake Cuchillacocha, not on the profile line). Note the flat sections (Pampas) below the lakes in both valleys. In the steeper sections, directly about the city of Huaraz, indicated by the gray rectangle, erosion is considered in the GLOF modeling.
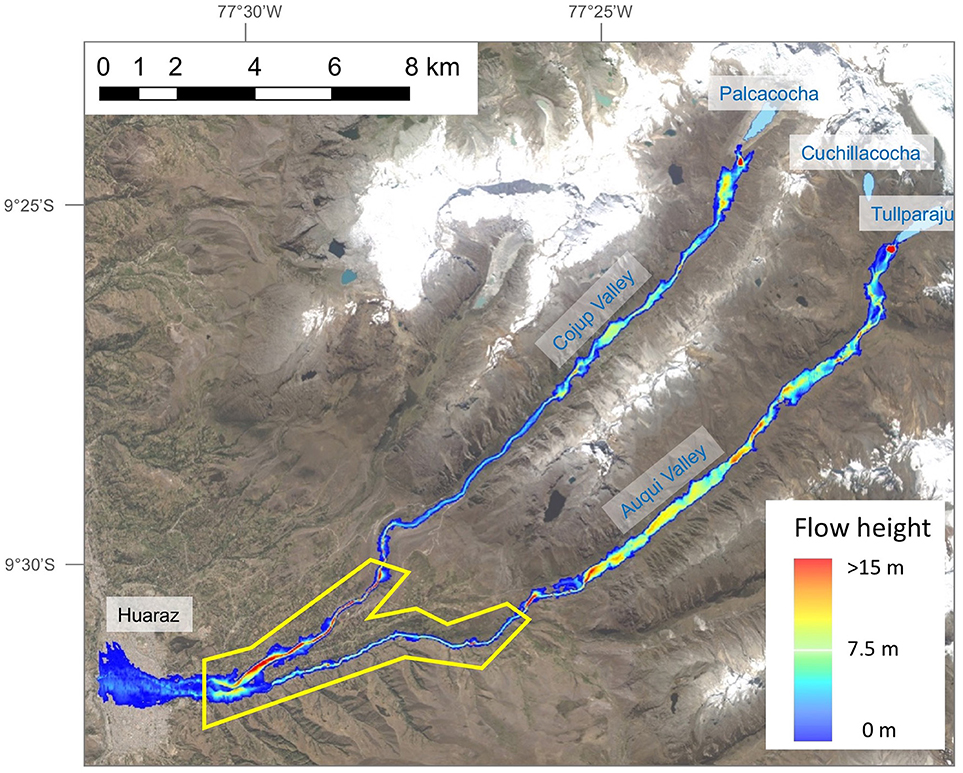
Figure 8. Combined results (maximum flow height) of GLOF model runs with RAMMS for the large outburst scenarios of Lakes Palcacocha and Tullparaju. The yellow polygon indicates the zone of steeper slopes (cf. gray rectangle in Figure 7), where frictional parameters of a viscous debris flow were chosen and erosion was considered in simulations with RAMMS. For other areas, no erosion was considered and frictional parameters of a hyperconcentrated flow were chosen. Background: RapidEye scene from 14 July 2012.
Hazard Map
Maximum flow heights of the three lakes investigated were combined for each of the three scenarios. In cases of two or more overlapping outburst trajectories (e.g., below the dams of Lakes Cuchillacocha, and Tullparaju, and at the confluence of the Auqui and the Cojup Rivers), the highest value within each DEM pixel was considered for the combined maximum flow height maps of each scenario. These maximum flow height maps were then translated into intensity maps for each scenario, according to the threshold of 1 m flow height. Then, the intensity maps for each scenario were converted into hazard maps for each scenario, according to the probability of occurrence of the different scenarios (cf. Figure 4). Finally, these three hazard maps were combined into the preliminary, raw hazard map by selecting the highest hazard level within the tree scenarios for each DEM pixel, such as illustrated in Figure 3.
In Peru, hazard maps consist of four hazard levels, according to CENEPRED (2015). Here, GLOF modeling results of the three scenarios were translated into the three hazard levels medium, high, and very high (cf. Figure 4). In order to meet this national standard of four hazard levels and to take into consideration, an additional unlikely but not entirely impossible worst-case scenario of a breach formation at Lake Palcacocha (cf. section Moraine Dam Stability) was considered as well. In contrast to the three regular scenarios, maximum flow height results of this worst-case scenario were not translated into intensity maps, but a low hazard level was assigned to the entire area potentially affected in such a scenario. This on the one hand takes into account the extremely low probability of such a breach formation (cf. Somos-Valenzuela et al., 2016), but on the other hand eliminates uncertainties that would be induced when completely neglecting this worst-case scenario. In other hazard mapping standards, as for instance the Swiss system, such extreme events with very low probabilities of occurrence but high potential impacts are often translated into a so-called residual hazard.
For obtaining the final hazard map, the raw hazard map was generalized according to cartographic generalization rules, i.e., simplifying polygons of the same hazard level, eliminating isolated pixels and filling small holes and thus converting the speckled “raw” map in continuous and contiguous map (cf. Figure 9). This resulted in a model-based hazard map of multi-source GLOF hazards for the entire Quillcay catchment. An excerpt of the urban area of Huaraz of this map is shown in Figure 9, green areas (low hazard) correspond to areas only affected in case of a dam breach at Lake Palcacocha, see above and Figure 4.
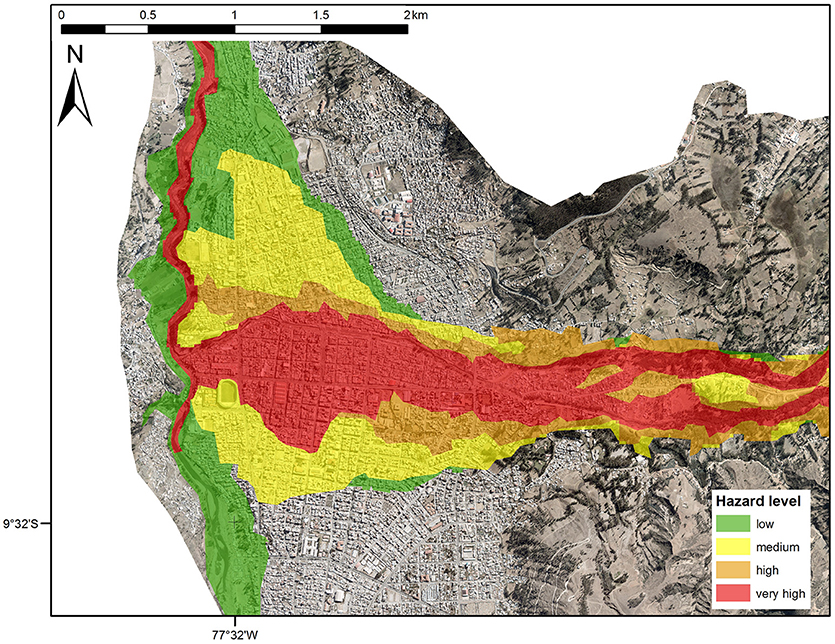
Figure 9. Excerpt of the final hazard map for the urban area of Huaraz. Hazard levels and related colors according to the Peruvian national standards defined by CENEPRED.
Institutional Aspects and Dissemination
The assessment of multiple GLOF hazards and the development of a hazard map was part of a larger institutional process. In response to imminent GLOF hazards from lake Palcacocha an interinstitutional commission of responsible authorities and technical expert institutions was formed, consisting of representatives of the Municipalities of Huaraz, and Independencia with their Civil Defense departments, the regional Ancash government, technical government institutions including ANA and INAIGEM (Instituto Nacional de Investigación en Glaciares y Ecosistemas de Montaña), the National Park Huascarán, NGO's (CARE and the Mountain Institute), and international scientific experts from the University of Zurich and University of Texas. The lead was with the Mancomunidad Waraq, an administrative association between the two municipalities of Huaraz and Independencia that promotes climate change adaptation and risk management.
This commission mandated the technical local and international institutions to develop this GLOF hazard map for Huaraz for GLOF hazards in the Quillcay catchment. The approval process of hazard maps is in principle defined by CENEPRED but in practice still considerable doubts and missing clarity prevails. Specifically, it is not sufficiently clear whether a technical institution competent in the respective field can approve the hazard map or whether this role is taken in a centralized way by CENEPRED. In the first case questions are raised that a single institution cannot be both judge and judged at the same time, i.e., a technical institution would be mandated to develop the hazard map and would then validate and approve their own work.
In our case the hazard map was approved by the inter-institutional commission. One of the critical issues in this respect is the purpose of the hazard map. For Quillcay, the hazard map was found to be appropriate as a basis for evacuation plans and procedures, including early warning, but not for detailed urban land-use planning. This is due to the lack of consideration of high-resolution urban topography and in particular the effects of built structures (houses, roads, etc.) on GLOF flow dynamics. A follow-up process was foreseen to develop a high-resolution hazard map apt to urban planning.
Communication of hazards and risks to the population is a critical but fundamentally important task, in particular when considering the context of mistrust by the local population in authorities, governments, and technical experts (Carey, 2005). The dissemination of the hazard map to local population was implemented by the municipalities of Huaraz and Independencia and the NGO CARE. For this purpose, a leaflet was produced (Figure 10), containing a catchment-scale hazard map and a popular illustrative cartoon explaining the process and purpose of a hazard map, indicating what to do in case of emergency and a self-evaluation of how well prepared the own family is for GLOF emergencies. A second dissemination product was an evacuation map for which the hazard map formed the basis. The evacuation map indicated the main routes of evacuation in case of a GLOF for the hazardous parts of the city. A large campaign was run that covered about 4,000 households by face to face contacts and interactions with the urban population located in the potentially affected zones in Huaraz. The evacuation map was provided to and discussed with each household individually to make sure that the emergency preparations were at an appropriate level. This campaign also allowed the institutions to better understand the perceptions of GLOF hazards by the local population. Furthermore, the evacuation maps are also shown in public buildings, shops, restaurants, pharmacies, and travel agencies.
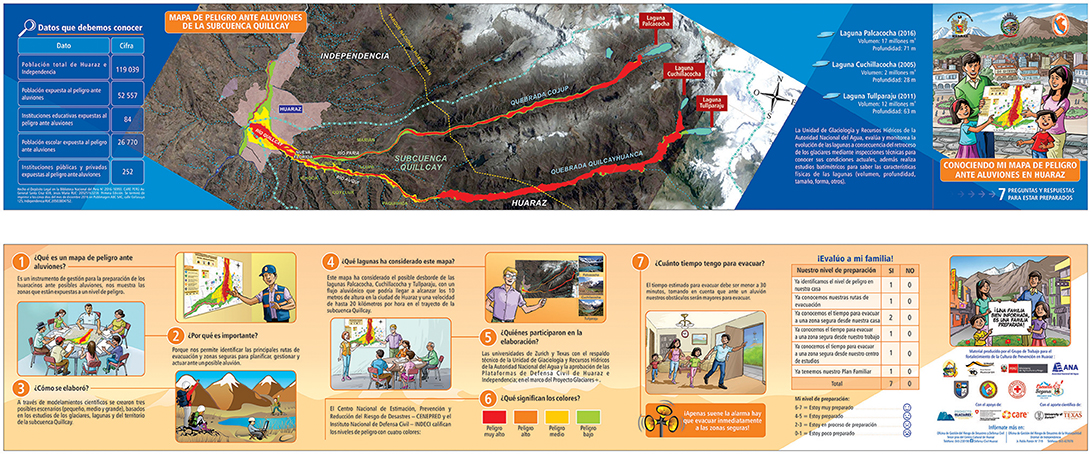
Figure 10. Information leaflet (in Spanish) distributed to households in the hazard zone of Huaraz. Top: front side with the hazard map of the entire catchment with some population information (Left) and characteristics of the evaluated glacial lakes (Right). Bottom: reverse side with five points with cartoons and explanations and information on the map (1) What's a hazard map? (2)Why is it important? (3) How was it elaborated? (4) Which lakes have been considered? (5) Who elaborated the map? (6) What's the meaning of the different colors? (7) How much time is left in case of a GLOF alarm and eventually a questionnaire for a self-evaluation of the preparedness. (Courtesy of CARE Peru).
The hazard and evacuation map helped raising the awareness of authorities about the latent threat these lakes are posing to Huaraz, and eventually also formed an important basis for the design and implementation of an early warning system for GLOFs in the Quillcay catchment. The early warning system was foreseen as an immediate measure to protect people's lives from GLOFs but the institutional and administrative processes were complicated, and together with low institutional capacities combined with high instabilities, especially concerning the regional government, enormously delayed the implementation. The slow and multi-stage procedures for technical approval and financing of the early warning system resulted to be a major barrier to efficient and effective response to GLOF risks. The hazard and evacuation maps represent indispensable elements for several of the early warning system components, such as for understanding the risks, and for response. After about 4 years of technical studies and administrative procedures the early warning system process in mid-2018 reached the phase of public tender for the construction of the system.
Discussion
The elaboration of a multi-source GLOF hazard map using a scenario-based modeling approach involves different kinds of uncertainties. Involved uncertainties are related to different sources, including (i) the numerical models, (ii) their input data, (iii) introduced simplifications, and (iv) the definitions of scenarios.
Chosen numerical models need to be able to simulate and represent the physical behavior of simulated processes and to provide results which are compatible with models for subsequent processes. This is generally the case here, but the extreme dimensions, magnitudes, and context are certainly at the limits of capabilities of such models. For instance, the simulation of GLOFs with volumes of several millions m3 is not the main purpose RAMMS was designed for. “Normal” debris flows of comparable volumes probably occur in several pulses or surges, whereas in a GLOF the entire mass can be involved in one major mass movement (Frey et al., 2016). Such extreme applications could even lead to numerical instabilities of the applied models, however, comparison to evidences from other comparable events and results from independent simulations with other models provide a certain control on the validness of obtained modeling results. In this case, RAMMS results were compared to FLO-2D results obtained by Somos-Valenzuela et al. (2016) for identical GLOF scenarios of Lake Palcacocha. Considerable differences were observed regarding maximum flow depth values between results from RAMMS and FLO-2D. However, regarding the critical criteria for hazard mapping, in this case the area affected and the spatial distribution of maximum flow heights above and below 1 m (= threshold for intensity classification), are similar. After generalizing the raw hazard map combining the three scenarios, the remaining differences can be neglected.
The input data for the models used here is generally adequate for its purposes, but as well includes certain limitations. On the one hand, physically-based numerical models often require a large set of parameters which is not available from site specific measurements, but needs to be taken from literature. Even more important is the fact that the DEM used here is a true elevation or terrain model, representing the topography of the earth surface without vegetation and infrastructure, such as bridges or buildings. In particular in urban areas like the city of Huaraz, the latter have a significant influence on flow behavior. For a more accurate and detailed hazard mapping within the urban center of Huaraz, further works would be required, including high-precision surveys of the buildings and other infrastructure, detailed flow modeling based on a digital surface model comprising such infrastructure, and thorough validation and adjustments in the field, considering for instance also passages and channels for the GLOF which are not detectable from a vertical air or space borne perspective. Such improvements would also require an analysis of the suitability of RAMMS model, for instance, which has not been tested for this type of applications. These kind of works is also very cost and labor intensive and related investments could only be justified if a clear benefit could be drawn from related improvement, such as for instance, detailed urban land-use planning or (re-)definitions of real-estate values (cf. section Institutional aspects and dissemination).
However, the biggest source of uncertainty in the entire hazard mapping approach is related to the definition of scenarios. Due to the lack of historic recordings of involved processes, often also due to the unique nature of certain mass movement events, scenario definitions cannot rely on empirically established, site specific frequency-magnitude relations, as it is the case for various other hazardous processes. Taking into account worst-case considerations at all stages of the process chain allow to better account for these uncertainties by including much more conservative assumptions on moraine dam stability. Here, this was addressed first by considering worst-case scenarios for the GLOF triggering rock-ice avalanches, and second by including a breach formation scenario as the low hazard level, despite its very low probability of occurrence according to the susceptibility analysis with a physically-based numerical model.
Besides ice or combined rock-ice avalanches, no other potential triggers were considered here. In principle also slope instabilities at steep inner moraine slopes can cause displacement waves, such as observed in a landslide event 2003 at the inner Palcacocha moraine (Vilímek et al., 2005). However, this event caused a displacement wave only marginally higher than the freeboard at the dam, and did not lead to a larger overtopping wave. A detailed evaluation by Klimes et al. (2016) revealed, that this 2003 event was among the largest landslides that are possible form the Palcacocha moraine, and that comparable landslides will not lead to substantial displacement waves, mainly due to the elongated shapes of the involved lakes. Another aspect that has not been considered here are effects of earthquakes. However, for instance the 2015 Gorkha Earthquake in Nepal only affected a very small number of moraine dams of glacial lakes and did not lead to a single GLOF, despite the large number of glacial lakes in the Himalayas (Kargel et al., 2016). Nevertheless, more detailed site-specific analyses would be required to assess the potential impacts of earthquakes on moraine dam, in particular since the Cordillera Blanca is located in very active seismic zone.
As outlined in section Institutional aspects and dissemination, considerations of the social and institutional context, as well as, dissemination activities are key for a successful communication and implementation of the elaborated hazard map. Based on the analysis of experiences of hazard map development, approval and dissemination at Quillcay and Huaraz we conclude the following which we consider relevant beyond this case study:
• Missing clarity about the process from mandating to developing and producing a hazard map affects the integration of the hazard map into operational and institutional processes, as well as, the acceptance by the authorities and the population. In countries with limited or not established regulations concerning this process, developing hazard maps intended to substantially reach beyond academic studies, is a major challenge. Clear regulations also increase the legitimacy and credibility of the institutions and experts involved, which is particularly important in case of multiple competing institutions with unclearly defined responsibilities—a situation prevailing in many countries of the world and bearing significance much beyond just GLOF hazards.
• The assessment of GLOF hazards and development of hazards maps needs to follow a transparent method and be based on the international state of the art. The GAPHAZ (2017) guidance document was produced exactly in recognition of this need. This document represents a consensus of international experts and therefore forms a major international reference.
• The approval process of a hazard map is important for its acceptance and further use. In many countries there is still missing clarity about it which limits the practical effectiveness of hazard aps and therefore this gap should be closed wherever possible.
• The purpose and use of hazard maps should be clearly defined before or during the development process. This is particularly important because worldwide (and even within countries) different types of hazard maps exist. As seen here missing (high-resolution) data, time, financial, or human resources can limit the use of a hazard map for certain purposes (e.g., apt for early warning systems but not for urban planning).
• The dissemination of a GLOF hazard map should be an integral part of the complete planning process and represents a major effort on its own. Multiple aspects (perceptions, credibility of institutions and experts, poverty, existing information, etc.) influence the success of the dissemination in terms of how effective a hazard map is to reduce GLOF related risks. A thorough analysis of these aspects is recommended but in practice often difficult due to time and financial constraints.
Knowledge and understanding of local perceptions of hazards and risks are fundamentally important for successful hazard and risk communication, but also for the willingness of governments and authorities to invest in related mitigation measures. After a GLOF event, fast-onset glacier related hazards typically receive high attention. But within a few years' time, this perception can move toward other hazards and risks, in particular in societies with a relatively high dependency on agriculture, including subsistence farming, where slow-onset hazards, such as droughts, have severe and immediate impacts on the well-being. In the case of the Quillcay catchment such a prioritization applies also the different lakes. Lake Palcacocha receives highest attention, probably due to its history with the 1941 outburst, whereas the hazard assessment performed here revealed, that in particular also Lake Cuchillacocha, despite its smaller volume compared to the other lakes, comprises a significant hazard potential.
Conclusions
Rapid changes of environmental conditions in high-mountain regions currently observed all over the world require scenario-based hazard assessment and mapping approaches, as current situations often are beyond historical precedence. Despite considerable uncertainties related to such assessments, the use of numerical models for the simulation of involved processes yields objectivity and traceability needed to meet scientific standards. With smart scenario definitions and well-reflected worst-case considerations, the degree of uncertainty can be lowered substantially. The GLOF hazard assessment and mapping procedure applied in the present paper to the Quillcay Catchment in the Cordillera Blanca demonstrated that approaches successfully tested for single lake assessments can also be applied to a multi-hazard-source setting such as an entire catchment containing several potentially hazardous lakes.
The assessments of rock-ice avalanche and dam breach susceptibility and impact revealed, that the situation of Lake Palcacocha, which in 1941 caused one of the deadliest GLOFs in recent history, today is different than it was in the 1940's, and a breach formation in case of an overtopping impact wave is very unlikely nowadays ( Somos-Valenzuela et al. (2016)). Nevertheless, a substantial hazard is emanated by this lake to the Quillcay Catchment and the city of Huaraz, urgently requiring complementary disaster risk prevention measures. Besides the prominent Lake Palcacocha, also the lakes Tullparaju and Cuchillacocha need to be considered when evaluating the GLOF hazard in this catchment. We found that in particular Lake Cuchillacocha poses the highest hazard of the three lakes in the medium scenario, due to its proximity to a large hanging glacier, which has the potential to completely drain this 2-million m3 lake even by an impact of an avalanche of the medium magnitude scenario. These findings contradict to some extent common local risk perceptions, which are often biased by historical events (here the 1941 Palcacocha outburst); highlighting the importance of integrative, unprejudiced, and objective hazard assessments.
In order to convert the resulting hazard map in a useful disaster risk reduction tool allowing for hazard communication, spatial planning, and the design of complementary structural and non-structural prevention measures, etc., national standards and institutional aspects need to be taken into consideration. In many countries, related processes and regulations are not clearly established, resulting in challenging situations for the transformation of a hazard map as a scientific result into an official, legally binding document, serving the authorities as a basis for decision-making and planning.
In a context of mistrust by the population in their government, authorities and experts, such as it is the case in the Cordillera Blanca (Carey, 2005; Carey et al., 2012), the dissemination of a hazard map is a challenging, but fundamentally important task, requiring major efforts. For the dissemination of the hazard map presented here, successful experiences have been made by a massive door-to-door information campaign, accompanied by the positive effect of more detailed insights into risk perceptions by the population.
Future efforts might aim at improving the hazard mapping within the urban area, including a detailed evaluation of the effects of urban infrastructure on the flow behavior of GLOFs. This is a major task, as scientific knowledge and experiences are currently still very limited in this regard. However, the presented hazard map provides an important planning tool for subsequent DRR measures, aiming at reducing the GLOF risk in the Quillcay catchment and the city of Huaraz.
Author Contributions
HF led the study, coordinated works of co-authors, wrote the main part of the manuscript and elaborated most figures. CH helped designing the study, advised modeling works and wrote the dissemination section. RC provided information and data on the works done by Somos-Valenzuela et al. (2016), was involved in the design of the modeling works and provided a figure. PB did most of the modeling work with RAMMS and the empirical wave estimates. BM provided advice regarding the RAMMS modeling, especially to the beta version able to consider erosional processes. AC and CP were the contacts of the national institutions involved in the hazard mapping and members of the technical commission, provided DEM and bathymetric data and other site specific information and liaised with involved local governmental authorities and other institutions.
Conflict of Interest Statement
The authors declare that the research was conducted in the absence of any commercial or financial relationships that could be construed as a potential conflict of interest.
Acknowledgments
The work presented in this study are part of the activities of the Proyecto Glaciares+, funded by the Swiss Agency for Development and Cooperation (SDC). Support from and collaboration with CARE Peru, the implementing partner of the University of Zurich in Proyecto Glaciares+, and the regional Ancash office of CARE in Huaraz is warmly acknowledged. Previous works by the University of Texas at Austin were supported by the USAID Climate Change Resilient Development (CCRD) project. DEM and RapidEye imagery provided by the Peruvian Ministry of the Environment (MINAM); Landsat imagery (Figure 2) provided by US Geological Survey (USGS). The Swiss Federal Institute for Forest, Snow and Landscape Research (WSL) and its Institute for Snow and Avalanche Research (SLF) provided access and support to the RAMMS debris flow module and the beta version allowing for the simulation of erosional processes. We thank the editor D. Tiranti and the two reviewers for their comments and suggestions, which helped to improve this article.
References
Allen, S. K., Linsbauer, A., Randhawa, S. S., Huggel, C., Rana, P., and Kumari, A. (2016). Glacial lake outburst flood risk in Himachal Pradesh, India: an integrative and anticipatory approach considering current and future threats. Nat. Hazards 84, 1741–1763. doi: 10.1007/s11069-016-2511-x
Bartelt, P., Salm, L. B., and Gruber, U. (1999). Calculating dense-snow avalanche runout using a Voellmy-fluid model with active/passive longitudinal straining. J. Glaciol. 45, 242–254. doi: 10.1017/S002214300000174X
Carey, M. (2005). Living and dying with glaciers: people's historical vulnerability to avalanches and outburst floods in Peru. Glob. Planet. Change 47, 122–134. doi: 10.1016/j.gloplacha.2004.10.007
Carey, M. (2010). In the Shadow of Melting Glaciers: Climate Change and Andean Society. Oxford, UK: Oxford University Press.
Carey, M., Huggel, C., Bury, J., Portocarrero, C., and Haeberli, W. (2012). An integrated socio-environmental framework for climate change adaptation and glacier hazard management: lessons from Lake 513, Cordillera Blanca, Peru. Clim. Change 112, 733–767. doi: 10.1007/s10584-011-0249-8
CENEPRED (2015). Manual Para La Evaluación de Riesgos Originados Por Fenómenos Naturales, 2nd Edn. Lima: Centro Nacional de Estimación, Prevención y Reducción del Riesgo de Desastres (CENEPRED).
Chisolm, R. E., and McKinney, D. C. (2018). Dynamics of avalanche-generated impulse waves: three-dimensional hydrodynamic simulations and sensitivity analysis. Nat. Hazards Earth Syst. Sci. 18, 1373–1393. doi: 10.5194/nhess-18-1373-2018
Christen, M., Kowalski, J., and Bartelt, P. (2010). RAMMS: numerical simulation of dense snow avalanches in three-dimensional terrain. Cold Regions Sci. Technol. 63, 1–14. doi: 10.1016/j.coldregions.2010.04.005
Emmer, A., and Vilimek, V. (2014). New method for assessing the susceptibility of glacial lakes to outburst floods in the Cordillera Blanca, Peru. Hydrol. Earth Syst. Sci. 18, 3461–3479. doi: 10.5194/hess-18-3461-2014
Emmer, A., Vilímek, V., and Luyo, M. Z. (2016). Hazard mitigation of glacial lake outburst floods in the cordillera blanca (Peru): the effectiveness of remedial works. J. Flood Risk Manage. 11, S489–S501. doi: 10.1111/jfr3.12241
Evans, S. G., Bishop, N. F., Smoll, L. F., Murillo, P. V., Delaney, K. B., and Oliver-Smith, A. (2009). A re-examination of the mechanism and human impact of catastrophic mass flows originating on Nevado Huascarán, Cordillera Blanca, Peru in 1962 and 1970. Eng. Geol. 108, 96–118. doi: 10.1016/j.enggeo.2009.06.020
Fischer, L., Amann, F., Moore, J. R., and Huggel, C. (2010). Assessment of periglacial slope stability for the 1988 Tschierva rock avalanche (Piz Morteratsch, Switzerland). Eng. Geol. 116, 32–43. doi: 10.1016/j.enggeo.2010.07.005
Frey, H., Huggel, C., Bühler, Y., Buis, D., Burga, M. D., Choquevilca, W., et al. (2016). A robust debris-flow and GLOF risk management strategy for a data-scarce catchment in Santa Teresa, Peru. Landslides 13, 1493–1507. doi: 10.1007/s10346-015-0669-z
GAPHAZ (2017). “Assessment of glacier and permafrost hazards in Mountain Regions,” in Joint Standing Group on Glacier and Permafrost Hazards in High Mountains (GAPHAZ) of the International Association of Cryospheric Sciences (IACS) and the International Permafrost Association (IPA), eds S. K. Allen, H. Frey, and C. Huggel (Zurich; Lima). Available online at: http://gaphaz.org/files/Assessment_Glacier_Permafrost_Hazards_Mountain_Regions.pdf (Accessed November, 2018).
Gardelle, J., Arnaud, Y., and Berthier, E. (2011). Contrasted evolution of glacial lakes along the Hindu Kush Himalaya mountain range between 1990 and 2009. Glob. Planet. Change 75, 47–55. doi: 10.1016/j.gloplacha.2010.10.003
Haeberli, W., Schaub, Y., and Huggel, C. (2016). Increasing risks related to landslides from degrading permafrost into new lakes in de-glaciating mountain ranges. Geomorphology 293, 405–417. doi: 10.1016/j.geomorph.2016.02.009
Heller, V., Hager, W. H., and Minor, H-E. (2009). Landslide Generated Impulse Waves in Reservoirs. Zurich: Mitteilungen Versuchsanstalt für Wasserbau, Hydrologie und Glaziologie (VAW), ETH Zürich.
Huggel, C., Haeberli, W., Kääb, A., Bieri, D., and Richardson, S. (2004a). An assessment procedure for glacial hazards in the Swiss Alps. Can. Geotech J. 41, 1068–1083. doi: 10.1139/t04-053
Huggel, C., Kääb, A., and Salzmann, N. (2004b). GIS-Based modelling of glacial hazards and their interactions using Landsat-TM and IKONOS imagery. Norsk Geografisk Tidskrift - Norwegian J. Geogr. 58, 61–73. doi: 10.1080/00291950410002296
Hürlimann, M., Copons, R., and Altimir, J. (2006). Detailed debris flow hazard assessment in Andorra: a multidisciplinary approach. Geomorphology 78, 359–372. doi: 10.1016/j.geomorph.2006.02.003
Huss, M., and Hock, R. (2015). A new model for global glacier change and sea-level rise. Front. Earth Sci. 3:54. doi: 10.3389/feart.2015.00054
Hussin, H. Y., Luna, B. Q., van Westen, C. J., Christen, M., Malet, J. P., and van Asch, T. W. J. (2012). Parameterization of a numerical 2-D debris flow model with entrainment: a case study of the Faucon catchment, Southern French Alps. Nat. Hazards Earth Syst. Sci. 12, 3075–3090. doi: 10.5194/nhess-12-3075-2012
IBER (2010). Two-Dimensional Modeling of Free Surface Shallow Water Flow, Hydraulic Reference Manual. IBERv1.0. Available online at: www.iberaula.es (Accessed July, 2018)
Kargel, J. S., Leonard, G. J., Shugar, D. H., Haritashya, U. K., Bevington, A., Fielding, E. J., et al. (2016). Geomorphic and geologic controls of geohazards induced by Nepals 2015 Gorkha earthquake. Science 351:aac8353. doi: 10.1126/science.aac8353
Klimes, J., Novotný, J., Novotná, I., Urries, B. J., Vilímek, V., Emmer, A., et al. (2016). Landslides in moraines as triggers of glacial lake outburst floods: example from PalcacochaLake (Cordillera Blanca, Peru). Landslides 13, 1461–1477. doi: 10.1007/s10346-016-0724-4
Linsbauer, A., Frey, H., Haeberli, W., Machguth, H., Azam, M. F., and Allen, S. (2015). Modelling glacier-bed overdeepenings and possible future lakes for the glaciers in the Himalaya–Karakoram region. Ann. Glaciol. 57, 119–130. doi: 10.3189/2016AoG71A627
McColl, S. T., and Davies, T. R. H. (2013). Large ice-contact slope movements: glacial buttressing, deformation and erosion. Earth Surf. Process. Landforms 38, 1102–1115. doi: 10.1002/esp.3346
Mergili, M. (2016). Observation and Spatial Modeling of Snow- and Ice- Related Mass Movement Hazards. Oxford University Press.
Mergili, M., Emmer, A., Juricová, A., Cochachin, A., Fischer, J.-T., Huggel, C., et al. (2018). How well can we simulate complex hydro-geomorphic process chains? The 2012 multi-lake outburst flood in the Santa Cruz Valley (Cordillera Blanca, Perú). Earth Surf. Process. Landforms 43, 1373–1389. doi: 10.1002/esp.4318
Mergili, M., Fischer, J-T., Krenn, J., and Pudasaini, S. P. (2017). r.avaflow v1, an advanced open-source computational framework for the propagation and interaction of two-phase mass flows. Geosci. Model Dev. 10, 553–569. doi: 10.5194/gmd-10-553-2017
Noetzli, J., and Gruber, S. (2009). Transient thermal effects in Alpine permafrost. Cryosphere 3, 85–99. doi: 10.5194/tc-3-85-2009
Racoviteanu, A. E., Arnaud, Y., Williams, M., and Ordoñez, J. (2008). Decadal changes in glacier parameters in the Cordillera Blanca, Peru, derived from remote sensing. J. Glaciol. 54, 499–509. doi: 10.3189/002214308785836922
Raetzo, H., Lateltin, O., Bollinger, D., and Tripet, J. (2002). Hazard assessment in Switzerland - Codes of practice for mass movements. Bull. Eng. Geol. Environ. 61, 263–268. doi: 10.1007/s10064-002-0163-4
Richardson, S., and Reynolds, J. (2000). An overview of glacial hazards in the Himalayas. Quaternary Int. 65–66, 31–47. doi: 10.1016/S1040-6182(99)00035-X
Schaub, Y., Haeberli, W., Huggel, C., Künzler, M., and Bründl, M. (2013). “Landslides and new lakes in deglaciating areas: a risk management framework,” in Landslide Science and Practice: Social and Economic Impact and Policies, eds C. Margottini, P. Canuti, and K. Sassa (Berlin; Heidelberg: Springer), 31–38.
Schaub, Y., Huggel, C., and Cochachin, A. (2015). Ice-avalanche scenario elaboration and uncertainty propagation in numerical simulation of rock-/ice-avalanche-induced impact waves at Mount Hualcán and Lake 513, Peru. Landslides 13, 1–15. doi: 10.1007/s10346-015-0658-2
Scheidl, C., Rickenmann, D., and McArdell, B. W. (2013). “Runout prediction of debris flows and similar mass movements,” in Landslide Science and Practice: Spatial Analysis and Modelling Vol. 3, eds C. Margottini, P. Canuti, and K. Sassa (Berlin, Heidelberg: Springer Berlin Heidelberg), 221–229.
Schneider, D., Bartelt, P., Caplan-Auerbach, J., Christen, M., Huggel, C., and McArdell, B. W. (2010). Insights into rock-ice avalanche dynamics by combined analysis of seismic recordings and a numerical avalanche model. J. Geophys. Res. 115, 1–20. doi: 10.1029/2010JF001734
Schneider, D., Huggel, C., Cochachin, A., Guillén, S., and García, J. (2014). Mapping hazards from glacier lake outburst floods based on modelling of process cascades at Lake 513, Carhuaz, Peru. Adv. Geosci. 35, 145–155. doi: 10.5194/adgeo-35-145-2014
Schneider, D., Huggel, C., Haeberli, W., and Kaitna, R. (2011). Unraveling driving factors for large rock-ice avalanche mobility. Earth Surf. Process. Landforms 36, 1948–1966. doi: 10.1002/esp.2218
Schraml, K., Thomschitz, B., McArdell, B. W., Graf, C., and Kaitna, R. (2015). Modeling debris-flow runout patterns on two alpine fans with different dynamic simulation models. Nat. Hazards Earth Syst. Sci. 15, 1483–1492. doi: 10.5194/nhess-15-1483-2015
Somos-Valenzuela, M. A., Chisolm, R. E., Rivas, D. S., Portocarrero, C., and McKinney, D. C. (2016). Modeling a glacial lake outburst flood process chain: the case of Lake Palcacocha and Huaraz, Peru. Hydrol. Earth Syst. Sci. 20, 2519–2543. doi: 10.5194/hess-20-2519-2016
Vetsch, D., Siviglia, A., Caponi, F., Ehrbar, D., Gerke, E., Kammerer, S., et al. (2018). System manuals of BASEMENT. zurich: laboratory of hydraulics, glaciology and hydrology (VAW). ETH zurich. Available online at: http://www.basement.ethz.ch (Accessed July 2018).
Vilímek, V., Zapata, M., Klimes, J., Patzelt, Z., and Santillan, N. (2005). Influence of glacial retreat on natural hazard of the Palcacocha Lake area, Peru. Landslides 2, 107–115. doi: 10.1007/s10346-005-0052-6
Wegner, S. A. (2014). Lo Que el Agua se Llevó. Notas Técnicas Sobre Cambio Climático 7. Lima: Ministerio del Ambiente Peru, 88.
Westoby, M. J., Glasser, N. F., Brasington, J., Hambrey, M. J., Quincey, D. J., and Reynolds, J. M. (2014). Modelling outburst floods from moraine-dammed glacial lakes. Earth Sci. Rev. 134, 137–159. doi: 10.1016/j.earscirev.2014.03.009
Worni, R., Huggel, C., Clague, J. J., Schaub, Y., and Stoffel, M. (2014). Coupling glacial lake impact, dam breach, and flood processes: a modeling perspective. Geomorphology 224, 161–176. doi: 10.1016/j.geomorph.2014.06.031
Worni, R., Stoffel, M., Huggel, C., Volz, C., Casteller, A., and Luckman, B. (2012). Analysis and dynamic modeling of a moraine failure and glacier lake outburst flood at Ventisquero Negro, Patagonian Andes (Argentina). J. Hydrol. 444–445, 134–145. doi: 10.1016/j.jhydrol.2012.04.013
Keywords: dissemination, GLOF, hazard assessment and mapping, process chains, numerical modeling, hazard and risk communication, institutional aspects, DRR
Citation: Frey H, Huggel C, Chisolm RE, Baer P, McArdell B, Cochachin A and Portocarrero C (2018) Multi-Source Glacial Lake Outburst Flood Hazard Assessment and Mapping for Huaraz, Cordillera Blanca, Peru. Front. Earth Sci. 6:210. doi: 10.3389/feart.2018.00210
Received: 17 July 2018; Accepted: 31 October 2018;
Published: 21 November 2018.
Edited by:
Davide Tiranti, Agenzia Regionale per la Protezione Ambientale (ARPA), ItalyReviewed by:
Dhananjay Anant Sant, Maharaja Sayajirao University of Baroda, IndiaFabio Matano, Consiglio Nazionale Delle Ricerche (CNR), Italy
Copyright © 2018 Frey, Huggel, Chisolm, Baer, McArdell, Cochachin and Portocarrero. This is an open-access article distributed under the terms of the Creative Commons Attribution License (CC BY). The use, distribution or reproduction in other forums is permitted, provided the original author(s) and the copyright owner(s) are credited and that the original publication in this journal is cited, in accordance with accepted academic practice. No use, distribution or reproduction is permitted which does not comply with these terms.
*Correspondence: Holger Frey, holger.frey@geo.uzh.ch
†Present Address: Patrick Baer, Geotest AG, Zollikofen, Switzerland
César Portocarrero, Independent Consultant, Huaraz, Peru
Rachel E. Chisolm, Austin Water, Austin, TX, United States