Temporal Changes of Seismic Velocity Caused by Volcanic Activity at Mt. Etna Revealed by the Autocorrelation of Ambient Seismic Noise
 Raphael S. M. De Plaen1,2*
  Andrea Cannata3
  Flavio Cannavo'4
  Corentin Caudron5
  Thomas Lecocq6
  Olivier Francis1
- 1Faculté des Sciences, de la Technologie et de la Communication, University of Luxembourg, Luxembourg, Luxembourg
- 2Centro de Sismología y Volcanología de Occidente, Centro Universitario de la Costa Sur, Universidad de Guadalajara, Puerto Vallarat, Mexico
- 3Dipartimento di Scienze Biologiche, Geologiche e Ambientali - Sezione di Scienze della Terra, Università degli Studi di Catania, Catania, Italy
- 4Etnean Observatory, Istituto Nazionale di Geofisica e Vulcanologia, Catania, Italy
- 5Univ. Grenoble Alpes, Univ. Savoie Mont Blanc, CNRS, IRD, IFSTTAR, ISTerre, Grenoble, France
- 6Royal Observatory of Belgium, Brussels, Belgium
On active volcanoes, ambient noise-based seismic interferometry can be a very useful monitoring tool as it allows to detect very slight variations in seismic velocity associated with magma transported toward the surface. However, the classical cross-station approach occasionally fails to detect seismic velocity changes related to eruptive activity, even on very active, well-instrumented volcanoes such as Mt. Etna. In this work, we explored an improved ambient noise-based monitoring strategy by performing the autocorrelation of seismic noise recorded at Mt. Etna volcano, by three stations located close to the active summit craters, during April 2013–October 2014. Such an interval was chosen because of the number and variety of eruptions. In place of the classical cross-correlation, we implemented the phase cross-correlation of each component with itself, which does not require normalization of the signals. The detected seismic velocity variations were very consistent for all three stations throughout the study period, mainly ranging between 0.3 and −0.2%, and were time-related to both sequences of paroxysmal eruptions and more effusive activities. In particular, we observed seismic velocity decreases accompanying paroxysmal eruptions, suggesting an intense pressurization within the plumbing system, which created an area of extensional strain with crack openings. In addition, seismic velocity variations over time were analyzed in the light of ground deformation data recorded by GPS stations and volcanic tremor centroid locations and displayed a particularly strong correlation with the former. Finally, we showed that, although the investigated frequency band (1–2 Hz) contained most of the volcanic tremor energy, our results did not indicate a particular contamination of seismic velocity variation measurements by variations of tremor sources. Ultimately, our investigation highlights a better way to implement noise-based seismic monitoring techniques. The near-field sensitivity of the autocorrelation helped improve our understanding of the relationship between variations of seismic velocity, ground deformation and the pressurization dynamics of volcanic plumbing systems which, in turn, allows for better monitoring implementations of seismic interferometry on other volcanoes.
Introduction
Magma intrusion and pressurization of the plumbing system can change the seismic velocity structure of a volcano (e.g., Brenguier et al., 2008, 2016). Sometimes, such variations can be detected by classical tomography, as during the March 2009 eruption of Redoubt Volcano, where the presence of a mobile phase at shallow depth beneath the volcano was linked to a reduction in S-wave velocity (Kasatkina et al., 2014).
However, the variations in seismic velocity associated with transport of magma toward the surface are often too small to be detected by tomography techniques (e.g., Brenguier et al., 2016). In these cases, seismic interferometric techniques have turned out to be very effective. In particular, the ambient noise interferometry, based on the fact that the Earth is not static but permanently vibrating, has many advantages (e.g., Brenguier et al., 2016): (i) it has a very high precision, much higher than classic tomography techniques (it is able to detect velocity variations much lower than 1%; e.g., Brenguier et al., 2016; Donaldson et al., 2017); (ii) unlike coda wave interferometry applied on repeating earthquakes (e.g., Cannata, 2012; Hotovec-Ellis et al., 2014), ambient noise interferometry allows a continuous monitoring of the medium velocity changes; (iii) it is a non-invasive or destructive monitoring method. For these reasons, measurement of seismic velocity by ambient noise interferometry is a promising tool to monitor volcanoes (e.g., Brenguier et al., 2008; Duputel et al., 2009). For example, Donaldson et al. (2017) showed a remarkable correlation between relative velocity and the radial tilt measured at Kīlauea summit. This suggested that during inflation phenomena, since the volumetric strain is extensional above the inflation source and compressional at the sides, most of the edifice is dominated by compression closing cracks, producing higher seismic velocities, while the extension area above the source is dominated by opening pores and crack, producing lower seismic velocities.
Cross-correlation functions, used to perform interferometry, are typically reconstructed from the signals acquired by pairs of stations, allowing to continuously and accurately monitor the temporal changes in seismic velocity (Hadziioannou et al., 2009). More recently, implementations of this technique used passive recordings at individual stations to detect changes of seismic velocity in the crust by cross-correlating each component of each individual station with itself, or autocorrelation (e.g., Hobiger et al., 2014; De Plaen et al., 2016; Yukutake et al., 2016).
In this work, we implemented the autocorrelation of ambient seismic noise using the phase cross-correlation to monitor the activity of Mt. Etna volcano during April 2013—October 2014. Such a time period was chosen because of the number and variety of eruptions taking place on the volcano summit area. In order to better understand the source mechanisms of the detected medium changes, the seismic velocity patterns are compared with ground deformation, volcanic tremor, and volcanological data.
Background
Mt. Etna lies at the convergence between the African plate and the Eurasian plate. Located near the second most populated city of the Sicily, Catania, it is a very active volcano with a series of brief but powerful eruptive episodes (paroxysms) almost every year at least since 2011. It is in an almost constant state of activity, and has documented records of historical volcanism dating back to 1500 BCE. The current activity ranges from effusive to Strombolian, to paroxysmal activities.
Since January 2011, a new cone grew up at the summit area of Mt. Etna, following a series of paroxysms (e.g., Behncke et al., 2014; De Beni et al., 2015). Informally named the New South East Crater (NSEC, Figure 1), the cone was built up of material accumulated from lava fountains.
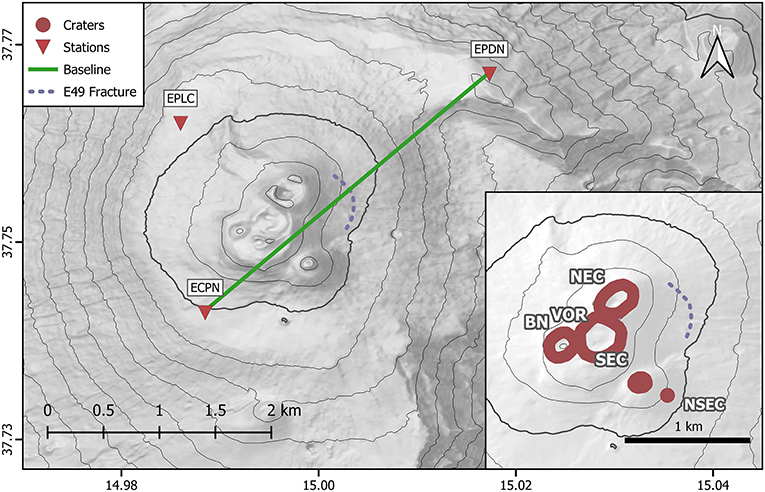
Figure 1. Digital elevation model with the three seismic stations used in this study (red triangles). The green line corresponds to the GPS baseline ECPN-EPDN in Figures 3, 4. The lower right inset shows the volcano summit craters (NEC, North-East Crater; BN, Bocca Nuova; SEC, South-East Crater; NSEC, New South-East Crater; VOR, Voragine). The purple dashed line is the approximate extent of the E49 fracture system. The stations are <5 km apart and station ECPN is the closest to NSEC, the most active crater for the studied period.
After 10 months of quiescence, the NSEC resumed its episodic activity in February 2013, producing 19 paroxysms until early December (e.g., Cannata et al., 2015; Spampinato et al., 2015). In particular, 13 paroxysms took place from February to April (E26-E38 in Table 1; the nomenclature of the episodes derives from De Beni et al., 2015), and six from October to December (E39-E44 in Table 1 and De Beni et al., 2015). All the paroxysms at NSEC showed similar features. In particular, the following phases of activity were observed (Behncke et al., 2014): (i) minor explosive activity, (ii) more vigorous Strombolian activity often accompanied by lava discharge, (iii) lava fountaining with voluminous ash ejection and lava flows, and (iv) a waning phase with transition to mildly Strombolian activity and the end of the eruption.
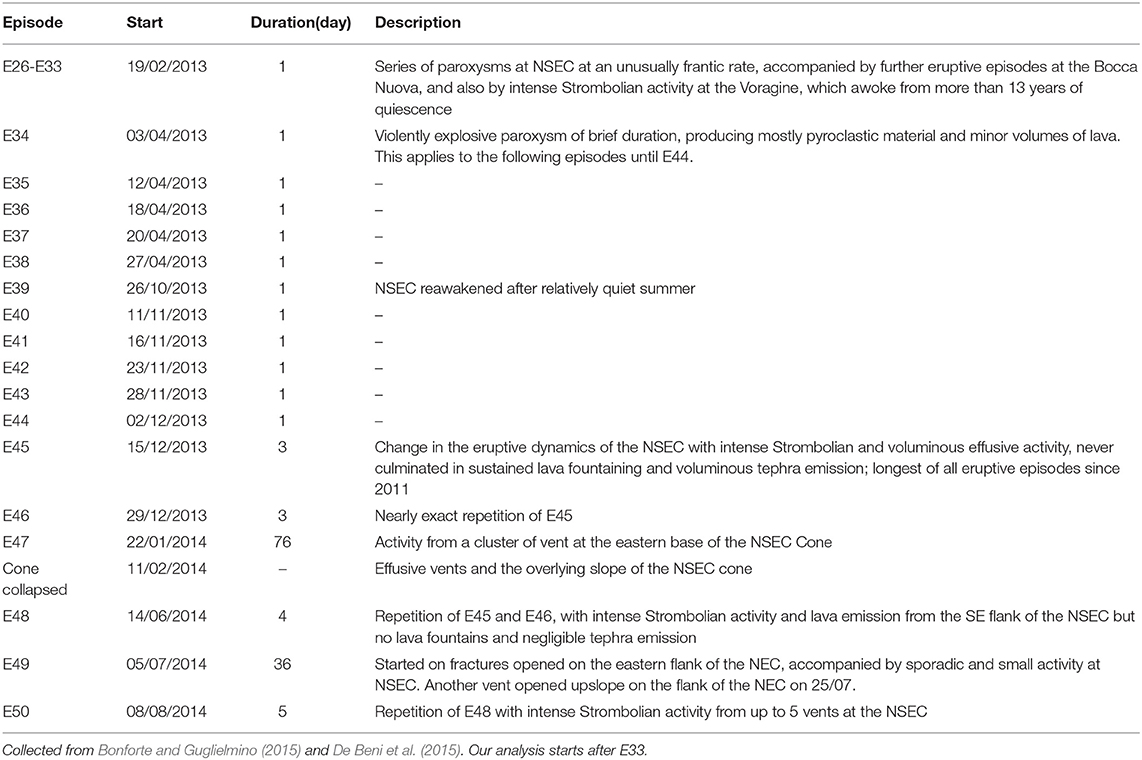
Table 1. Chronology of the main eruptive activities at Mt. Etna volcano in 2013–2014, with the exception of the 28 December 2014 eruption.
In mid-December 2013, the activity transitioned from brief and violent paroxysms, to long-lived and less explosive episodes (De Beni et al., 2015). The initial explosive activity (phase “i” and “ii”) did not culminate in sustained lava fountaining and voluminous tephra emission. This type of activity largely continued in 2014. The main eruptions took place in January-April and June 2014 at NSEC (E47-E48 in Table 1 and De Beni et al., 2015).
Successively, a 5-week-long period of intense Strombolian and effusive activity occurred in July-August 2014 (E49 in Table 1 and De Beni et al., 2015) from a fracture, located ~1 km north of the NSEC, on the eastern flank of the North-East Crater (NEC) (e.g., Spina et al., 2017), the highest of Etna's summit craters (which erupted for the first time in 1911; Ponte, 1920). This activity was probably linked to the NSEC plumbing system (e.g., Viccaro et al., 2016), although it did not contribute to the evolution of the NSEC cone. Before the end of this eruption, on 8 August, explosive activity resumed at NSEC, and culminated on 11–14 August with vigorous Strombolian activity (E50 in Table 1 and De Beni et al., 2015).
Data and Method
We used data from the Etna seismic network recorded during April 2013—October 2014. The seismic stations consist of broadband three-component Trillium seismometers (Nanometrics), with cut-off period of 40 s and sampling rate at 100 Hz. In particular, we used seismic signals from three stations closest (5 km) to the active craters: ECPN, EPDN, and EPLC (Figure 1). This period covered a series of eruptive episodes linked primarily to the NSEC (Table 1), with a mixture of brief and violently explosive activity in 2013, and intense Strombolian and effusive activity in 2014.
Seismic velocity changes were measured from seismic noise cross-correlation, following a workflow similar to Lecocq et al. (2014) and De Plaen et al. (2016). Seismic records for all components were pre-processed by carefully checking for their timing and gaps. Then, they were pre-filtered between 0.01 and 8.0 Hz, and resampled to 20 Hz.
The cross-correlation step commonly uses the classical cross-correlation:
where u1 and u2 are the cross-correlated seismic traces, t is the lag-time, τ the lag-time shift and T is the correlation window length. This step typically requires to normalize the signal in the time and the spectral domains to suppress high amplitude events and isolated noise sources with defined frequencies (Bensen et al., 2007).
Since we correlate each component with itself, normalizing in the spectral domain by setting the amplitude to 1 for all frequencies removes information on the medium (Hobiger et al., 2014). The contamination of the autocorrelation of ambient seismic noise by high amplitude events, such as earthquakes, is a known issue (e.g., De Plaen et al., 2016). To reduce this vulnerability, we implemented the phase cross-correlation (PCC) of Schimmel (1999) and Schimmel et al. (2011) instead of the classical correlation.
The PCC measures the similarity of the instantaneous phases of the analytic traces and is therefore amplitude unbiased. The main advantage of this property is that it removes the need for temporal or spectral normalizations before the cross-correlation.
where γ(τ) and φ(τ) are the instantaneous phases of the traces u1 and u2, respectively and the power ϑ controls the sensitivity and the signal-to-noise ratio.
The autocorrelations were computed for each individual day following a bandpass filter between 1.0 and 2.0 Hz. Then, the autocorrelation functions were averaged with a 2-day linear stacking to improve the signal-to-noise ratio, while keeping a high temporal resolution.
The fluctuations of seismic velocity in the medium were obtained by comparing each daily autocorrelation to a reference autocorrelation corresponding to a stack of the entire study period. Assuming a homogeneous change in the medium, the relative difference in travel time dt is related to the change in the seismic velocity dv, as:
Relative travel time changes were measured in the frequency domain using the moving-window cross-spectral analysis (MWCS) which has the advantage of clearly defining the bandwidth of the coherent signal (Ratdomopurbo and Poupinet, 1995). Time delays for each window between the two autocorrelations are in the unwrapped phase of the cross-spectrum. They were measured from the slope of a linear regression of the samples within the pre-defined frequency band, weighted by the cross-coherence between energy densities in the frequency domain (Clarke et al., 2011). A quality control was obtained from errors, estimated using the cross-coherence values and the squared misfit to the modeled slope. MWCS point measurements with a dt error >0.1 s and a coherence under 0.6 were considered of poor quality and rejected. Variations of seismic velocity were measured on both the causal and the acausal part of the autocorrelation for time lags between 5 and 35 s to prevent direct wave contamination. The velocity variations for each component pair were ultimately averaged by station.
Results
Station-To-Station Comparison
The seismic velocity variations were globally very consistent for all three stations throughout the study period, with the exception of a minor phase delay for ECPN right before and during some eruptive episodes (E40-E43, Figure 2). The few gaps were caused by interruptions in the original data or poor quality measurements that were rejected (July and August 2014, for example). The dataset started with an eruption (E34 on 3 April 2013), for which we therefore have no observation of precursors. A decrease in seismic velocity is observed at all three stations at the same time as the October-December 2013 paroxysmal sequence (E39-E44) and prior to the effusive/Strombolian activities of mid-June, July and August 2014. By contrast, the mainly effusive eruption (E47) initiated at a cluster of vents at the eastern base of the NSEC cone in late January 2014 was preceded by a consistent increase of seismic velocity that coincides with a change in style of activity from paroxysmal to mainly effusive.
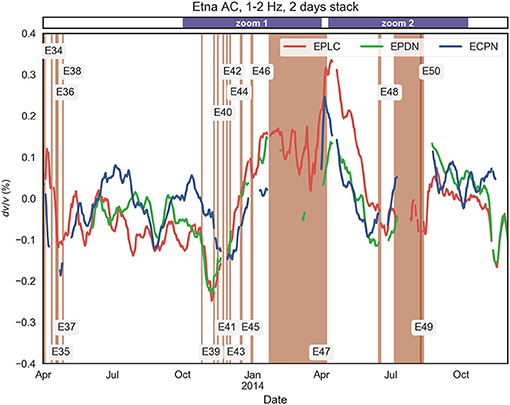
Figure 2. Seismic velocity variations at Mt. Etna in 2013-2014. Each line corresponds to the average at each individual station (EPLC, ECPN, and EPDN) of the measured relative seismic velocity variation (dv/v, in %) for each component pair (e.g., ZZ, EE, NN). These dv/v are calculated using the autocorrelation in the 1–2 Hz frequency band, and the cross-correlation functions are stacked linearly over 2 days. The median errors on the dv/v measurements are ~0.03% for each station. The orange vertical lines and zones are labeled eruptive episodes described in Table 1. The episodes were brief in duration and rather explosive (vertical lines) until E45, in the second half of December 2013, when the activity changed to more long-lived and effusive events that characterized 2014. The purple zones in the top subplot illustrate the timespans enlarged in Figures 3, 4.
Figure 3 offers a closer view at the October-December 2013 paroxysm (E39-E44). This paroxysm sequence was preceded/accompanied by a clear decrease detected at all stations and was characterized as one of the most violent in the series of paroxysms since January 2011 (De Beni et al., 2015). The decrease in seismic velocity of over 0.1% persisted at all three stations until 11 November (E40), then simultaneously increased at stations EPDN and EPLC. The seismic velocity at station ECPN, however, decreased through another 5 eruptions (E40-44) until mid-December. As aforementioned, in mid-December the activity at the NSEC transitioned from more to less explosive. We observe that in the meantime seismic velocity increased at all three stations through E45 and E46 to recover previous values later in January 2014. No good reliable seismic velocity measurement could be done during E47 except for station EPLC.
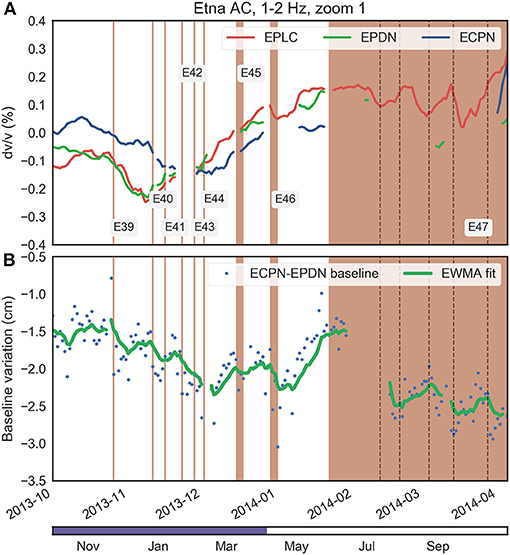
Figure 3. Seismic velocity variation at stations ECPN, EPLC and EPDN (A) and variation in baseline length between GPS stations ECPN and EPDN (B) between October 2013 and April 2014. The green line is the exponentially-weighted moving average with a center of mass of 5 (EWMA) of the baseline variation. The orange zones are labeled eruptive episodes described in Table 1 and the vertical dashed black lines are simultaneous variations of dv/v at station EPLC and baseline length ECPN—EPDN during E47. The sequence of episodes from E39 to E46 are explosive, the following episodes E45 to E47 change to less explosive Strombolian and mainly effusive activity on the eastern flank of the NSEC.
The ground deformation time series (Figure 3B) were obtained from the measurement of daily baseline ECPN-EPDN, whose variations over time are sensitive to any change in summit deformation. Most oscillations of baseline length are related to inflation and deflation cycles preceding and accompanying the eruptions, respectively. During the October-December 2013 paroxysm (E39-E44), the baseline length globally shortened (~-0.8 cm) until early December. It then increased until E47 with the exception of a ~0.3 cm drop after E46. At a shorter time scale, subtle increase in baseline length preceded episodes E39, E40, E42, E45, and E46. In the course of episode E47, anti-correlated oscillations of seismic velocity changes at EPLC and baseline length ECPN-EPDN were observed (Figure 4, dashed vertical lines).
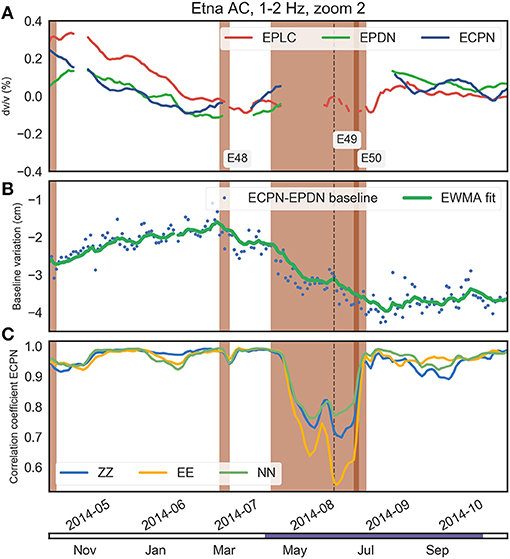
Figure 4. Seismic velocity variation at stations EPCN, EPLC, and EPDN (A), variation in baseline length between GPS stations ECPN and EPDN (B) and correlation coefficient between the daily and the reference Cross-Correlation Function for each component pair at station ECPN (C) between April and October 2014. The green line is the exponentially-weighted moving average with a center of mass of 5 (EWMA) of the baseline variation. Following the Strombolian and effusive activity of E47, a consistent decrease of seismic velocity is observed until E48, also characterized by Strombolian activity and lava flows. An increase is then observed until E49. No reliable seismic velocity change measurement could be done during E49 and E50.
The following activities (E48-50, Figure 4) were also clearly preceded by a decrease in seismic velocity at every station. During these longer episodes (E49 and E50 for example), many seismic velocity change measurements were rejected due to high level of errors in dt measurement, although a global increase or recovery could, to a certain extent, be identified. Again, the variation of baseline length between GPS stations ECPN and EPDN (Figure 4B) was anti-correlated with the seismic velocity change. The ECPN-EPDN baseline length globally increased until E48, then decreased through E49 and E50 to stabilize after mid-August.
After the recovery, the seismic velocity measurements during E49 and E50 did not provide results of a satisfactory quality (with a coherence under 0.6), causing gaps for all three stations. In the meantime, the correlation coefficient displayed two significant drops for each episode (Figure 4C). These episodes were followed by a recovery until late October when stations EPDN and EPLC displayed a new decline of seismic velocity (>0.2%) in early November, only to rise again in December (Figure 2). Station ECPN appeared to be relatively stable following E50 recovery (Figure 2). These last variations could be related to the powerful 28 December 2014 eruptive episode.
Variation of Volcanic Tremor Source Location
The seismic energy in the chosen frequency band is dominated by volcanic tremor, which commonly rises concerns of contamination when seismic interferometry is used for volcano monitoring (e.g., Ballmer et al., 2013). The volcanic tremor centroids (Figures 5, 6) were obtained in near real time at Mt. Etna from 1 h long sliding windows that tracked the spatial evolution of the source (e.g., Di Grazia et al., 2006; Cannata et al., 2013).
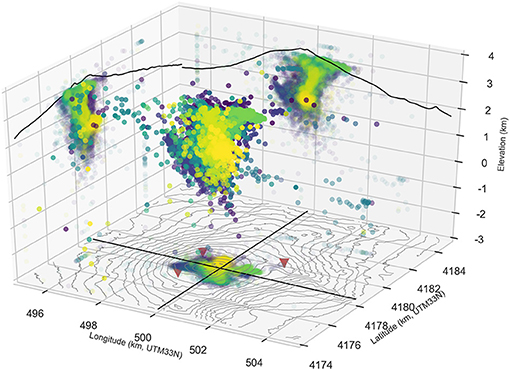
Figure 5. Location of volcanic tremor centroids during study period from near real-time processing. The color refers to the temporal evolution presented in Figure 6, X and Y are the longitude and the latitude in km UTM zone 33N, respectively, and Z is the altitude in km above sea level.
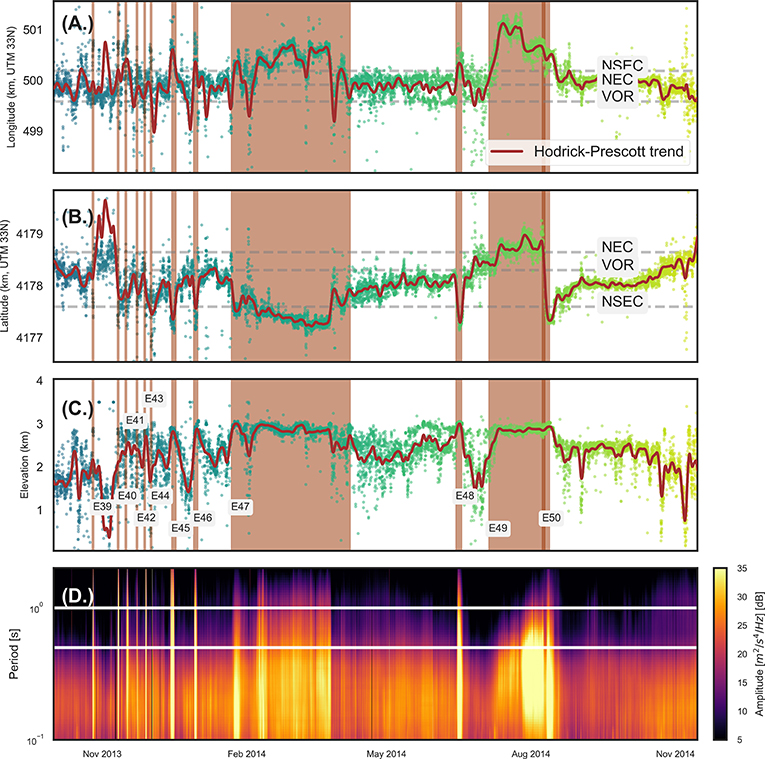
Figure 6. Variation in time of the location of the volcanic tremor centroids (A; longitude in UTM33N, B; latitude in UTM 33N, C; Elevation above sea level). The color of the plots evolves with time, the red line is the corresponding Hodrick Prescott trend with a smoothing parameter of 10,000 (Hodrick and Prescott, 1981, 1997). The orange vertical lines and zones refer to paroxysms reported in Table 1 and are characterized by short-lived explosive activity (vertical lines) until E45, when the activity changed into more effusive and longer. The horizontal dashed lines are the locations of volcano summit craters (NEC; North-East Crater; NSEC, New South-East Crater; VOR, Voragine). All three craters are within 500 m in longitude. Spectrogram of the vertical component of station ECPN (D). The white frame is the frequency band used in this study.
In order to locate volcanic tremor sources, we assumed propagation of body waves in a homogeneous medium, and applied a grid-search method based on the spatial distribution of seismic-amplitudes. The body waves assumption is related to the fact that the location result is mostly affected by the seismic amplitudes of the stations closest to the tremor source. As for the grid, we consider a 8 × 8 × 6 km3 volume with a spacing between nodes of 250 m. The investigated frequency band was 0.5–2.5 Hz, routinely analyzed to highlight the main migrations of the tremor centroid (Patanè et al., 2008; Cannata et al., 2013). The average location errors, calculated by the jackknife method (Di Grazia et al., 2006; Cannata et al., 2013), were equal to 0.3, 0.4, and 0.7 km for longitude, latitude, and altitude, respectively. Since more than one source can be active simultaneously, the location corresponds to the dominating source or a location between the real sources. During eruptive episodes, the amplitude of volcanic tremor commonly increases and a migration of centroids toward the surface near the active vent can be observed. For example, this migration is illustrated in Figures 5, 6 by episode E49 during which, unlike the rest of the study period, the volcanic activity and the tremor centroids mainly focused on the eastern flank of NEC. Between eruptive episodes, centroids migrate back at depth (1–2 km above sea level) and under the Voragine Crater (Figures 5, 6). These differ from the observed variations of seismic velocity. For example, the continuous decrease between E47 and E48 does not indicate a relationship with the corresponding location of tremor sources.
Nevertheless, at times before or during an eruptive episode the temporal variations of volcanic tremor centroids location are correlated with variations of seismic velocity, positively or negatively (Figure 6). Figures 7, 8 show the spatial interpolation for variation of seismic velocity and the location of tremor source centroids over 5 days before E47 and E49, respectively. The 5-days span offers a compromise between long- and short-term variations to keep the ability to emphasize shallow mechanisms that would cause sudden variations before an eruption. Although episodes E47 and E49 developed on different craters—NSEC and NEC, respectively—the tremor source centroids clearly cluster near the eruptive site, in the vicinity of the observed largest decrease of seismic velocity.
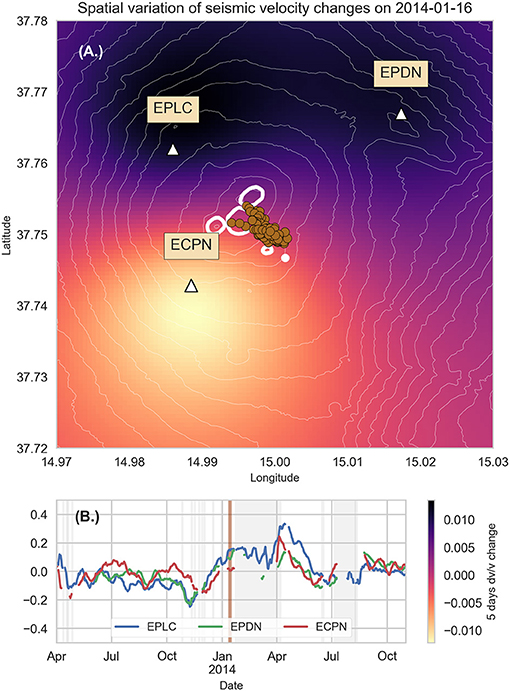
Figure 7. (A) Interpolation map of the variation of seismic velocity over 5 days until 16/01/2014. The brown points are tremor centroid locations for the same time span. The map emphasizes the larger decrease in seismic velocity at station ECPN, the closest to the NSEC which erupted on 21 January. The tremor centroids are clustered near the NSEC. (B) Seismic velocity variation in % at the considered stations centered on the E46 event.
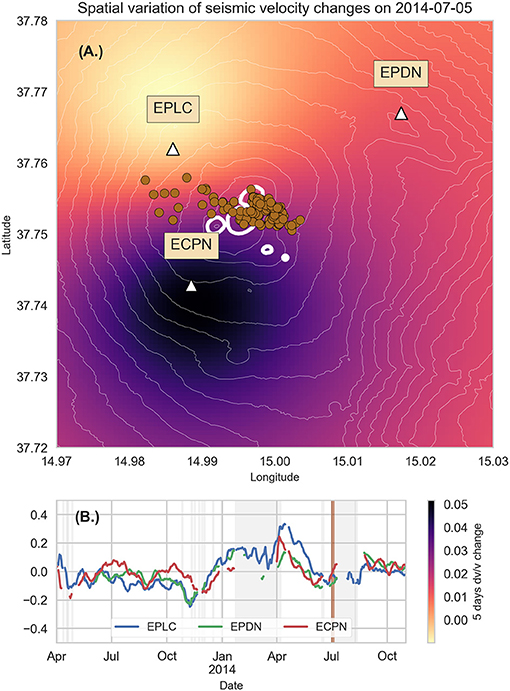
Figure 8. (A) Interpolation map of the variation of seismic velocity over 5 days until 5 July 2014. The brown points are tremor centroid locations for the same time span. Unlike in Figure 7 the centroids are spread out with small cluster near the vent that opened on the flank of the NEC in July 2014. The seismic velocity is decreasing at stations EPLC and EPDN while it is increasing at station ECPN. (B) Seismic velocity variation in % at the considered stations.
Discussion
Although the stations used in this study are all within 5 km of the active craters, station ECPN which is the closest to the NSEC sometimes shows a larger peak-to-peak decrease before eruptions (e.g., E39 on Figure 3A) except when the activity migrated to the more distant NEC (E49 on Figure 4A). This observation indicates a local sensitivity of the method in contrast with the assumption used to average the relative velocity changes measured over all station pairs in a network of a global homogeneous velocity change in the whole volume of the edifice (e.g., Obermann et al., 2013; Rivet et al., 2015). Averaging results with measurements made at distant stations or station pairs could reduce the capability of precursor detection. This is illustrated by Cannata et al. (2017) who did not observe volcanic precursors in variations of seismic velocity obtained from a large number of stations on Mt. Etna. Ultimately, when pairs of receivers are used, a careful selection of the station pairs mostly affected by the source of change is therefore recommended. When autocorrelation is used, measurements prove to be sensitive to changes in the near field, stations close to the eruptive site should therefore be favored.
A criticism against monitoring using ambient seismic noise cross-correlation is the potential sensitivity of the seismic velocity variations to variations in source distributions and concerns of contamination from volcanic tremor (e.g., Ballmer et al., 2013).
However, although volcanic tremor sources are not suited to calculate Green's functions and to perform imaging studies, they can be used to estimate seismic velocity variations over time, provided that consistent coda arrivals can be reconstructed (e.g., Donaldson et al., 2017). On one hand, using distant parts of the coda of the autocorrelation assumes that the measured stable phases are highly scattered and therefore unaffected by variations of source distributions (e.g., Stehly et al., 2008). On the other hand, changes in frequency content of the noise source have a limited effect on our measurements, since we used the phase cross-correlation, which is amplitude unbiased by design, and the MWCS analysis, in which the amplitude and phase spectra are separated before the measurements are made.
Ultimately, the inconsistent correlation between tremor centroids and seismic velocity variations is an evidence of a discrepancy between the two observations. A relationship between them is mostly observed at the onset of eruptive episodes. Viccaro et al. (2016) showed that changes in time of volcanic tremor centroids are also strongly linked to the variations in ground deformation patterns using another baseline crossing the summit area. This relationship between tremor source location and seismic or geophysical observations is probably the consequence of the pre-eruptive pressurization which specifically influences all these observations.
Some seismic velocity change measurements were rejected due to high errors and low coherence at the MWCS step during eruptive episodes. Observations of the cross-correlation coefficient between the current and the reference autocorrelation illustrate how the waveforms are dramatically changing during eruptions, with potentially new phases appearing and disappearing until the end of the activity. This decorrelation is typically assumed to be caused by the generation of new scatterers in the medium during the eruption (e.g., Larose et al., 2010; Brenguier et al., 2011; Obermann et al., 2013). In such a case, the observed mechanism is not identified as a change of seismic velocity as the medium is assumed to be significantly damaged. Since variations of tremor sources are sometimes concomitant with the observation of decorrelation, we cannot entirely preclude some impacts of active sources creating new arrivals in the coda of the autocorrelation function. Nevertheless, the decision to use late part of the coda, which correspond to longer travel times, should reduce such a limitation. Besides, a significant part of the variations in tremor sources occurred just before eruptions and, although contamination from active sources would be expected at such times, these variations did not prevent the observation of precursors from seismic velocity variations. Furthermore, the reliability of these variations of seismic velocity was corroborated by the correlation with ground deformation (Figures 3, 4).
Our results give an exclusive insight into the dynamics and the development of explosive and effusive eruptions, specifically when looking at the remarkable link between seismic velocity variation and ground deformation. Several existing studies have associated variations of seismic velocity and cycles of inflation and deflation with changes in magma pressurization (e.g., Brenguier et al., 2008; Bennington et al., 2015; Hotovec-Ellis et al., 2015; Donaldson et al., 2017). The compression associated with an increase in magma pressurization is expected to close pores and cracks in the medium, causing an increase of the elastic moduli and the seismic velocity, along with a potential inflation at the surface (O'Connell and Budiansky, 1974). Both decreases and increases of seismic velocity have been attributed to magma pressurization as a volcano inflates. For example, Brenguier et al. (2008) explained precursory seismic velocity drops measured before several eruptions at Piton de la Fournaise volcano with a dilatation and an opening of cracks at the edifice surface. In contrast, complex patterns of decrease and increase of relative velocity induced by magma migration were observed at Merapi Volcano (Ratdomopurbo and Poupinet, 1995; Wegler et al., 2006; Budi-Santoso and Lesage, 2016). Donaldson et al. (2017) reconciled these observations by connecting the change of seismic velocity to the depth of the source of deformation. The inflation of the pressure source creates an area of extensional strain with cracks opening right above the source and a surrounding area of compressional strain with cracks closing. The deeper the source, the larger the area of extension and, as the source migrates toward the surface, this area of extension becomes smaller.
This mechanism is illustrated in our study by the seismic velocity variation measured throughout the sequence of explosive episodes from October to mid December 2013. All three stations display a consistent decrease in seismic velocity until E40 in November. Station ECPN, closest to the erupting crater, displays a persistent decrease until the end of the sequences while the other two stations start increasing. The explosive nature of this sequence is an indication of a proportional intense pressurization of the volcanic system, which fed the explosive activity until mid-December. The discrepancy in relative seismic velocity between ECPN and the other two stations after E40 would indicate a source of inflation that migrated toward the surface and a smaller associated extensional area which only impacts the closest station.
As the pressurization of the system decreased, the activity at the NSEC then evolved to a less explosive style, probably associated with a reduced pressurization of the system, and the seismic velocity was eventually restored to previous values. This recovery could also explain why no station displayed any significant precursor before the long-lasting episode E47 that started on 22 January 2014.
Our investigation emphasizes how the location of source pressurization in the volcanic plumbing system significantly impacts the measured seismic velocity changes. Existing studies already showed contrasts such as at Piton de la Fournaise and Kīlauea volcanoes where the measured pre-eruptive change of seismic velocity can, respectively decrease or increase as a result of the depth of sources of deformation and the location of the stations used (e.g., Brenguier et al., 2008; Donaldson et al., 2017). Here, we also explored how lateral variation of the source of pressurization combined with changes in types of activity also required a monitoring strategy that accounts for changes of seismic velocity in the near field. The near-field sensitivity of the autocorrelation allowed us to successfully detect previously undetected pre-eruptive signals several days before most eruptions. The reliability of these early signs of eruption is better assessed in the light of ground deformation measurements. This success offers the opportunity to better implement noise-based seismic monitoring techniques on other volcanoes and, in turn, obtain a more comprehensive understanding of their dynamics when combined with other observables.
Conclusions
We implemented the autocorrelation of ambient seismic noise using the phase cross-correlation to monitor the activity of Mt. Etna volcano. Using the continuous signal recorded at three individual, three-component, broadband seismic stations located in proximity to active vents, we successfully retrieved changes in seismic velocity several days ahead of most eruptions and unveiled associated pressurization dynamics within the subsurface. By contrast, passive interferometry averaging pairs of stations failed to unambiguously detect precursors.
All the used stations showed a very coherent evolution throughout the investigation period, despite being at different distances to the eruptive site. However, a discrepancy between the three stations appears at times when the source of pressurization is suspected to be shallower, toward the end of the explosive sequence or before an effusive episode. These different signatures which distinguish explosive and less explosive episodes are better understood in the context of the evolving pressurization pattern of the magma system. This property is particularly useful to study the co-eruptive evolution of a volcano to potentially forecast the end of a paroxysm. The seismic velocity variation was specifically useful with explosive sequences and so was the evolution of the cross-correlation coefficient between the current and the reference autocorrelation function during the effusive sequence, respectively.
Our results are correlated with variations in tremor source before eruptions. Although we do not definitively preclude a possible contribution of co-eruptive seismic sources in the decorrelation observed during volcanic eruption, the combination of the phase cross-correlation and the moving-window cross-spectral analysis should reasonably mitigate such an influence. Our results, also strongly correlated with ground deformation, did not indicate a particular contamination of seismic velocity variation measurements by variations of tremor sources. Ultimately, our results also prove that the autocorrelation of ambient seismic noise can be used to monitor volcanoes with different types of activity, even on sparse networks.
Author Contributions
RD is the main investigator on this research. He selected and implemented the method for the seismic interferometry and wrote most of the manuscript. AC provided the seismic data, contributed to parts of the manuscript and the tremor sources location. FC provided the baseline changes and contributed to parts of the manuscript. CC participated in the interpretation of the results and the elaboration of the manuscript. TL helped shape the methodology, the interpretation, and the text. OF supervised the work and contributed to the manuscript.
Funding
This work was funded by the University of Luxembourg.
Conflict of Interest Statement
The authors declare that the research was conducted in the absence of any commercial or financial relationships that could be construed as a potential conflict of interest.
Acknowledgments
We are indebted to the technicians of the INGV, Osservatorio Etneo for enabling the acquisition of seismic data. AC thanks the project ICE-VOLC (PNRA14_00011) funded by Programma Nazionale Ricerche in Antartide. Original data used in this manuscript are available from these authors: AC for volcanic tremor data (andrea.cannata@unipg.it), FC for GPS data (flavio.cannavo@ingv.it).
References
Ballmer, S., Wolfe, C. J., Okubo, P. G., Haney, M. M., and Thurber, C. H. (2013). Ambient seismic noise interferometry in Hawai'i reveals long-range observability of volcanic tremor. Geophys. J. Int. 194, 512–523. doi: 10.1093/gji/ggt112
Behncke, B., Branca, S., Anna Corsaro, R., Emanuela, D. B., Miraglia, L., and Proietti, C. (2014). The 2011-2012 summit activity of mount etna: birth, growth and products of the new se crater. J. Volcanol. Geotherm. Res. 270, 10–21. doi: 10.1016/j.jvolgeores.2013.11.012
Bennington, N. L., Haney, M., De Angelis, S., Thurber, C. H., and Freymueller, J. (2015). Monitoring changes in seismic velocity related to an ongoing rapid inflation event at okmok volcano, Alaska. J. Geophys. Res. B Solid Earth 120, 5664–5676. doi: 10.1002/2015JB011939
Bensen, G. D., Ritzwoller, M. H., Barmin, M. P., Levshin, A. L., Lin, F., Moschetti, M. P., et al. (2007). Processing seismic ambient noise data to obtain reliable broad-band surface wave dispersion measurements. Geophys. J. Int. 169, 1239–1260. doi: 10.1111/j.1365-246X.2007.03374.x
Bonforte, A., and Guglielmino, F. (2015). Very shallow dyke intrusion and potential slope failure imaged by ground deformation: the 28 December 2014 Eruption on Mount Etna. Geophys. Res. Lett. 42, 2727–2733. doi: 10.1002/2015GL063462
Brenguier, F., Clarke, D., Aoki, Y., Shapiro, N. M., Campillo, M., and Ferrazzini, V. (2011). Monitoring volcanoes using seismic noise correlations. Comptes Rendus Geosci. 343, 633–638. doi: 10.1016/j.crte.2010.12.010
Brenguier, F., Rivet, D., Obermann, A., Nakata, N., Boué, P., Lecocq, T., et al. (2016). 4-D noise-based seismology at volcanoes: ongoing efforts and perspectives. J. Volcanol. Geother. Res. 321, 182–195. doi: 10.1016/j.jvolgeores.2016.04.036
Brenguier, F., Shapiro, N. M., Campillo, M., Ferrazzini, V., Duputel, Z., Coutant, O., et al. (2008). Towards forecasting volcanic eruptions using seismic noise. Nat. Geosci. 1, 126–130. doi: 10.1038/ngeo104
Budi-Santoso, A., and Lesage, P. (2016). Velocity variations associated with the large 2010 Eruption of Merapi Volcano, Java, retrieved from seismic multiplets and ambient noise cross-correlation. Geophys. J. Int. 206, 221–240. doi: 10.1093/gji/ggw145
Cannata, A. (2012). Crustal changes at Mt. Etna volcano accompanying the 2002-2003 eruption as inferred from a repeating earthquake analysis. Geophys. Res. Lett. 39, 2–7. doi: 10.1029/2012GL053185
Cannata, A., Cannavò, F., Montalto, P., Ercoli, M., Mancinelli, P., Pauselli, C., et al. (2017). Monitoring crustal changes at volcanoes by seismic noise interferometry: Mt. Etna case of study. J. Volcanol. Geothermal. Res. 37, 165–174. doi: 10.1016/j.jvolgeores.2017.03.023
Cannata, A., Di Grazia, G., Aliotta, M., Cassisi, C., Montalto, P., and Patanè, D. (2013). Monitoring seismo-volcanic and infrasonic signals at volcanoes: Mt. Etna case study. Pure Appl. Geophys. 170, 1751–1771. doi: 10.1007/s00024-012-0634-x
Cannata, A., Spedalieri, G., Behncke, B., Cannavò, F., Di Grazia, G., Gambino, S., et al. (2015). Pressurization and depressurization phases inside the plumbing system of Mount Etna volcano: evidence from a multiparametric approach. J. Geophys. Res. Solid Earth. 120, 5965–5982. doi: 10.1002/2015JB012227
Clarke, D., Zaccarelli, L., Shapiro, N. M., and Brenguier, F. (2011). Assessment of resolution and accuracy of the moving window cross spectral technique for monitoring crustal temporal variations using ambient seismic noise. Geophys. J. Int. 186, 867–882. doi: 10.1111/j.1365-246X.2011.05074.x
De Beni, E., Behncke, B., Branca, S., Nicolosi, I., Carluccio, R., D'Ajello Caracciolo, F., et al. (2015). The continuing story of etna's new southeast crater (2012-2014): evolution and volume calculations based on field surveys and aerophotogrammetry. J. Volcanol. Geotherm. Res. 303, 175–186. doi: 10.1016/j.jvolgeores.2015.07.021
De Plaen, R. S. M., Lecocq, T., Caudron, C., Ferrazzini, V., and Francis, O. (2016). Single station monitoring of volcanoes using seismic ambient noise. Geophys. Res. Lett. 43, 8511–8518. doi: 10.1002/2016GL070078
Di Grazia, G., Falsaperla, S., and Langer, H. (2006). Volcanic tremor location during the 2004 Mount Etna lava effusion. Geophys. Res. Lett. 33, 1–4. doi: 10.1029/2005GL025177
Donaldson, C., Caudron, C., Green, R. G., Thelen, W. A., and White, R. S. (2017). Relative seismic velocity variations correlate with deformation at kilauea volcano. Sci. Adv. 3:e1700219. doi: 10.1126/sciadv.1700219
Duputel, Z., Ferrazzini, V., Brenguier, F., Shapiro, N., Campillo, M., Alexandre, N., et al. (2009). Real time monitoring of relative velocity changes using ambient seismic noise at the piton de la fournaise volcano (La Réunion) from January 2006 to June 2007. J. Volcanol. Geothermal Res. 184, 164–173. doi: 10.1016/j.jvolgeores.2008.11.024
Hadziioannou, C., Larose, E., Coutant, O., Roux, P., and Campillo, M. (2009). Stability of monitoring weak changes in multiply scattering media with ambient noise correlation: laboratory experiments. J. Acoust. Soc. Am. 125, 3688–3695. doi: 10.1121/1.3125345
Hobiger, M., Wegler, U., Shiomi, K., and Nakahara, H. (2014). Single-station cross-correlation analysis of ambient seismic noise: application to stations in the surroundings of the 2008 iwate-miyagi nairiku earthquake. Geophys. J. Int. 198, 90–109. doi: 10.1093/gji/ggu115
Hodrick, R. J., and Prescott, E. C. (1981). Postwar U. S. Business Cycles : An Empirical Investigation. Northwestern University, Center for Mathematical Studies in Economics and Management Science, 451.
Hodrick, R. J., and Prescott, E. C. (1997). Postwar U. S. business cycles : an empirical investigation. J. Money 29, 1–16.
Hotovec-Ellis, A. J., Gomberg, J., Vidale, J. E., and Creager, K. C. (2014). A continuous record of intereruption velocity change at mount st. helens from coda wave interferometry. J. Geophys. Res. Solid Earth 119, 2199–2214. doi: 10.1002/2013JB010742
Hotovec-Ellis, A. J., Vidale, J. E., Gomberg, J., Thelen, W., and Moran, S. C. (2015). Changes in seismic velocity during the first 14 Months of the 2004-2008 eruption of Mount St. Helens, washington. J. Geophys. Res. Solid Earth 120, 6226–6640. doi: 10.1002/2015JB012101
Kasatkina, E., Koulakov, I., West, M., and Izbekov, P. (2014). Seismic structure changes beneath redoubt volcano during the 2009 eruption inferred from local earthquake tomography. J. Geophys. Res. Solid Earth 119, 4938–4954. doi: 10.1002/2013JB010935
Larose, E., Planes, T., Rossetto, V., and Margerin, L. (2010). Locating a small change in a multiple scattering environment. Appl. Phys. Lett. 96, 2012–2015. doi: 10.1063/1.3431269
Lecocq, T., Caudron, C., and Brenguier, F. (2014). MSNoise, a python package for monitoring seismic velocity changes using ambient seismic noise. Seismol. Res. Lett. 85, 715–726. doi: 10.1785/0220130073
Obermann, A., Planès, T., Larose, E., and Campillo, M. (2013). Imaging preeruptive and coeruptive structural and mechanical changes of a volcano with ambient seismic noise. J. Geophys. Res. Solid Earth 118, 6285–6294. doi: 10.1002/2013JB010399
O'Connell, R. J., and Budiansky, B. (1974). Seismic velocities in dry and saturated cracked solids. J. Geophys. Res. Solid Earth 79, 5412–5426. doi: 10.1029/JB079i035p05412
Patanè, D., Di Grazia, G., Cannata, A., Montalto, P., and Boschi, E. (2008). The shallow magma pathway geometry at Mt. Etna volcano. Geochem. Geophys. Geosyst. 9:12. doi: 10.1029/2008GC002131
Ponte, G. (1920). Sulla Fontana Di Lava Etnea Del 1917. Atti Dell'Accademia Gioenia Di Scienze Naturali Di Catania Ser 12, 1–9.
Ratdomopurbo, A., and Poupinet, G. (1995). Monitoring a temporal change of seismic velocity in a volcano: application to the 1992 eruption of Mt. Merapi (Indonesia). Geophys. Res. Lett. 22, 775–778. doi: 10.1029/95GL00302
Rivet, D., Brenguier, F., and Cappa, F. (2015). Improved detection of preeruptive seismic velocity drops at the piton de la fournaise volcano. Geophys. Res. Lett. 42, 6332–6339. doi: 10.1002/2015GL064835
Schimmel, M. (1999). Phase cross-correlations: design, comparisons, and applications. Bull. Seismol. Soc. Am. 89, 1366–1378
Schimmel, M., Stutzmann, E., and Gallart, J. (2011). Using instantaneous phase coherence for signal extraction from ambient noise data at a local to a global scale. Geophys. J. Int. 184, 494–506. doi: 10.1111/j.1365-246X.2010.04861.x
Spampinato, L., Sciotto, M., Cannata, A., Cannavò, F., La Spina, A., Palano, M., et al. (2015). Multiparametric study of the February-April 2013 paroxysmal phase of Mt. Etna new south-east crater. Geochem. Geophys. Geosyst. 2013, 1932–1949. doi: 10.1002/2015GC005795
Spina, L., Taddeucci, J., Cannata, A., Sciotto, M., Del Bello, E., Scarlato, P., et al. (2017). Time-series analysis of fissure-fed multi-vent activity: a snapshot from the July 2014 eruption of etna volcano (Italy). Bull. Volcanol. 79, 79–51. doi: 10.1007/s00445-017-1132-x
Stehly, L., Campillo, M., Froment, B., and Weaver, R. L. (2008). Reconstructing green's function by correlation of the coda of the correlation ( C 3 ) of ambient seismic noise. J. Geophys. Res. Solid Earth 113, 1–10. doi: 10.1029/2008JB005693
Viccaro, M., Zuccarello, F., Cannata, A., Palano, M., and Gresta, S. (2016). How a complex basaltic volcanic system works: constraints from integrating seismic, geodetic, and petrological data at mount etna volcano during the July-August 2014 eruption. J. Geophys. Res. 121, 5659–5678. doi: 10.1002/2016JB013164
Wegler, U., Lühr, B. G., Snieder, R., and Ratdomopurbo, A. (2006). Increase of shear wave velocity before the 1998 Eruption of merapi volcano (Indonesia). Geophys. Res. Lett. 33, 4–7. doi: 10.1029/2006GL025928
Keywords: volcano monitoring, ambient seimic noise, autocorrelation, Mt. Etna volcano, seismic noise interferometry, volcanic tremor, seismic velocity variation
Citation: De Plaen RSM, Cannata A, Cannavo' F, Caudron C, Lecocq T and Francis O (2019) Temporal Changes of Seismic Velocity Caused by Volcanic Activity at Mt. Etna Revealed by the Autocorrelation of Ambient Seismic Noise. Front. Earth Sci. 6:251. doi: 10.3389/feart.2018.00251
Received: 08 March 2018; Accepted: 21 December 2018;
Published: 17 January 2019.
Edited by:
Zhong Lu, Southern Methodist University, United StatesReviewed by:
Matthew Haney, Alaska Volcano Observatory (AVO), United StatesValerio Acocella, Università degli Studi Roma Tre, Italy
Copyright © 2019 De Plaen, Cannata, Cannavo', Caudron, Lecocq and Francis. This is an open-access article distributed under the terms of the Creative Commons Attribution License (CC BY). The use, distribution or reproduction in other forums is permitted, provided the original author(s) and the copyright owner(s) are credited and that the original publication in this journal is cited, in accordance with accepted academic practice. No use, distribution or reproduction is permitted which does not comply with these terms.
*Correspondence: Raphael S. M. De Plaen, raphael.deplaen@gmail.com