Multi-year Satellite Observations of Sulfur Dioxide Gas Emissions and Lava Extrusion at Bagana Volcano, Papua New Guinea
 Brendan T. McCormick Kilbride1*
  Kila Mulina2
  Geoffrey Wadge3
  R. Wally Johnson4 Ima Itikarai2
  Marie Edmonds1
- 1COMET, Department of Earth Sciences, University of Cambridge, Cambridge, United Kingdom
- 2Rabaul Volcanological Observatory, Rabaul, Papua New Guinea
- 3COMET, Department of Meteorology, University of Reading, Reading, United Kingdom
- 4School of Asia and the Pacific, Australian National University, Canberra, ACT, Australia
Bagana, arguably the most active volcano in Papua New Guinea, has been in a state of near-continuous eruption for over 150 years, with activity dominated by sluggish extrusion of thick blocky lava flows. If current extrusion rates are representative, the entire edifice may have been constructed in only 300–500 years. Bagana exhibits a remarkably high gas flux to the atmosphere, with persistent sulfur dioxide (SO2) emissions of several thousand tons per day. This combination of apparent youth and high outgassing fluxes is considered unusual among persistently active volcanoes worldwide. We have used satellite observations of SO2 emissions and thermal infrared radiant flux to explore the coupling of lava extrusion and gas emission at Bagana. The highest gas emissions (up to 10 kt/day) occur during co-extrusive intervals, suggesting a degree of coupling between lava and gas, but gas emissions remain relatively high (~2,500 t/d) during inter-eruptive pauses. These passive emissions, which clearly persist for decades if not centuries, require a large volume of degassing but non-erupting magma beneath the volcano with a substantial exsolved volatile phase to feed the remarkable SO2 outgassing: an additional ~1.7–2 km3 basaltic andesite would be required to supply the excess SO2 emissions we observe in our study interval (2005 to present). That this volatile phase can ascend freely to the surface under most conditions is likely to be key to Bagana's largely effusive style of activity, in contrast with other persistently active silicic volcanoes where explosive and effusive eruptive styles alternate.
1. Introduction
Long-lived eruptions from silicic volcanoes are a common and hazardous mode of volcanism. Over two hundred volcanoes have exhibited cycles of lava dome-building and destruction in the Holocene (Global Volcanism Program, 2013), and two thirds of the fatalities caused by volcanic activity since 1600 CE are attributed to eruptions at these volcanoes (Auker et al., 2013). The characteristics of persistent silicic volcanism include: the emplacement of lava flows and domes composed of crystal-rich, high viscosity lava (106–1011 Pa s); strongly cyclic behavior with episodes of lava extrusion punctuated by violent Vulcanian or sub-Plinian explosive eruptions; and relatively slow extrusion rates (10−2–10−1 km3 year−1) that may persist for months or years (Druitt and Kokelaar, 2002; Sherrod et al., 2008; Power et al., 2010; Wadge et al., 2014; Sheldrake et al., 2016). Many persistently active silicic volcanoes are also major sources of volcanic gas, with outgassing fluxes remaining high even during pauses between eruptive phases (Delgado-Granados et al., 2001; Edmonds et al., 2003; Arellano et al., 2008; Lopez et al., 2013b).
Few volcanoes worldwide are so persistently active as Bagana, Papua New Guinea, which has many of the traits outlined above (long-lived eruptions, crystal-rich magmas, slow extrusion rate, substantial outgassing) yet seems to lack the classic episodic extrusive/explosive eruption cycle so characteristic of dome-building volcanoes (Barmin et al., 2002; Sheldrake et al., 2016). Bagana has exhibited near-continuous extrusion of andesitic lava flows since it was first observed by scientists in the 1840s (Bultitude et al., 1978; Wadge et al., 2012) and is a remarkable emitter of sulfur dioxide (SO2) with the highest persistent outgassing flux of any volcano worldwide without a lava lake (McGonigle et al., 2004b; McCormick et al., 2012; Carn et al., 2017). The volcano's remote location precludes regular visits and satellite remote sensing has emerged as a key tool for studying Bagana (McCormick et al., 2012; Wadge et al., 2012, 2018). Many aspects of Bagana's activity remain enigmatic, including the mechanisms of its prodigious gas output and the key processes controlling the timing and intensity of lava extrusion.
In this contribution we use satellite observations to explore the activity of Bagana over the last decade with a particular focus on lava extrusion and SO2 gas emissions. We show that Bagana's activity is strongly episodic, with phases of lava extrusion and elevated gas emissions lasting for several months, separated by pauses of similar duration where extrusion may cease. We find clear evidence for strong co-eruptive coupling between gas and magma, but also for substantial passive gas emissions during inter-eruptive pauses. We consider it likely that a substantial exsolved volatile phase is present in the shallow plumbing system (Wallace, 2005; Wallace and Edmonds, 2011; Parmigiani et al., 2016; Edmonds and Woods, 2018), comprising a large proportion of the co-eruptive gas flux and dominating the inter-eruptive passive emissions. This volatile-rich phase could exert a strong influence on eruptive style: a permeability drop in the upper conduit impeding gas escape is an important mechanism for triggering explosive eruptions (Stix et al., 1993; Edmonds et al., 2003; Geirsson et al., 2014). Explosive eruptions do occur infrequently at Bagana and threaten surrounding isolated villages with ashfall, debris avalanche and pyroclastic flow inundation. Deeper insight into volcanic processes at Bagana will benefit from careful analyses of recent erupted products, and dedicated ground-based monitoring. At a minimum we advocate continued satellite surveillance of this active and potentially dangerous volcano.
2. Geological Context
2.1. Tectonic Setting and Volcanism on Bougainville
Bagana is located on Bougainville Island, geographically part of the Solomon archipelago but politically an autonomous region of Papua New Guinea (PNG). PNG lies in a complex tectonic buffer zone between the southwest–northeast converging Australian continent and the Ontong-Java plateau in the Pacific Ocean (Figure 1a). The interactions of rotating microplates—the Woodlark, Adelbert, North and South Bismarck, and Solomon Sea plates—control the volcanic and seismic activity in the region. Volcanism on Bougainville is a consequence of the Solomon Sea plate being subducted beneath the Pacific plate. Total convergence across the boundary is rapid (93–110 mm/yr), earthquake locations point to a steeply dipping (~70o) slab, and water depths in the adjacent trench exceed 8,000 m (Tregoning et al., 1998; Syracuse and Abers, 2004; Holm and Richards, 2013; Holm et al., 2016).
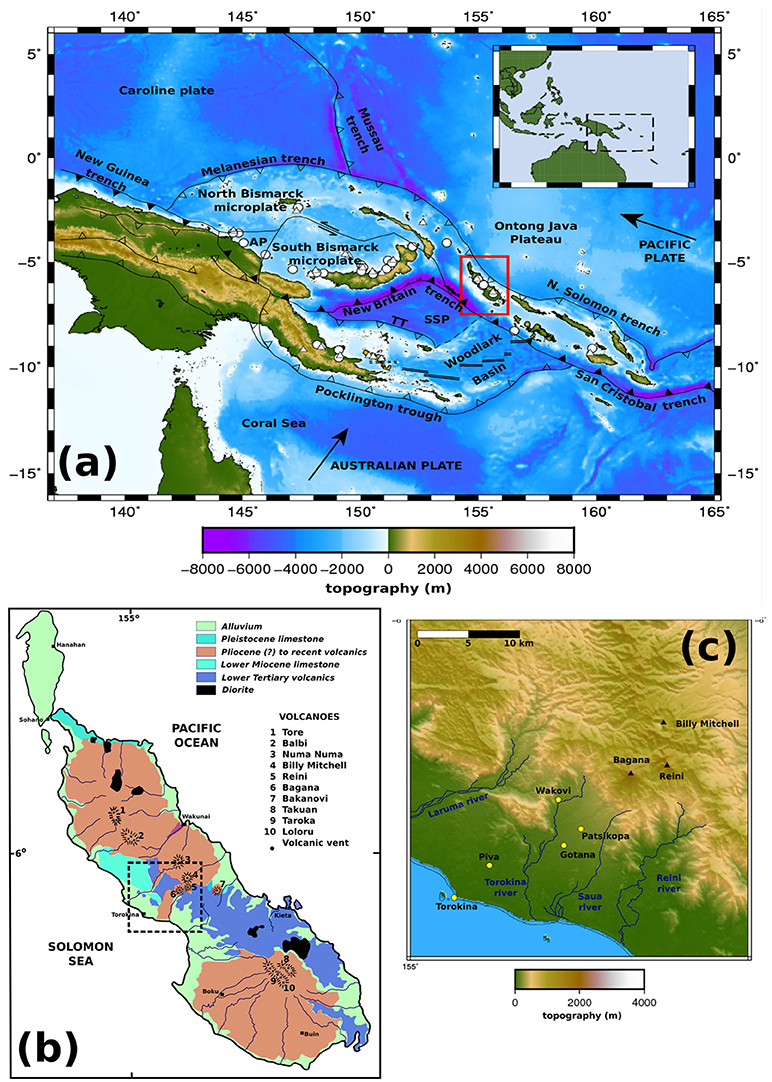
Figure 1. (a) Tectonic setting of Papua New Guinea. Topography and bathymetry from EOAA ETOPO1 Global Relief Model (doi: 10.7289/V5C8276M). Plate names, boundaries and arrows indicating rate and direction of motion from Holm et al. (2016). AP, Adelbert Microplate; TT, Trobriand Trough; SSP, Solomon Sea Plate. Ticked boundaries are subduction zones, with active (black triangles) and inactive (open triangles) margins distinguished. (b) Sketch geological map of Bougainville showing major lithologies and known volcanoes, redrawn from Blake (1968). (c) Bagana environs with settlements, rivers and neighboring volcanoes indicated. Topography from Shuttle Radar Topography Mission, USGS, 2000.
Blake (1968) identifies seventeen post-Miocene volcanoes on Bougainville, running southeast along the mountainous central spine of the island (Figure 1b). Two caldera-forming eruptions at Billy Mitchell, of VEI 5 and 6, respectively, are dated to 1030 ± 25 and 1580 ± 20 Common Era (Global Volcanism Program, 2013). Balbi and Loloru exhibit fumarolic activity and are considered dormant. The remainder of Bouganville's volcanoes show no signs of activity and are considered extinct. Bougainville and the other Solomon Islands are largely formed of Tertiary and Quaternary volcanic rocks, derived sediments, and subordinate limestones (Blake and Miezitis, 1967; Blake, 1968). The highest point on Bougainville is the summit of Balbi (2,591 m); Bagana's summit elevation is currently 1,897 m (Wadge et al., 2018).
2.2. Bagana Volcano
Bagana is an andesitic lava cone, a stratovolcano dominantly built of overlapping lava flows with only small volumes of pyroclastics. Reliable observations date to 1842 and the characteristic activity comprises the extrusion of slow-moving blocky lava flows persisting for weeks to months (Blake, 1968; Bultitude, 1976, 1981; Cooke and Johnson, 1978; Bultitude and Cooke, 1981). The lava flows are tens of meters thick and exhibit prominent levee-bound margins on the volcano's steep upper and medial slopes and extensive lateral spread into steep-fronted lobes at lower elevations (Figure 2). Satellite radar observations of lava extrusion during 2010-11 revealed strongly pulsatory extrusion rates, with a 14-month mean of 0.92 m3 s−1 (Wadge et al., 2012). By digital elevation model (DEM) differencing over timescales from years to decades, Wadge et al. (2018) calculated a mean extrusion rate of ~1.0 m3 s−1 for 1945–2014. If these extrusion rates are representative, the entire Bagana edifice—estimated by Wadge et al. (2018) to have volume of 5.1–9.6 km3—could have been built in only 300–500 years.
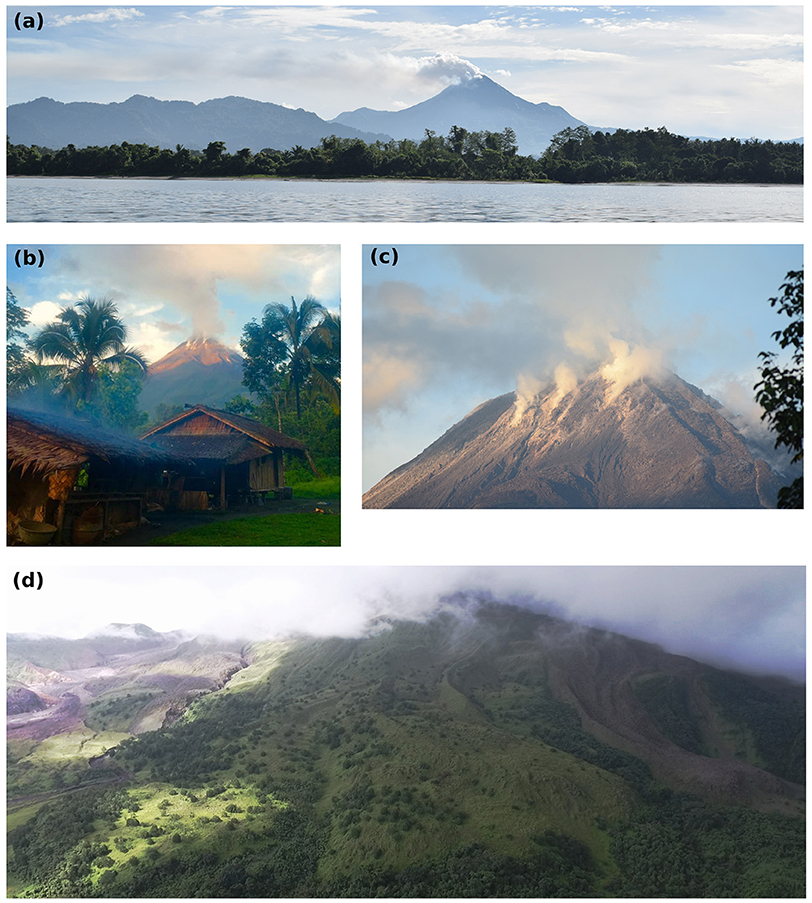
Figure 2. (a) Bagana viewed from off-shore to the west-southwest. Note strong summit gas plume. Distance to summit ~25 km. (b) A rare clear view of Bagana's summit, as seen from Patsikopa village (Figure 1c), ~7 km to the southwest (c) Zoom to summit region, highlighting strongly degassing fumaroles and steep, levee-bound upper reaches of the 2000–2008 lava flow field. (d) Aerial photograph (taken by DJI Phantom drone onboard camera) of lower western slopes of Bagana, with 2000–2008 lava flow field to the right of the image and heavily vegetated lava flows dating from 1952–1966 in the center. Far left of the image shows distal ends of 2010–2012 lava flow, and recent debris avalanche deposits reported to have been emplaced in August 2016. Upper slopes are obscured by low altitude cloud. All photographs by B.T. McCormick Kilbride, September 2016.
Bagana's shallow summit crater can be occupied by a small lava dome but this is frequently obscured by a dense gas plume emanating from numerous fumaroles on the dome surface (Figure 2). Infrequent explosive eruptions destroy the dome, modify the geometry of the crater rim, and may influence the downslope direction of lava flows. There are extensive scree and talus deposits on the volcano flanks sourced from lava flows, pyroclastic density currents and debris avalanches. We (BMK) visited Bagana in September 2016 and recent debris flow deposits extended 4.5 km from the summit. Ephemeral hot springs are reported around the base of the cone, and we noted high water temperatures (~60°C) in tributaries of the Torokina river close to the volcano.
Bagana lavas are porphyritic basaltic andesites, with 30–50 volume % phenocrysts of plagioclase, augite, magnetite and hornblende, and a matrix of plagioclase microlites, hypersthene, magnetite, and glass (Blake, 1968; Bultitude, 1976; Bultitude et al., 1978). Analyzed lavas fall into three groups, chemically distinct and erupted during different periods of activity. Pre-1943 lavas, termed Group 1 by Bultitude et al. (1978), are the most evolved products of the volcano, with SiO2 contents of ~56–58 wt%. Lavas erupted during 1943-53 (Group 2) are the most primitive products sampled (SiO2 ~53–54 wt%), while Group 3 lavas, erupted during 1959–1975, are intermediate in composition, with SiO2 ~55-56 wt%. Lavas erupted in 1988–1989 (Rogerson et al., 1989) and recent lavas erupted post-2005 also appear to be compositionally similar to Group 3 (B. McCormick Kilbride, unpublished data).
2.3. Recent Activity of Bagana
Bagana's historical activity has been comprehensively reviewed by Bultitude et al. (1978), Bultitude (1981) and Bultitude and Cooke (1981). Prior to the Second World War, when air traffic in the region increased significantly, observations of the volcano were very rare. Wadge et al. (2018) drew on several decades of pilot reports, ground-based observations and, in particular, satellite remote sensing, to construct the most complete account of Bagana's activity to date. Here, we review only the activity during our study interval, 2000 to 2017, summarized in Figure 3. Other accounts of Bagana's activity can be found in the Bulletins of the Global Volcanism Program [http://volcano.si.edu/volcano.cfm?vn=255020], drawn from information provided by Rabaul Volcanological Observatory (RVO) and the Darwin Volcanic Ash Advisory Centre (VAAC).
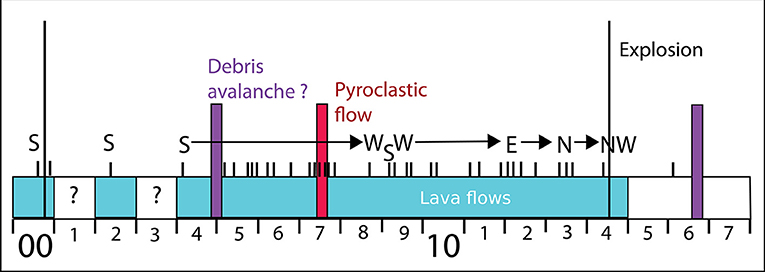
Figure 3. Summary of activity reported at Bagana for our study interval, 2000–2017, after Wadge et al. (2018). Light blue shading corresponds to reports of active lava extrusion. Vertical purple and red bars indicate timing of known major debris avalanches or pyroclastic flows, and long vertical black lines indicate known large explosive eruptions. Short vertical black tick marks indicate timing of ASTER acquisitions where lava flow direction, shown as cardinal and ordinal letters, on the volcano's flanks can be distinguished.
Figure 3 is largely based on ASTER observations (Advanced Spaceborne Thermal Emissions and Reflection Radiometer carried on the NASA Terra satellite, Pieri and Abrams, 2004). ASTER makes observations with high (sub-100 m) spatial resolution in both visible/near-infrared (VNIR) and thermal infrared (TIR) and is particularly valuable for Bagana in that the radiative portion of active lava flows can be imaged at sufficient resolution to determine the direction of flow away from the summit crater. Our catalog of ASTER images is available in the Supplementary Material accompanying this manuscript. The timing and directional information (e.g., S = south) of these observations are shown by short black vertical lines in Figure 3; the limited number of observations over several years is a consequence of ASTER's infrequent observations as well as clouds obscuring lava flow thermal emissions. From 2000 to 2008 lava flowed south, though there is no positive evidence of this for 2001 and 2003. From 2008 to 2014 lava flowed successively west, south, west, east, north and northwest. There is no ASTER evidence of flank lava flows since 2014 though there have been radiant signals from the summit crater. Other significant events are recorded in Figure 2, two debris avalanches (late 2004 and 2016), two large explosions (late 2000 and mid 2014), and a pyroclastic flow in mid 2007. This may not be a complete record of activity at Bagana. RVO visits to the volcano are infrequent and although local observers make nominally daily reports to the Observatory, these are limited to clear views of the western slopes of the volcano.
All reported activity at Bagana includes reference to a dense and persistent summit gas plume. To date, only SO2 emissions have been measured at Bagana, with recent attempts to quantify plume gas chemistry using UAV-based sensors proving inconclusive [S. Arellano, personal communication]. SO2 emissions were first measured by COSPEC in 1983 and 1989 and were reported as 36 and 37 kg s−1, respectively, equivalent to ~3,100–3,200 t d−1 or 1,130–1,170 kt y−1 (Global Volcanism Program, 1983, 1989; Andres and Kasgnoc, 1998). An airborne DOAS survey in 2003 measured SO2 emissions of 23 kg s−1, equivalent to ~2,000 t d−1 or 725 kt y−1 (McGonigle et al., 2004b). OMI observations during 2004-2008 measured a total of 455 kt but this is likely to be an underestimate of true SO2 emissions caused by rapid plume processing and the low altitude of Bagana's plume (McCormick et al., 2012). Recent global inventories of volcanic emissions reported Bagana's mean annual SO2 flux for the period 2005–2015 as 1,380 kt y−1, making it the third highest persistent volcanic SO2 source after Ambrym and Kilauea (Fioletov et al., 2016; Carn et al., 2017).
3. Materials and Methods
3.1. Remote Sensing of SO2 Emissions
3.1.1. The Ozone Monitoring Instrument
The Ozone Monitoring Instrument (OMI) is a hyperspectral UV/visible spectrometer launched in 2004 aboard the Aura satellite in NASA's A-train constellation (Levelt et al., 2006a,b). OMI observations have been widely used to study volcanic SO2 emissions, both from discrete eruptions (Thomas et al., 2009; Carn and Prata, 2010; Lopez et al., 2013a) and over multi-year intervals on the regional and global scale (McCormick et al., 2012, 2015; Carn et al., 2016, 2017; Fioletov et al., 2016). OMI measures backscattered solar radiation from Earth's surface and atmosphere and SO2 column concentrations have been calculated using a series of increasingly sophisticated retrieval algorithms (Krotkov et al., 2006; Yang et al., 2007, 2009; Li et al., 2013, 2017). All OMI mission data are archived online [https://mirador.gsfc.nasa.gov/] and the entire dataset has recently been re-analyzed using the latest retrieval algorithm, based on principal component analysis, PCA (Li et al., 2013, 2017; Carn et al., 2017).
The PCA-retrieved background SO2 has a standard deviation of ~0.5 Dobson units (DU, 1 DU = 2.69 × 1026 molec km−2), a factor of two reduction in retrieval noise over the preceding linear fit algorithm (Fioletov et al., 2016; Krotkov et al., 2016). The total error for a single retrieval may be 70–150% (Krotkov et al., 2016) but a comprehensive error analysis of the OMSO2VOLCANO product, encompassing retrieval noise, plume altitude, cloud cover, latitude, and other factors has not yet been published. Systematic errors in the SO2 Jacobians used in the retrieval arise where local observational conditions differ widely from those assumed in the Jacobian calculations. SO2 column concentration is likely to be overestimated in scenes with snow, ice or cloud cover, or in the free troposphere over the open ocean. Certain precautions can be made to reduce error, such as rejecting pixels from the outermost two rows of the OMI swath, which are subject to elevated noise levels and have significantly larger area than more central pixels, and high-reflectivity pixels with cloud fractions in excess of 0.3. Cloud cover can be extensive in tropical locations such as Papua New Guinea and further work is certainly needed to accommodate spatially and temporally variable cloud cover in SO2 retrievals.
Time-averaging has been widely used for its significant effect in reducing uncertainties due to retrieval noise. For example, uncertainties fall to 10–15% of the signal on an annual basis (Krotkov et al., 2016). Generally, we have avoided the use of individual retrievals in this study pending further quantitative evaluation of the data quality and focussed largely on annual or monthly summing and averaging of SO2 retrievals. Overall, the PCA algorithm's significantly reduced noise and regional biases relative to earlier operational products make it substantially better suited to quantifying lower altitude (i.e., planetary boundary layer, PBL) SO2 emissions than earlier operational data products (Fioletov et al., 2016; Krotkov et al., 2016; Carn et al., 2017).
3.1.2. SO2 Mass Loading, Lifetime and Emission Rates
The PCA retrieval algorithm yields atmospheric SO2 column concentrations for every pixel in the OMI swath. Given the area of each pixel and by summing pixels, we compute a total SO2 mass loading in each field-of-view (FOV) “scene.” Different estimates of column concentration are provided according to the SO2 plume altitude. The PBL SO2 column concentration assumes a plume center of mass altitude (CMA) of 1.0 km, somewhat lower than Bagana's summit altitude of ~1.8 km. Following Fioletov et al. (2016) and Carn et al. (2017) we perform a correction on the retrieved SO2 vertical column densities by using a local air mass factor (AMF, 0.547) rather than the default effective AMF of 0.36 used in the full PCA retrieval. This AMF correction reduces scene mass loadings by ~33%. We lack reliable measurements of plume altitude at Bagana but given the dominantly passive or co-extrusive character of the emissions we do not envisage a strong thermal lofting effect and therefore consider the vent altitude a reasonable estimate of long-term mean plume altitude. The lower troposphere SO2 data (TRL, with CMA ~2.5 km) yield scene mass loadings around 65% lower than the PBL data and probably underestimate SO2 mass loading over Bagana.
We calculate mass loadings for a roughly 2o latitude/longitude domain centered on Bagana, adjusting this domain manually to capture the full extent of elongate plumes, or to avoid incursions from drifting SO2 from nearby passive degassing volcanoes (e.g., Rabaul, Ulawun) or regional eruptions (e.g., Manam in January 2005). These total SO2 mass loadings represent the volcano's emissions since the previous satellite overpass, less any SO2 that has been advected beyond the margins of the box or has been removed by chemical or physical processes. Single orbit SO2 mass loadings are unlikely to be equal to at-source daily SO2 emission rates, unless SO2 lifetime is close to 24 h (i.e., 1 day). SO2 can be removed from the atmosphere by oxidation to or direct physical processes, such as wet deposition. The lifetime of SO2 in the tropical boundary layer or troposphere is thought to be ~1–2 days but estimates of SO2 lifetime vary widely and depend on a host of factors: gas-phase oxidation is limited by hydroxyl availability; wet deposition and aqueous-phase oxidation by atmospheric humidity and cloud cover; other aerosol reaction pathways by pH or the availability of particulate reaction surfaces (Eatough et al., 1994; Faloona, 2009). Volcanic plumes are highly heterogenous in their chemistry, particle content and humidity and consequently lifetime estimates of volcanic SO2 vary more widely (Oppenheimer et al., 1998; McGonigle et al., 2004a; Rodriguez et al., 2008; Boichu et al., 2013; Beirle et al., 2014; McCormick et al., 2014).
Lopez et al. (2013a) and Carn et al. (2016) presented simple methods to calculate SO2 emission rate (tons per day) by multiplying scene SO2 mass loading (tons SO2) by plume speed (kilometers per hour, or day) and dividing by the plume length (km). This method can be extended to calculate the scene SO2 lifetime, which is equal to the mass loading divided by the emission rate. The main caveats of this approach are the need for an accurate local wind speed and also for plumes of a linear geometry, where SO2 column concentration decreases downwind and steady state emissions can be reasonably assumed. We identified 75 such SO2 plumes in our OMI observations and performed these calculations to obtain SO2 emission rate and lifetimes from our measured mass loadings. Our plume speed estimates come from NCEP Renanalysis 2 data (provided by the NOAA/OAR/ESRL PSD, Boulder, USA, available online: https://www.esrl.noaa.gov/psd) for a plume altitude of ~2 km. We calculate SO2 lifetime ranging from 9 to 43 h, with a mean of 22.5 h and a standard deviation of 7.6 h. Binning our data into months of the year, we find a similar mean of 23.1 h and a decreased standard deviation of 4.5 h. There is no compelling evidence for a seasonal variation in SO2 lifetime. These results bear out the suggestion that tropospheric volcanic plumes are complex environments and SO2 lifetime can vary widely.
Incorporating SO2 lifetime into our results is not trivial. Without some assumption of lifetime, a mass loading time series cannot strictly be interpreted in terms of changing at-source emission rate. However, lifetime demonstrably varies widely and we do not have an accurate daily record of this variation. Herein, we have opted for a constant lifetime of 22.5 h in order to convert our mass loading data into emission rates. To acknowledge the uncertainty introduced by this assumption of constant lifetime, we also present higher and lower bound emission rates calculated by shorter (14.9 h) and longer (30.1 h) lifetimes, respectively. Our approach is not fully adequate to characterize the variability of SO2 lifetime but this is a formidable challenge and one that requires extensive atmospheric physical and chemical modeling of a range of volcanic plume settings in order to be overcome.
3.1.3. The OMI Row Anomaly
The early years of the OMI SO2 dataset have complete daily global coverage, achieved by the instrument's wide swath and 14/15 daily orbits (Levelt et al., 2006b). Since late 2008, coverage has been diminished due to the OMI Row Anomaly (ORA), a blockage in the sensor's field of view that renders a variable fraction of the swath unuseable (Carn et al., 2013; Flower et al., 2016). Flower et al. (2016) showed that the ORA imposes periodicities of 3.2 and 7.9 days in OMI observations, akin to the 2.3-day cycles typical of polar-orbiting satellite datasets caused by changing sensor viewing angle. Applying a running average to the data can suppress the effect of these cycles–if the averaging window used is greater in length than the cycle period–but this also reduces the dynamic range of the data. In this study, we are interested mostly in the long-term behavior of Bagana and have largely binned our satellite observations on an annual or monthly basis, effectively reducing the influence of the ORA or changing viewing geometry.
A consequence of the ORA is that gaps in an SO2 emissions time series result in an underestimate of the true emissions budget. To treat these gaps as true null values–where no SO2 was emitted from the volcano–is misleading and inconsistent with the largely continuous daily emissions observed in the early years of our dataset. Accordingly, we fill these data gaps using either averaging or linear interpolation based on preceding or following observations. For gaps of 1–5 days, we calculate the missing SO2 mass as the mean of two closest preceding and two closest following OMI observations. When the gap between consecutive observations is greater than 5 days (n = 67), we use linear interpolation between the two observations before and after the gap. On the ten occasions where data gaps exceed 10 days, we treat the null values as real null values (i.e., SO2 mass = 0), judging that an attempted correction here would be too poorly constrained by the unavailability of surrounding observations. The consequence of this correction for null values is a 56% increase in total OMI-observed SO2 mass loading over the course of our study period.
3.2. Remote Sensing of Thermal Emissions and Lava Extrusion
The Moderate Resolution Imaging Spectroradiometer (MODIS) is an infrared sensor carried by two NASA satellites, Terra and Aqua, launched in 1999 and 2004. MODIS has been used in many Earth Observation applications, notably the detection of thermal anomalies (or “hotspots”) such as wildfires and lava or pyroclastic debris from erupting volcanoes (Wright et al., 2002; Rothery et al., 2005; Wright, 2016). MODVOLC is an algorithm developed for the automated detection of volcanic hotspots and the quantification of their emitted thermal infrared (TIR) radiation (Wright et al., 2002, 2004; Wright, 2016). The MODVOLC database has full daily coverage from 2000 to the present day, can be searched and visualized online [http://modis.higp.hawaii.edu/], and provides hotspot pixel counts, spectral radiance and radiant flux for every active volcano on Earth. Other thermal monitoring algorithms exist (e.g., MIROVA, Coppola et al. (2016)) but the great advantage of MODVOLC, justifying our use of it here, is consistency of data quality and coverage over a multi-year timeframe and the care taken to avoid false positives in the data (Wright, 2016).
We have used data from both MODIS instruments, resulting in four potential daily observations of Bagana's spectral radiance. However, we restricted our analysis to nighttime observations, in order to minimize any sunglint effects. This had the effect of removing 26 alerts across the duration of our study period, leaving 1314 separate hotspot detections. The low number of daytime observations at Bagana is likely a consequence of reduced thermal contrast between the volcanic edifice and its surroundings during sunlit hours. The number of hot pixels detected within each alert varies between 1 and 8, though most alerts comprise only 1 (63%), 2 (27%), or 3 (7%) pixels. In general, the global MODVOLC database is dominated by radiant emissions from basaltic lava flows, given their tendency for high width-to-thickness ratios and high eruption temperatures (Wright, 2016). Given Bagana's basaltic andesite composition (and therefore lower temperature) and narrow, strongly channelized lava flows, the typically low number of hot pixels in any single MODIS overpass is within expectations.
Radiant flux (ϕe, measured in W, or J s−1) can be estimated from MODIS observations using an empirical relationship based on observed spectral radiance at 3.959 μm, L3.959 (after Kaufman et al., 1998; Wooster et al., 2003):
where L3.959,bg is the spectral radiance of adjacent pixels without anomalous thermal emissions. Uncertainties on individual measurements of radiant flux should not exceed 30% (Wright, 2016). We calculate the total radiant flux for each Terra or Aqua overpass by summing the radiant flux measured from each hotspot pixel. On longer (e.g., monthly or annual) timescales, we calculate the total radiated energy (J) by integration beneath the curve. After Wright (2016), we treat data gaps exceeding 7 days as real null values, where eruptive activity bringing hot lava to the Earth's surface has ceased. Shorter data gaps may be a result of clouds obscuring radiant surfaces and these gaps are accounted for in our calculations of total radiated energy by the use of linear interpolation between preceding and consecutive MODVOLC alerts.
3.3. Volcanic Ash Advisories
Volcano Ash Advisories (VAAs) resulting from activity at Bagana are issued by the Darwin VAAC, and have been mainly based on observations by the following satellites: GMS-5 (launched March 1995, decommissioned July 2005); MTSAT-1R (or Himawari-6, launched 26 February 2005, decommissioned 4 December 2015); MTSAT-2 (or Himawari-7, launched 18 February 2006, and still operational, though mostly occupying a stand-by mode); and Himawari-8 (launched 7 October 2014, and operational 7 July 2015). In addition to these Japanese-operated instruments, Darwin VAAC has used observations from the US GOES-9 satellite (reactivated between 2003 and November 2005 to provide coverage after the failure of MTSAT-1 to reach orbit) and Defense Meteorological Satellite Program (DMSP) missions, and pilot observations from a range of regional airlines. Data reported in VAAs include: the date and time of ash cloud detection; an identification of the source volcano; information on the altitude and direction of volcanic clouds; and forecasts of where the ash will disperse based on current wind fields. The Darwin archive of VAAs (June 1998 to present) is hosted online by the Australian Bureau of Meteorology [ftp://ftp.bom.gov.au/anon/gen/vaac/].
3.4. Rabaul Volcanological Observatory Reports
Bagana occupies a remote location in the heavily forested interior of Bougainville (Figure 1c), roughly 20 km northeast of Torokina, one of very few anchorages on the island's southwest coast. Several small villages lie between the volcano and the coast, with a population of roughly 8,000 in a 30 km radius (Global Volcanism Program, 2013). RVO retain a local observer to provide daily reports on activity at the volcano; the present observer is based in Gotana (9.5 km SW of the summit, 6.201°S 155.136°E) though some reports have been obtained from Wakovi (7.5 km to WSW, 6.161°S 155.132°E). The reports are variable in content but can provide useful constraint on the timing of changes in activity including whether lava flows are active, nighttime incandescence can be seen at the volcano's summit, or ashfall is reported on the villages. Reports are available fairly regularly but gaps in the record are common owing to the absences by the observer from Bougainville or clouds obscuring the volcano summit from view. The highly directional nature of Bagana's extrusive activity means that reports of lava extrusion are particularly fragmentary.
4. Results
4.1. Inter-Annual Satellite Observations
4.1.1. Comparison With Earlier Work on SO2 Emissions
We generated an inter-annual time series of Bagana SO2 emissions (Figure 5A), by first filling the null values in our scene mass loading data and performing an AMF correction, secondly by converting individual scene mass to daily emission rates using estimates of SO2 lifetime, and finally by integrating these emission rates to calculate annual emissions. Assuming a lifetime of 22.5 h is accurate, annual emissions vary from a peak of 1,284 kt in 2005 to around 350–700 kt in most other years. Emissions are lower in 2004 and 2017 where our data does not extend to the full year. Our upper range lifetime estimate (30.1 h) reduces annual emissions by ~25% while our lower range lifetime estimate (14.5 h) increases annual emissions by ~51% (Figure 5A). Following 2005, Bagana's annual emissions generally decrease but with clear secondary peaks in 2012 and 2015–2016.
A recent global OMI survey of persistent volcanic emissions (Carn et al., 2017) derived annual SO2 emission rates for Bagana for 2005–2015. Their approach was to align all detected SO2 pixels into a common wind direction and fit a modified Gaussian to the generated composite plume in order to estimate the per-year SO2 emission rates, shown alongside our data in Figure 5A. There are two important features to note in this comparison: (i) the large difference (~40–100%) in magnitude of the Carn et al. (2017) emissions and our data; and (ii) the two time series have relatively similar trends, aside from 2010 and 2012.
These differences are not straightforward to understand but seem likely to be a combined consequence of our different ways of handling the OMI data and differences in SO2 lifetime. Carn et al. (2017) derive emissions consistent with a composite plume generated by combining all detected OMI pixels while we have individually processed all scenes and derived an SO2 mass burden or emission rate on a per-scene basis. One possibility is that truncation of larger gas plumes by the OMI row anomaly will cause major reductions in scene mass loadings and therefore annual totals, whereas calculated emission rates may be less affected if near-source pixels with higher SO2 column density are preserved and have a greater significance to the Gaussian fitting. There are likely to be consequences of different tolerances for cloud cover or the obscuring effects of the row anomaly, our handling of null data, and different sources of plume speed estimates. Conclusively determining the accuracy of two different approaches to estimating SO2 emissions is challenging and, given the limitations imposed by row anomaly and the different temporal and spatial resolution of each approach, perhaps insurmountable.
One approach to reduce the discrepancy between our data and that of Carn et al. (2017) would be to consider our estimates of SO2 lifetime as maxima. For each year in 2005–2015, the common interval of our studies, we can calculate mean scene SO2 mass loadings and daily emission rates, and by combining these compute rough estimates of lifetime. This results in a mean SO2 lifetime of 10.1 h (±2.4), considerably shorter than the lifetimes we calculated above. 10.1 h is toward the faster end of published estimates of SO2 lifetime in volcanic plumes but may be reasonable for low altitude (boundary layer) conditions in a humid tropical setting. Support for short SO2 lifetimes comes from our visual inspection of Bagana plumes in OMI field-of-view scenes: using reasonable local wind speed estimates from NCEP Renanalysis 2 data we estimate a likely downwind range of 400–500 km for Bagana plumes to reach before the subsequent OMI overpass. On the basis of these criteria we can assess whether observed SO2 is fresh or relict. We find that relict plumes are rarely seen. Our analysis is generally aided by most Bagana plumes clearly emanating from the volcano (Figure 4).
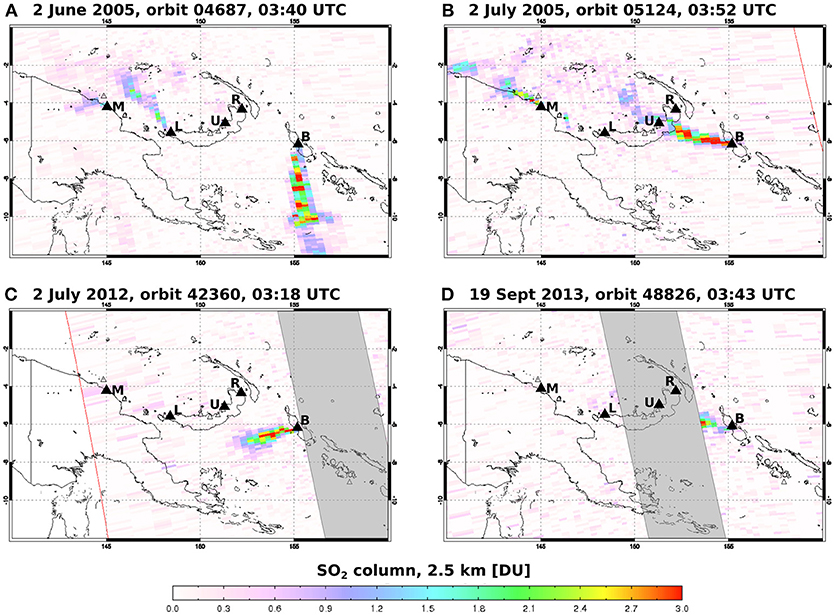
Figure 4. Examples of individual scene SO2 observations by OMI, mapped using OMIplot software (Carn, 2011). Volcanoes across Papua New Guinea that have been identified as detectable SO2 sources (McCormick et al., 2012) in OMI data are indicated: M, Manam; L, Langila; U, Ulawun; R, Rabaul (Tavurvur); B, Bagana. (A,B) Shows strong SO2 emissions from Manam, Ulawun, and Langila in addition to Bagana, with (B) illustrating the care that must be taken to correctly attribute emissions when volcanoes are closely spaced. In (C,D), the area of the OMI swath affected by the Row Anomaly is shaded in light gray. In (C), the full extent of the Bagana SO2 plume can be mapped, whereas in (D), the plume is truncated by the Row Anomaly, and the retrieved scene SO2 mass must therefore be considered a minimum estimate.
Throughout the remainder of this study, we will quote SO2 emissions based on our previously described conversion of mass loading to emission rate assuming a 22.5 h lifetime. We ask the reader to bear in mind the potential uncertainty (+51%, -25%) as described above, arising from longer or shorter lifetimes, and moreover that under certain conditions even shorter lifetimes may result in scene mass loadings being underestimates of Bagana's true at-source emissions.
4.1.2. Overview of Bagana's Activity, 2000–2017: Radiant Flux, SO2 Emissions, Ash Plumes
From low levels in 2000-01, our MODVOLC data show a steady increase in integrated annual radiant flux to a peak of 3.6 × 10¹⁴ J in 2005, paralleling the peak in SO2 emissions described above (Figures 5A,B). During 2006–2011, radiant flux and SO2 emissions decrease following similar trends, though the range of 1.6–2.8 × 10¹⁴ J remains above 2000-04 levels. In 2012, a second strong peak is recorded in radiant flux (3.4 × 10¹⁴ J), comparable to the 2005 peak, and again matching the SO2 emissions data. During 2013–2017, radiant flux and total SO2 mass decrease to levels comparable to pre-2005, again with very similar trends.
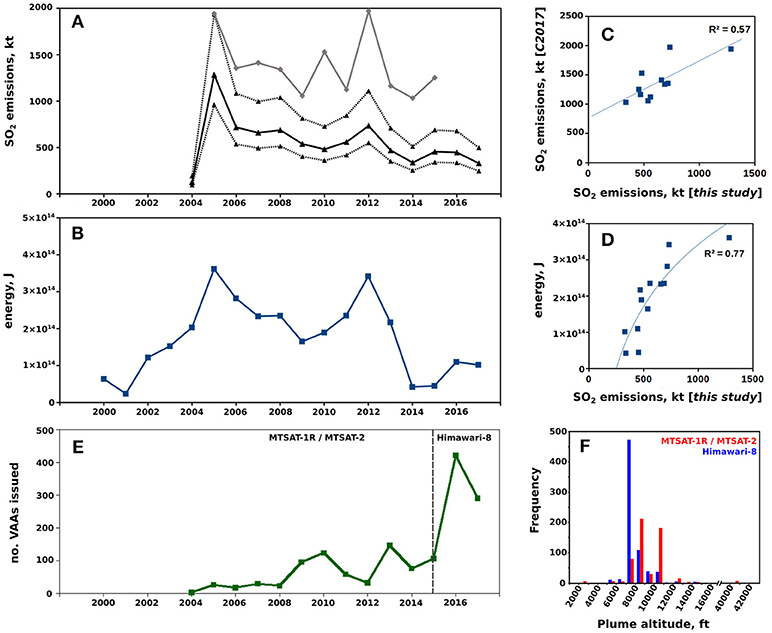
Figure 5. Satellite observations of Bagana's activity, binned annually: (A) annual SO2 emissions (black solid curve), derived from our OMI daily observations, with dashed black lines illustrating potential range in emissions due to uncertainty over SO2 lifetime. Gray line is annual SO2 emission rates reported by Carn et al. (2017); (B) total thermal energy radiated from Bagana, derived from MODIS observations and the MODVOLC algorithm; (C) scatterplot of integrated thermal energy vs. SO2 emissions [this study]; (D) scatterplot of total SO2 emissions from this study vs. Carn et al. (2017); (E) total annual Volcanic Ash Advisories (VAAs) issued for Bagana; (F) histogram showing frequency of VAAs binned by altitude, with MTSAT (2004–2015) and Himawari-8 (2015–2017) eras separated.
The radiant flux emitted from a volcanic edifice is proportional to the temperature and areal extent of some hot feature, mostly likely a lava flow or dome or an active vent (Wright, 2016). At Bagana, the features most likely to be triggering MODVOLC alerts are active lava flows on the edifice flanks; the summit dome itself may be too small for consistent detection. Therefore, we interpret the trend in radiant flux (Figure 5B) as follows: (i) low level extrusion only in 2000, increasing steadily in the following 4 years; (ii) a major peak in extrusive activity centered on 2005, decreasing thereafter through 2006–2011; (iii) a second major peak in extrusive activity centered on 2012, decreasing thereafter to low level extrusion comparable to pre-2004.
The inter-annual trend in SO2 mass loading detected by OMI over Bagana (Figure 5A) also suggests continuous but variable activity, and is broadly similar in trend to the radiant flux time series (Figure 5B). The principal differences are the lack of OMI observations prior to 2004 and the relative magnitude of the 2012 secondary peak in activity. The two satellite datasets correlate reasonably well (R2 = 0.77, Figure 5D). Our interpretation is that increased lava extrusion, indicated by high radiant flux, occurs periodically, notably in 2005 and 2012, and is accompanied by elevated SO2 mass loadings. There are years with reduced lava extrusion, notably 2000–2001 and 2015–2016, but the non-zero radiant flux data suggest that extrusive activity occurred to some extent in every year between 2000–2017. This fits our existing perspective of Bagana as a persistently active volcano. The non-zero intercept of the regression line in Figure 5D may indicate that SO2 emissions, though correlated, continue when radiant flux drops to zero, a suggestion that we will explore further below.
Figure 5E records the number of VAAs issued for Bagana each year. Since 1998 Darwin VAAC has issued over 19,000 VAAs for volcanoes across Indonesia, the southern Philippines, Papua New Guinea, and Vanuatu, with 1459 VAAs (7.5% of total) issued for Bagana (dating from May 2004 to September 2017), a remarkable number for a volcano whose activity is dominantly effusive. Over half (56%) of VAAs issued for Bagana date from 2015-17 but this increase over previous years is strongly related to changing satellite capability. After September 2015, satellite-based ash detection for Darwin VAAC switched from MTSAT-1R and MTSAT-2 observations (hourly frequency) to higher spatial resolution observations by Himawari-8 every 10 min. It is difficult to distinguish changes in activity from changes in satellite sensitivity, so we interpret the MT-SAT (2004–2015) and Himawari-8 (2015–2017) eras of the VAA dataset separately.
In the MT-SAT era, MODVOLC radiant flux data suggest substantial lava extrusion in 2005 and 2012, with reduced extrusion in the surrounding years (Figure 5B). The time series of total VAAs issued is anti-correlated with this trend, most notably in 2008–2014 (Figure 5E). When extrusion is most active (e.g., 2005 and 2012), it appears that explosive activity and the production of ash plumes is relatively low, and that during intervals of decreased lava extrusion (e.g., 2008–2011) the production of ash plumes increases. Ash-producing explosions of varying intensity are a common feature of inter-extrusive pauses at dome-forming volcanoes (e.g., Norton et al., 2002). The anti-correlation between the number of VAAs issued and total radiant flux does not continue in the Himawari-8 era (Figures 5B,E). This may be a consequence of the dramatic increase in frequency of ash detection or, alternatively, a shift to a different style of activity: ash venting is also known to occur periodically during extrusive episodes (e.g., Cole et al., 2014). Given uncertainty over short timescale variations in activity at Bagana and a lack of direct ground-based observations, we cannot confidently infer the processes which give rise to the various VAAs issued.
The aviation color code, also recorded in VAAs, comprises four levels from green, through yellow and orange, to red that signify levels of unrest at the volcano in question (Guffanti and Miller, 2013). Activity at Bagana, as reported in VAAs, is dominantly tagged at the level of orange, that is, “volcanic eruption is underway with no or minor ash emission.” In the MTSAT era, 85% of the VAAs issued were tagged orange, with the majority of the remainder tagged yellow; in the Himawari-8 era, 99% of the VAAs were tagged orange. Based on these color codes, Bagana's ash venting activity falls within a relatively limited range of intensity: alerts tagged red were only issued on 4 separate occasions (total of 11 alerts) and never persisted for more than a day. Further insight can be gleaned from the ash plume altitude reported in each VAA. The altitude range of ash plumes differs strongly between the MTSAT and Himawari eras. The MTSAT data show a bimodal distribution, with two peaks of similar magnitude centered on 8,000 and 10,000 feet (roughly 2.4 and 3 km), whereas 69% of Himawari-8 observations are of plumes at 7,000 feet (2.1 km). These altitude bins are of course close together, but a key observation is that many more ash plumes were reported at 10000 feet or higher in the MTSAT era (210, 39% of total) than in the Himawari era (47, or 7% of total). We consider this good evidence for a long-term decrease in the intensity of ash venting activity at Bagana, noting that the actual frequency of ash plume detection increases through time due to the heightened sensitivity of Himawari-8. The great majority of VAAs issued for Bagana are likely to correspond to low level ash venting activity, and not larger explosive eruptions or dome collapse events. We infer this from the generally low altitude of the plumes detected (<1% of plumes exceeded 5 km in altitude), for example in relation to typical ash venting altitudes reported at Soufrière Hills (up to 6 km, Cole et al., 2014).
4.2. Monthly Satellite Observations
4.2.1. Eruptive Intervals of Several Months Duration
The tendency for coincident peaks in radiant flux and SO2 emissions that we observed in our annual time series is still clearly apparent when we integrate our OMI and MODVOLC data over monthly intervals (Figure 6). Coincidence of peaks and troughs in the two time series can be seen for the majority of our study period, with the exception of mid-2016 and mid-2017 when the peaks are slightly offset. The relative magnitude of the changes in the two time series do not match well and there is no overall correlation between monthly radiant flux and SO2 mass loading (R2 = 0.47 can be attributed to a positive skewing caused by the extreme values of radiant flux and SO2 mass in May 2005; without this pair of points R2 falls to 0.23). Given the different temporal sampling and resolution of the two satellite datasets we do not expect a strong quantitative correlation here, despite the good correspondence in topology of the two time series.
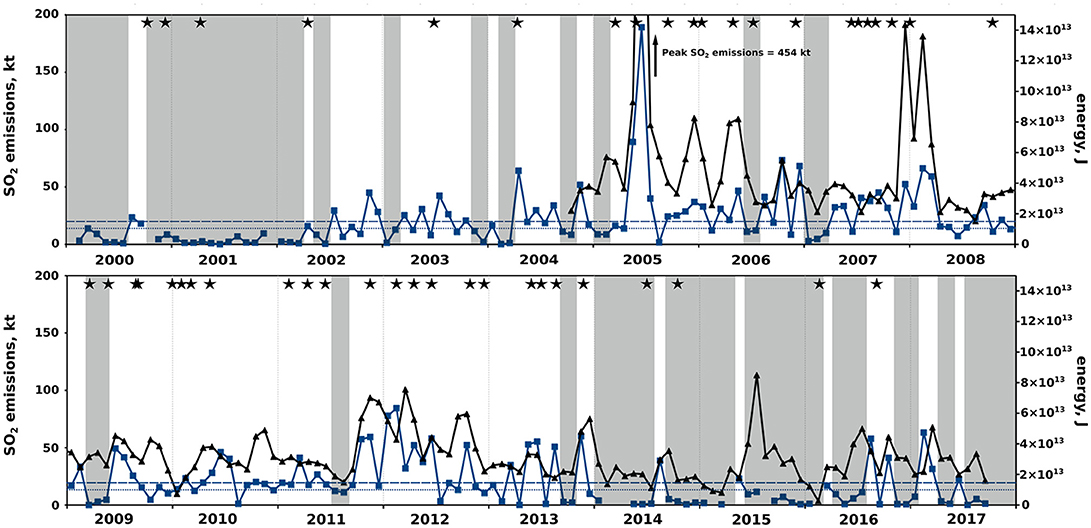
Figure 6. Satellite observations of Bagana's activity, binned monthly, from January 2000 through September 2017. Blue curve indicates integrated monthly thermal energy calculated from MODVOLC data; black curve shows integrated monthly SO2 emissions (note the truncated ordinate). The blue dashed line corresponds to the mean monthly radiated energy (1.5 × 10¹³ J); the blue dotted line shows the 1.0 × 10¹³ J threshold used in definition of phase and pause transitions. Co-extrusive phases are indicated by white vertical shading; non-extrusive pauses are indicated by gray vertical shading. Black stars indicate timing of ASTER detections of thermal anomalies on the Bagana edifice.
We interpret coincident peaks as eruptive intervals, with high radiant flux signifying active lava extrusion, and higher levels of detected SO2 indicating elevated accompanying degassing. Based on our data, the most notable eruptive episodes, with highest radiant flux and SO2 emissions, are: (i) May 2005 to December 2006; (ii) December 2007 to April 2008; (iii) October 2011 to December 2012. In May to July 2005 monthly radiant flux ranged from 6.7 to 14.0 to 3.0 × 10¹⁴ J and the integrated SO2 emissions for the three months was ~680 kt. The nature of this large yet short-lived SO2 release remains enigmatic, as noted previously by McCormick et al. (2012). Darwin VAAC reported that ash plumes in mid-2005 did not exceed 10,000 ft (~3.3 km, Figure 7) and there was no report relayed to RVO of a large explosive eruption or dome collapse from local observers on the ground. We suggest that this interval represents an intense episode of lava extrusion at Bagana and is indicative of highly variable activity over short timescales. Based on radiant flux or SO2 emissions, this appears to have been the most intense eruptive episode at Bagana in recent years.
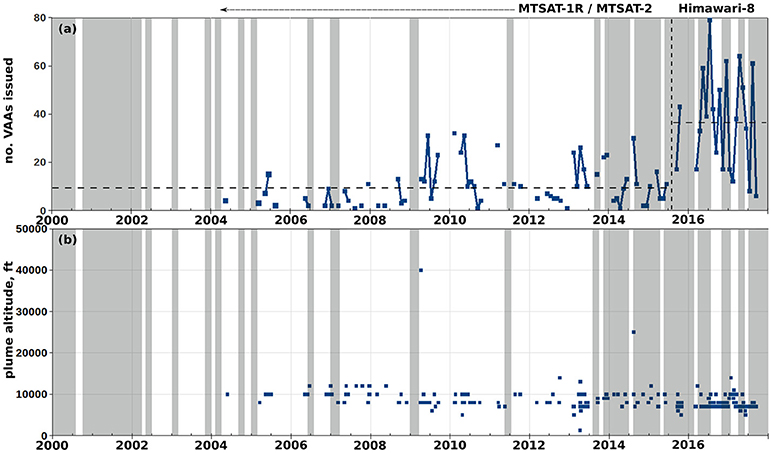
Figure 7. Monthly total Volcanic Ash Advisories (VAAs) (a) issued for Bagana between 2000 and 2017 and the altitude of the ash plume (b). Vertical black dashed line in mid-2015 indicates transition to high-resolution and more regular Himawari-8 observations of ash plumes. Horizontal black dashed lines indicate the mean number of VAAs issued per month for the MTSAT and Himawari-8 eras. Vertical white and gray shading indicates phases of lava extrusion and inter-eruptive pauses, respectively.
A further major eruptive episode occurred in 2010–2012. From Wadge et al. (2012), who analyzed 14 months of TerraSar-X satellite radar observations (11–55 day revisit time) we know there was persistent eruption of lava from October 2010 to December 2011, with a variable extrusion rate (from 0.26 m3s−1 to 1.8 m3s−1; mean = 0.92 ± 0.35 m3s−1). Wadge et al. (2012) argued that Bagana's lava extrusion can be strongly pulsatory on a sub-monthly basis based on their observations of four successive pulses of lava advancing down a single channelized flow. From Wadge et al. (2012)'s semi-quantitative analysis of OMI data, no conclusive argument could be made regarding systematic trends in gas emissions at the onset or through the duration of these pulses in extrusion.
We have analyzed SO2 emissions and radiant flux alongside Wadge et al. (2012)'s extrusion rate data (Figure 8). There is not a convincing correspondence between peaks and troughs in the three datasets, though SO2 emissions do appear to increase in the wake of elevated radiant flux at the beginning of Wadge et al. (2012)'s Pulse 1 and Pulse 3. The onsets of each pulse in lava extrusion, as defined by Wadge et al. (2012), are not accurately known but the likely onset intervals do coincide with increased SO2 mass loading (for example, late October 2010, late January 2011) and radiant flux (late January 2011, mid September 2011). This adds some credence to the notion that the onset of each pulse is marked by higher lava extrusion and SO2 emission rates, though the differing spatial resolution and coverage of our datasets precludes a definitive evaluation of this suggestion. Inter-comparison is limited by the temporally sparse nature of the TerraSar-X dataset as well as the fact that OMI observations are exclusively daytime while the MODIS observations we have selected to use here are exclusively nighttime.
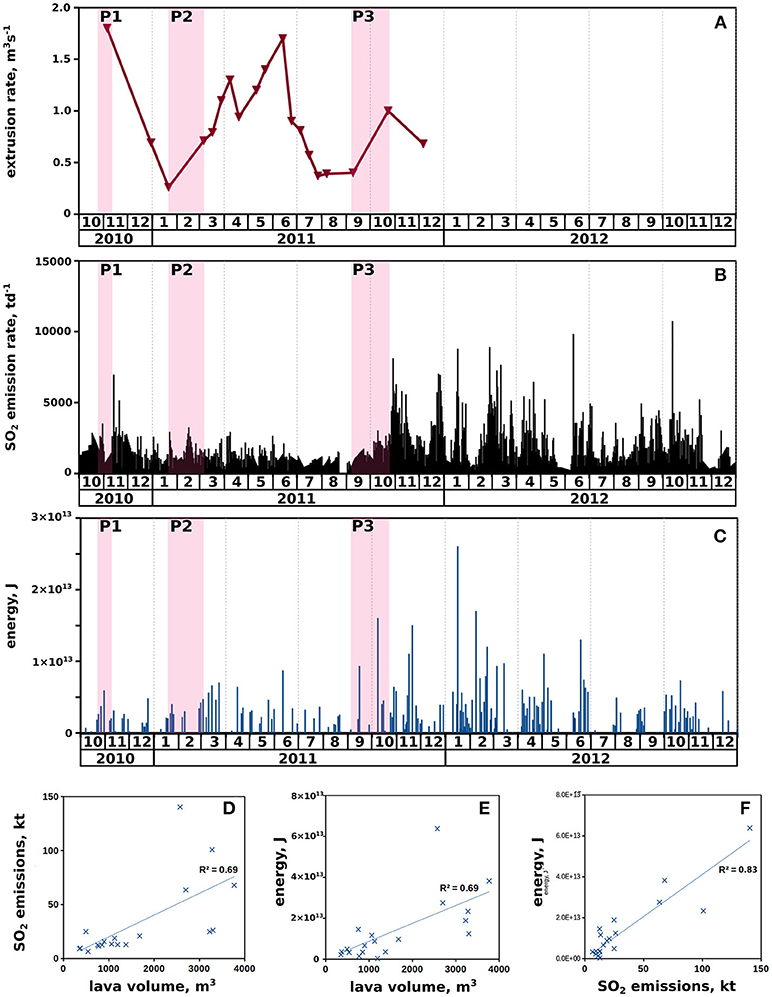
Figure 8. (A) Bagana's lava extrusion rate as measured by satellite radar, TerraSar-X (Wadge et al., 2012). (B) Daily SO2 emission rate calculated from our OMI measurements. (C) Daily integrated thermal calculated from MODVOLC data. In all three time series panels, pink vertical shading indicates the approximate onset of each pulse in lava extrusion reported by Wadge et al. (2012). Scatterplots (D–F) compare TerraSar-X measurements of lava volume (Wadge et al., 2012)with SO2 emissions and thermal energy, with the latter two integrated over the same measurement intervals as TerraSar-X observations.
We can re-calculate SO2 emissions and radiant flux at the sampling rate of Wadge et al. (2012)'s study, that is computing total mass loading or radiant flux corresponding to each 11–55 day interval. Figures 8D-F shows that there is a reasonable positive correlation between SO2 mass loading, radiant flux, and erupted lava volume when each dataset is binned to the same temporal scale. These relationships support our earlier assertion, when looking at longer-duration datasets, that there is a general first-order coupling between lava extrusion and gas emission at Bagana, with episodes of elevated extrusion (and therefore radiant flux) being generally accompanied by increased SO2 emissions.
It is unfortunate that Wadge et al. (2012) only had access to TerraSar-X data until December 2011. As Figure 8 shows, SO2 emissions and radiance reached considerably higher levels in 2012 than in October 2010 to December 2011 (see also Figure 6). There is a clear sense in both SO2 and radiant flux data of strongly pulsatory gas and thermal emissions. From this limited perspective, we consider it likely that obtaining a larger satellite radar dataset will enable a fuller evaluation of Bagana's eruptive behavior.
4.2.2. Inter-Eruptive Pauses
In addition to coincident peaks, our monthly time series of radiant flux and SO2 mass (Figure 6) show coincident minima. Near-zero radiant flux can be seen throughout 2001 and the early part of 2002 (before OMI's launch) and also in early 2009, much of 2014–2015, and late 2017. In these three latter intervals, integrated SO2 emissions are also reduced, often falling below the long-term mean. We consider these intervals to be periods of greatly reduced or halted lava extrusion. The near-zero radiant fluxes measured by MODIS are likely to indicate low thermal emissions from cooling lava flows or perhaps a dome in the summit crater. Notwithstanding this decrease in extrusion rate, SO2 emissions seem to continue, albeit at reduced levels, suggesting that in addition to co-eruptive degassing there may be a significant passive degassing component to Bagana's overall emissions budget. Monthly emissions of 30–50 kt correspond to mean daily emission rates of 1,000–1,600 td−1, higher than is observed at most non-erupting volcanoes worldwide.
4.2.3. Timing and Intensity of Ash Emissions
As discussed earlier, the notable increase in the number of VAAs issued for Bagana in our 2000–2017 study window is in large part due to the improved sensitivity of the satellite instruments providing data to Darwin VAAC. Figure 7 summarizes the detection of ash plumes from Bagana in terms of total VAAs per month as well as the altitude distribution of the full dataset (1,459 events). The MTSAT and Himawari eras are again distinguished, with the latter era seeing a major increase in detection frequency, notably of lower altitude ash plumes.
In the MTSAT era, there is a tendency for increased ash emissions to occur during periods of active lava extrusion. The number of VAAs issued rises above the MTSAT era mean (10 alerts per month) in 32 months, and 22 (69%) of these fall into intervals we judge to be co-eruptive. The single most intense ash emission event, based on plume altitude, occurred in August 2009, during a short-lived eruptive phase. In the Himawari-8 era, we make a contrary observation: the mean (36 alerts per month) is exceeded in 11 months, of which 8 (73%) fall into inter-eruptive pauses.
If the general tendency for lower altitude ash plumes in the Himawari-8 era (Figure 5F) is a true volcanic phenomenon, and not solely a result of improved detection capability, we could present a cautious interpretation. Based on the low altitude reported in VAAs, most of the events that cause ash emission at Bagana are low intensity ash venting or puffing events that occur during extrusive episodes due to short-lived drops in permeability in the shallow conduit, perhaps due to variable gas/magma ascent rates. Such events are more common during extrusive periods when there is a high magma flux up Bagana's conduit. We might term these Type I ash emission events. Inter-eruptive ash venting may then be controlled by periodic sealing of gas escape pathways through cooling, non-ascending magma in the conduit. These Type II events are likely to have a lesser intensity owing to reduced gas flux from depth (consistent with our general trend of lower SO2 emissions in pause intervals). The detection of ash plumes resulting from this lower intensity venting activity was not possible in the MTSAT era, but following the switch to Himawari lower altitude ash plumes are now more frequently detected and tend to occur in inter-eruptive pauses.
5. Discussion
5.1. Co-eruptive and Passive SO2 Emissions
Distinguishing two alternating activity states, co-extrusive “phases” and inter-eruptive “pauses,” has been successful as a framework for interpreting long-term behavior of persistently active silicic volcanoes, notably Soufrière Hills, Montserrat (Edmonds et al., 2003; Cole et al., 2014; Wadge et al., 2014). Herein, we have shown that Bagana's activity can be similarly characterized as alternating intervals of (i) active lava extrusion and high SO2 emissions (phases) and (ii) halted extrusion and lower, but still substantial, passive SO2 emissions (pauses). In order to explore how the volcano's SO2 emissions are partitioned between these two types of activity, we have color coded (Figures 6, 7) to distinguish eruptive phases (vertical white shading) and quiescent pauses (vertical gray shading).
We lack reliable direct observations of extrusion on a multi-year basis—contrast with 14-month TerraSar-X survey of Wadge et al. (2012)—and have therefore used our radiant flux observations from MODIS to define the timing and duration of phases and pauses. We define an eruptive phase to begin when radiant flux exceeds a chosen threshold, and consider extrusion to be persisting until radiant flux falls below our threshold for at least 2 months, whereupon we deem an inter-eruptive pause to have begun. A reasonable threshold to use for defining phases and pauses might be the long-term monthly mean of our radiant flux dataset, which is 1.5 × 10¹⁴ J. However, since the distribution of monthly radiant flux is not normal, but skewed positively with a long tail, we also consider a lower threshold of 1.0 × 10¹⁴ J.
Changing the threshold from 1.5 × 10¹⁴ J to 1.0 × 10¹⁴ J (Table 1) reduces the number of both phases and pauses and increases the proportion of time that Bagana spends in an extrusive state (from 45% to 60% of our study interval). In addition, the lower threshold results in a greater proportion of the total radiant flux (81–90%) and SO2 emissions (61–76%) occurring in phases, i.e., being co-eruptive. The mean daily SO2 emission rate between phases and pauses varies relatively little when we change the threshold because the greater duration of phases than pauses offsets the increased total phase emissions. For the greater proportion of gas and thermal emissions falling in the co-eruptive phases, we prefer the 1.0 × 10¹⁴ J threshold and have shaded (Figure 6) on this basis.
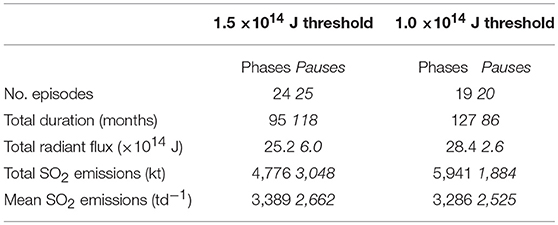
Table 1. Table summarizing the characteristics of co-eruptive phases and inter-eruptive pauses at Bagana, with alternative thresholds used to define phase-pause transition.
We have limited independent verification of the timing of active lava extrusion with which to test our defined pauses and phases, partly from the 14-month TerraSar-X study of Wadge et al. (2012) but mostly from ASTER imagery. ASTER observations of the world's volcanoes are archived and freely accessible online in the ASTER Volcano Archive [https://ava.jpl.nasa.gov/]. Observations of Bagana are relatively infrequent but this is offset by ASTER's high spatial resolution which detects sub-km thermal anomalies with greater reliability than sensors such as MODIS with relatively coarse spatial resolution. ASTER observations of active lava flows are shown in Figure 6 by the black stars. 81% of ASTER-detected active lava flows fall within intervals we have defined as co-eruptive phases. ASTER thermal anomalies during our quiescent pauses may indicate cooling lava flows, rather than active extrusion, but we cannot rule out the possibility that extrusive episodes are slightly longer or shorter in length than our criteria (based on MODIS observations alone) would suggest. We consider this a relatively minor uncertainty.
Our OMI data indicate that the majority of SO2 emissions occur in eruptive phases rather than in pauses (Table 1), with mean co-eruptive emission rates of 3,290–3,390 td−1 around 30% higher than mean quiescent emission rates of 2,530–2,660 td−1. These daily emission rates are comparable to previously reported SO2 emissions from Bagana, whether satellite- (Carn et al., 2017) or ground-based measurements (Global Volcanism Program, 1983, 1989; McGonigle et al., 2004b), and confirm Bagana's place among the very largest volcanic SO2 sources worldwide (Shinohara, 2013; Carn et al., 2017). No estimates yet exist of volcanic CO2 emissions from Papua New Guinea (Burton et al., 2013) and given the high SO2 emissions reported throughout the region (McCormick et al., 2012) this is considered a significant gap in our global dataset. Recent studies (Aiuppa et al., 2017; Mason et al., 2017) debate the importance of crustal or subducted carbon in modulating magmatic CO2/STOTAL ratios, and thefore CO2 emissions, and given the lack of constraint on these variables for the New Britain–Bougainville subduction system we cannot speculate too far. However, if our estimated SO2 emission rates are correct, even a “carbon-poor” scenario (CO2/STOTAL ~1-2) could result in a daily CO2 emissions from Bagana of 2.5–6.8 ktd−1, or 0.9–2.5 Mt yr−1, comparable to known major sources such as Ambrym, Etna, or Popocatépetl (Burton et al., 2013; Allard et al., 2016).
5.2. Explaining Bagana's High SO2 Emissions
In common with many other arc volcanoes, lava and gas fluxes at Bagana initially seem strongly coupled, in that degassing of ascending and erupting magma supplies a strong co-eruptive gas plume. However, our discovery of substantial passive emissions at Bagana requires an additional source of gas, other than decompression-driven degassing of magma during eruption. One possibility is that the Bagana plumbing system stores a larger volume of basaltic andesite magma than is erupted, and sulfur-rich vapor exsolving from this magma is continually free to ascend to the surface, regardless of the prevailing state of activity. Alternatively, this excess vapor phase could be supplied by a more primitive, deeper-stored magma, generating a substantial fraction of exsolved magmatic vapor (Wallace, 2001, 2005; Gerlach et al., 2008; Wallace and Edmonds, 2011). Underplating by more primitive magmas is well established in many arc volcanoes and there is often chemical or textural evidence for interaction between a deeper reservoir and the shallow-stored magma that supplies eruptions (Bacon, 1986; Clynne, 1999; Murphy et al., 2000; Coombs et al., 2003; Humphreys et al., 2006; Plail et al., 2018). At Bagana, detailed textural or chemical analyses of erupted products might offer a way of distinguishing these scenarios. In the meantime, our study offers the first good evidence for an excess gas phase.
The interval over which we have the best estimate of erupted volume is October 2010 to December 2011, thanks to the Wadge et al. (2012)'s TerraSar-X survey. The total extruded volume in this interval was 33 × 106 m3, with an estimated mass of 92.4 × 10⁶ t based on a reasonable density for basaltic andesite of 2.8 g cm−3. Assuming a phenocryst content of 42% (the mean value across 33 analyzed Bagana lavas, Bultitude et al., 1978), the mass of degassing melt is ~53.6 × 10⁶ tons. Integrated SO2 emissions through this interval was 7.2 × 10⁵ t, of which 3.6 × 10⁵ t is sulfur. As a first approximation, we can calculate the concentration of sulfur in the melt, [SMELT], by dividing the emitted sulfur mass by the erupted lava mass, yielding an estimate for [SMELT] of 6,340 ppm. Given the previously discussed uncertainty on the SO2 lifetime used to convert scene mass loadings into emission rates, the range of potential [SMELT] calculated for this interval is 4,760–10,260 ppm.
We can repeat this calculation for the full duration of our SO2 dataset, 13 years from October 2004 to end September 2017. We assume that the long-term, that is inter-annual, mean extrusion rate at Bagana is ~1.0 m3s−1 (Wadge et al., 2018). From Figure 6 we calculate that Bagana was in an eruptive state for 127 months of our full OMI SO2 time series (note this calculation uses the data based on the 1.0 × 10¹⁴ J threshold in Table 1). Combining these data, we estimate the erupted lava volume in this window to be 340 × 106 m3, equal to a degassing melt mass of 552 × 106 t. Our total co-eruptive SO2 mass loading in 2004–2017 was 5.9 × 10⁶ t SO2, of which 2.95 × 10⁶ t sulfur. From these data, we estimate [SMELT] to be 5340 ppm (with a potential range, due to uncertainty on integrated SO2 emissions of 3,990–8,700 ppm).
We consider these estimates of [SMELT] to be implausible. Sulfur concentration of melts can vary widely, but for andesitic magma at shallow crustal pressures (below 200 MPa) and relatively oxidizing conditions (around ΔFMQ 1-2) we would not anticipate more than a few hundred ppm, while island arc basalts may hold percent-level sulfur at sulfide saturation (Liu et al., 2007; Jugo, 2009). More likely, volatiles are supplied from additional non-erupted magma. If this were of similar basaltic andesite composition to the erupted lavas, we would require volumes of non-erupting but degassing magma to be a factor of 5-6 greater than the total erupted volume, in order to bring our calculated [SMELT] from ~5,000–6,000 ppm below at least ~1,000 ppm. From this, we might infer significant endogenic growth of the volcanic edifice, thus-far undetected as focussed TerraSar-X surveys (e.g., Wadge et al., 2012, 2018) may not be sensitive to topographic change of the entire edifice relative to a surrounding regional baseline. Alternatively, there may be a long-lived, established reservoir where exsolved volatiles accumulate with relatively evolved lavas near the roof zone (Huber et al., 2012; Parmigiani et al., 2016; Edmonds and Woods, 2018). The upper reaches of the reservoir are tapped periodically by eruption and the reservoir is fed over longer timescales by underplating mafic magma that supplies the observed excess volatile phase. Chemical and textural analyses of Bagana's erupted products could shed light on magma intensive parameters and pre-eruptive reservoir processes.
5.3. Influence of Gas Emissions on Eruptive Style
The first quantitative reports of Bagana's extreme SO2 emissions date to the 1980s (Global Volcanism Program, 1983, 1989) and given historical reports and photographs of thick gas plumes emanating from the summit (Bultitude, 1976, 1981; Bultitude et al., 1978; Bultitude and Cooke, 1981) it is a reasonable assumption that open system degassing is a persistent characteristic of the volcano's activity. This open system behavior—whether controlled by a permeable bubble network within the rising magma or by fractures around the conduit—is likely to be an important control on Bagana's dominantly effusive mode of eruption (Edmonds et al., 2003; Cashman, 2004; Gonnermann and Manga, 2007; Farquharson et al., 2015). If permeability were to be compromised and gas escape impeded, the resulting overpressure could trigger Vulcanian-style explosive eruptions or dome collapse events, yielding pyroclastic flows and ballistic fallout around the edifice. Such phenomena have been reported from Bagana (Bultitude, 1976; Bultitude and Cooke, 1981). Explosive damage to the crater rim may influence the flow direction of subsequent lava extrusion. Sudden transitions to explosive activity change the nature of volcanic hazard at Bagana and modify the risk to surrounding populations. Although the threatened population is relatively small (8,000, as of 2013), several villages lie in river valleys downslope of the volcano and could be at risk from density current hazards. Given the limited monitoring onsite, mitigating for these potential higher risk scenarios is a significant challenge.
6. Conclusions
Earlier studies of Bagana volcano have described persistent lava extrusion and a strong sustained summit gas plume over several decades, if not centuries (Bultitude, 1976, 1981; Bultitude et al., 1978; Bultitude and Cooke, 1981; McGonigle et al., 2004b). Our multi-year satellite observations of SO2 mass loading and thermal infrared radiant flux expand our previous work on this volcano (McCormick et al., 2012; Wadge et al., 2012, 2018) and demonstrate that although lava extrusion and gas emissions are indeed persistent, they are also highly variable on inter-annual and sub-annual timescales. We contend that a first-order coupling exists between lava extrusion and gas emissions, with peak SO2 mass loadings identified during episodes or “phases” of active extrusion lasting several months. In addition, we find evidence for inter-eruptive “pauses,” of similar duration, where extrusion may largely cease, radiant flux emissions are restricted to the cooling of fresh lava flows or the volcano's small summit dome, and yet passive SO2 emissions continue. This pattern of activity—peak gas emissions during extrusive episodes, yet substantial emissions continuing during quiescence—is consistent with that seen at other persistently active silicic volcanoes, such as Bezymianny, Tungurahua, Soufrière Hills, and Popocatépetl (Delgado-Granados et al., 2001; Edmonds et al., 2003; Arellano et al., 2008; Lopez et al., 2013b).
Based on satellite-based OMI data, we have calculated, over multi-year timescales, daily mean SO2 emissions at Bagana of ~3,300 td−1 in co-eruptive phases and ~2,500 td−1 in inter-eruptive pauses. Converting observed SO2 mass loadings into at-source emission rates remains subject to significant uncertainties, chiefly over SO2 lifetime, and future work must engage with the challenge of quantifying temporal variation in lifetime with local atmospheric conditions. These uncertainties notwithstanding, our results confirm that Bagana is among the largest global volcanic SO2 sources. We explore the reasons for the extremely high SO2 emissions and conclude that either the magma is unusually sulfur-rich, or there is significant “excess” sulfur degassing from magma that does not erupt, whether the same basaltic-andesite that supplies the lava extrusion or a deeper body that may or may not interact chemically and physically with the erupted magma. Distinguishing these scenarios could be accomplished by geochemical and petrographic methods and is a key goal of our future work. Meanwhile, we highlight that the open system degassing of Bagana is very likely to be critical for its generally effusive behavior. Sudden loss of conduit or magma permeability to ascending gas may result in explosive eruptions, far larger than the mild ash venting activity we have described herein. Such explosive eruptions are known from the historical record. Mitigating for these higher risk events at such a remote volcano is a formidable challenge to in-country hazard management authorities.
Author Contributions
BM conceived of the study, analyzed and interpreted satellite data, prepared the figures, and wrote the manuscript with further interpretation of the data contributed by the other authors. GW analyzed the ASTER imagery. KM provided data from Rabaul Volcanological Observatory reports. All authors read, reviewed and approved all versions of the manuscript.
Funding
The research leading to these results has received funding from the NERC Centre for Observation and Modeling of Earthquakes, Volcanoes and Tectonics (COMET); from the Deep Carbon Observatory programme DECADE (DEep CArbon DEgassing); from the British Geological Survey; and from the Isaac Newton Trust at the University of Cambridge. All satellite data used in this study are provided by NASA and are in the public domain.
Conflict of Interest Statement
The authors declare that the research was conducted in the absence of any commercial or financial relationships that could be construed as a potential conflict of interest.
Acknowledgments
BM, GW, and ME acknowledge funding from NERC COMET. BM acknowledges further financial support from the British Geological Survey, the Isaac Newton Trust at the University of Cambridge, and the Deep Carbon Observatory. BM acknowledges valuable discussions with Lois Salem, Peter Webley, Simon Carn, Fred Prata, and particularly Adele Bear-Crozier. We thank two reviewers for their careful and perceptive comments and Andrew McGonigle for his editorial handling.
Supplementary Material
The Supplementary Material for this article can be found online at: https://www.frontiersin.org/articles/10.3389/feart.2019.00009/full#supplementary-material
References
Aiuppa, A., Fischer, T., Plank, T., Robidoux, P., and Napoli, R. D. (2017). Along-arc, inter-arc and arc-to-arc variations in volcanic gas co2/st ratios reveal daul source of carbon in arc volcanism. Earth Sci. Rev. 168, 24–47. doi: 10.1016/j.earscirev.2017.03.005
Allard, P., Aiuppa, A., Bani, P., Metrich, N., Bertagnini, A., Gauthier, P.-J., et al. (2016). Prodigious emission rates and magma degassing budget of major, trace and radioactive volatile species from Ambrym basaltic volcano, Vanuatu island arc. J. Volcanol. Geother. Res. 322, 119–143. doi: 10.1016/j.jvolgeores.2015.10.004
Andres, R., and Kasgnoc, A. (1998). A time-averaged inventory of subaerial volcanic sulphur emissions. J. Geophys. Res. 103, 25251–25261. doi: 10.1029/98JD02091
Arellano, S., Hall, M., Samaniego, P., Pennec, J.-L. L., Ruiz, A., Molina, I., et al. (2008). Degassing patterns of Tungurahua volcano (Ecuador) during the 1999-2006 eruptive period, inferred from remote spectroscopic measurements of SO2 emissions. J. Volcanol. Geother. Res. 176, 151–162. doi: 10.1016/j.jvolgeores.2008.07.007
Auker, M., Sparks, R., Siebert, L., Crossweller, H., and Ewert, J. (2013). A statistical analysis of the global historical volcanic fatalities record. J. Appl. Volcanol. 2:2.
Bacon, C. (1986). Magmatic inclusions in silicic and intermediate volcanic rocks. J. Geophys. Res. 91, 6091–6112. doi: 10.1029/JB091iB06p06091
Barmin, A., Melnik, O., and Sparks, R. (2002). Periodic behaviour in lava dome eruptions. Earth Planet. Sci. Lett. 199, 173–184. doi: 10.1016/S0012-821X(02)00557-5
Beirle, S., Hörmann, C., de Vries, M. P., Dörner, S., Kern, C., and Wagner, T. (2014). Estimating the volcanic emission rate and atmospheric lifetime of SO2 from space: a case study for Kīlauea volcano, Hawai'i. Atmosph. Chem. Phys. 14, 8309–8322. doi: 10.5194/acp-14-8309-2014
Blake, D. (1968). Post Miocene volcanoes on Bougainville Island, territory of Papua and New Guinea. Bull. Volcanol. 32, 121–138. doi: 10.1007/BF02596588
Blake, D., and Miezitis, Y. (eds.). (1967). Geology of Bougainville and Buka Islands, New Guinea. Canberra: Bureau of Mineral Resources, Geology and Geophysics Bulletin No. 93.
Boichu, M., Menut, L., Khvorostayanov, D., Clarisse, L., Clerbaux, C., Turquety, S., et al. (2013). Inverting for volcanic SO2 flux at high temporal resolution using spaceborne plume imagery and chemistry-transport modelling: the 2010 Eyjafjallajökull eruption case study. Atmosph. Chem. Phys. 13, 8569–8584. doi: 10.5194/acp-13-8569-2013
Bultitude, R. (1976). “Eruptive history of Bagana volcano, Papua New Guinea, between 1882 and 1975,” in Volcanism in Australasia, ed R. Johnson (Amsterdam: Elsevier), 317–336.
Bultitude, R. (1981). “Literature search for pre-1945 sightings of volcanoes and their activity on Bougainville Island,” in Cooke-Ravian Volume of Volcanological Papers, Vol. 10, ed R. Johnson (Geological Survey of Papua New Guinea Memoir), 227–242.
Bultitude, R., and Cooke, R. (1981). “Note on activity from Bagana volcano from 1975 to 1980,” in Cooke-Ravian Volume of Volcanological Papers, Vol. 10, ed R. Johnson (Port Moresby: Geological Survey of Papua New Guinea Memoir), 243–248.
Bultitude, R., Johnson, R., and Chappell, B. (1978). Andesites of Bagana volcano, Papua New Guinea: chemical stratigraphy, and a reference andesite composition. BMR J. Aust. Geol. Geophys. 3, 281–295.
Burton, M., Sawyer, G., and Granieri, D. (2013). Deep carbon emissions from volcanoes. Rev. Mineral. Geochem. 75, 323–354. doi: 10.2138/rmg.2013.75.11
Carn, S. (2011). Omiplot Software. Available online at: https://vhub.org/resources/682
Carn, S., Clarisse, L., and Prata, A. (2016). Multi-decadal satellite measurements of global volcanic degassing. J. Volcanol. Geother. Res. 311, 99–134. doi: 10.1016/j.jvolgeores.2016.01.002
Carn, S., Fioletov, V., McLinden, C., Li, C., and Krotkov, N. (2017). A decade of global volcanic SO2 emissions measured from space. Sci. Rep. 7:44095. doi: 10.1038/srep44095
Carn, S., Krotkov, N., Yang, K., and Krueger, A. (2013). “Measuring global volcanic degassing with the Ozone Monitoring Instrument (OMI),” in Remote Sensing of Volcanoes and Volcanic Processes: Integrating Observation and Modeling, Vol. 380, eds D. Pyle, T. Mather, and J. Biggs (Geological Society of London Special Publications), 229–257.
Carn, S., and Prata, F. (2010). Satellite-based constraints on explosive SO2 release from Soufrière Hills Volcano, Montserrat. Geophys. Res. Lett. 37:L00E22. doi: 10.1029/2010GL044971
Cashman, K. (2004). “Volatile controls on magma ascent and eruption,” in The State of the Planet: Frontiers and Challenges in Geophysics, eds R. Sparkes and C. Hawkesworth (Washington, DC: IUGG Geophysical Monograph), 109–124. doi: 10.1029/150GM10
Clynne, M. (1999). A complex magma mixing origin for rocks erupted in 1915, Lassen Park, California. J. Petrol. 40, 105–132. doi: 10.1093/petroj/40.1.105
Cole, P., Smith, P., Komorowski, J.-C., Alfano, F., Bonadonna, C., Stinton, A., et al. (2014). “Ash venting occurring both prior to and during lava extrusion at Soufrière Hills Volcano, Montserrat, from 2005 to 2010,” in The Eruption of Soufrière Hills Volcano, Montserrat from 2000 to 2010, Vol. 39, eds G. Wadge, R. Robertson, and B. Voight (London: Geological Society of London Memoirs), 71–92.
Cooke, R., and Johnson, R. (1978). Volcanoes and Volcanology in Papua New Guinea. Geological Survey of Papua New Guinea Reports, 78/2.
Coombs, M., Eichelberger, J., and Rutherford, M. (2003). Experimental and textural constraints on mafic enclave formation in volcanic rocks. J. Volcanol. Geother. Res. 119, 125–144. doi: 10.1016/S0377-0273(02)00309-8
Coppola, D., Laiolo, M., Cigolini, C., Donne, D. D., and Ripepe, M. (2016). “Enhanced volcanic hot-spot detection using MODIS IR data: results from the MIROVA system,” in Detecting, Modeling and Responding to Effusive Eruptions, Vol. 426, eds A. Harris, T. de Groeve, F. Garel, and S. Carn (London: Geological Society of London Special Publications), 181–205.
Delgado-Granados, H., González, L., and Sánchez, N. (2001). Sulfur dioxide emissions from Popocatépetl volcano (Mexico): case study of a high-emission rate, passively degassing erupting volcano. J. Volcanol. Geother. Res. 108, 107–120. doi: 10.1016/S0377-0273(00)00280-8
Druitt, T., and Kokelaar, B. editors (2002). The Eruption of Soufrière Hills Volcano, Montserrat, from 1995 to 1999. Geological Society of London Memoir No. 21.
Eatough, D., Caka, F., and Farber, R. (1994). The conversion of SO2 to sulfate in the atmosphere. Israeli J. Chem. 34, 301–314. doi: 10.1002/ijch.199400034
Edmonds, M., Oppenheimer, C., Pyle, D., Herd, R., and Thompson, G. (2003). SO2 emissions from Soufrière Hills Volcano and their relationship to conduit permeability, hydrothermal interaction and degassing regime. J. Volcanol. Geother. Res. 124, 23–43. doi: 10.1016/S0377-0273(03)00041-6
Edmonds, M., and Woods, A. (2018). Exsolved volatiles in magma reservoirs. J. Volcanol. Geother. Res. 368, 13–30. doi: 10.1016/j.jvolgeores.2018.10.018
Faloona, I. (2009). Sulfur processing in the marine atmospheric boundary layer: a review and critical assessment of modeling uncertainties. Atmospher. Environ. 43, 2841–2854. doi: 10.1016/j.atmosenv.2009.02.043
Farquharson, J., Heap, M., Varley, N., Baud, P., and Reuschlé, T. (2015). Permeability and porosity relationships of edifice-forming andesites: a combined field and laboratory study. J. Volcanol. Geother. Res. 297, 52–68. doi: 10.1016/j.jvolgeores.2015.03.016
Fioletov, V., McLinden, C., Krotkov, N., Li, C., Joiner, J., Theys, N., et al. (2016). A global catalogue of large SO2 sources and emissions derived from the Ozone Monitoring Instrument. Atmospher. Chem. Phys. 16, 11497–11519. doi: 10.5194/acp-16-11497-2016
Flower, V., Carn, S., and Wright, R. (2016). The impact of satellite sensor viewing geometry on time-series analysis of volcanic emissions. Remote Sens. Environ. 183, 282–293. doi: 10.1016/j.rse.2016.05.022
Geirsson, H., Rodgers, M., LaFemina, P., Witter, M., Roman, D., Muñoz, A., et al. (2014). Multidisciplinary observations of the 2011 explosive eruption of telica volcano, nicaragua: implications for the dynamics of low-explosivity ash eruptions. J. Volcanol. Geother. Res. 271, 55–69. doi: 10.1016/j.jvolgeores.2013.11.009
Gerlach, T., McGee, K., and Doukas, M. (2008). Emission rates of CO2, SO2, and H2S, scrubbing, and preeruption excess volatiles at Mount St. Helens, 2004-2005. US Geol. Survey Professional Paper 1750, 543–572. doi: 10.3133/pp175026
Global Volcanism Program (1983). Report on Bagana (Papua New Guinea). Sci. Event Alert Network Bull. 8:9.
Global Volcanism Program (1989). Report on Bagana (Papua New Guinea). Scientific Event Alert Network Bull. 14:7.
Gonnermann, H., and Manga, M. (2007). The fluid mechanics inside a volcano. Annu. Rev. Fluid Mech. 39, 321–356. doi: 10.1146/annurev.fluid.39.050905.110207
Guffanti, M., and Miller, T. (2013). A volcanic activity alert-level system for aviation: review of its development and application in Alaska. Nat. Hazards 69, 1519–1533. doi: 10.1007/s11069-013-0761-4
Holm, R., and Richards, S. (2013). A re-evaluation of arc-continent collision and along-arc variation in the Bismarck Sea region, Papua New Guinea. Aust. J. Earth Sci. 60, 605–619. doi: 10.1080/08120099.2013.824505
Holm, R., Rosenbaum, G., and Richards, S. (2016). Post 8 Ma reconstruction of Papua New Guinea and Solomon Islands: microplate tectonics in a convergent plate boundary setting. Earth Sci. Rev. 156, 66–81. doi: 10.1016/j.earscirev.2016.03.005
Huber, C., Bachmann, O., Vigneresse, J., Dufek, J., and Parmigiani, A. (2012). A physical model for metal extraction and transport in shallow magmatic systems. Geochem. Geophys. Geosyst. 13:Q08003. doi: 10.1029/2012GC004042
Humphreys, M., Blundy, J., and Sparks, R. (2006). Magma evolution and open-system processes at Shiveluch volcano: insights from phenocryst zoning. J. Petrol. 47, 2303–2334. doi: 10.1093/petrology/egl045
Jugo, P. (2009). Sulfur content at sulfide saturation in oxidized magmas. Geology 37, 415–418. doi: 10.1130/G25527A.1
Kaufman, Y. J., Justice, C. O., Flynn, L. P., Kendall, J. D., Prins, E. M., Giglio, L., et al. (1998). Potential global fire monitoring from EOS-MODIS. J. Geophys. Res. 103, 32215–32238. doi: 10.1029/98JD01644
Krotkov, N., Carn, S., Krueger, A., Bhartia, P., and Yang, K. (2006). Band residual difference algorithm for retrieval of SO2 from the AURA Ozone Monitoring Instrument (OMI). IEEE Trans. Geosci. Remote Sens. 44, 1259–1266. doi: 10.1109/TGRS.2005.861932
Krotkov, N. A., McLinden, C. A., Li, C., Lamsal, L. N., Celarier, E. A., Marchenko, S. V., et al. (2016). Aura OMI observations of regional SO2 and NO2 pollution changes from 2005 to 2015. Atmosph. Chem. Phys. 16, 4605–4629. doi: 10.5194/acp-16-4605-2016
Levelt, P., Hilsenrath, E., Leppelmeier, G., van den Oord, G., Bhartia, P., Tamminen, J., et al. (2006a). Science objectives of the Ozone Monitoring Instrument. IEEE Trans. Geosci. Remote Sens. 44, 1199–1208. doi: 10.1109/TGRS.2006.872336
Levelt, P., van den Oord, G., Dobber, M., Mlkki, A., Visser, H., de Vries, J., et al. (2006b). The ozone monitoring instrument. IEEE Trans. Geosci. Remote Sens. 44, 1093–1100. doi: 10.1109/TGRS.2006.872333
Li, C., Joiner, J., Krotkov, N., and Bhartia, P. (2013). A fast and sensitive new satellite SO2 retrieval algorithm based on principal component analysis: application to the Ozone Monitoring Instrument. Geophys. Res. Lett. 40, 1–5. doi: 10.1002/2013GL058134
Li, C., Krotkov, N., Carn, S., Zhang, Y., Spurr, R., and Joiner, J. (2017). New-generation NASA Aura Ozone Monitoring Instrument (OMI) volcano SO2 dataset: algorithm description, initial results, and continuation with the Suomi-NPP Ozone Mapping and Profiler Suite (OMPS). Atmosph. Meas. Techniq. 10, 445–458. doi: 10.5194/amt-10-445-2017
Liu, Y., Samaha, N.-T., and Baker, D. (2007). Sulfur concentration at sulfide saturation (SCSS) in magmatic silicate melts. Geochim. Cosmochim. Acta 71, 1783–1799. doi: 10.1016/j.gca.2007.01.004
Lopez, T., Carn, S., Werner, C., Fee, D., Kelly, P., Doukas, M., et al. (2013a). Evaluation of Redoubt volcano's sulfur dioxide emissions by the Ozone Monitoring Instrument. J. Volcanol. Geother. Res. 259, 290–307. doi: 10.1016/j.jvolgeores.2012.03.002
Lopez, T., Ushakov, S., Izbekov, P., Tassi, F., Cahill, C., Neill, O., et al. (2013b). Constraints on magma processes, subsurface conditions, and total volatile flux at Bezymianny Volcano in 2007-2010 from direct and remote volcanic gas measurements. J. Volcanol. Geother. Res. 263, 92–107. doi: 10.1016/j.jvolgeores.2012.10.015
Mason, E., Edmonds, M., and Turchyn, A. (2017). Remobilization of crustal carbon may dominate arc volcanic emissions. Science 357, 290–294. doi: 10.1126/science.aan5049
McCormick, B., Edmonds, M., Mather, T., and Carn, S. (2012). First synoptic analysis of volcanic degassing in Papua New Guinea. Geochem. Geophys. Geosyst. 13:Q03008. doi: 10.1029/2011GC003945
McCormick, B., Herzog, M., Yang, J., Edmonds, M., Mather, T., Carn, S., et al. (2014). A comparison of satellite- and ground-based measurements of SO2 emissions from Tungurahua volcano, Ecuador. J. Geophys. Res. 119, 4264–4285.
McCormick, B., Popp, C., Andrews, B., and Cottrell, E. (2015). Ten years of satellite observations reveal highly variably sulphur dioxide emissions at Anatahan Volcano, Mariana Islands. J. Geophys. Res. 120, 7258–7282. doi: 10.1002/2014JD022856
McGonigle, A., Delmelle, P., Oppenheimer, C., Tsanev, V., Delfosse, T., Williams-Jones, G., et al. (2004a). SO2 depletion in tropospheric volcanic plumes. Geophys. Res. Lett. 31:L13201. doi: 10.1029/2004GL019990
McGonigle, A., Oppenheimer, C., Tsanev, V., Saunders, S., Mulina, K., Tohui, S., et al. (2004b). Sulphur dioxide fluxes from papua new guinea's volcanoes. Geophys. Res. Lett. 31:L08606. doi: 10.1029/2004GL019568
Murphy, M., Sparks, R., Barclay, J., Carroll, M., and Brewer, T. (2000). Remobilization of andesite magma by intrusion of mafic magma at the Soufrière Hills Volcano, Montserrat, West Indies. J. Petrol. 41, 21–42. doi: 10.1093/petrology/41.1.21
Norton, G., Watts, R., Voight, B., Mattioli, G., Herd, R., Young, S., et al. (2002). Pyroclastic flow and explosive activity at soufrière hills volcano, montserrat, during a period of virtually no magma extrusion (march 1998 to november 1999). Geol. Soc. Memoir 21, 467–481. doi: 10.1144/GSL.MEM.2002.021.01.21
Oppenheimer, C., Francis, P., and Stix, J. (1998). Depletion rates of sulfur dioxide in tropospheric volcanic plumes. Geophys. Res. Lett. 25, 2671–2674. doi: 10.1029/98GL01988
Parmigiani, A., Faroughi, S., Huber, C., Bachmann, O., and Su, Y. (2016). Bubble accumulation and its role in the evolution of magma reservoirs in the upper crust. Nature 532, 492–495. doi: 10.1038/nature17401
Pieri, D., and Abrams, M. (2004). ASTER watches the world's volcanoes: a new paradigm for volcanological observations from orbit. J. Volcanol. Geother. Res. 135, 13–28. doi: 10.1016/j.jvolgeores.2003.12.018
Plail, M., Edmonds, M., Woods, A., Barclay, J., Humphreys, M., Herd, R., et al. (2018). Mafic enclaves record syn-eruptive basalt intrusion and mixing. Earth Planet. Sci. Lett. 484, 30–40. doi: 10.1016/j.epsl.2017.11.033
Power, J., Coombs, M., and Freymueller, J. editors (2010). “The 2006 eruption of Augustine Volcano, Alaska,” in U.S Geological Society Professional Paper 1769.
Rodriguez, L., Watson, I., Edmonds, M., Ryan, G., Hards, V., Oppenheimer, C., et al. (2008). SO2 loss rates in the plume emitted by Soufrière Hills volcano, Montserrat. J. Volcanol. Geother. Res. 173, 135–147. doi: 10.1016/j.jvolgeores.2008.01.003
Rogerson, R. J., Hilyard, D. B., Finlayson, E. J., Johnson, R. W, and McKee, C. O. (1989). The Geology and Mineral Resources of Bougainville and Buka Islands, Papua New Guinea, Vol 16. Port Moresby: Geological Survey of Papua New Guinea Memoir, 217.
Rothery, D., Coppola, D., and Saunders, C. (2005). Analysis of volcanic activity patterns using MODIS thermal alerts. Bull. Volcanol. 67, 539–556. doi: 10.1007/s00445-004-0393-3
Sheldrake, T., Sparks, R., Cashman, K., Wadge, G., and Aspinall, W. (2016). Similarities and differences in the historical records of lava dome-building volcanoes: Implications for understanding magmatic processes and eruption forecasting. Earth Sci. Rev. 160, 240–263. doi: 10.1016/j.earscirev.2016.07.013
Sherrod, D., Scott, W., and Stauffer, P. editors (2008). “A Volcano Rekindled; The Renewed Eruption of Mount St. Helens, 2004-2008,” in U.S Geological Society Professional Paper 1750.
Shinohara, H. (2013). Volatile flux from subduction zone volcanoes: insights from a detailed evaluation of the fluxes from volcanoes in Japan. J. Volcanol. Geother. Res. 268, 46–63. doi: 10.1016/j.jvolgeores.2013.10.007
Stix, J., Zapata, J. A., Calvache, M. V., Cortés, G. P., Fischer, T. P., Gómez, D., et al. (1993). A model of degassing at Galeras Volcano, Colombia, 1988-1993. Geology 21, 963–967. doi: 10.1130/0091-7613(1993)021<0963:AMODAG>2.3.CO;2
Syracuse, E., and Abers, G. (2004). Global compilation of variations in slab depth beneath arc volcanoes and implications. Geochem. Geophys. Geosyst. 7:Q05017.
Thomas, H., Watson, I., Kearney, C., Carn, S., and Murray, S. (2009). A multi-sensor comparison of sulphur dioxide emissions from the 2005 eruption of Sierra Negra volcano, Galápagos Islands. Remote Sens. Environ. 113, 1331–1342. doi: 10.1016/j.rse.2009.02.019
Tregoning, P., Lambeck, K., Stoltz, A., Morgan, P., McClusky, S., van der Beek, P., et al. (1998). Estimation of current plate motions in Papua New Guinea from Global Positioning System observations. J. Geophys. Res. 103, 12181–12203. doi: 10.1029/97JB03676
Wadge, G., McCormick Kilbride, B. T., Edmonds, M., and Johnson, R. (2018). Persistent growth of a young andesite lava cone: Bagana Volcano, Papua New Guinea. J. Volcanol. Geother. Res. 356, 304–315. doi: 10.1016/j.jvolgeores.2018.03.012
Wadge, G., Robertson, R., and Voight, B. editors (2014). The Eruption of Soufrière Hills Volcano, Montserrat from 2000 to 2010. Geological Society of London Memoir No. 39. doi: 10.1144/M39.1
Wadge, G., Saunders, S., and Itikarai, I. (2012). Pulsatory andesite lava flow at Bagana volcano, Papua New Guinea. Geochem. Geophys. Geosyst. 13:Q11011.
Wallace, P. (2001). Volcanic SO2 emissions and the abundance and distribution of exsolved gas in magma bodies. J. Volcanol. Geother. Res. 108, 85–106. doi: 10.1016/S0377-0273(00)00279-1
Wallace, P. (2005). Volatiles in subduction zone magmas: concentrations and fluxes based on melt inclusion and volcanic gas data. J. Volcanol. Geother. Res. 140, 217–240. doi: 10.1016/j.jvolgeores.2004.07.023
Wallace, P., and Edmonds, M. (2011). The sulfur budget in magmas: evidence from melt inclusions, submarine glasses, and volcanic gas emissions. Rev. Mineral. Geochem. 73, 215–246. doi: 10.2138/rmg.2011.73.8
Wooster, M., Zhukov, B., and Oertel, D. (2003). Fire radiative energy for quantitative study of biomass burning: derivation from the BIRD experimental satellite and comparison to MODIS fire products. Remote Sens. Environ. 86, 83–107. doi: 10.1016/S0034-4257(03)00070-1
Wright, R. (2016). MODVOLC: 14 years of autonomous observations of effusive volcanism from space. Geol. Soc. Lond. Spec. Publ. 426, 23–53. doi: 10.1144/SP426.12
Wright, R., Flynn, L., Garbeil, H., Harris, A., and Pilger, E. (2002). Automated volcanic eruption detection using MODIS. Remote Sens. Environ. 82, 135–155. doi: 10.1016/S0034-4257(02)00030-5
Wright, R., Flynn, L., Garbeil, H., Harris, A., and Pilger, E. (2004). MODVOLC: near-real-time thermal monitoring of global volcanism. J. Volcanol. Geother. Res. 135, 29–49. doi: 10.1016/j.jvolgeores.2003.12.008
Yang, K., Krotkov, N., Krueger, A., Carn, S., Bhartia, P., and Levelt, P. (2007). Retrieval of large volcanic SO2 columns from the Aura Ozone Monitoring Instrument: comparison and limitations. J. Geophys. Res. 112:D24S43. doi: 10.1029/2007JD008825
Keywords: Bagana volcano, satellite remote sensing, sulfur dioxide, lava extrusion, OMI, MODIS
Citation: McCormick Kilbride BT, Mulina K, Wadge G, Johnson RW, Itikarai I and Edmonds M (2019) Multi-year Satellite Observations of Sulfur Dioxide Gas Emissions and Lava Extrusion at Bagana Volcano, Papua New Guinea. Front. Earth Sci. 7:9. doi: 10.3389/feart.2019.00009
Received: 27 April 2018; Accepted: 18 January 2019;
Published: 26 February 2019.
Edited by:
Andrew McGonigle, University of Sheffield, United KingdomReviewed by:
Hiroshi Shinohara, Geological Survey of Japan (AIST), JapanAlessandro Tibaldi, Università degli studi di Milano Bicocca, Italy
Copyright © 2019 McCormick Kilbride, Mulina, Wadge, Johnson, Itikarai and Edmonds. This is an open-access article distributed under the terms of the Creative Commons Attribution License (CC BY). The use, distribution or reproduction in other forums is permitted, provided the original author(s) and the copyright owner(s) are credited and that the original publication in this journal is cited, in accordance with accepted academic practice. No use, distribution or reproduction is permitted which does not comply with these terms.
*Correspondence: Brendan T. McCormick Kilbride, brendanvolc@gmail.com