Real-Time Geophysical Monitoring of Particle Size Distribution During Volcanic Explosions at Stromboli Volcano (Italy)
 Laura Pioli1,2*
  Andrew J. L. Harris3
- 1Département des Sciences de la Terre, Université de Genève, Geneva, Switzerland
- 2Dipartimento di Scienze Chimiche e Geologiche, Università degli Studi di Cagliari, Cagliari, Italy
- 3Université Clermont Auvergne, CNRS, OPGC, Laboratoire Magmas et Volcans, Clermont-Ferrand, France
Of all the key parameters needed to inform forecast models for volcanic plumes, real-time tracking particle size distribution (PSD) of pyroclasts leaving the vent coupled with plume modeling has probably the highest potential for effective management of volcanic hazard associated with plume dispersal and sedimentation. This paper presents a novel algorithm capable of providing syn-emission horizontal size and velocity of particles in real time, converted in mass discharge rates, and its evolution during an explosion, using thermal infrared videos. We present data on explosions that occurred at the SW crater of Stromboli volcano (Italy) in 2012. PSDs and mass eruption rate (MER) data, collected at frequencies of 40 Hz, are then coupled with particle and gas speed data collected with traditional image analysis techniques. The dataset is used to quantify for the first time the dynamics of the explosions and the regime of magma fragmentation. We find that explosive evacuation of magma from a Strombolian conduit during a single explosion proceeds at a constant rate while the explosive dynamics are marked by a pattern that includes an initial transient and short phase until the system stabilizes at equilibrium. These stationary conditions dominate the emission. All explosions begin with a gas jet (onset phase), with maximum recorded vertical velocities above 150 m/s. These high velocities are for small particles carried by the faster moving gas or pressure wave, and larger particles typically have slower velocities. The gas jets are followed by a particle-loaded plume. The particles increase in number until the explosion dynamics become almost constant (in the stationary phase). MER is either stable or increases during the onset to become stable in the stationary phase. The shearing at the interface between the magma and the gas jets controls fragmentation dynamics and particles sizes. Quantification of the Reynolds and Weber numbers suggests that the fragmentation regime changes during an explosion to affect particle shape. The algorithm proposed requires low-cost thermal monitoring systems, and low processing capability, but is robust, powerful, and accurate and is able to provide data with unprecedented accuracy. In general terms, its applicability is limited by the size of individual pixels recorded by the camera, which depends on the detector, the recording distance, and the optical system, particle temperature, which has to be significantly higher than the background.
Introduction
Real-time geophysical monitoring is a fundamental tool for tracking and understanding volcanic activity and real-time hazard assessment (e.g., Scarpa and Tilling, 1996; Sparks et al., 2012; Ji et al., 2017). In the aftermath of Iceland’s Ejafyallajokull eruption of 2010 numerous working groups and think-tanks (Wotawa and Stohl, 2012; Bonadonna, 2014; Brenot et al., 2014) identified real-time tracking of particle size distribution (PSD), in synergy with plume modeling, as a fundamental need for improved hazard assessment and effective management of volcanic crises. The size distribution of particles generated during explosive eruption is controlled by magmatic fragmentation processes explosion energy, magma rheology, and rise rate in the conduit (e.g., Kaminski and Jaupart, 1998; Rust and Cashman, 2011; Costa et al., 2016). It is also a fundamental parameter for hazard quantification because it affects the plume dispersal, as well as the distribution and impact energy of pyroclastic particles falling on the ground (e.g., Hurst and Turner, 1999; Costa et al., 2006; Mastin et al., 2009).
Magma fragmentation processes have been described based on experimental and theoretical models (e.g., Dingwell, 1996; Papale, 1999; Gonnermann, 2015). These have quantified the conditions necessary for magma disruption, but have not been able to constrain PSD of the particles generated. Instead, empirical PSD studies, mainly based on deposit analysis, are the only source for first-order studies on particle size variability associated with different eruption styles (Costa et al., 2016). For this reason, forecasting of PSD based on eruption parameters such as mass eruption rate (MER) and exit velocity, which can both be constrained given appropriate measurement and analysis tools (e.g., Wen and Rose, 1994; Spanu et al., 2016; Vulpiani et al., 2016), is not yet possible. Thus, improved, data-driven, understanding of magma fragmentation and plume generation processes are needed to inform forecast models.
Particle size distributions are currently assessed based on strategies that use satellite data collected in the thermal infrared (Prata and Bernardo, 2009; Cerminara et al., 2015), ground-based disdrometers and radar systems (Gouhier and Donnadieu, 2008; Scollo et al., 2009), and thermal and visible cameras (Chouet et al., 1974; Ripepe et al., 1993; Bombrun et al., 2015). Each of these methods has their own potential and limitations in terms of the size range considered, as well as spatial and temporal resolution, and specific strategies need to be tailored to the type of emission. For these reasons, there is the need of a robust, low-cost system which allows for fast acquisition (>1 Hz) and high spatial resolution (<1 cm) to provide real-time data amenable to automated, real-time processing tailored to the explosive style.
To fully explore the potential of a thermal monitoring system in providing vent leaving syn-emission PSD in real time, coupled with other eruption source parameters, we propose an algorithm to analyze thermal profiles collected at high temporal resolution across the volcanic jet. This is the first algorithm ever created to monitor PSDs in volcanic eruptions in real time. We select Stromboli as our validation site as it is a reliable particle emitter with well-known and constrained PSD and eruption characteristics (e.g., Calvari et al., 2008; Lucchi et al., 2013; Bombrun et al., 2015). Because of its stability and persistence of activity, Stromboli is also a well-known working model to link conduit dynamics, magma fragmentation, and plume emission (e.g., Hort et al., 2003; Gaudin et al., 2014; Chevalier and Donnadieu, 2015). Our approach allows us to link the dynamic relation between these three elements of the eruptive system over very short timescales and evaluate their effect on fragmentation efficiency. Finally, based on the collected data, we discuss the possible processes controlling magma fragmentation in these events, and how they are affected by magma properties and conduit dynamics.
Materials and Methods
Stromboli has an average explosion frequency of 10 per hour, each producing an average of 103 kg of particles dominated by bomb and lapilli of basaltic composition (Harris and Ripepe, 2007; Ripepe et al., 2008; Harris et al., 2012). PSD and benchmark data are available from Colò (2012), Gurioli et al. (2013), and Bombrun et al. (2015). Thermal images were originally acquired at a rate of 200 Hz, and spatial resolution of 5.1 cm per pixel using a FLIR systems SC655 thermal camera. This was equipped with a 3.6× magnification lens (Figure 1; Bombrun et al., 2015) and data were collected over four consecutive days from 27 to 30 September 2012 at Stromboli’s SW crater. These data have already been analyzed to calculate total PSD, MER, and particle exit speeds by Bombrun et al. (2015) using a custom-built particle tracking routine (Bombrun et al., 2014). However, PSDs were evaluated for the entire eruption, and were not capable of showing any evolution during the event. To achieve this, we apply a new method whereby a thermal profile is defined by a horizontal line immediately above the vent and though which all emitted particles pass (Figure 2). The line was chosen as close as possible to and slightly larger of the vent(s), in order to maximize the number of clasts counted, and minimize the noise resulting from the falling back of clasts around the vent. A balance needs to be found between a line that is to narrow, thereby only partially sampling the full column width, and the line that is too long, thereby including artifacts (e.g., hot bombs landing or falling back on the line to create permanent peaks). A second line, parallel to the first one, at about 20 pixels vertical distance was also set to check for accuracy and sensitivity of the method. The thermal profile was converted into a thermal residual profile by subtracting the background profile corresponding to the last pre-eruption image (Figure 2). In our model, the number of peaks equates to the number of particles and the width is a function of the particle size. Consequently, the total number of peaks corresponds to the number of particles moving across the reference line (and thus exiting the vent during the explosion), and the peak width distribution corresponds to particle diameter. Both of these quantities were extracted as a time series allowing summation for whole eruption values and total PSD as well as analysis of their evolution with time. Temporal sampling was defined by the maximum time required for the particles to cross the line. Given a minimum velocity of 8 m/s and a maximum diameter of 0.2–0.3 m (after Bombrun et al., 2015), lines were sampled at the maximum required frequency of 40 Hz.
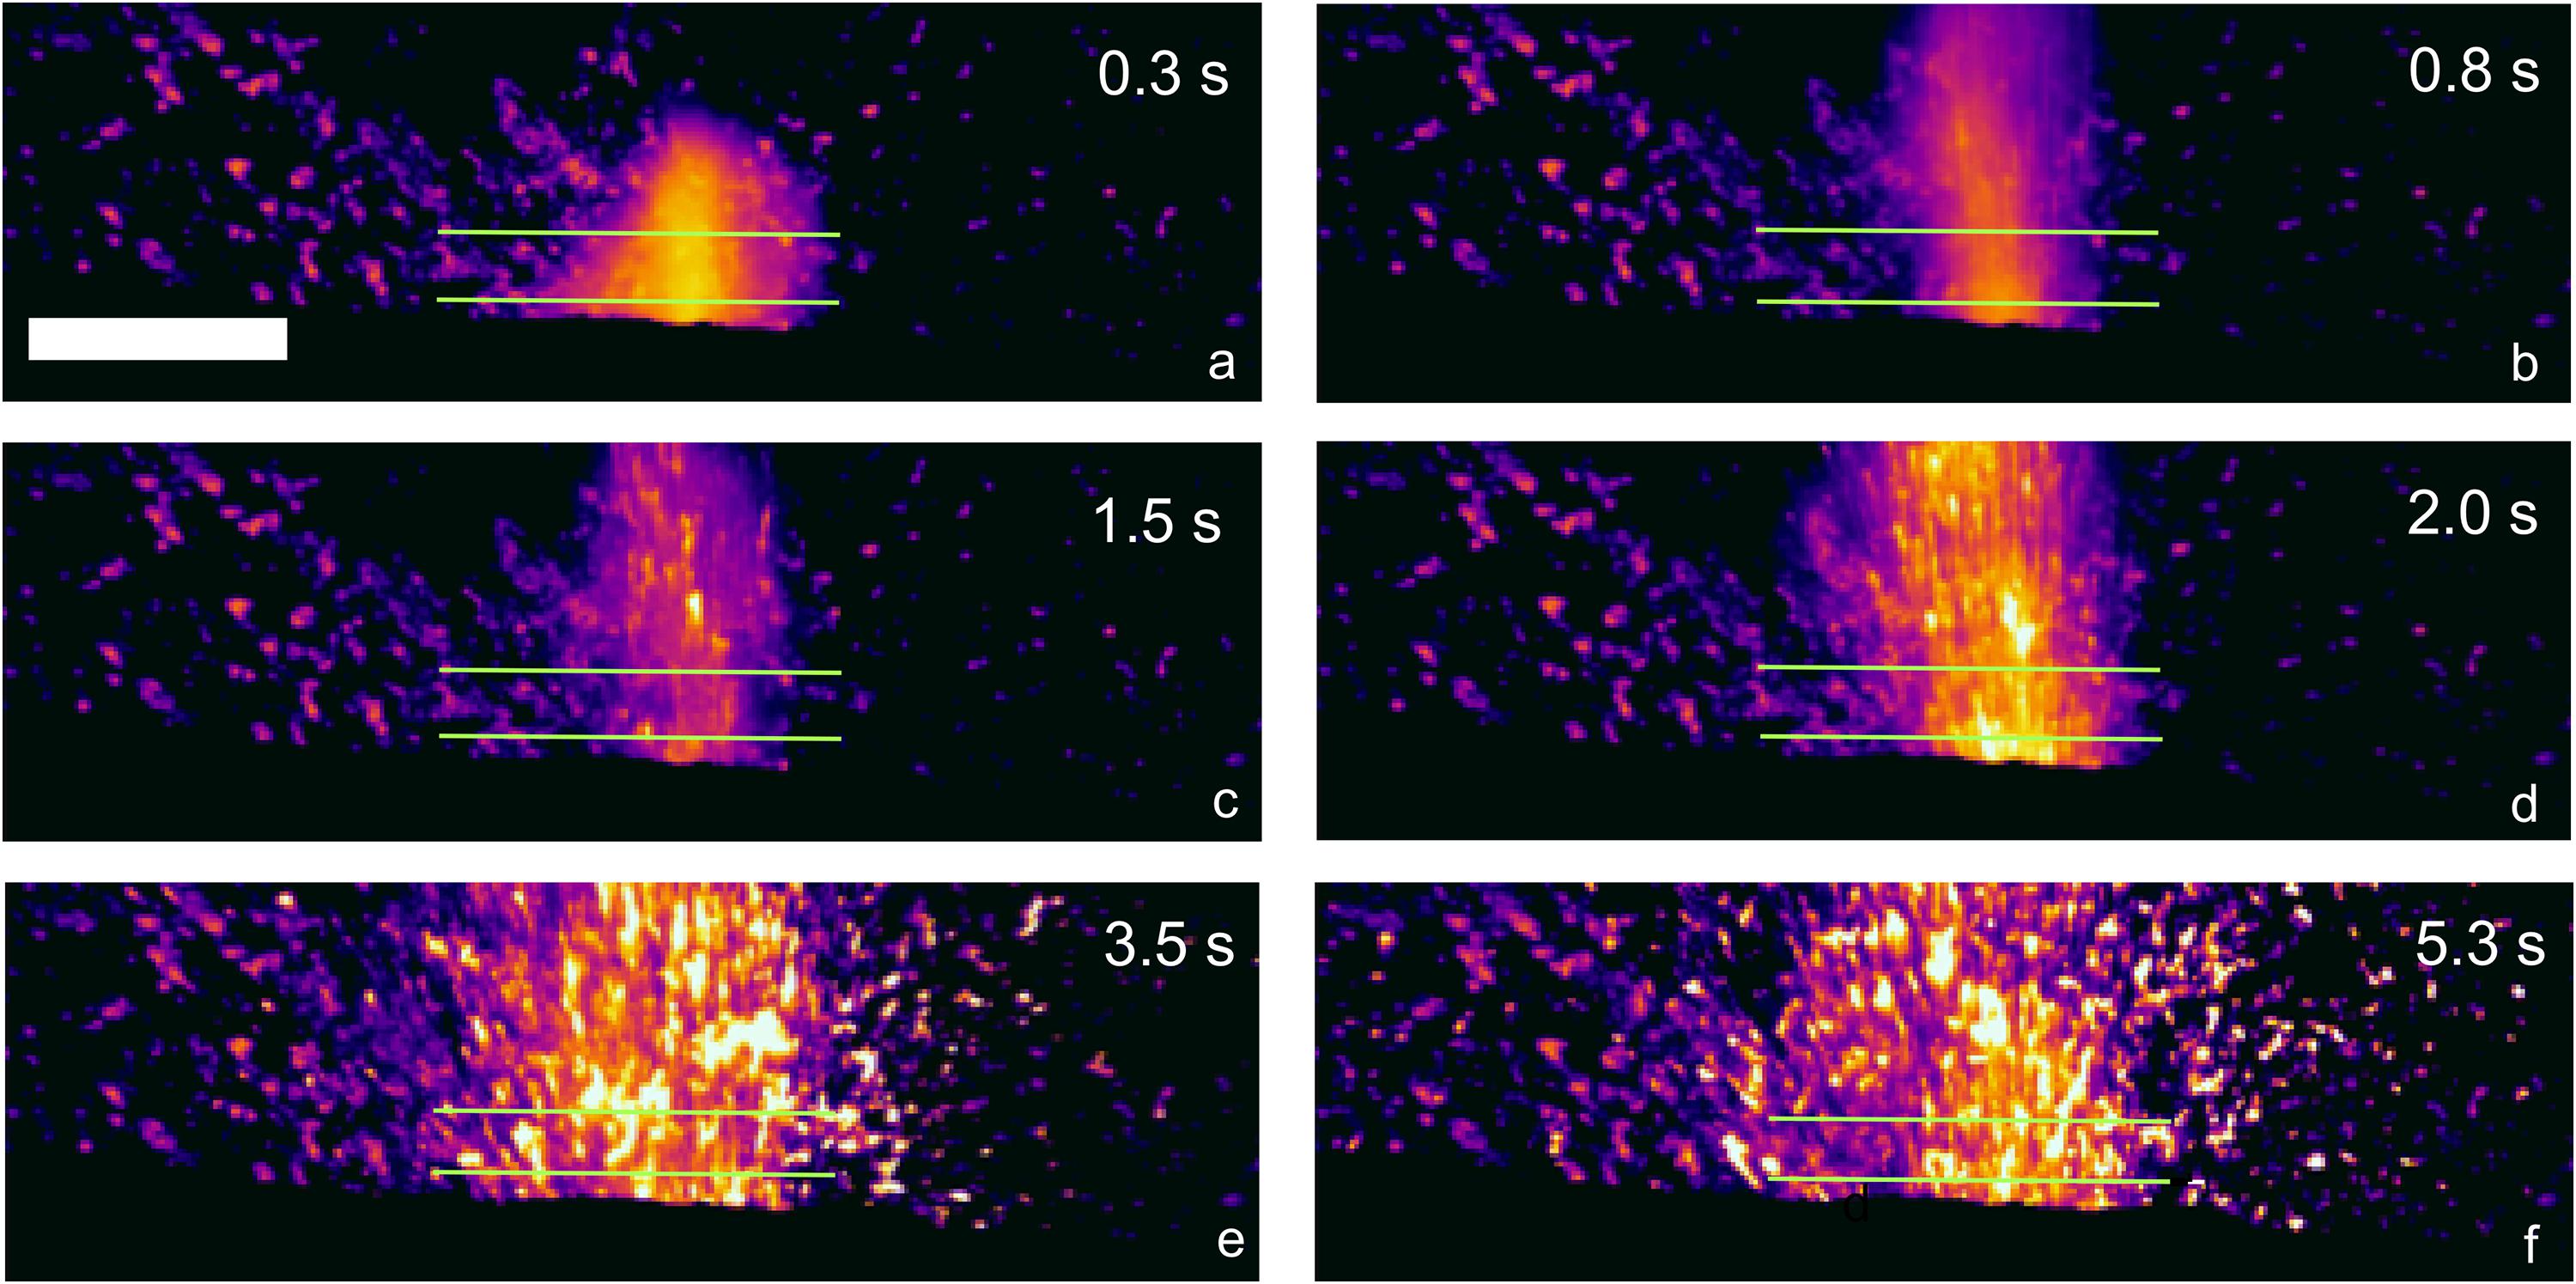
Figure 1. Sequence of thermal images of a type explosion from the SW crater of Stromboli (explosion 1 of Table 1). Images from (a–f) are taken at different times from the explosion onset, as marked by the numbers on top right. White scale bar is 4 m long. The green lines show the location of the analyzed thermal profiles. All the clasts intersected by the thermal profiles are leaving the vent.
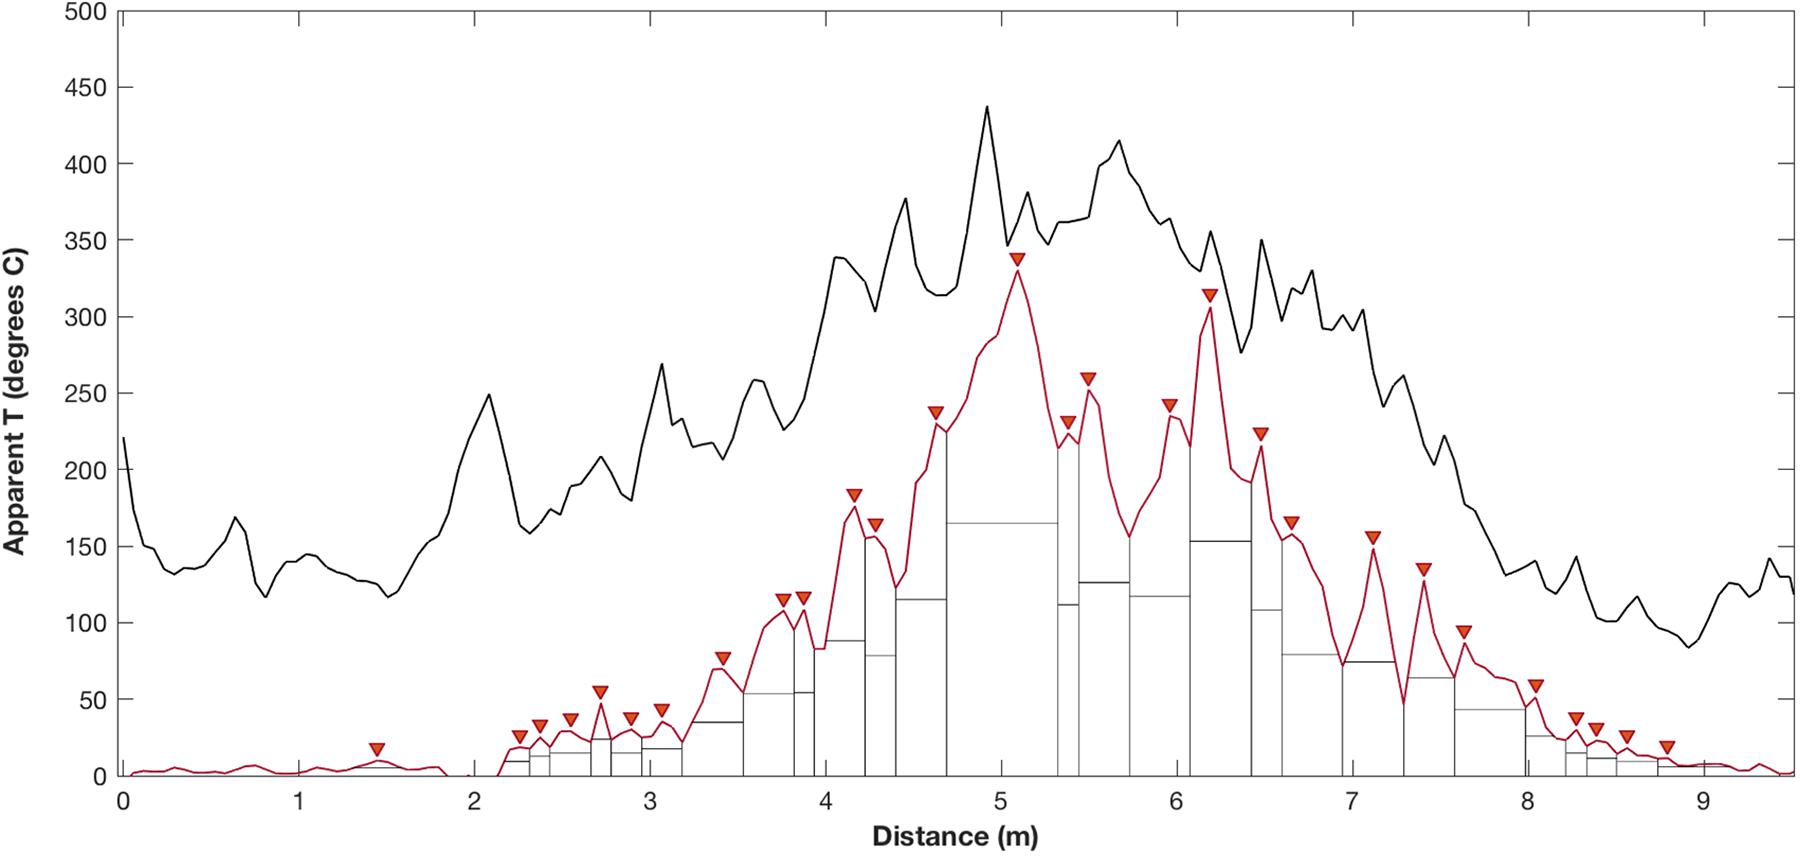
Figure 2. Lower thermal profile (black line) from Figure 1c. The residual profile for this image (i.e., the thermal profile minus that taken just before the explosion onset) is given by the brown line. Arrows point to the identified peaks (i.e., particles), horizontal lines indicate the half-prominence width, and the vertical lines the borders of each peak with respect to the background line.
Figure 3 shows the variability of recorded temperatures on single pixels along the thermal line located at different positions with respect to the vents. For short-lived explosions, the background temperature is almost fully recovered, whereas for longer explosive events, the background temperature is recovered only after the end. Because of highly variable path length conditions resulting from variable gas absorption (Sawyer and Burton, 2006), the correction applied only approximates the typical value of the background, and neglects the brightening and demeaning effect due to less or more gas in the path length, respectively. However, because the algorithm relies on peak identification and diameter, and not their relative height, its shift is not expected to affect the particle size study.
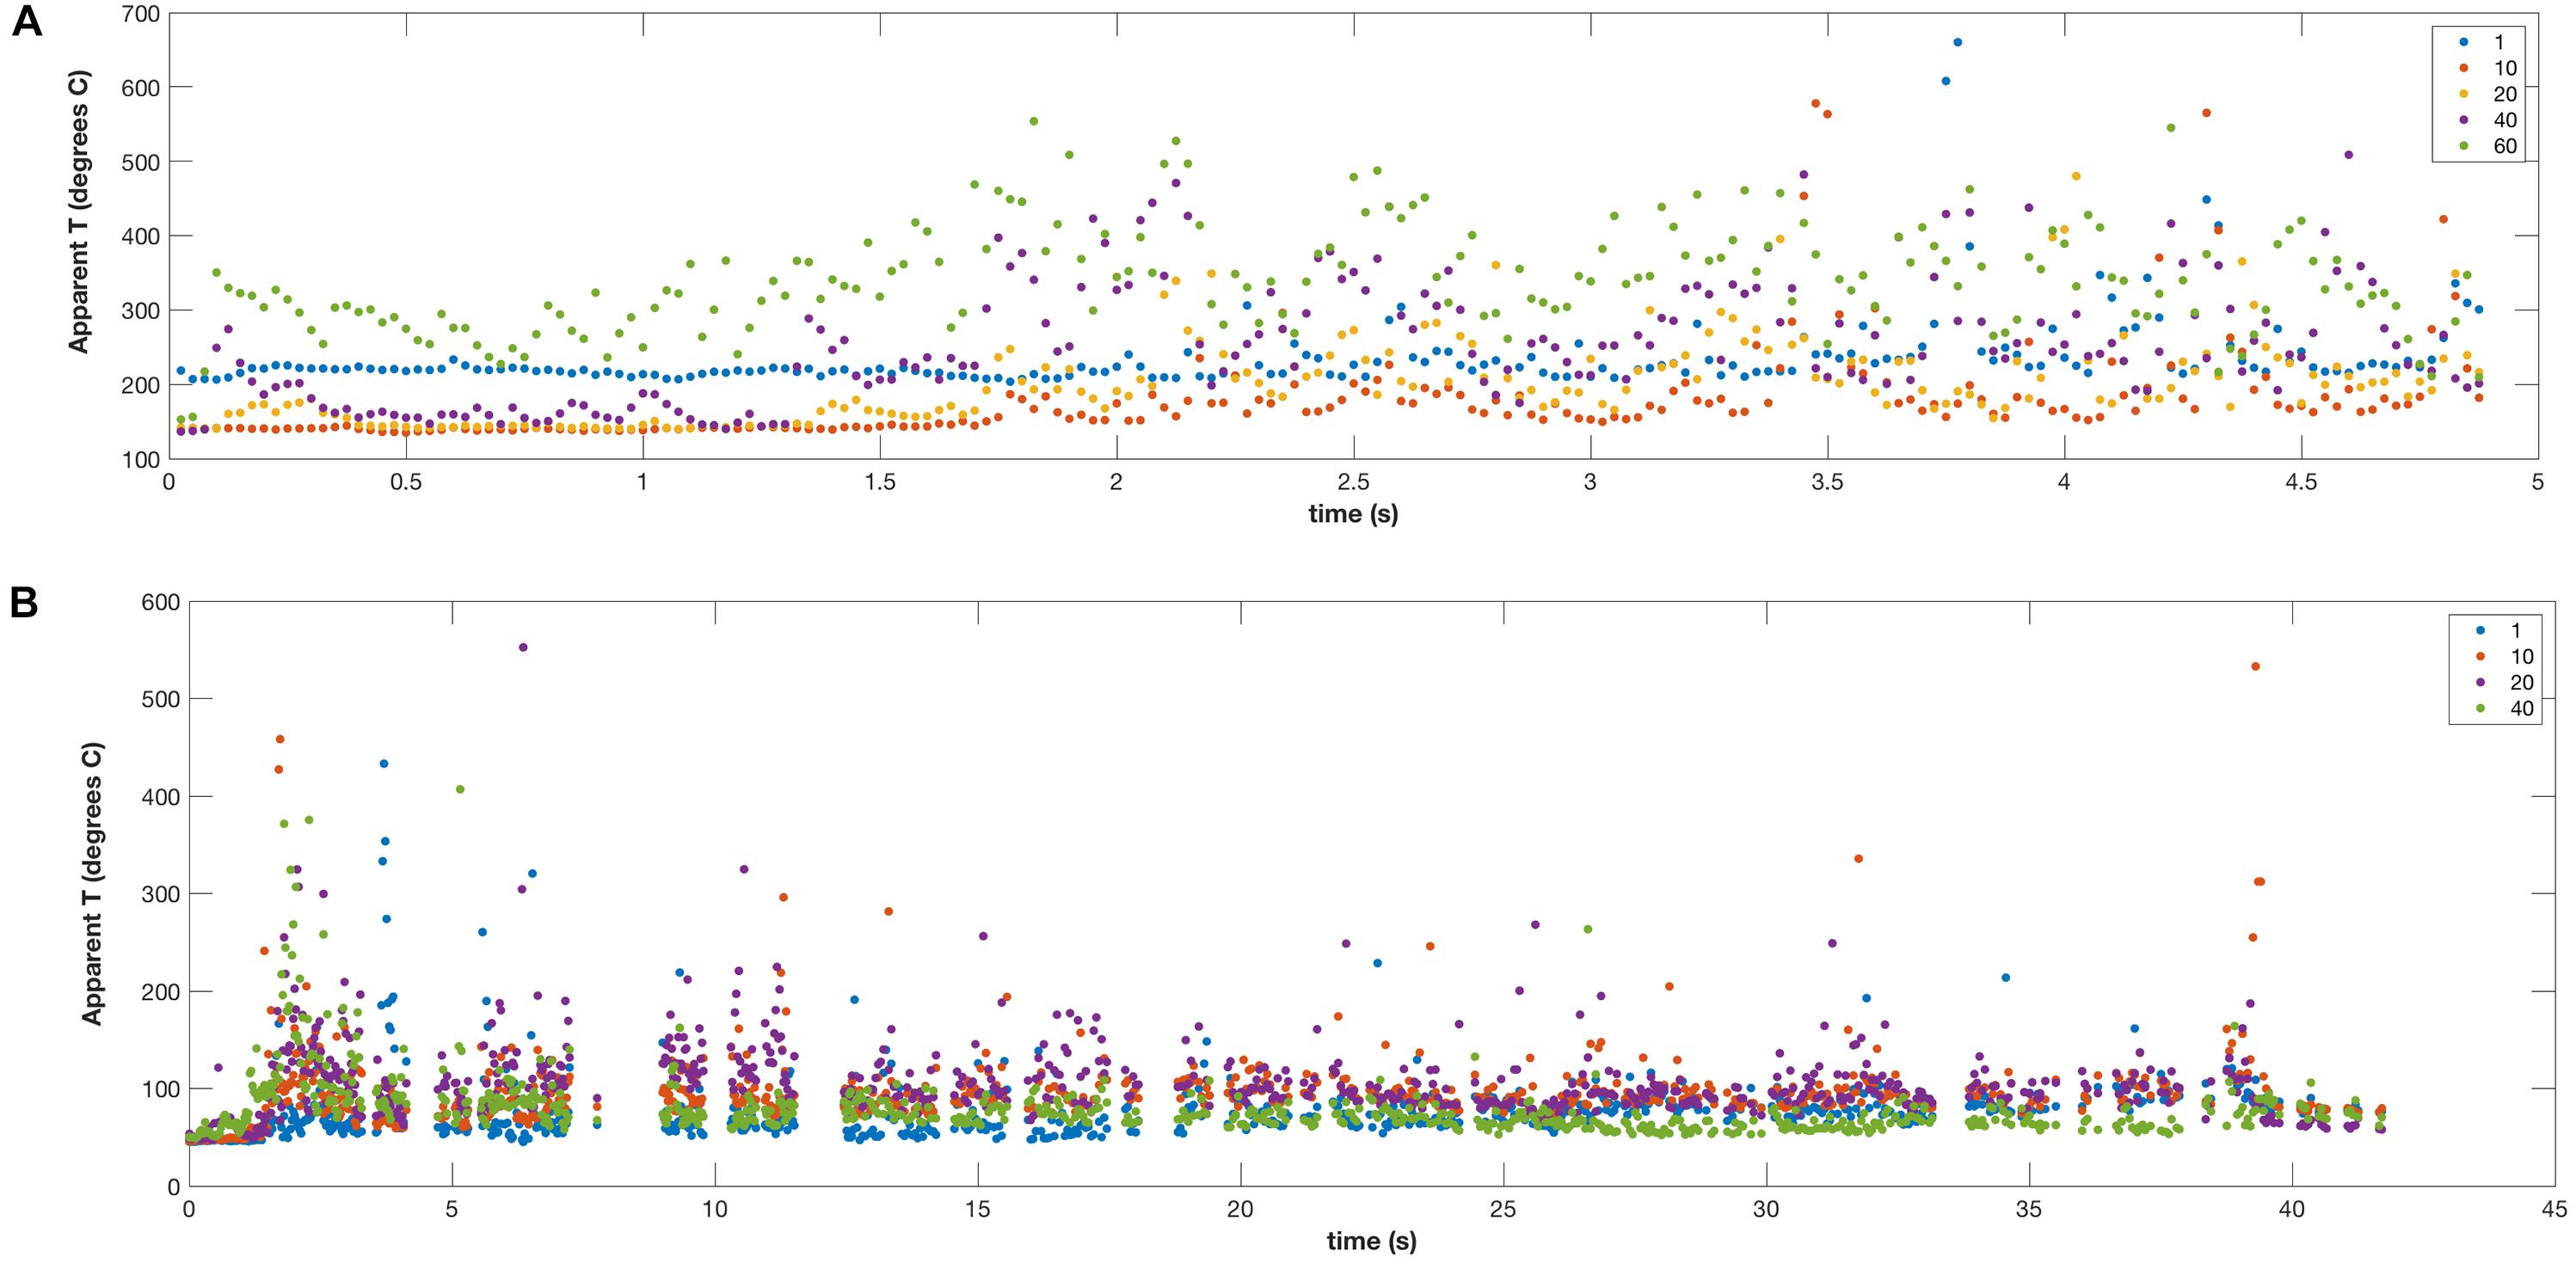
Figure 3. Variability of recorded temperature on single peaks in (A) explosion 1 and (B) explosion 5. Numbers in legend indicate the pixel position with respect to the thermal line (pixels are consecutively numbered starting from the SE).
Thermal peaks were identified, and constrained in terms of location along the profile, width, and amplitude by using the MATLAB function FINDPEAKS. The script detects the position of local maxima along a line, and by recalculating the signal as a sum of bell curves, measures the width of each peak at half height1. The effect on particle detection of no peak thresholding, and thresholding at variable temperatures was studied and is shown in Figure 4. Globally, increasing the thresholding temperature decreases the number of peaks detected, and has a minor effect on their mean diameter (Figures 4A,B,D,E) and of the calculation of magma discharge rates (MDRs). When thresholding is set at 50°C, the mean particle diameter becomes very unstable, and the number of detected peaks in each profile is reduced to about 25% of the peaks counted with no thresholding (Table 1). The combined decrease in peak number and the increase in peak diameters suggest that thresholding peaks beyond the small temperature fluctuations observed in the background filter out the smallest and colder pyroclasts, worsening accuracy of the method (Tables 1, 2 and Figure 3). For this reason, the results presented in the next chapters will be based on a 5°C thresholding of the residual thermal profile calculated after background subtraction.
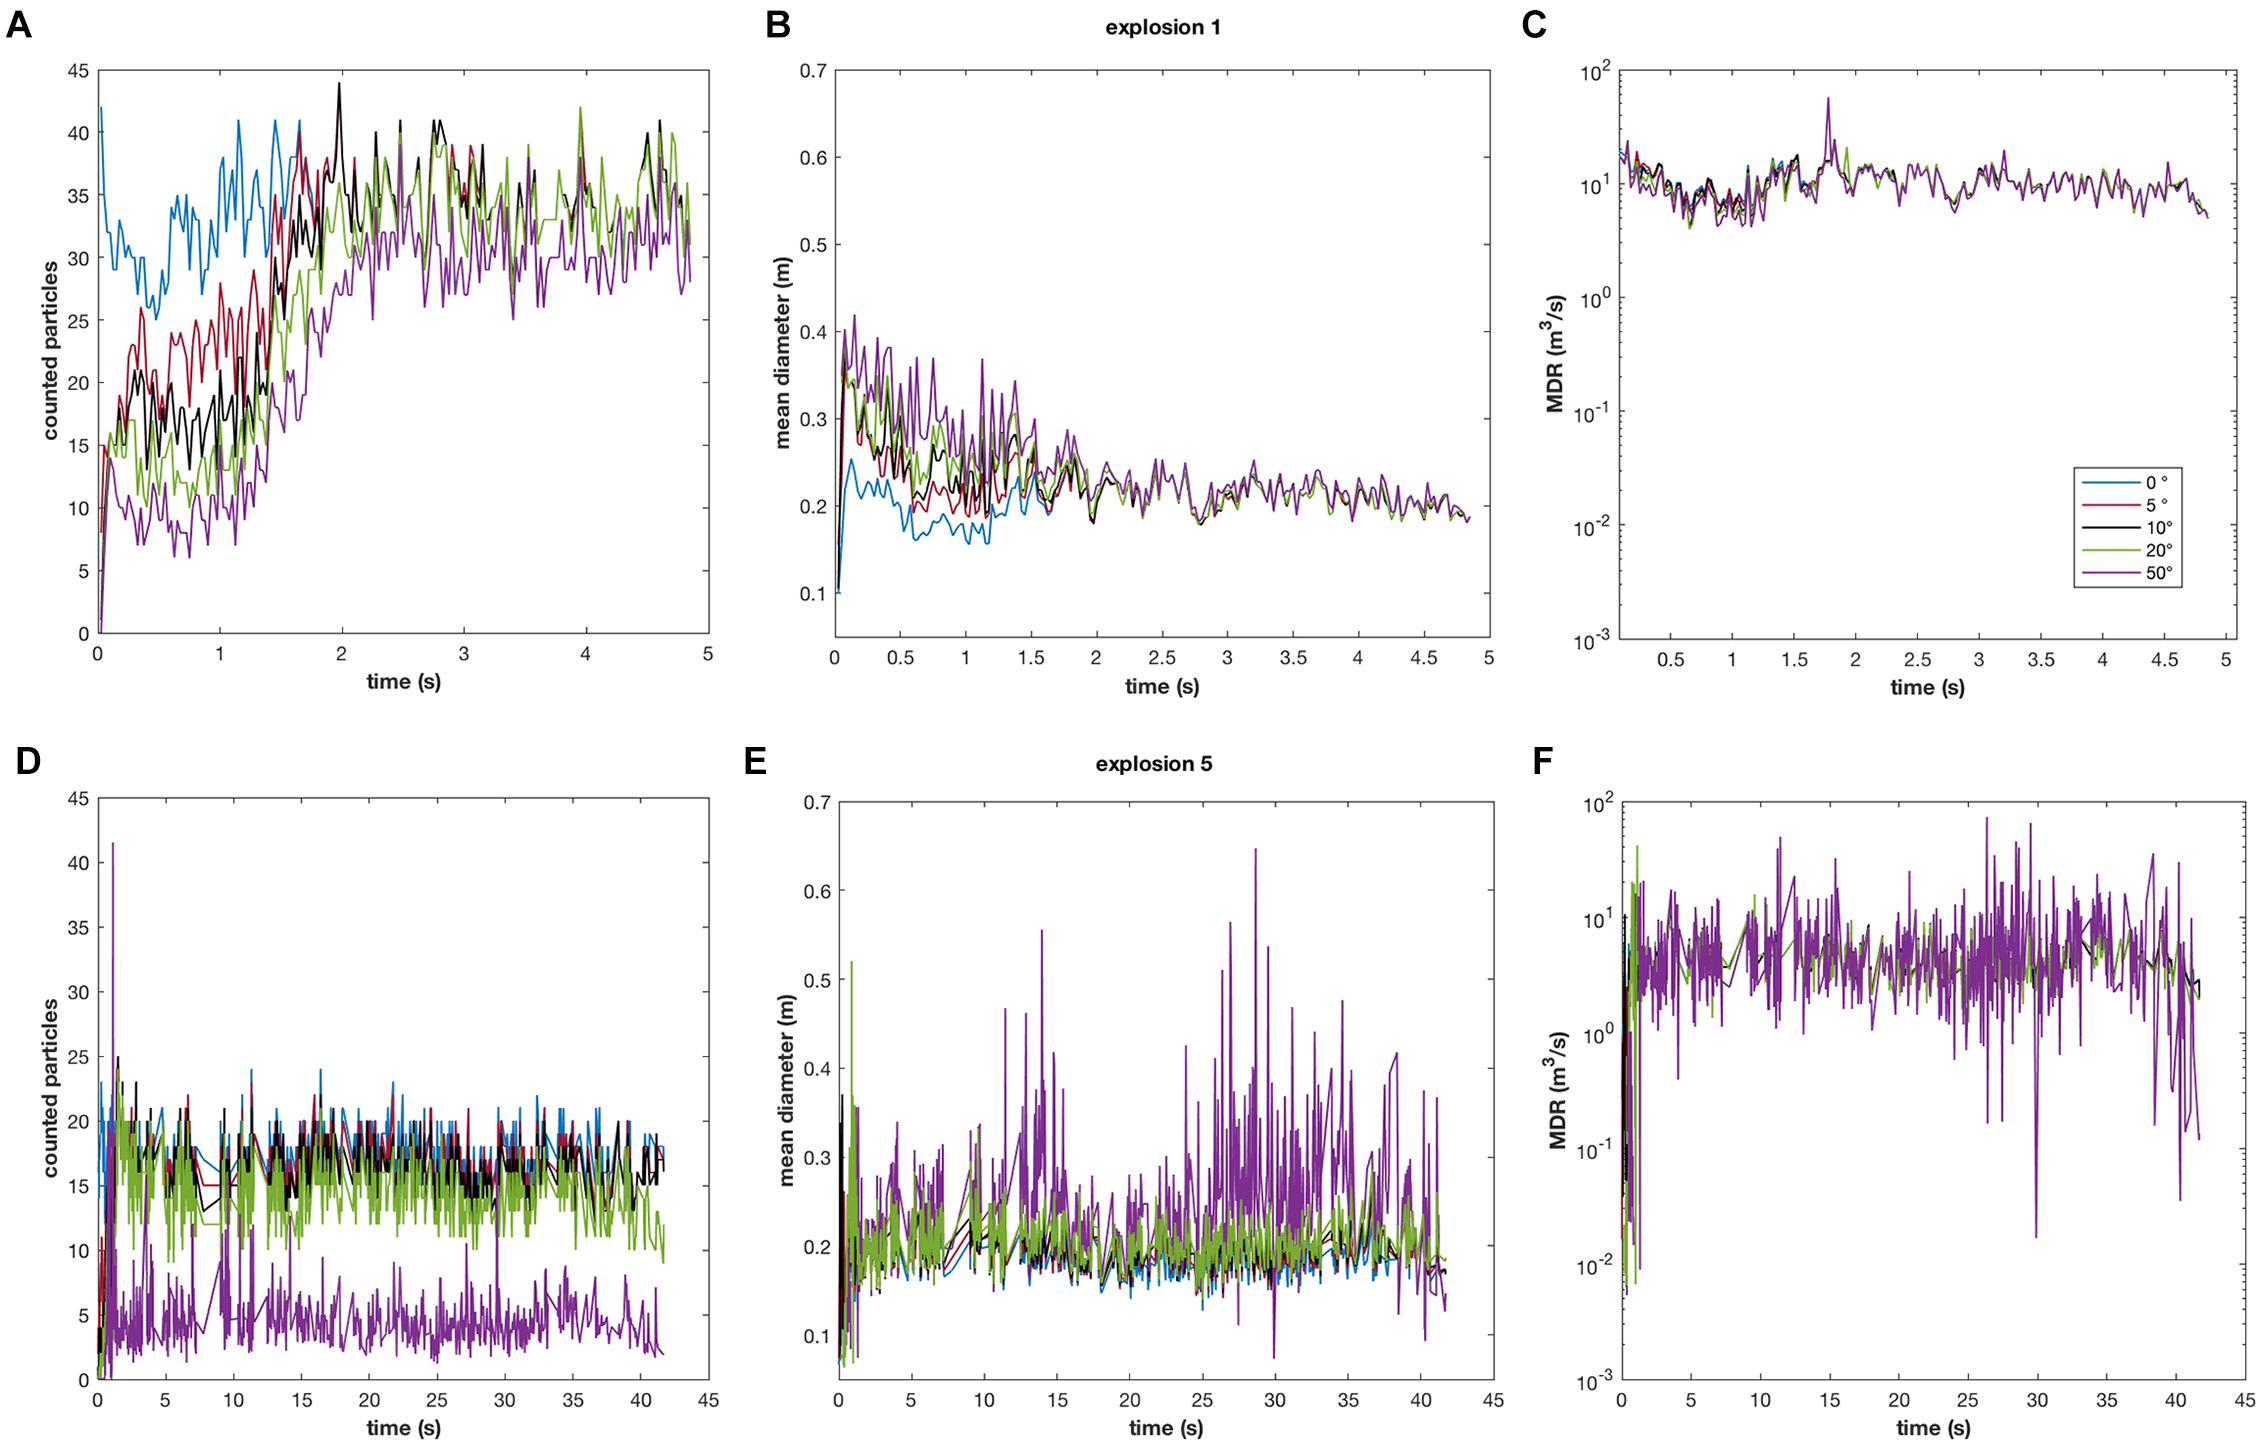
Figure 4. Variability of numbers of peaks detected, mean size, and MDR for (A–C) explosion 1 and (D–F) explosion 5 when peaks are counted with no, and 5, 10, 20, and 50°C thresholds after the residual thermal profiles calculated as shown in Figure 2. Numbers in legend indicate the thresholding temperatures.
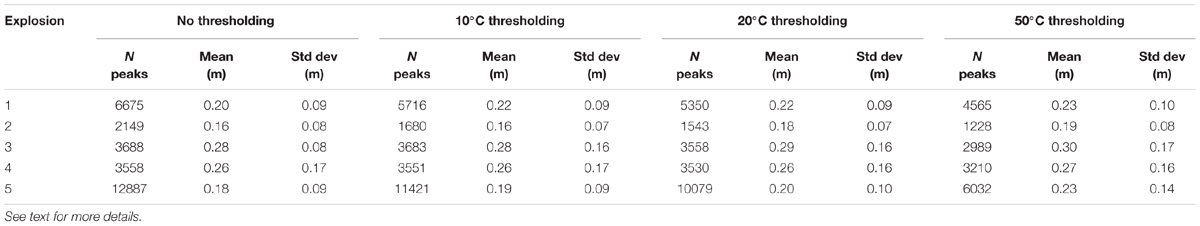
Table 1. Number of peaks counted, their mean diameters, and standard deviation calculated after no peak thresholding and thresholding peaks with temperatures higher than 10, 20, and 50° than the neighboring peaks.
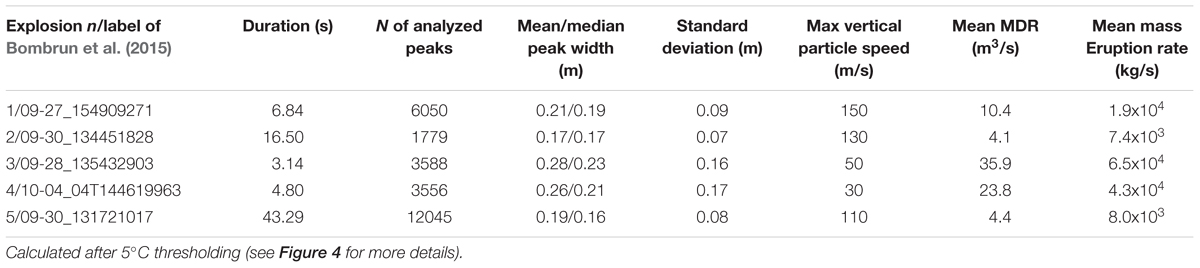
Table 2. Main features of the analyzed explosions occurred in between September 17 and October 4, 2012 at Stromboli volcano.
Subsequently, the vertical speed of individual particles was measured to check for under or oversampling of particles due to particles moving too fast (and thus not being recorded) or too slowly (and thus being potentially recorded more than once) on all the images originally recorded by the camera at a frequency of 200 fps. This was confirmed by visual inspection of consecutive images taken at 200 fps. If either case applies, sampling rate would have to be adjusted accordingly, but this was not the case for our data.
Time series analysis was stopped just before the first falling particle reached the thermal profile. By assuming a particle temperature of 950 ± 50°C and a ground temperature of 20 ± 5°C, and given that the minimum considered temperature anomaly is 35 ± 5°C, the minimum particle size which is able to create a single pixel thermal anomaly is 0.026 ± 0.018 cm2. As a consequence, the thermal profile is sensitive to particles down to 0.05–0.1 cm diameter, so that our smallest (single pixel) size bin includes particles from the size of the pixel (5.1 cm) down to sub-pixel objects 0.05 cm across. For a background as high as 150°C (and an anomaly of 175°C), the minimum particle size resolved may be as high as 0.38 cm.
The stability of the data and the effect of the positioning of the thermal line were tested by comparing the results obtained from analyzing two parallel thermal lines set at different distances above the vent (Figure 1). In all the analyzed explosions, the results from both lines are comparable but shifted in time accordingly to the mean particle vertical speed and the distance between the profiles; the lower line shows slightly more peaks but similar mean peak diameters (Figure 5). For simplicity, only the lines positioned closer to the vent were used for further calculations.
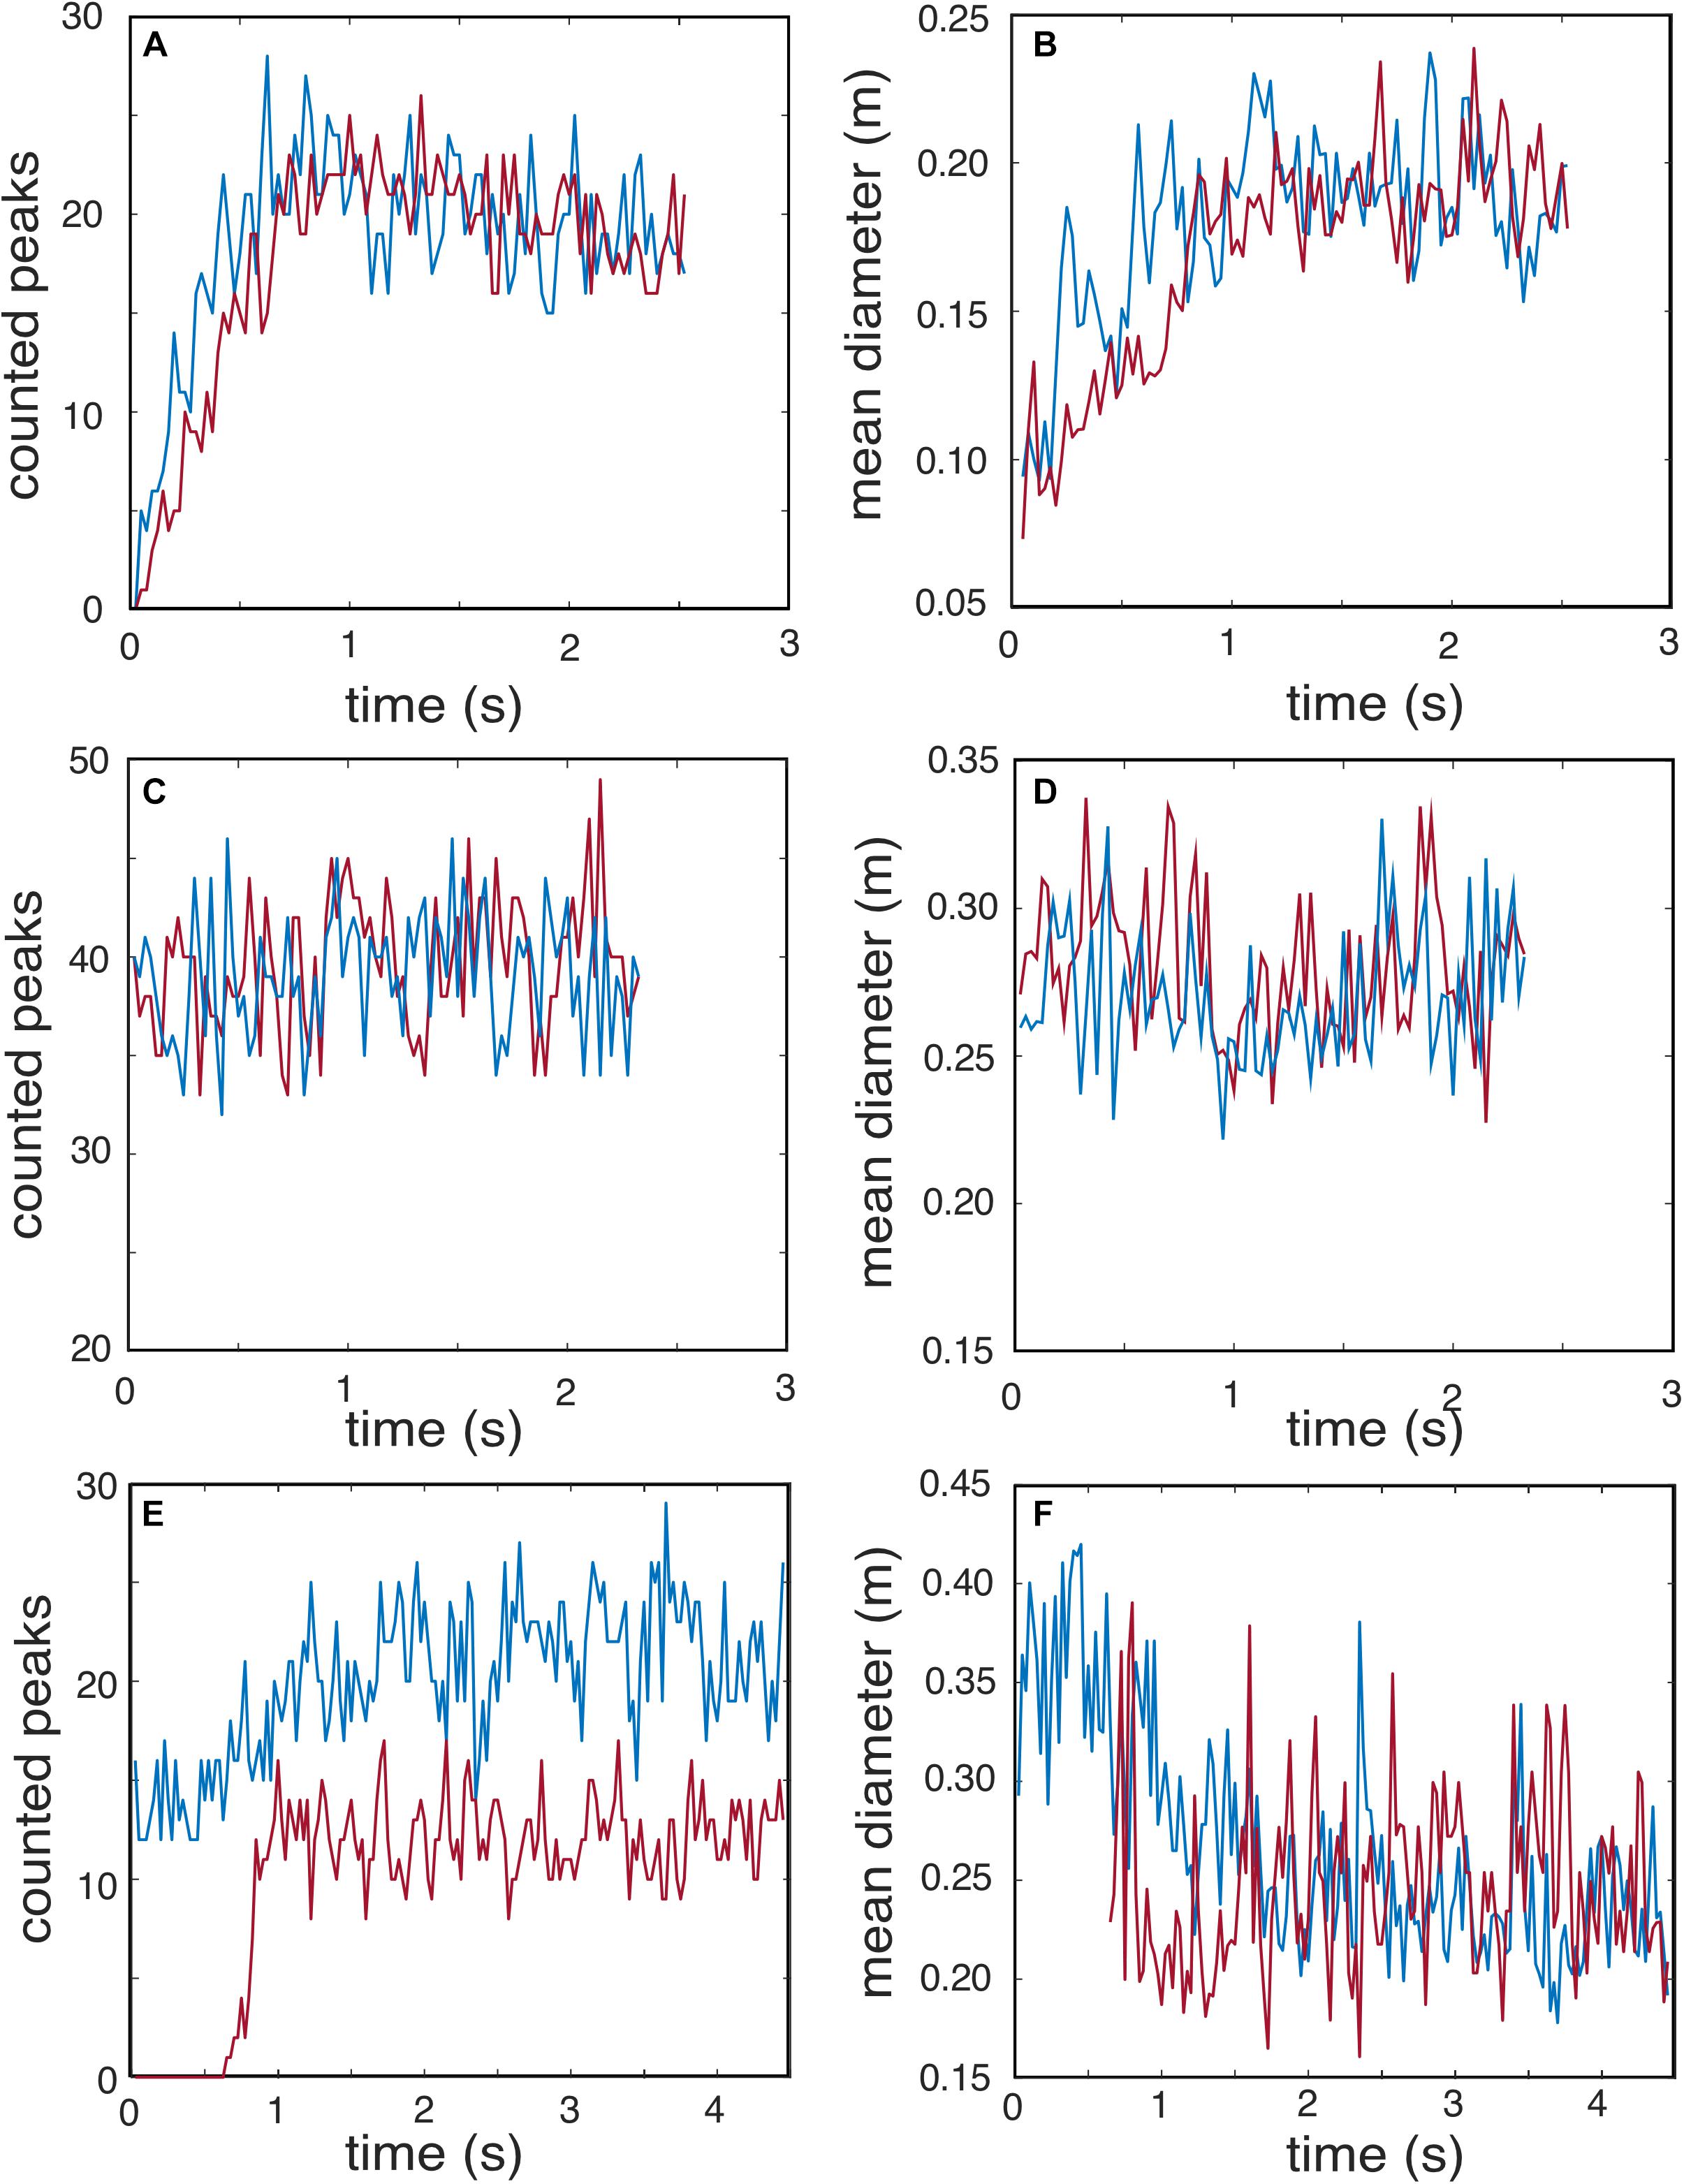
Figure 5. Counted peaks and mean diameters of two different profiles at different distances from the vent (A,B) explosion 2, (C,D) explosion 3, and (E,F) explosion 4. Blue line: lowest profile at about 1 m t above the vents, red line: highest profile, 20 pixels (about 1 m) above the first one. For explosion 4: the view is from the Roccette cliff, at the same distance from the vent; the two lines are set at an angle to compare different perspectives.
In parallel with the thermal anomaly profile analysis for PSD, the speed of randomly selected particles was measured through manual tracking. Finally, PSD data were processed to obtain (i) instantaneous median size, (ii) PSD of each eruptive phase, and (iii) PSD of the entire eruption.
Volumetric MDRs were derived from the instantaneous PSDs by assuming a spherical shape for the particles. MDR were then converted into MERs by assuming an average particle density of 1800 ± 200 kg/m3 as given by Bombrun et al. (2015).
In parallel with the thermal profile analysis, the speed of selected particles following a vertical trajectory was estimated by measuring the distance covered in consecutive images. Because of the small aperture of the ejection fountain (Figure 1), these data are representative of the velocity component parallel to the observation plane for the majority of the particles. The overall PSD and MDR computation and display requires just a few seconds on a standard desktop computer.
Finally, we have ensured that the technique employed in this analysis was calibrated for having the maximum possible accuracy of the quantified parameter. We suggest that a similar procedure should be done when setting the same procedure at any other volcano.
Results
Ejection Dynamics and Explosion Parameters
Our explosions typically consist of two main phases: an onset phase, marked by a rapid variation in both particle size and speed, and a stationary phase where particle parameters remain constant (Figure 3). This constancy is possibly overprinted by the occurrence of multiple, secondary pulses marked by increases of particle velocity (but not size), as already documented by Ripepe et al. (1993), Taddeucci et al. (2012), and Gaudin et al. (2014, 2017). The stationary phase dominates by time accounting more than 90% of the total event by duration, so that the onset phase is easily missed in automatically triggered recordings which can begin a few tenths of a second after emission begins. Thus, among the recorded explosions, we selected those cases where the onset was clearly recorded for further detailed analysis. A total number of five explosions were selected. Their duration ranged from 3 to 44 s and the particles analyzed per explosion ranged from 13,619 to 1790, for emission rates of 124–1589 particles per second (Table 1). These five videos all included bomb and lapilli dominated events from an open (non scoria-chocked) vent, thus lacking the ash component which would mask the hot bombs and lapilli causing underestimate of the erupted mass. We therefore detected more particles per eruption than Bombrun et al. (2015) because his dataset merges ash-rich and ash-poor events (e.g., Bombrun et al., 2015, Figure 2), Bombrun et al. (2014) also rely on particle tracking whereas not all particles can be tracked and thus counted. We therefore have a more accurate inventory of all lapilli and bombs emitted. The event duration ranged from 3 to 44 s and the total number of particles analyzed per explosion ranged from 13,619 to 1790, for emission rates of 124–1589 particles per second (Table 1). The number of particles per event is in good agreement with past measurements (c.f. Chouet et al., 1974; Ripepe et al., 1993; Harris et al., 2013; Gaudin et al., 2014; Bombrun et al., 2015).
We measured particle velocities ranging from 150 to less than 10 ± 2 m/s, with most particles exiting at speed less than 35 m/s, in accordance to previous observations (Hort et al., 2003; Bombrun et al., 2014). The type explosion consists of a 1–1.5 s long jet phase during which velocities undergo an exponential time decay (Figures 6, 7), followed by a 10–100 s long stationary phase that ends in a rapid (abrupt, 1–5 s long) termination.
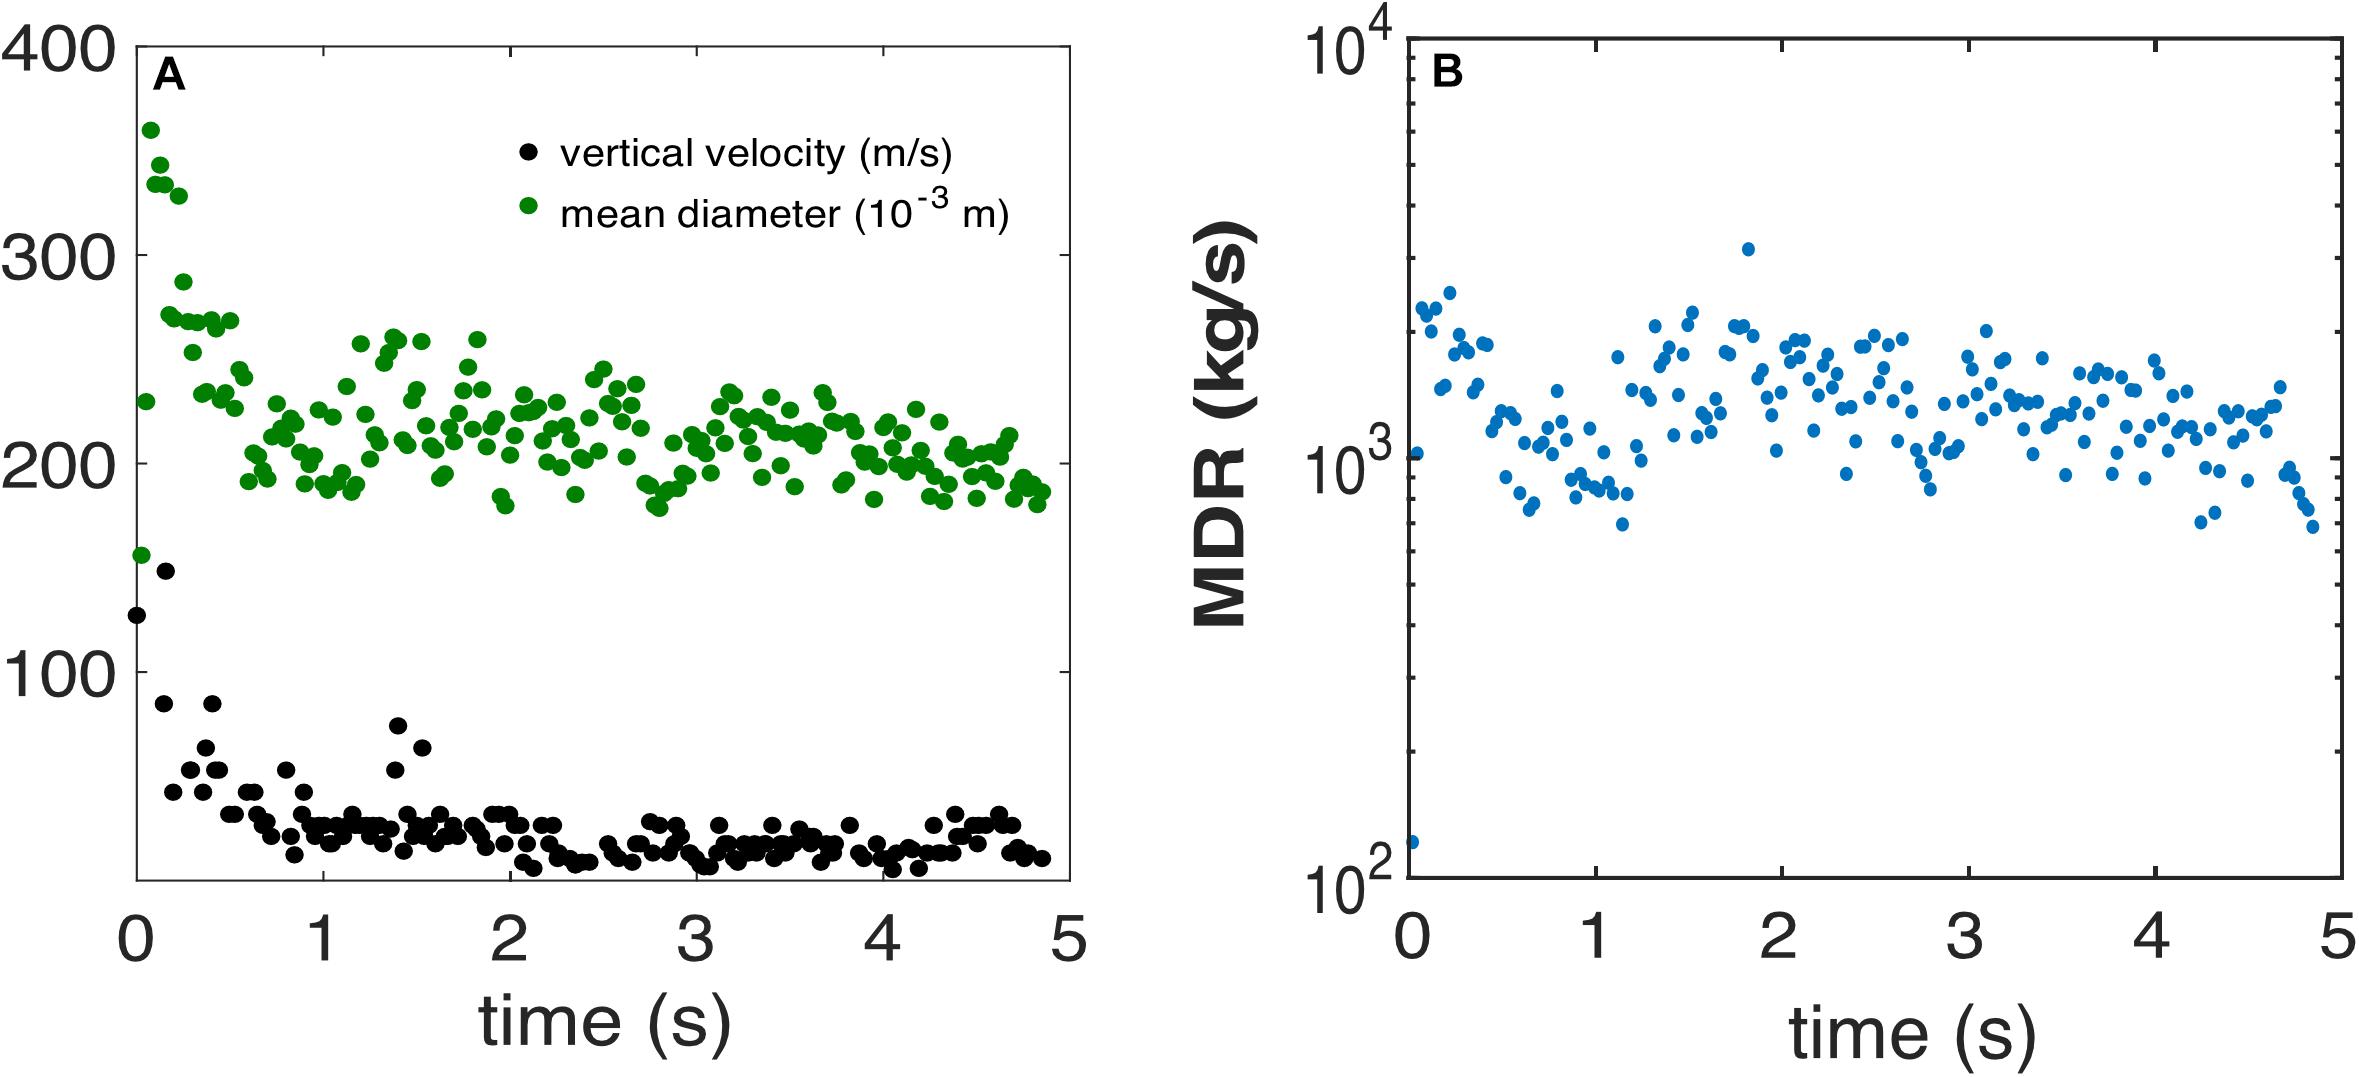
Figure 6. (A) Variation in time of mean diameter (green dots) and maximum measured vertical speed (black dots) measured during a Strombolian explosion. The units of each parameter are specified in the legend. (B) Variation of instantaneous magma discharge rate (MDR) with time. This is explosion 1 of Table 2 and Figure 1, and has a Type I onset.
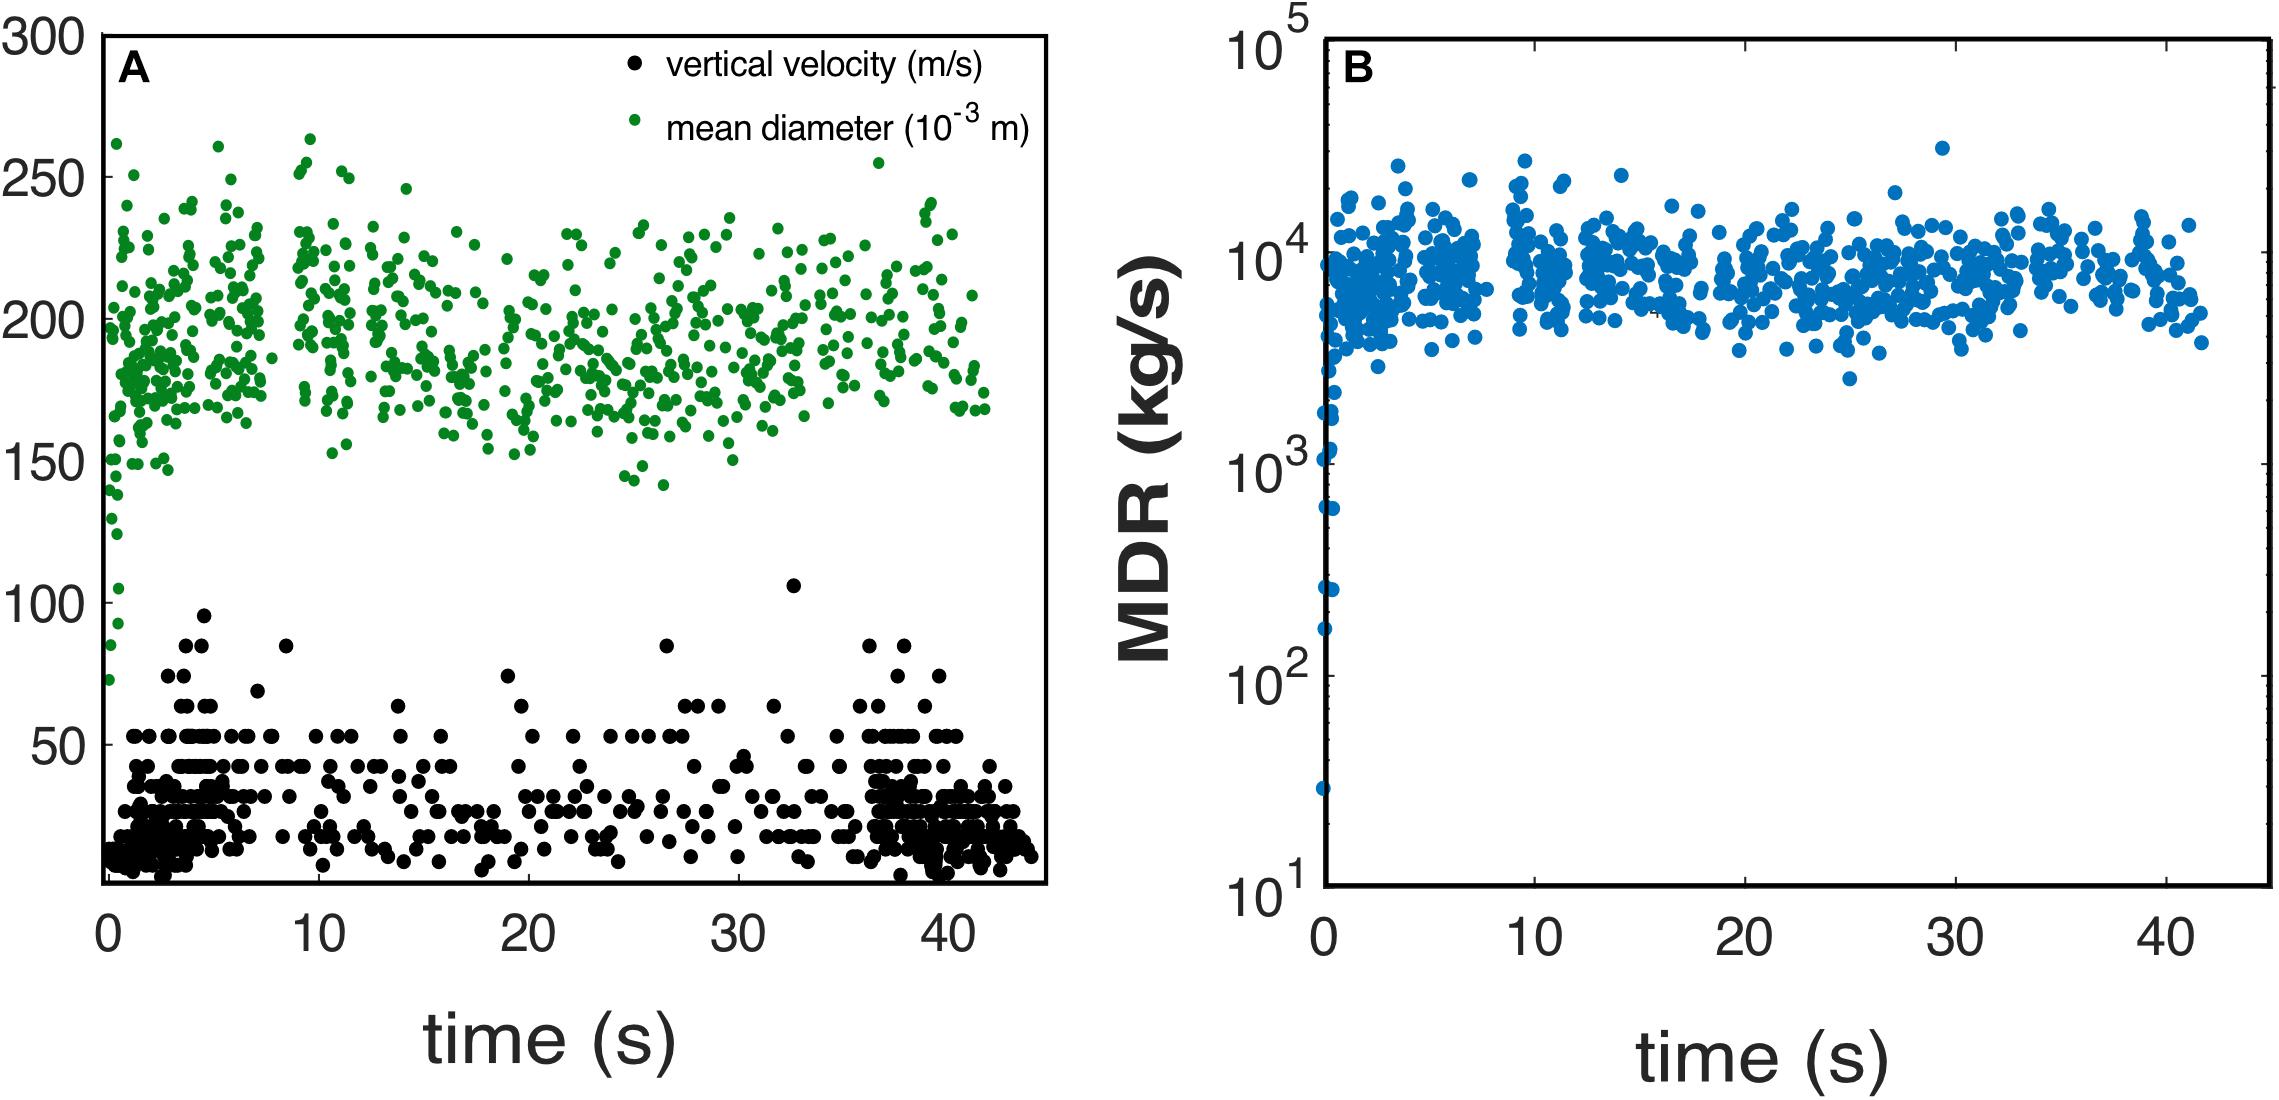
Figure 7. (A) Variation in time of mean diameter (green dots) and maximum measured vertical speed (black dots). The units of each parameter are specified in the legend. (B) Instantaneous magma discharge rate of explosion with type II onset. Explosion 5 of Table 2.
Two types of onset were identified: type I and type II. As observed by Harris et al. (2012), type I onsets involve a gas jet that has a high vertical velocity (above 150 m/s); as a result, peak velocities are recorded at the beginning of the eruption and are due to small particles being carried by the faster moving gas or pressure wave (Harris et al., 2012; Taddeucci et al., 2012; Gaudin et al., 2014). The gas jet is quickly (after a few tenths of a second) followed by the particles. The particles increase in number, but decrease in size and speed with time, until they reach a steady level, resulting in stable MDR throughout the event (Figure 6). That is, early in the event the magma is erupted as a small number of relatively large particles, and later in the event the same magma flux is erupted as a large number of relatively small particles. The temporal dominance of the stationary phase means that most of the mass is erupted during this part of the eruption. Minor gas pulses overprint the stationary phase, but do not result in any significant disturbance in the emission pattern.
Type II onsets are marked by a less energetic gas pulse followed by particle emission; the number of emitted particles increases in time and then stabilizes in the stationary phase. The initial gas jet is slower, and particle velocities in this phase are similar to those of the stationary phase (Figure 6).
Magma discharge rates calculated from the instantaneous PSDs are given in Figures 3B, 4B. Calculated rates range in between 4–36 m3/s or 7.4 × 10³–6.5 × 10⁴ kg/s (Table 1), comparing well with the literature ones (Ripepe et al., 1993; Harris et al., 2012; Gaudin et al., 2014). MDR is generally very stable in all the explosions, with the exception of type II onsets (Figures 6B, 7B) where it rapidly increases from the minimum recorded values to the average range.
Particle Size and Their Distribution
The distributions are all unimodal and skewed toward large particle diameters. The measured diameters range from 1 down to 0.05 m (the size of one pixel). The mean diameter is remarkably stable, and ranges from 15 to 21 cm (-7 phi) in all studied explosions. The PSDs (here given as fraction of number of particles) of the type I onset and stationary phase (given in Figures 8A,B) show different medians and skewnesses: the onset size distribution is coarser and more poorly sorted than that of the stationary phase. However, because the stationary phase dominates the eruption by time and mass, the total PSD of the explosion is dominated by the stationary phase population (Figure 8C). When the explosion is marked by a type II onset, the PSDs of the different phases do not vary significantly (Figure 9).
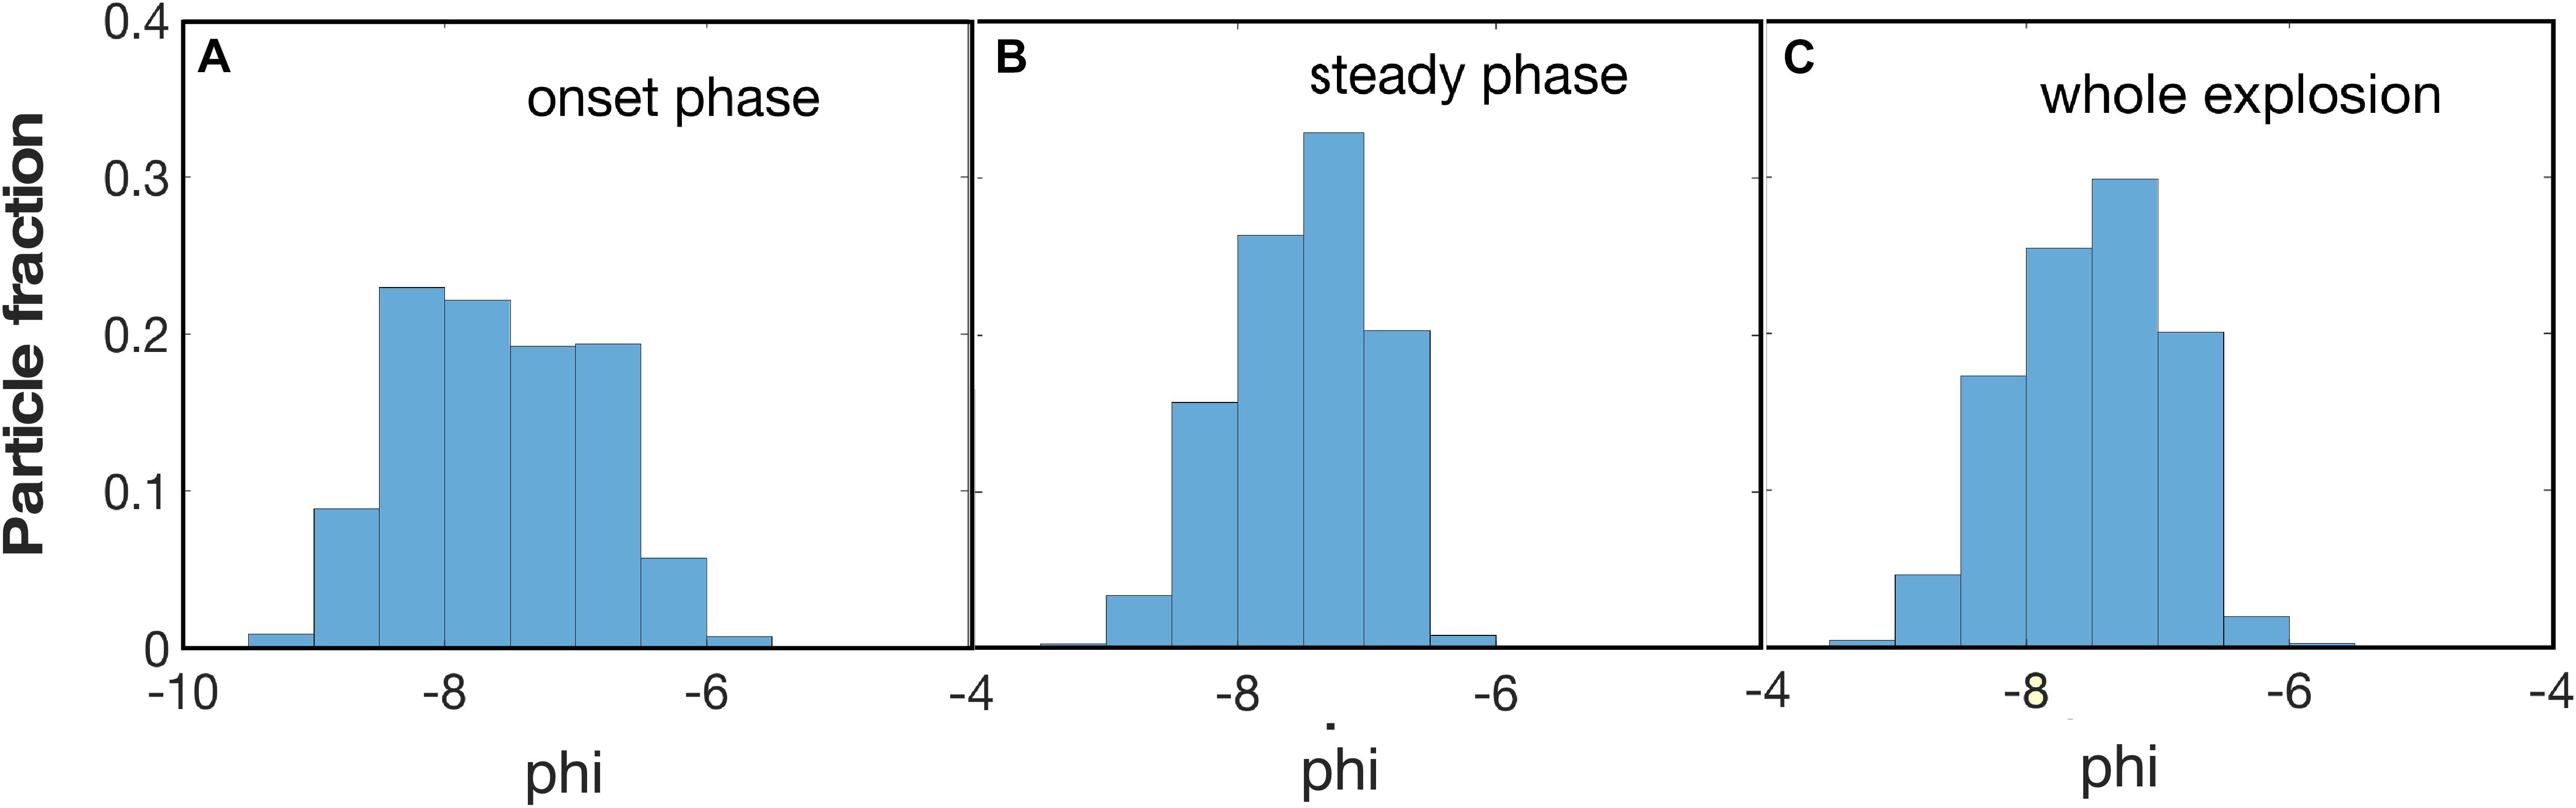
Figure 8. Particle size distribution (by number) for (A) the entire sequence of explosion 1 (Table 1), (B) its type I onset, and (C) steady phase.
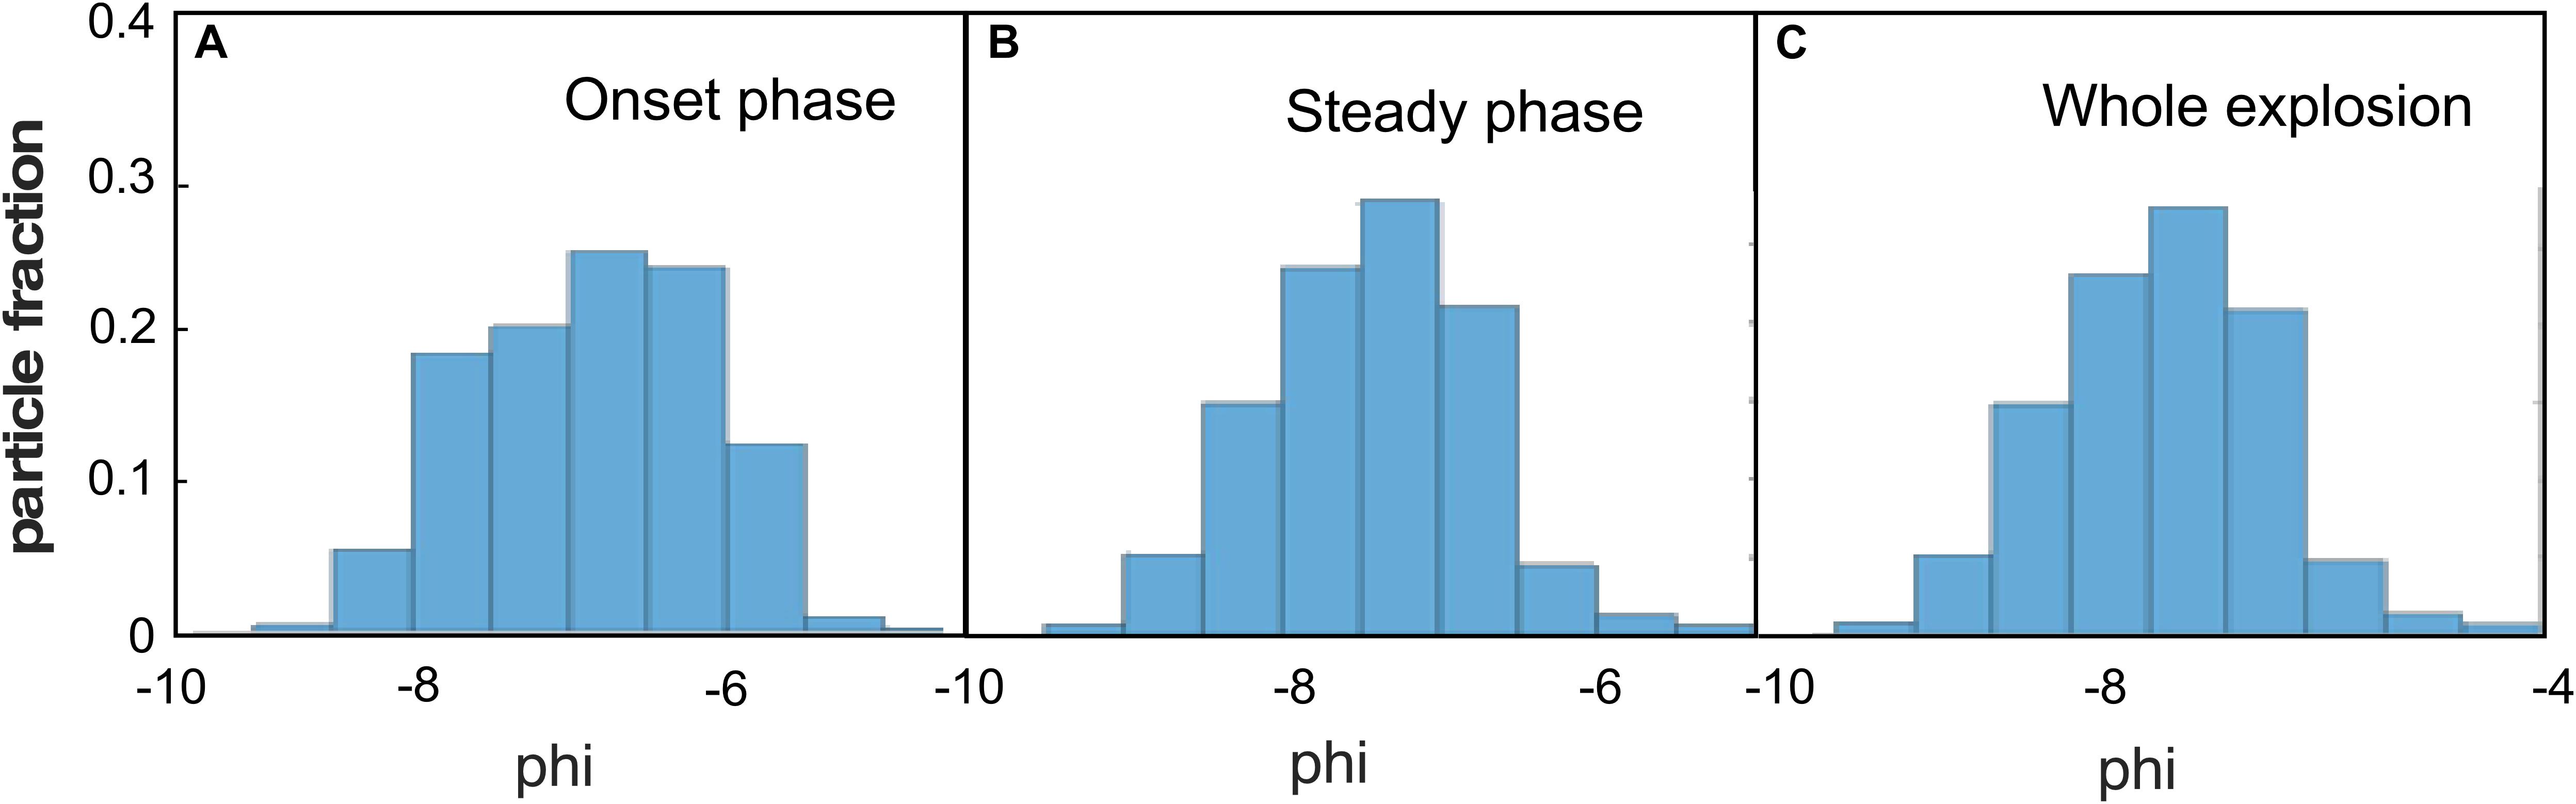
Figure 9. Particle size distribution (by number) for (A) the entire sequence of explosion 5 (Table 1), (B) its type II onset, and (C) steady phase.
Results compare well with those of the lapilli- and bomb-rich explosions analyzed in Bombrun et al. (2015), whose data were extracted using particle tracking on image stacks on the same explosions (Bombrun et al., 2014). However, Bombrun et al. (2015) and our dataset are not directly comparable: we measured uniformly in time, whereas Bombrun et al. (2014) privileged particles whose diameter and speed could be measured at the same time; they considered a number of particles representing on average 80% of the particles measured in this work (Table 2). Bombrun et al. (2015) method required processing times of several tens of minutes and becomes unwieldy once emission duration exceeds a few minutes and for high frequency sampling. Because of non-uniform sampling, the method also does not give PSD and MDR evolution with time.
Discussion
Our method allows us to measure and track instantaneous PSDs and MDRs, simultaneously, during a single, short explosive event. The analysis of peaks along a horizontal thermal profile above the vent allows the quantification of the instantaneous partitioning between number and mass of particles (i.e., fragmentation efficiency). This technique allows both real-time characterization of the explosion and quantification of key eruption properties at sub-second temporal scales. Results are in good agreement with data obtained using more time- and computationally-demanding techniques (Bombrun et al., 2015), validating this method as an effective means of monitoring small-scale explosions. In this regard, it is important to stress that our methodology detects more particles than Bombrun et al. (2015) which was focused on particle tracking and velocity (Bombrun et al., 2014); although absolute values obtained by the two methods differ, statistically the results are equivalent. In parallel, because of their high sampling frequency, and when compared by particle ejection speed data, our data provide new insights on the dynamics driving Strombolian activity, an issue that we discuss further here.
Explosion Dynamics
Our data demonstrate the remarkable stability of eruptive conditions between, and during, explosive events that characterize “normal” Strombolian activity (sensu Barberi et al., 1993), which is consistent with the low intensity and magnitude of this eruption style (Gurioli et al., 2013). All studied explosions start with a transient phase whose duration does not exceed 1.5 s, irrespective of the total duration of the event. All events then converge into steady-state conditions marked by very similar PSDs and MDRs. While emission rates are controlled mostly by conduit dynamics, PSDs are also primarily a function of magma properties (which control its rheology) and fragmentation dynamics (Kueppers et al., 2006; Villermaux, 2007).
In explosions with type I onsets, explosive evacuation of magma from the conduit during a single explosion proceeds at constant rate while the explosive dynamics are marked by a typical pattern including an initial, short transient phase of decreasing (kinetic) energy until the system stabilizes at equilibrium (stationary) conditions which dominate the emission. This pattern results from a linear emptying of the upper portion of the conduit (and thus deepening of the magma surface level). It also reflects the existence of steps in the vertical gradients in magma density and crystallinity in the conduit which directly affect fragmentation efficiency: the more degassed the magma, the less efficient the fragmentation and the larger the pyroclasts formed, in analogy with open-conduit vulcanian systems (Burgisser et al., 2010; Giachetti et al., 2010). Given the non-linearity of median size decrease with time in the onset phase, we suggest that vertical gradients in the conduit should be associated with the occurrence of a plug-like structure at the head of the magma column, as already suggested by textural observation of bomb sized fragments (Gurioli et al., 2014). Following Gurioli et al. (2014), the plug consists of a crystal-rich, poorly permeable, and likely slightly colder, magma which isolates the inner conduit from the atmosphere. Based on the parameters extracted from the thermal video, it is possible to estimate the volume of the magma plug. To do this, we take the data extracted for explosion 1, for which the onset phase lasts for 1.5 s and is marked by the emission of about 15 m3 of magma. For a conduit radii of 1–2 m, this volume implies a cap of about 1.2–5 m in depth. This may be a little higher if the magma average vesicularity is greater than that of the scoria. The conduit will be reamed out to the same depth during the initial explosive phase.
In contrast, explosions marked by a type II onsets show constant PSDs, but MDRs which rapidly increase in time in parallel with the number of emitted particles. This pattern still translates to a rapid increase in energy of the explosion followed by steady-state conditions, but suggests emission of a homogenous magma (i.e., the absence of a plug in the magma column) with increasing intensity. Because the conduit at Stromboli never empties, we can assume that the plug recovers between explosions with type I onsets, except when the explosion periodicity is too short to allow for its reconstitution (which is likely the case for explosions with type II onsets, even if no systematic data are available to compare repose times between explosions). Finally, the dynamics of the steady phase could be associated with the evacuation of a gas slug and its coda (Taddeucci et al., 2012; Gaudin et al., 2014; Pering et al., 2016) or to the rise of a gas-rich magma pocket which interacts with the magma residing in the conduit (Suckale et al., 2010); this last hypothesis is also confirmed by fluid dynamic experimental observations (Pioli et al., 2012; Azzopardi et al., 2014).
By plotting particle size and velocity measurements for the same explosions, Bombrun et al. (2015) showed that particles cluster into a region whose upper limit is roughly defined by a curve that has the form of the Steinberg and Babenko (1978) “gas-particle velocity” relation, which relates the particle size to its velocity based on the drag exerted by the gas. As suggested by Harris et al. (2012), this relation is controlled by variability in not just particle size but also gas density.
Insights on Fragmentation Dynamics
High temporal resolution PSD data coupled with eruption source parameters provide essential information for the understanding and quantification of magma fragmentation and rise dynamics in Strombolian regimes. Following Villermaux (2007) and Namiki and Manga (2008), we expect fragmentation in mafic magmas, such as the Stromboli basalt, to be driven by jet instability. In such a case, the onset, dynamics, and geometry of the instabilities will be controlled by the balance between surface tension, inertial, and shearing forces exerted by the gas stream (Lefebvre and McDonnel, 2017). Consequently, fragmentation regimes can be defined based on two dimensionless parameters: the aerodynamic (shear) Weber number (Weg) and the liquid Reynolds number (Rel) (Lasheras et al., 1998; Lasheras and Hopfinger, 2000). Rel is defined as:
and Weg is defined as:
Here ul and ug are the liquid (microvesicular magma) and gas velocities, respectively, D is the diameter of the liquid jet, Dp is the mean particle diameter, ρl and ρg are the liquid and gas densities, respectively, η is the liquid viscosity, and σ is its surface tension. Weg thus depends on gas stream speed, density and the median particle diameter, magma surface tension, and Rel depends on magma density, viscosity, the diameter of the jet, and its velocity. As already stated, gas and magma physical, dynamic, and rheological properties are linked and will change in time and between cases, so the parameters need to be calculated with as much constraint as possible. Due to the variations we see, no single representative numbers can be assigned to a single explosion, however short it is. Given the data that we have, we can at least attempt an order of magnitude constrain on the parameters, on timescales of 0.05 s.
To calculate gas density, we assume that gas temperature at the vent ranges between 600 and 950°C (Harris and Ripepe, 2007). Gas speed is then calculated based on particle velocity following Steinberg and Babenko (1978) and Ripepe et al. (1993). Our results suggest that Weg ranges from 103 to 104 on the analyzed explosions. Calculating Rel requires knowledge of the ascent speed of the magma before fragmentation. This cannot be directly retrieved from our data; but it can be estimated from MDR values (Figures 6B, 7B). By assuming a conduit diameter of 1–5 m, and that the gas slug/foam layer occupies about 50% of the conduit cross section (Azzopardi et al., 2014; Hasan et al. unpublished), we retrieve magma ascent velocities of between 0.1 and 10 m/s, corresponding to Rel ranging from 10 to 1000. These values are too low for efficient fragmentation (i.e., direct “atomization” of magma into ash-sized fragments), but allow for formation of droplets of mean sizes directly proportional to the wavelength of the instabilities forming at the interface between magma and gas.
By plotting the results in the experimental regime pattern map developed by Lasheras and Hopfinger (2000), a scheme that describes the breakup of liquid jets within a coaxial gas stream (Figure 10), we can place our data as a cluster that crosses the fiber type- and the shear breakup regimes, with a few points falling in the Rayleigh breakup regime. In the Rayleigh regime, fragmentation is controlled by surface tension alone and the effect of the gas stream is minor. In the shear breakup and fiber-type regimes, magma fragments out of the tips of fine protrusions (ligaments) projecting into the gas stream. In the shear breakup regime, the fragments are equidimensional, whereas in the fiber-type regime, they have elongated shapes (Hopfinger, 1998). Within these regimes, shearing forces dominate over surface tension forces and the instability length scale is primarily controlled by the gas speed (and thus Weg; Villermaux, 1998). Consequently, we should expect finer grain sizes associated with higher gas speeds (and larger Weg). This is consistent with differences between gas jet (type 0) eruptions and particle laden emissions (type 1 and 2) at Stromboli (cf. Patrick et al., 2007; Leduc et al., 2015). Here, high-velocity gas jets tend to carry a small number of small particles, whereas bomb-loaded emissions tend to have lower velocities and carry a larger number of larger particles. This effect has also been observed at the onset of eruptions at Stromboli, where the initial gas jet carries only small particles at high velocities, and is followed by a lower velocity emission of larger particles (Harris et al., 2012). This is also consistent with observation of gas jets associated with gas pistoning at Pu’u ’O’o (Johnson et al., 2005; Patrick et al., 2007; Marchetti and Harris, 2008), as well as of bubble bursting at Erebus (Calkins et al., 2008), Yasur (Gaudin et al., 2014), and Villarrica (Gurioli et al., 2008).
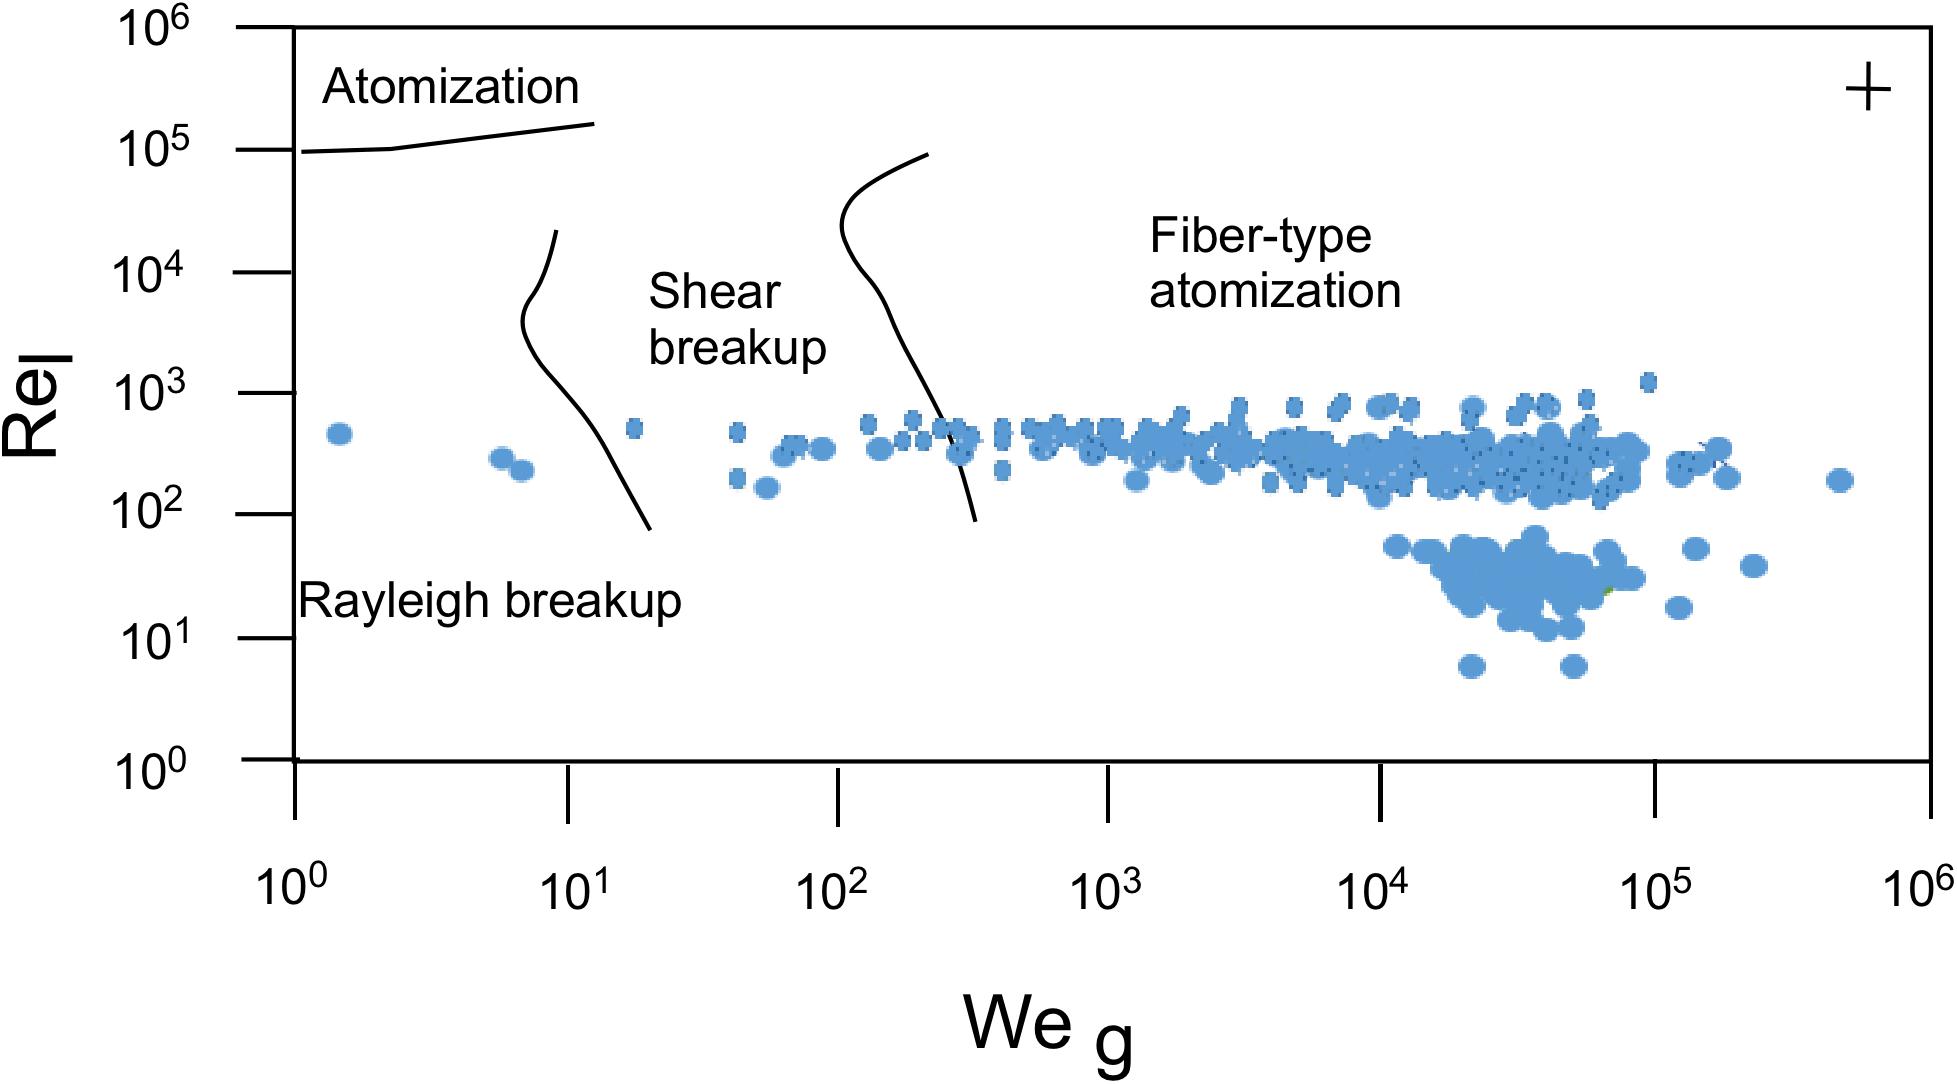
Figure 10. Fragmentation regimes for the explosions 1, 2, 3, and 5. Weg is the aerodynamic Weber number and Rel is the liquid Reynolds number. Solved assuming a conduit diameter of 1 m, for a gas density of 1.12 kg/m3, for a bubbly magma density of 1800 kg/m3, and magma viscosity of 300 Pa s. Each point is representative of an analyzed time frame/thermal line. The stability fields are taken from Lasheras and Hopfinger (2000). The cross on the top right represents the average relative error on each point, calculated after the variability of gas speed measured in each time frame, and the range of magma MDR measured based on both thermal lines studied in each explosion.
Conclusion
High-frequency and spatial resolution measurements of PSD in small explosions can be made in real time by analyzing thermal profiles above the vent in thermal video. A simple and straightforward, low processing power, fast algorithm provides crucial information on key source parameters of small-scale Strombolian explosions at a temporal resolution of the order of 0.01 s. These instantaneous MDR and PSDs give key information at unprecedented temporal scales allowing not only real time monitoring but also detailed quantification of the explosion dynamics. Each of the Stromboli explosions studied is marked by an onset, transient phase with a maximum duration of 1.5 s, dominated volumetrically by gas emission as suggested by the gas jet visible in the thermal images, during which the uppermost part of the magma column is evacuated, and a steady phase of variable duration dominated by particle emission, when most of the erupted mass is emitted.
The results of this study and the method proposed have also a high application potential for the quantification of the hazard associated to Strombolian activity. For Strombolian explosions, the largest pyroclast sizes and largest exit velocities will be associated with onsets of type I. For this case, the impact and travel distance of ballistic blocks are largest, and hence so too is hazard. Real-time data collection is ideally suited for the setup of thresholds and automatic alarm systems allowing substantial risk reduction. If systematically applied to a range of explosions, this algorithm could provide fundamental data shedding light to the dynamics of Strombolian activity. When coupled with real-time particle speed measurements (such as a vertically stack series of radiometers as suggested by Sahetapy-Engel et al., 2008), instantaneous PSDs can also be used to constrain fragmentation processes and their variation over sub-second timescales, as well as tracking gas and particle emission dynamics whose constraint requires knowledge of all possible physical variables.
The method proposed in this study has application to small-scale, transient Strombolian explosions, characterized by very short (a few to tens of seconds) durations, low intensities, and production of relatively large pyroclast fragments. By increasing the spatial resolution, it could also be applied for identification or tracking to small lapilli and coarse ash fragments. In the case of jets marked by high particle densities, its accuracy would be limited only to the layers of particles closest to the observation point (i.e., at the perimeter/outside edge of the plume). Because of its limited computational requirement, it could easily be implemented in monitoring activities aimed at modeling and forecasting particle dispersal and volcanic plume dynamics even when limited resources are available for monitoring activities.
To conclude, this simple algorithm, coupled with fast assessment of particle exit velocity data, could provide an unprecedented dataset for both monitoring the explosive activity and constraining the magma fragmentation dynamics. This dataset could constitute the basis for the development of a dynamic model linking PSDs, magma fragmentation and eruptive regimes, a step forward not only for understanding explosions mechanisms but also for real time assessment of volcanic explosions and their impact.
Author Contributions
LP performed calculations and data processing. AH filmed the explosions and collaborated with data processing and refinement of the methodologies. Both authors were involved in the preparation of this article.
Funding
This work was supported by Fond National Suisse project 200021_162439 to LP. This is ClerVolc contribution no. 340.
Conflict of Interest Statement
The authors declare that the research was conducted in the absence of any commercial or financial relationships that could be construed as a potential conflict of interest.
The reviewer FD declared a shared affiliation, with no collaboration, with one of the authors, AH, to the handling Editor at the time of review.
Acknowledgments
Thanks to M. Bombrun for sharing results from his paper, where data collection was financed by the French Government Laboratory of Excellence initiative n°114 ANR-10-LABX-0006 and the Région Auvergne through the Chaire d’Excellence to AH. We are grateful to three reviewers for the constructive and detailed comments.
Footnotes
References
Azzopardi, B. J., Pioli, L., and Abdulkareem, L. A. (2014). The properties of large bubbles rising in very viscous liquids in vertical columns. Int J. Multiph. Flow 67, 160–173. doi: 10.1016/j.ijmultiphaseflow.2014.08.013
Barberi, F., Rosi, M., and Sodi, A. (1993). Volcanic hazard assessment at Stromboli based on review of historical data. Acta Volcanol. 34, 173–187.
Bombrun, M., Barra, V., and Harris, A. (2014). Algorithm for particle detection and parameterization in high-frame-rate thermal video. J. Appl. Remote Sens. 8:83549. doi: 10.1117/1.JRS.8.083549
Bombrun, M., Harris, A., Gurioli, L., Battaglia, J., and Barra, V. (2015). Anatomy of a Strombolian eruption: inferences from particle data recorded with thermal video. J. Geophys. Res. 120, 2367–2387. doi: 10.1002/(ISSN)2169-9356
Bonadonna, C. (2014). Future development and new directions in modeling and monitoring volcanic ash clouds. EOS 95:64. doi: 10.1002/2014EO070005
Brenot, H., Theys, N., Clarisse, L., van Geffen, J., van Gent, J., Van Roozendael, M., et al. (2014). Support to Aviation Control Service (SACS): an online service for near real-time satellite monitoring of volcanic plumes. Nat. Hazards Earth Syst. Sci. 14, 1099–1123. doi: 10.51594/nhess-14-1099-2014
Burgisser, A., Poussineau, S., Arbaret, L., Druitt, T. H., Giachetti, T., and Bourdier, J.-L. (2010). Pre-explosive conduit conditions of the 1997 Vulcanian explosions at Soufrière Hills Volcano, Montserrat: I. Pressure and vesicularity distributions. J. Volcanol. Geotherm. Res. 194, 27–41. doi: 10.1016/j.jvolgeores.2010.04.008
Calkins, J., Oppenheimer, C., and Kyle, P. R. (2008). Ground-based thermal imaging of lava lakes at Erebus volcano, Antarctica. J. Volcanol. Geotherm. Res. 177, 695–704. doi: 10.1016/j.jvolgeores.2008.02.002
Calvari, S., Inguaggiato, S., Puglisi, G., Ripepe, M., and Rosi, M. (2008). The Stromboli Volcano: An Integrated Study of the 2002-2003 Eruption. Washington, D.C: American Geophysical Union. doi: 10.1029/GM182
Cerminara, M., Esposti Ongaro, T., Valade, S., and Harris, A. J. L. (2015). Volcanic plume vent conditions retrieved from infrared images: a forward and inverse modeling approach. J. Volcanol. Geotherm. Res. 300, 129–147. doi: 10.1016/j/jvolgeores.2014.12.015
Chevalier, L., and Donnadieu, F. (2015). Considerations on ejection velocity estimations from infrared radiometer data: a case study at Stromboli volcano. J. Volcanol. Geotherm. Res. 302, 130–140. doi: 10.1016/j.jvolgeores.2015.06.022
Chouet, B., Hamisevicz, N., and Mc Getchin, T. R. (1974). Photoballistics of volcanic jet activity at Stromboli, Italy. J. Geophys. Res. 79, 4961–4976. doi: 10.1029/JB079i032p04961
Colò, L. (2012). Study of Vesiculation in Basalt Magma Through Volcanological, Textural and Geophysical Analyses: The Case Study of Stomboli. Ph.D. dissertation, Dep. of Earth Sci., Univ. Firenze, Florence, Italy.
Costa, A., Macedonio, G., and Folch, A. (2006). A three-dimensional Eulerian model for transport and deposition of volcanic ashes. Earth Planet. Sci. Lett. 241, 634–647. doi: 10.1016/j.epsl.2005.11.019
Costa, A., Pioli, L., and Bonadonna, C. (2016). Assessing tephra total-grainsize distribution: insight from field data analysis. Earth Planet. Sci Lett. 443, 90–107. doi: 10.1016/jepsl.2016.02.040
Dingwell, D. B. (1996). Volcanic dilemma: flow or blow? Science 273:1054. doi: 10.1126/science.273.5278.1054
Gaudin, D., Taddeucci, J., Scarlato, P., del Bello, E., Ricci, T., Orr, T., et al. (2017). Integrating puffing and explosions in a general scheme for Strombolian-style activity. J. Geophys. Res. 291, 1860–1875. doi: 10.1002/2016JB013707
Gaudin, D., Taddeucci, J., Scarlato, P., Moroni, M., Freda, C., Gaeta, M., et al. (2014). Pyroclast tracking velocimetry illuminates bomb ejection and explosion dynamics at Stromboli (Italy) and Yasur (Vanuatu) volcanoes. J. Geophys. Res. 119, 5384–5397. doi: 10.1002/2014JB011096
Giachetti, T., Druitt, T., Burgisser, A., Arbaret, L., and Galven, C. (2010). Bubble nucleation, growth and coalescence during the 1997 Vulcanian explosions of Soufrière Hills Volcano, Montserrat. J. Volcanol. Geotherm. Res. 193, 215–231. doi: 10.1016/j.jvolgeores.2010.04.001
Gonnermann, H. M. (2015). Magma Fragmentation. Ann. Rev. Earth Planet. Sci. 43, 431–458. doi: 10.1146/annurev-earth-060614-105206
Gouhier, M., and Donnadieu, F. (2008). Mass estimations of ejecta from Strombolian explosions by inversion of Doppler radar measurements. J. Geophys. Res. 113:B10. doi: 10.1029/2007JB005383
Gurioli, L., Colo, L., Bollasina, A. J., Harris, A. J. L., Whittington, A., and Ripepe, M. (2014). Dynamics of Strombolian explosions: inferences from field and laboratory studies of erupted bombs from Stromboli volcano. J. Geophys. Res. 119, 319–345. doi: 10.1002/2013JB010355
Gurioli, L., Harris, A. J. L., Colò, L., Bernard, J., Favalli, M. M., Ripepe, M., et al. (2013). Classification, landing distribution, and associated flight parameters for a bomb field emplaced during a single major explosion at Stromboli, Italy. Geology 41, 559–562. doi: 10.1130/G33967.1
Gurioli, L., Harris, A. J. L., Houghton, B. F., Polacci, M., and Ripepe, M. (2008). Textural and geophysical characterization of explosive basaltic activity at Villarrica volcano. J. Geophys. Res. 113:16. doi: 10.1029/2007JB005328
Harris, A. J. L., Delle Donne, D., Dehn, J., Ripepe, M., and Worden, A. K. (2013). Volcanic plume and bomb field masses from thermal infrared camera imagery. Earth Planet. Sci. Lett. 365, 77–85. doi: 10.1016/j.epsl.2013.01.004
Harris, A. J. L., and Ripepe, M. (2007). Temperature and dynamics of degassing at Stromboli. J. Geophys. Res. 112:B3. doi: 10.1029/2006JB004393
Harris, A. J. L., Ripepe, M., and Hughes, E. A. (2012). Detailed analysis of particle launch velocities, size distributions and gas densities during normal explosions at Stromboli. J. Volcanol. Geoth. Res. 23, 109–131. doi: 10.1016/j.jvolgeores.2012.02.012
Hopfinger, E. J. (1998). “Liquid jet instability and atomization in a coaxial gas stream,” in Advances in Turbulence VII. Fluid Mechanics and Its Applications, 46, ed. U. Frisch (Dordrecht: Springer), 69–78. doi: 10.1007/978-94-011-5118-4_17
Hort, M., Seyfried, R., and Voge, M. (2003). Radar doppler velocimetry of volcanic eruptions: theoretical considerations and quantitative documentation of changes in eruptive behaviour at Stromboli volcano, Italy. Geophys. J. Int. 154:18. doi: 10.1046/j.1365-246X.2003.01982.x
Hurst, A. W., and Turner, R. (1999). Performance of the program ASHFALL for forecasting ashfall during the 1995 and 1996 eruptions of Ruapehu volcano. New Zealand J. Geol. and Geophys. 42:615–622. doi: 10.1080/00288306.1999.9514865
Ji, K. H., Yun, S. H., and Rim, H. (2017). Episodic inflation events at Akytan Volcano, Alaska, during 2005-2017. Geophys. Res. Lett. 44, 8268–8275. doi: 10.1002/2017GL074626
Johnson, J. B., Harris A. J. L., and Hoblitt, R. (2005). Thermal observations of gas pistoning at Kilauea Volcano. J. Geophys. Res. 110:B11201. doi: 10.1029/2005JB003944
Kaminski, E., and Jaupart, C. (1998). The size distribution of pyroclasts and the fragmentation sequence in explosive volcanic eruptions. J. Geophys. Res. 103, 29759–29779. doi: 10.1029/98JB02795
Kueppers, U., Scheu, B. and Spieler, O. (2006). Fragmentation efficiency of explosive volcanic eruptions: a study of experimentally generated pyroclasts. J. Volcanol. Geoth. Res. 153, 125–135. doi: 10.1016/j.jvolgeores.2005.08.006
Lasheras, J. C., and Hopfinger, E. J. (2000). Liquid Jet Instability and Atomization in a Coaxial Gas Stream. Ann. Rev. Fluid Mech. 32, 275–308. doi: 10.1146/annurev.fluid.32.1.275
Lasheras, J. C., Villermaux, E., and Hopfinger, E. J. (1998). Break-up and atomization of a round water jet by a high-speed annular air jet. J. Fluid Mech. 357, 351–379. doi: 10.1017/S0022112097008070
Leduc, L., Gurioli, L., Harris, A., Colò, L., and Rose-Koga, E. F. (2015). Types and mechanisms of strombolian explosions: characterization of a gas-dominated explosion at Stromboli. Bull. Volcanol. 77:8. doi: 10.1007/s00445-014-0888-5
Lefebvre, A. H., and McDonnel, V. G. (2017). Atomization and Sprays. Boca Raton, FL: CRC Press, 284. doi: 10.1201/9781315120911
Lucchi, F., Peccerillo, A., Keller, J., Tranne, C. A., and Rossi, P. L. (2013). The Aeolian islands volcanoes. Geol. Soc. Lond. Mem. 37:520.
Marchetti, E., and Harris, A. J. L. (2008). Trends in activity at Pu’u ‘O’o during 2001-2003: insights from the continuous thermal record. Geol. Soc. Lond. Spec. Publ. 307, 85–101. doi: 10.1144/SP307.6
Mastin, L. G., Guffanti, M., Servranckx, R., Webley, P., Barsotti, S., Dean, K., et al. (2009). A multidisciplinary effort to assign realistic source parameters to models of volcanic ash-cloud transport and dispersion during eruptions. J. Volcanol. Geotherm. Res. 186, 10–21. doi: 10.1016/j.jvolgeores.2009.01.008
Namiki, A., and Manga, M. (2008). Transition between fragmentation and permeable outgassing of low viscosity magmas. J. Volcanol. Geotherm. Res. 169, 48–60. doi: 10.1016/j.jvolgeores.2007.07.020
Papale, P. (1999). Strain-induced magma fragmentation in explosive eruptions. Nature 397, 425–428. doi: 10.1038/17109
Patrick, M. R., Harris, A. J. L., Ripepe, M., Dehn, J., Rothery, D. A., and Calvari, S. (2007). Strombolian explosive styles and source conditions: insights from thermal (FLIR) video. Bull. Volcanol. 69, 769–784. doi: 10.1007/s00445-006-0107-0
Pering, T. D., Mcgonigle, A. J. S., James, M. R., Tamburello, G., Aiuppa, A., Donne, D. D., et al. (2016). Conduit dynamics and post explosion degassing on Stromboli: a combined UV camera and numerical modeling treatment. Geophys. Res. Lett. 43, 5009–5016. doi: 10.1002/(ISSN)1944-8007
Pioli, L., Bonadonna, C., Azzopardi, B. J., Phillips, J. C., and Ripepe, M. (2012). Experimental constraints on the outgassing dynamics of basaltic magmas. J. Geophys. Res. 117:B03204. doi: 10.1029/2011JB008392
Prata, A., and Bernardo, C. (2009). Retrieval of volcanic ash particle size, mass and optical depth from a ground-based thermal infrared camera J. Volcanol. Geotherm. Res. 186, 91–107. doi: 10.1016/j.volgeores.2009.02.007
Ripepe, M., Delle Donne, D., Harris, A., Marchetti, E., and Ulivieri, G. (2008). Dynamics of Strombolian Activity. In: The Stromboli Volcano: An Integrated Study of the 2002-2003 Eruption. Washington, DC: American Geophysical Union. doi: 10.1029/182GM05
Ripepe, M., Rossi, M., and Saccorotti, G. (1993). Image processing of explosive activity at Stromboli. J. Volcanol. Geotherm. Res. 54, 335–351. doi: 10.1016/0377-0273(93)90071-X
Rust, A. C., and Cashman, K. V. (2011). Permeability controls on expansion and size distributions of pyroclasts. J. Geophys. Res. 116, 1–17. doi: 10.1029/2011JB008494
Sahetapy-Engel, S. T., Harris, A., and Marchetti, E. (2008). Thermal, seismic and infrasound observations of persistent explosive activity and conduit dynamics at Santiaguito lava dome. Guatemala. J. Volcanol. Geotherm. Res. 173, 1–14. doi: 10.1016/j.jvolgeores.2007.11.026
Sawyer, G. M., and Burton, M. R. (2006). Effects of a volcanic plume on thermal imaging data. Geophys. Res. Lett. 33:L14311. doi: 10.1029/2005GL025320
Scarpa, R., and Tilling, R. I. (1996). Monitoring and Mitigation of Volcanic Hazards. Berlin: Springer, 838. doi: 10.1007/978-3-642-80087-0
Scollo, S., Prestifilippo, M., Spata, G., D’Agostino, M., and Coltelli, M. (2009). Monitoring and forecasting Etna volcanic plumes. Nat. Haz. Earth Syst. Sci. 9, 1573–1585. doi: 10.5194/nhess-9-1573-2009
Spanu, A., Vitturi, M. M., and Barsotti, S. (2016). Reconstructing eruptive source parameters from tephra deposit: a numerical study of medium-sized explosive eruptions at Etna volcano. Bull. Volcanol. 78:59. doi: 10.1007/s00445-016-1051-2
Sparks, R. J. S., Biggs, J., and Neuberg, J. W. (2012). Monitoring volcanoes. Science 335, 1310–1311. doi: 10.1126/science.1219485
Steinberg, G. S., and Babenko, J. L. (1978). Gas velocity and density determination by filming gas discharges. J. Volcanol. Geotherm. Res. 3, 89–98. doi: 10.1016/0377-0273(78)90005-7
Suckale, J., Hager, B. H., Elkins-Tanton, L. T., and Nave, J.-C. (2010). It takes three to tango: 2. Bubble dynamics in basaltic volcanoes and ramifications for modeling normal Strombolian activity. J. Geophys. Res. 115, 1–21. doi: 10.1029/2009JB006917
Taddeucci, J., Scarlato, P., Capponi, A., Del Bello, E., Cimarelli, C., Palladino, D. M., et al. (2012). High-speed imaging of Strombolian explosions: the ejection velocity of pyroclasts. Geophys. Res. Lett. 39:L02301. doi: 10.1029/2011GL050404
Villermaux, E. (1998). Mixing and spray formation in coaxial jets. J. Prop. Power. 14, 807–817. doi: 10.2514/2.5344
Villermaux, E. (2007). Fragmentation. Ann. Rev. Fluid Mech. 39, 419–446. doi: 10.1146/annurev.fluid.39.050905.110214
Vulpiani, G., Ripepe, M., and Valade, S. (2016). Mass discharge rate retrieval combining weather radar and thermal camera observations. J. Geophys. Res. 121, 5679–5695. doi: 10.1002/2016JB013191
Keywords: Strombolian explosion, magma fragmentation, volcanic hazard, mass discharge rate, thermal infrared
Citation: Pioli L and Harris AJL (2019) Real-Time Geophysical Monitoring of Particle Size Distribution During Volcanic Explosions at Stromboli Volcano (Italy). Front. Earth Sci. 7:52. doi: 10.3389/feart.2019.00052
Received: 19 September 2018; Accepted: 05 March 2019;
Published: 26 March 2019.
Edited by:
Antonio Costa, National Institute of Geophysics and Volcanology (Bologna), ItalyReviewed by:
Jacopo Taddeucci, INGV, ItalyMatteo Cerminara, National Institute of Geophysics and Volcanology (INGV), Italy
Franck Donnadieu, Université Clermont Auvergne, France
Copyright © 2019 Pioli and Harris. This is an open-access article distributed under the terms of the Creative Commons Attribution License (CC BY). The use, distribution or reproduction in other forums is permitted, provided the original author(s) and the copyright owner(s) are credited and that the original publication in this journal is cited, in accordance with accepted academic practice. No use, distribution or reproduction is permitted which does not comply with these terms.
*Correspondence: Laura Pioli, laura.pioli@unica.it