Abstract
In the Himalayan region, aerosols received much attention because they affect the regional as well as local climate. Aerosol Optical Depth (AOD) observation from satellite are limited in the Himalayan region mainly due to high surface reflectance. To overcome this limitation, we have conducted a multivariate regression analysis to predict the AOD over the cryospheric portion of Nepalese Himalaya. Prediction using three meteorological variables from ERA-Interim: relative humidity, wind velocity components (U10 and V10) were taken into account for model development as independent variables, while the longest time series AOD observation at Pokhara station is used as dependent variable. Model coefficients were found significant at 95 percent level with 0.53 coefficients of determination for daily values. Correlation coefficients between model output and AERONET observations were found to be 0.68, 0.73, 0.75, 0.83, and 0.82 at Lumbini, Kathmandu Bode (KTM-BO), Kathmandu University (KTM-UN), Jomson, and Pyramid laboratory/observatory (EVK2CNR) AERONET stations, respectively. Model overestimate AOD at Jomsom, and EVK2CNR AERONET stations while slightly underestimates AOD in Lumbini, KTM-UN, and KTM-BO AERONET station, respectively. Both model output and MODIS observation showed that the highest AOD over Nepal is observed during winter and pre-monsoon season. While lowest AOD is observed during monsoon, and post-monsoon season. The result of this research supports that the use of linear regression model yields good estimation for daily average AOD in Nepal. The model that we have presented could possibly be used in other mountain regions for climate research.
1. Introduction
Aerosols are a focal point of climate research due to their role, and significant uncertainty, in atmospheric processes. Atmospheric aerosol particles scatter, reflect, and absorb incoming solar radiation (as a direct effect) (Chylek and Wong, 1995; Solomon et al., 2007), and modify cloud properties (as an indirect effect) (Charlson et al., 1992; Kim et al., 2014). The uncertainty associated with these processes thusly is considered as one of the huge gaps in current climate prediction capabilities (Parry et al., 2007; Istomina et al., 2011; Alexandrov et al., 2016). Considering the significant role of aerosol in climate processes in the Himalaya (Ramanathan, 2001; Meehl et al., 2008; Nair et al., 2013), different studies have evaluated this region (Ramanathan and Ramana, 2005; Ramanathan et al., 2007; Srivastava et al., 2012) focusing on aerosol emissions, optical–physical properties, and its climatic implications (Tripathi et al., 2007; Srivastava et al., 2012; Lau, 2014; Soni, 2015; Paliwal et al., 2016; Zhang et al., 2017) as well as impacts for regional hydrology (Matt et al., 2018). These research showed that the aerosols over the Himalayan region are in increasing trend, which is mainly detected during the winter and post-monsoon seasons and are forced by the high anthropogenic emissions, composed of bio and fossil fuel combustions (Acharya and Sreekesh, 2013). Ramanathan and Carmichael (2008) state that aerosols (particularly black carbon) in the high Himalayas likely play significant role in the snow and glacier melt by increasing solar heating. Li et al. (2016) claim the Himalayan region should be considered as the most vulnerable due to the impact of black carbon. Aerosol deposition and its transport over the Himalaya is attracting more attention due to its impact on the transformation of hydrological processes, and regional energy balance, affecting billions of people living downstream (Nepal et al., 2014).
Satellites offer a global perspective on many atmospheric variables, including AOD (Kaufman et al., 2002). Remotely sensed data from satellites has potential to account the highly variable black carbon aerosol properties on global as well as on regional scales and to provide repeated observations over long periods. A well-known example is the MODerate resolution Imaging Spectroradiometer (MODIS) instrument which can provide daily aerosol and its different properties with nearly global coverage at the resolution of 10 and 3 km (Remer et al., 2013). Several works provide an overview of MODIS aerosol retrieval algorithms and products (Kaufman et al., 1997; Chu et al., 2002; Remer et al., 2005; Martonchik et al., 2009; de Leeuw et al., 2011). The basis of MODIS AOD retrievals is that two independent algorithms are used to derive aerosol, one over ocean, and a second to derive over land. The land algorithm is mainly based on the dark target approach (Kaufman et al., 1997; Remer et al., 2005). However, there are some limitations over brighter surface. In both Govaerts et al. (2010) and Mei et al. (2012) the snow and glacier covered surfaces are identified as a great challenge for aerosol retrieval from remote sensing due to the fact the high surface reflectance makes it difficult to separate radiation at the top of atmosphere due to reflection from the snow and from atmospheric scattering by aerosol particles. As Mei et al. (2012), indicate that the crucial issue with using satellite for AOD retrieval over brighter surface is due to very high spectral albedo of the brighter surface like snow at wavelengths in the visible region.
To fully understand the effect of aerosols over the Himalayan region, detailed knowledge regarding the spatio-temporal distributions of aerosols, and their seasonal variability in the atmosphere are required (Bonasoni et al., 2012). Several methods have been used to retrieve AOD over pure snow (Istomina et al., 2009; Mei et al., 2012, 2013), but all these algorithms are restricted to the Arctic region in order to meet the requirement of having a sufficient snow BRDF model (Mei et al., 2013). To date, no algorithm exists to retrieve AOD products over Himalayan cryospheric region (snow and ice surfaces). A more detailed understanding of spatial, and temporal variations of aerosols is required in order to quantify the dynamic influence on the regional climatic conditions.
The objective of this research is to develop an empirical proxy model by using multiple regression, to increase the present understanding of spatio-temporal variability of AOD over the cryospheric portion of Nepal. Three meteorological variables from ERA-interim reanalysis dataset: relative humidity, wind velocity components (U10 and V10) (describe in section 3.3) and observed AERONET AOD from Pokhara AERONET station are used to develop our proxy en empirical model. Our study region is presented in section 2, while the dataset used in this research, and the proposed methods to retrieve AOD is explained in section 3. Results and discussion are presented in section 4, and finally conclusions are presented in section 5.
2. Study Area
The domain of our analysis is the country of Nepal (see Figure 1), with our results applicable to the cryospheric portion of the country. Nepal is between India and China, and extends 885 km east-west and 145–248 km north-south. Within this small geographical range, the altitude varies from ~60 m above sea level (m asl.) in the southern plain, tropical Terai, to the highest peak on the earth in the northeast. Along a south-north transect, Nepal is divided into three ecological belts: Mountain in the northern range, the mid range is called Hill, and the low elevated southern range called Terai (CBS, 2014). Area of the country is 147,181 km2, out of which about 15% is comprised of high Himalaya, 68% covers by mid hill regions, and the remaining 17% flat valley floor Terai. Around 50% of the total population lives in Terai region, 43% of country population lives in the Hill region, and 7% in the Himalayan region (CBS, 2012). Predominant economic (and aerosol producing) activities (farming, industrial establishment) are conducted in Terai region.
Figure 1
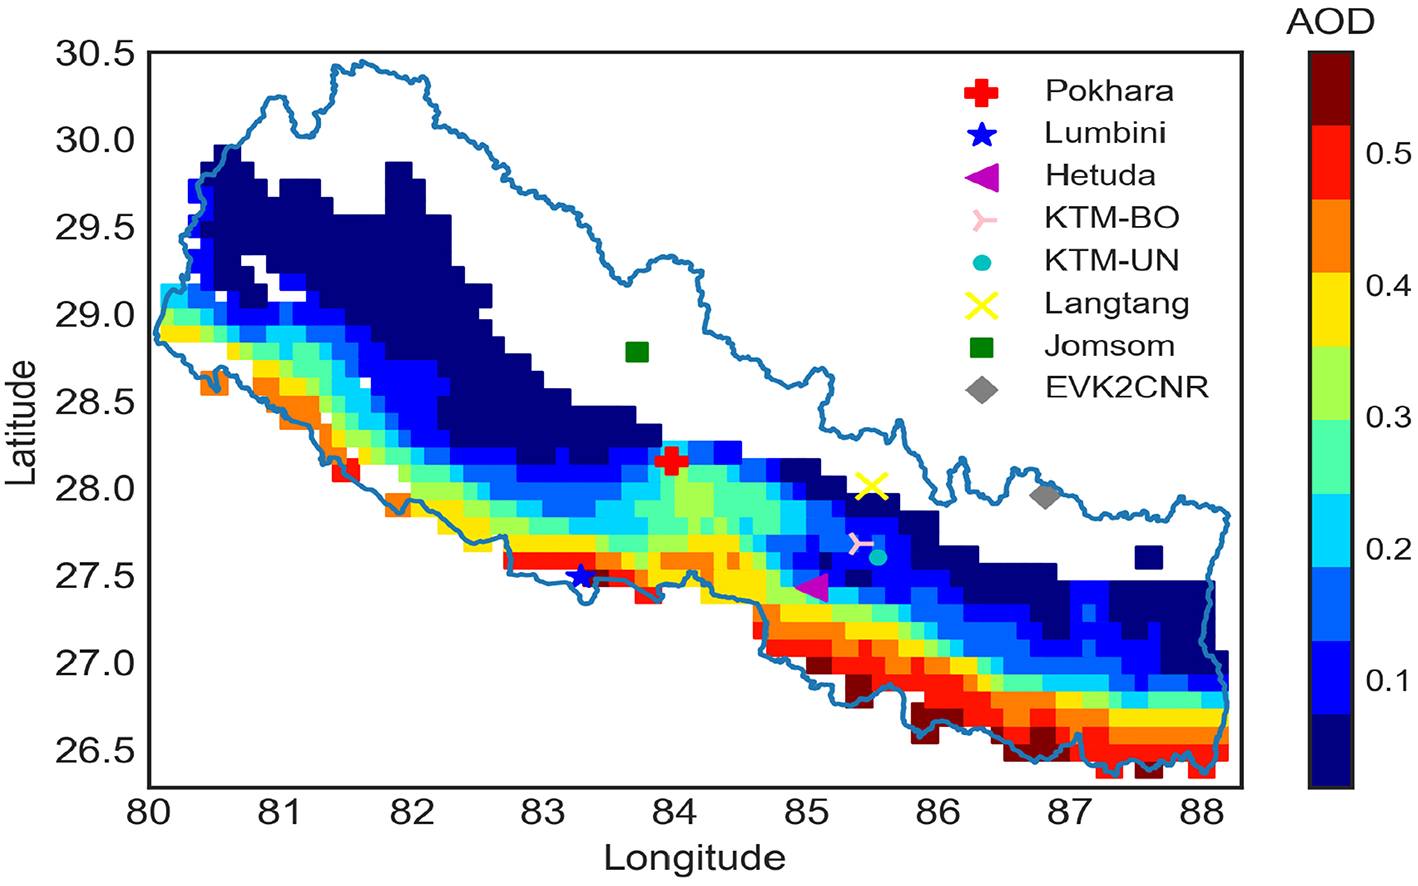
Spatial average dry AOD from daily MODIS observation (2000–2015) over Nepal. Markers in map represent the location of AERONET station.
Rapid changes in elevation within a short north-south distance creates a wide range of climatic conditions, from subtropical to alpine/arctic within a span of <200 km. The temperature variation in Nepal is mainly related with the seasons. Within a season temperature varies with topographic variations along north to south direction. Eighty percent of the total precipitation in Nepal occurs during the monsoon (June to September) season (Nayava, 1974; Shrestha et al., 2000) with winter (5%) (December to February) rains more common in the western hills (Ichiyanagi et al., 2007). Pre-monsoon (March-May) season receives about 10% of rainfall while 5% of rainfall occurs during Post-Monsoon (October to November) (Nayava, 1974).
3. Datasets and Methods
3.1. AERONET Data
The Aerosol Robotic NETwork (AERONET) is a federation of ground-based sun photometers which derive total column AOD and other aerosol characteristics based on a radiative transfer inversion algorithm. The network requires standardized instruments, calibration, and processing (Holben et al., 1998). AERONET stations provide measurements every 15 min from a spectral radiometer with a 1.2° field of view, and eight solar spectral bands from 340 to 1020 nm are used to calculate, for each wavelength, the AOD, with an accuracy of ±0.01–0.02 (Eck et al., 1999). There are eight AERONET stations in Nepal. The longest time series data come from Pokhara (2010–2016) and the EVK2CNR (2006–2015) station while data from other stations are less comprehensive and for relatively short periods from different years.
The mean AOD at 550 nm from the AERONET stations at different locations is presented as boxplots in Figure 2. While we note an elevation dependence of AOD, it must be recognized some stations have limited data. Figure 2 shows that the Lumbini station located in lowest elevation has highest AOD mean followed by the Hetuda, while the lowest AOD mean value is observed at EVK2CNR at the highest altitude. Systematically the mean are greater than the median indicating that the positive skewed distributions are characteristic of naturally occurring phenomena as indicated by Sriram et al. (2004). Since the number of observed data points are limited in Hetuda and Langtang (up to 2016), further analysis does not include the data from these stations. AERONET datasets were screened for outliers, and these values were removed using a mean ± 3 standard deviation conventional approach (Miller, 1991; Leys et al., 2013). As in prior studies, to provide an effective comparison and analysis, AERONET data are interpolated from 500 to 550 nm using the following computation (Kaskaoutis et al., 2007; Prasad and Singh, 2007; Alam et al., 2014).
where AOD500nm in Equation (1) is the AOD measured in 500 nm wavelength. Here α is the Ångstrom exponent from the wavelength of 440–870 nm (Sayer et al., 2013):
where τ1, and τ2 are the AOD at wavelengths λ1, and λ2.
Figure 2
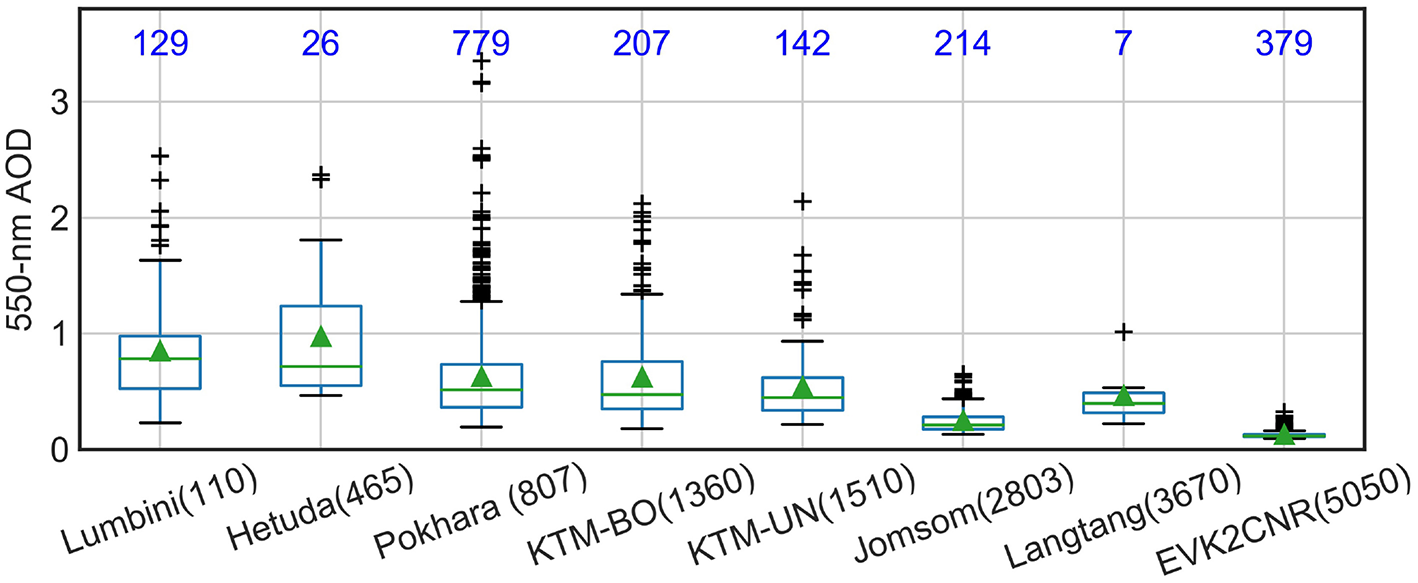
Box plots for AERONET AOD observation at 550-nm in Nepal. The blue number in the figure represents the total number of AOD observation at each AERONET station. Along the abscissa numbers inside brackets after each name of the station are station elevation in m asl. Green triangle and lines inside boxplots are the mean and median values, respectively.
As explained below, in section 3.5, our empirical proxy aerosol model performs better with dry than wet aerosols. To derive dry AOD from wet AOD we use the approach of Zhang et al. (2017) to account for hygroscopic growth.
where, RH is relative humidity, AODdry represents the AOD with a dehydration adjustment. f(RH), the hygroscopic growth factor, denotes the ratio of the aerosol scattering coefficient in ambient with a certain relative humidity to that in the dry air condition (Li et al., 2014; Zheng et al., 2017). f(RH) can be expressed as:
We have tested the different hygroscopic factors given by Li et al. (2014) to convert observed AOD in to a dry state and Equation (4) performed best to yield a higher correlation of AODdry with meteorological parameters. Hereinafter, all references to AERONET AOD denote AODdry at 550 nm from AERONET, unless otherwise indicated, and wavelength subscripts are not assigned for conciseness.
3.2. MODIS Data
In this study we use 16 years (2000–2015) of AOD data obtained from the MODIS instrument on-board, the NASA EOS satellites. The MODIS products provide three processing levels of data: Level 1 (geolocated radiance, and brightness temperature), Level 2 (retrieved geophysical data products), and Level 3 (gridded averages of geophysical retrievals) data. There are two MODIS Aerosol data product files: MOD04_L2, containing data collected from the Terra platform; and MYD04_L2, containing data collected from the Aqua platform. Daily Level_2 (Collection 6) data produced at the spatial resolution of a 10 km x 10 km (at nadir) from the Terra platform MOD04_L2 is used in this study. The MOD04_L2 product provides global AOD from the dark target (DT) (Kaufman et al., 1997; Levy et al., 2013), and deep blue (DB) algorithms (Huss, 2013). The DT algorithm is applied over the ocean and dark land surfaces, while the DB algorithm is used for brighter surfaces. The data analysis that follows uses AOD at 550nm to be consistent with the wavelength used by many climate transport and chemistry models (Kinne et al., 2013) and prior MODIS validation studies (Levy et al., 2007, 2010; Safarpour et al., 2014). MODIS scientific datasets (SDS) in Level 2, collection 06 is used to retrieve AOD for this study.
Table 1 provides the names for the relevant scientific datasets within the MODIS Level 2 aerosol products. In order to select the optimal MODIS scientific dataset for our purposes, we conducted a brief validation and evaluation of different scientific dataset performance in relation to the Pokhara AERONET observations. Validation of MODIS AOD with AERONET observed AOD (dry AOD from both observation) is carried out to find the best fit MODIS scientific dataset with AERONET datasets. For the validation, we followed the procedure described by Ichoku et al. (2002) and Li et al. (2009). Spatial and temporal variability of AOD distributions were taken into account. MODIS retrieval at 10 km x 10 km and AERONET measurement within ±30 min of MODIS overpass time and atleast 3 out of 9 MODIS retrieval in a square box of 30 × 30 km centered over AERONET site were used. After that mean values of co-located spatial and temporal values were used for calculating error statistics (i.e., RMSE, correlation coefficient). Scatter plots between mean AERONET and MODIS AOD for different scientific dataset are shown in Supplementary Figure 1. Although different datasets have different expected error (EE), ±(0.05+0.15AODAERONET) is used for direct comparison (Remer et al., 2005). Validation results shows that the lowest RMSE (0.13), with highest correlation coefficient (0.75) and EE (71%) is found for aerosol optical depth estimated from deep blue algorithm. The correlation coefficient for the best estimate is higher (0.75), but MODIS has large underestimation. Large AOD underestimation by MODIS in the studied site does not affect the current study because MODIS AOD is only used in a relative sense to determine gradient along the mountain slope.
Table 1
| Pearson correlation coefficient (r) | |||
|---|---|---|---|
| S.N. | MODIS scientific datasets | Normal AOD | Dry AOD |
| 1 | Opital_Depth_Land_And_Ocean | 0.68 | 0.85 |
| 2 | AOD_550_Dark_Target_Deep_Blue_Combined | 0.68 | 0.85 |
| 3 | Corrected_Optical_Depth_Land | 0.57 | 0.76 |
| 4 | Deep_Blue_Aerosol_Optical_Depth_ | 0.75 | 0.87 |
| 550_Land_Best_Estimate | |||
Pearson correlation coefficients between daily average AERONET AOD with MODIS AOD in dehydrated (dry) and normal (without dehydration) form.
Using classical regression model evaluation statistics, we also calculated at the Pearson Correlation coefficient (Adler and Parmryd, 2010) for the different MODIS scientific dataset in two forms (i.e., dry (converted by using Equation 3) and normal) against the observations. The correlation coefficient between AERONET AOD and MODIS AOD in normal (0.75) as well as in dry form (0.87) are also highest for aerosol optical depth estimated from deep blue algorithm (Table 1). We selected this scientific datasets and hereinafter this is refers to as MODIS AOD.
3.3. ERA-Interim Data
We use the daily average ERA-Interim global atmospheric reanalysis dataset (Berrisford et al., 2011) to obtain the meteorologic parameters over Nepal. The data of this reanalysis are available from ECMWF website http:apps.ecmwf.int/datasets/. Nine variables are included in the analysis: albedo, 10m wind velocity components (U10 & V10), total columnar water vapor, total columnar water, 2m dew temperature, 2m surface temperature, sea level pressure, and surface level pressure. Obtained datasets are linearly interpolated to the resolution of 10 × 10 km. Additionally, we include relative humidity in our analysis, which is calculated using the equation given by Dingmann (2015):
where, T, and TD in Equation (5) are the 2 m air temperature, and dew point temperature in °C, respectively.
3.4. Digital Elevation Model (DEM)
A detailed map of land surface elevation was obtained from the Advanced Spaceborne Thermal Emission, and Reflection Radiometer (ASTER) (Fujisada et al., 2005) with 30 m resolution. The DEM is re-sampled to the ground resolution of 10 × 10 km using a nearestneighbor interpolation technique available in the re-sampling tools of spatial analyst in ESRI ArcGIS.
3.5. Regression Analysis
Multiple linear regression methods with Ordinary Least Square (OLS) assumptions (i.e., the model is linear in the parameter and error terms are identically and independently distributed) (Kleiber, 2001) are applied to develop an empirical model for dry AOD based on ERA-Interim predictors. Daily average AERONET AOD in dry form at Pokhara station (see Figures 1, 2) is selected as the dependent variable, as the statistical significance was greatly improved compared to the use of the wet aerosols. We have selected Pokhara to develop our model as it has the longest time series (2010–2016) with consistent data quality. The nine aforementioned meteorological variables from ERA-Interim are initially used as independent variables and we conducted a step-wise multiple linear regression analysis (Bendel and Afifi, 1977).
All the data were linearly de-trended (Tanabe et al., 2002) and normalized () before doing the statistical analysis. Scatter plots between the dependent and independent variables are presented in Figure 3 with the resulting correlation coefficients (r).
Figure 3
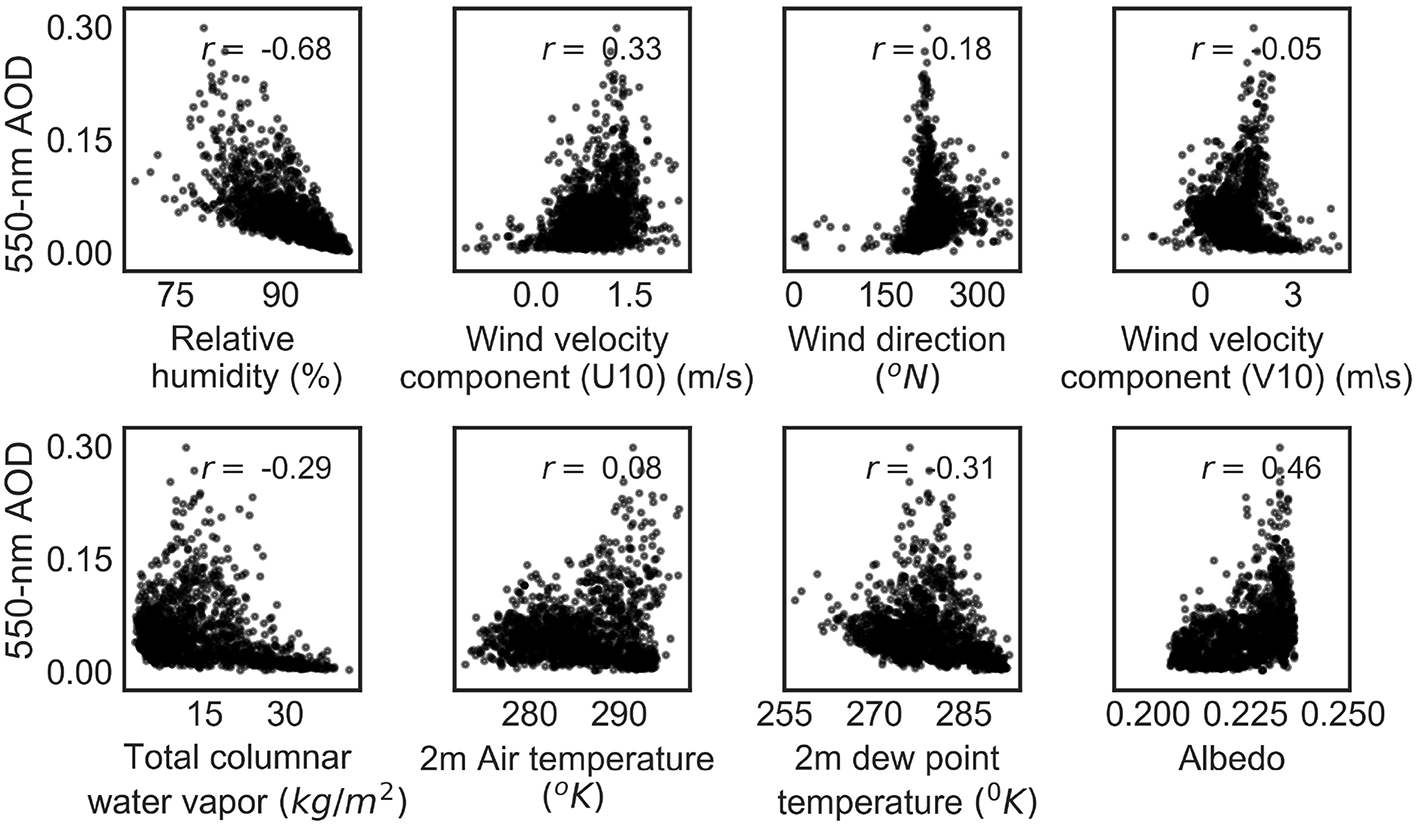
Scatter plots between aerosol optical depth with meteorological variables. “r” represents Pearson correlation coefficient between aerosol optical depth and meteorological variables.
To maximize the estimation power of the model using the minimum number of independent variables, forward step-wise regression process (Bendel and Afifi, 1977; Khatibi Bardsiri et al., 2014; Silhavy et al., 2017) is used to identify the independent variables. The selected regression model from the step-wise regression process, based on Pokhara AERONET data as a dependent variables, and average daily ERA-interim as independent variables is given by:
where, ϵ ~ N(0, σ2) is an error term that is associated with the model prediction. AODsim is the simulated AOD in dry form.
We found that the coefficient of determination (R2) of the model is 0.53 for daily values. Observed P-value for all the regression coefficients are <0.05 indicating that the model is statistically significant at 95% confidence level. In the developed empirical model given by Equation (6) simulated dry AOD (AODsim) is determinedly the relative humidity, and wind components (U10 and V10). Higher relative humidity is associated with removal of aerosols, reducing the AOD (loss term, negative coefficient), and aerosol sources are predominantly to the south, and west of Nepal, so southerly (V10 > 0), and westerly (U10 > 0) winds should bring higher aerosol content (source term, positive coefficients). Although Equation (6) is a proxy model only (as we have not considered emission flux and sources), this interpretation shows a relation to processes controlling the AOD.
3.6. Model Correction
Possible biases in simulated AOD due to the altitudinal gradients (see section 4.1) are corrected by three methods using:
Model-1: average regression slope from MODIS,
Model-2: monthly regression slope from MODIS data,
Model-3: monthly regression slope calculated from the AERONET station data,
abbreviated as M1, M2, and M3, respectively. Now the correction equation for all models becomes Equation (7), except that the value of regression slope will change according to the model.
where, Ei is the elevation of respective station, EB is the elevation of base station i.e., elevation of AERONET station at Pokhara.
3.7. Model Evaluation Statistics
We briefly describe three standard statistical metrics which were used throughout the analysis to evaluate the performance model results: Root Mean Square Error (RMSE), Pearson correlation coefficient (r), and percent bias (PBIAS). These are described below.
Root Mean Square Error (RMSE): is the standard deviation of the residual (prediction errors). It is the distance, on average, of the fitted line for a data point to the observed value. Hence it is consistent in terms of measurement units and provides a metric that is easy to interpret: the smaller an RMSE value, the closer predicted values are to the observed. Mathematically it is describe by Chai and Draxler (2014) where n is the total number of observations, AODsim is the simulated AOD from the model, and AODaeronet is the AERONET AOD, respectively.
Pearson correlation coefficient (r): r (Pearson, 1896) measures the strength and the direction of a linear relationship between our observed and simulated AOD. The mathematical formula for computing r given in Pearson (1895) is used. The numerical value of the correlation coefficient can vary numerically between −1, and 1. The closer the correlation is to 1.0, the stronger the relationship between the two variables, whereas a negative value defines an anti-correlation.
Percent bias (PBIAS): measures the average tendency of the simulated AOD to be larger or smaller than their observed counterparts (Moriasi et al., 2007). The optimal value of PBIAS is 0.0, with a low-magnitude value indicating accurate model performance. Positive values indicate model underestimation bias while negative values indicate overestimation bias.
4. Results and Discussion
4.1. Altitudinal Distribution of AOD
Shown in Figure 1 is the spatial distribution of average observed AOD from MODIS over Nepal for the period of 2000–2015. It is clear that the spatial gradients of AOD are inversely related to the topography, i.e., higher AOD over the southern low land and lower AOD over the mountainous regions of Nepal. Scatter plots (Figure 4) show that the AOD non-linearly decreases with the altitude (steep negative gradient) up to ~500 m asl. and thereafter varying more smoothly with the altitude. We found that the altitudinal distribution follows a semi-logarithmic form with a slope and coefficient of determination of −0.135 and 0.899, respectively (blue points in Figure 4 is the linear transfer of elevation by taking natural log). Since the aerosol load over the region varies greatly with the seasons (Acharya and Sreekesh, 2013), slope coefficient of the regression equation on the monthly average MODIS and AERONET observations are calculated over Nepal. In Figure 5 the blue points represent an average AOD per each grid cell with respective elevation in semi-logarithmic scale. The red triangles represent the monthly average AOD from the AERONET stations. As compare to AERONET AOD, MODIS underestimates AOD in all months. Monthly gradients from MODIS and AERONET observations are different. But from both observations, the strongest elevation gradients are observed during the winter season, while the weaker gradients are observed during the monsoon season.
Figure 4
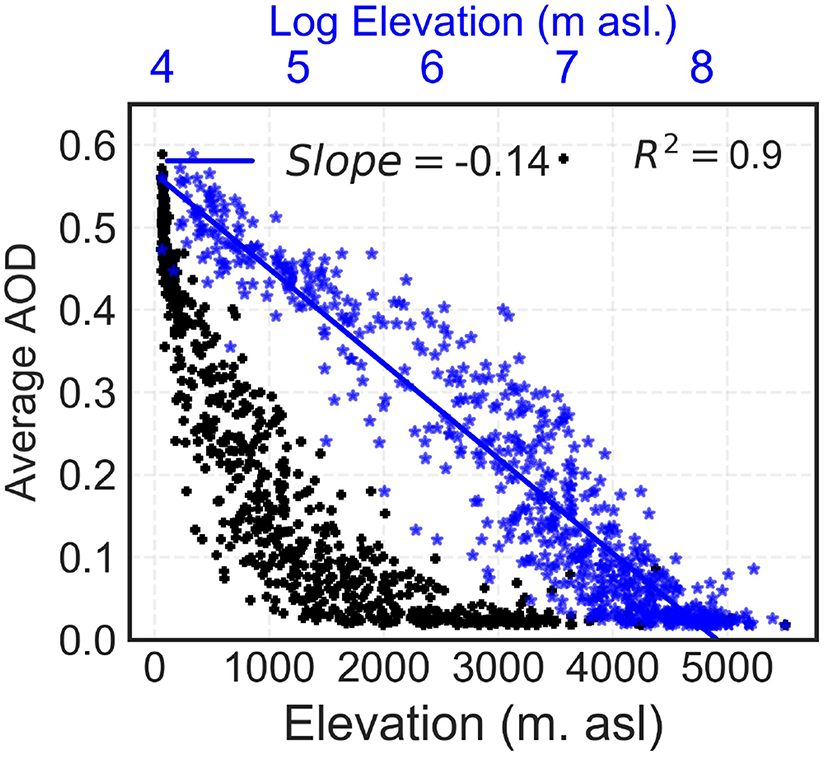
Scatter plot for MODIS average AOD for the period of 2000–2015 with the altitude and log normally transferred altitude.
Figure 5
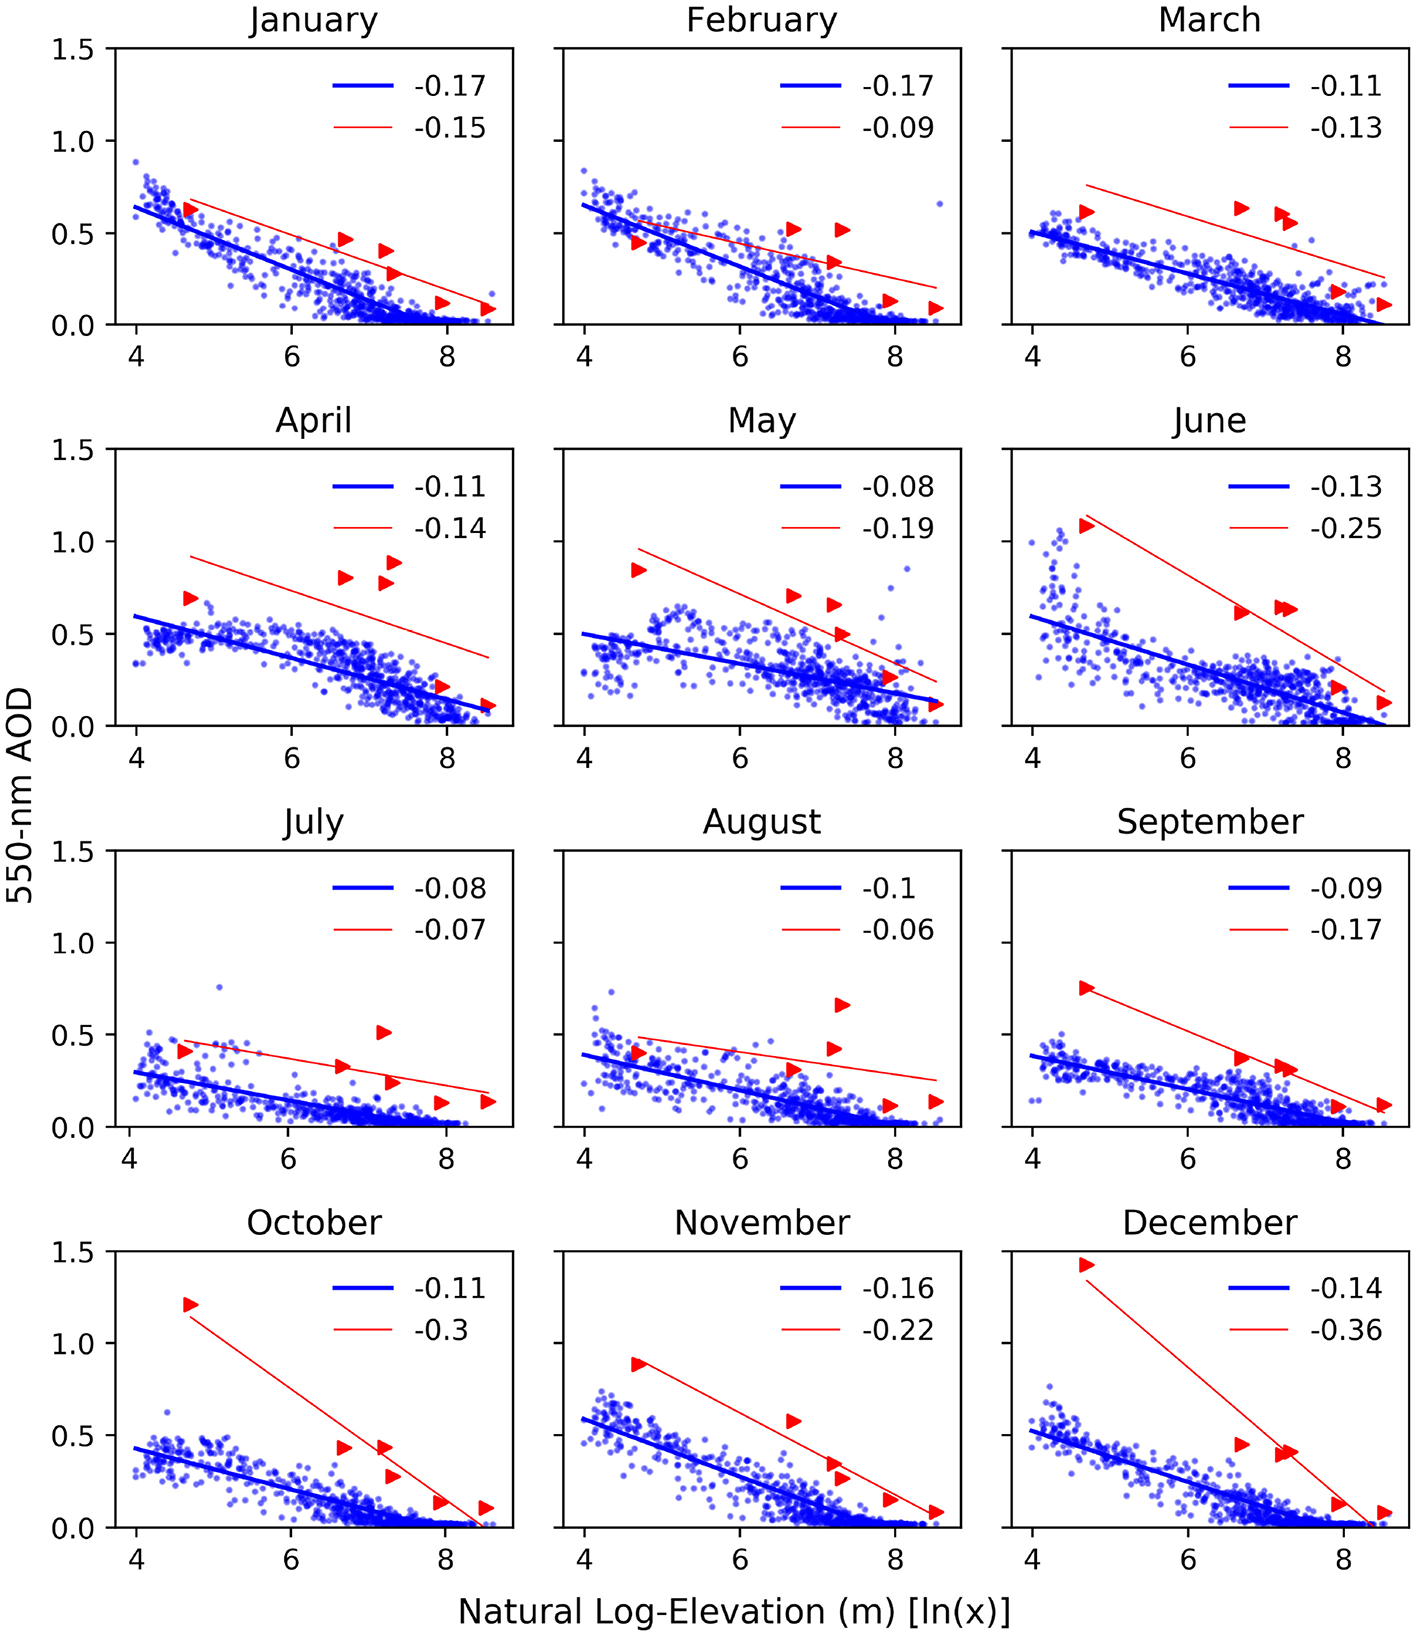
Monthly average AOD at 550 nm from MODIS (blue) and AERONET (red) observation with log elevation. Blue and red lines show the best fit linear lines for each datasets. Numbers in each subplots show the slope for each best fit lines, respectively.
4.2. Seasonal Variability and Spatial Distribution of MODIS AOD
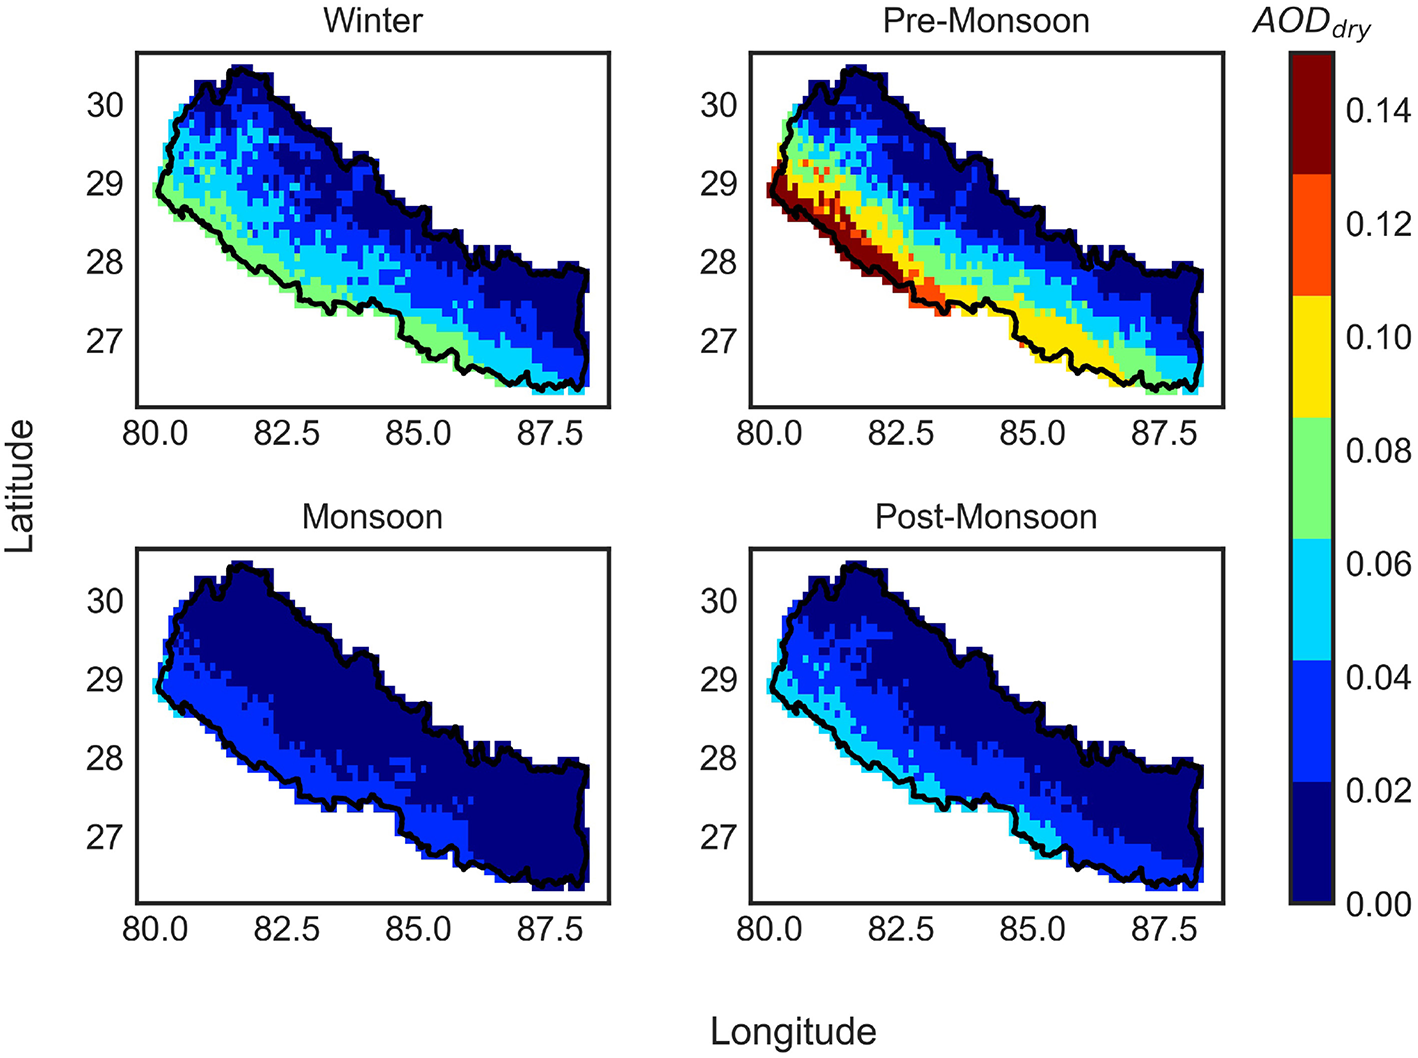
We calculated a spatial average (2000–2015) of the MODIS AOD in the dry forms for each season to evaluate the seasonal variability. These are shown in Figure 6. The maps show average AOD retrievals over Nepal are concentrated toward lower elevations (Terai) where a high density of data pixels exists, and the retrievals are limited in higher elevation regions due to high surface reflectance. However, the seasonal spatial distribution of AOD over Nepal clearly shows typical cycle of AOD with high AOD in winter and pre-monsoon, and low in monsoon and post-monsoon seasons. We present a further discussion of the seasonal dynamics of AOD over Nepal in section 4.5.3.
Figure 6
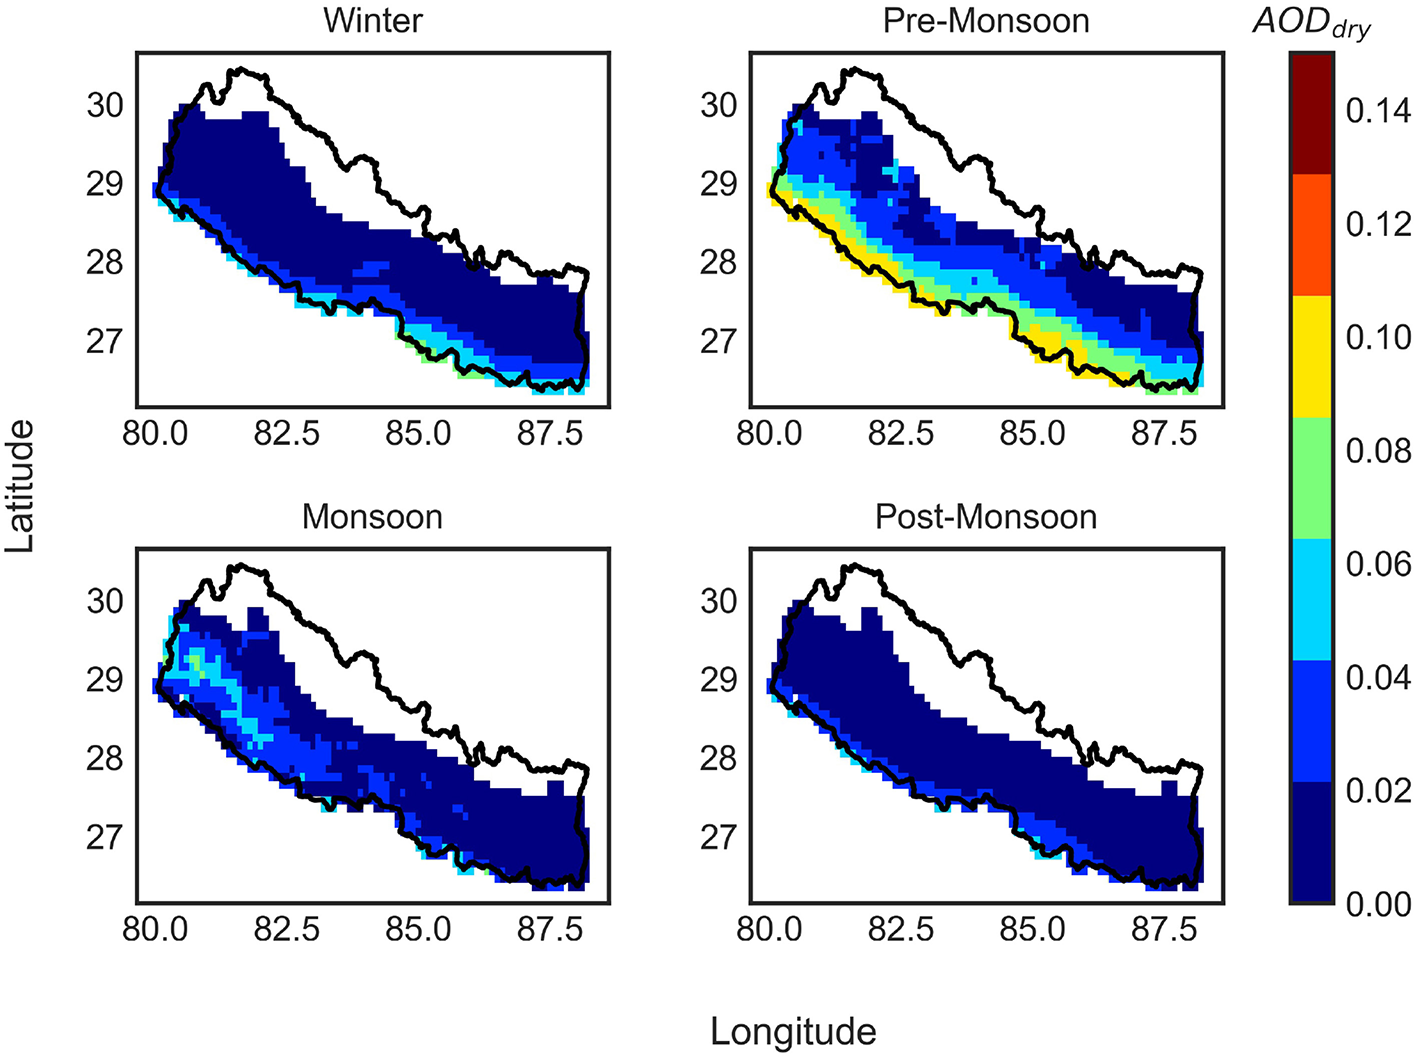
Seasonal average MODIS AOD (2000–2015) over Nepal.
4.3. Validation of MODIS AOD With AERONET
Because of enormous altitude variation within a short south to north distance, Nepal has remarkable climatic variability (tropical to Arctic) (Li et al., 2017) which poses a challenge for satellite remote sensing of aerosol. Validation of remotely sensed AOD with ground based instruments (AERONET) is worthwhile in a region where such studies have not yet been completed. We followed the general way to validate MODIS AOD against AERONET AOD and the detailed procedure that we followed is explained in section 3.2. Scatter plots between mean AOD from MODIS and AERONET for different stations are plotted and shown in Supplementary Figure 2. The AERONET sites are located in different elevations ranging from 110 to 5,050 (m asl.) (Figure 2), but the validation is done in four AERONET stations (i.e., Lumbini, Pokhara, KTM-BO, and KTM-UN) with MODIS observations. The comparison is performed using co-located points. Seasonal analysis of these co-located AOD data shows that, most of these data points are from winter, and pre-monsoon season in all stations. In Pokhara, KTM-BO, and KTM-UN AERONET stations about 30, 55, and 41% of the co-located data are from winter season, while 55, 29, and 25% of the co-located data are from pre-monsoon season, respectively. The linear correlation coefficient, with RMSE, and regression slopes between AERONET, and MODIS observation over four station are given in Table 2. The regression slope, and intercept from Table 2 shows that AOD observations from AERONET in all station are higher than from MODIS.
Table 2
| Linear regression | ||||
|---|---|---|---|---|
| Station | RMSE | Correlation coefficient | Slope | Intercept |
| Lumbini | 0.33 | 0.91 | 0.62 | 0.44 |
| Pokhara | 0.13 | 0.75 | 1.34 | 0.31 |
| KTM-BO | 0.39 | 0.75 | 1.65 | 0.29 |
| KTM-UN | 0.39 | 0.84 | 1.29 | 0.29 |
Different statistics calculated from daily average AERONET AOD and daily MODIS AOD for each station.
Chu et al. (2002) and Li et al. (2009) showed that the intercept of linear regression different from zero represents the errors in surface reflectance estimates, and the regression slope differing from 1.0 represents a systematic bias of MODIS AOD retrievals. We also tried to do similar comparison in our study. Table 2 shows good correlation (0.75–0.91) between MODIS derived and AERONET observed average daily dry AOD with intercept values between 0.29 and 0.44, and a regression slope between 0.62 and 1.65. About 43, 74, and 69% of the observations fall inside expected error (EE) from KTM-BO, KTM-UN and Lumbini AERONET station. Lower percentage inside EE from KTM-BO might be due to fewer observation compared to KTM-UN and Pokhara (Figure 2). However, in comparison with global validation results (Levy et al., 2007), with intercept of 0.029, and slope of 1.009, MODIS C005 AOD retrieval has higher errors in Nepal. The relatively high positive offset of MODIS AOD in Nepal (e.g., intercept 0.29–0.44) is indicative of the poor estimates in surface reflectance (Li et al., 2009). Moreover, daily MODIS, and AERONET derived AOD are not concurrent in time. Therefore, the sampling time inconsistency for AERONET and MODIS AODs is also a source of uncertainty.
4.4. Average MODIS AOD Distribution With Inter Annual Variability, 2000–2015
Analysis of seasonal average dry AOD for Nepal shows the nature of the dynamics of aerosol concentration during the study period. Figure 7 shows inter annual variability and 16 years AOD trends for each season from MODIS. It shows that the AOD exhibited an increasing trend in all seasons except in winter, but only the trend in monsoon season is statistically significant at 95% significant level (faint dashed lines in Figure 7). The highest average AOD throughout the period was in the pre monsoon, whereas the monsoon season showed an increasing trend after 2012. Between 2002–2004, and 2007–2010, the post-monsoon curves showed significant lowering of average AOD. The high AOD in pre-monsoon during 2001–2005 may be attributed to low rainfall over most parts of Nepal (Department of Hydrology and Meteorology Government of Nepal, 2017), which caused an increase in aerosol loading in the atmosphere. The winter decline in AOD (0.36–0.16) from 2000 to 2003 (0.046–0.01), and 2007 to 2010 (0.03–0.02) was possibly due to a reduction of aerosol load through higher precipitation observed over Nepal. Overall, significant increasing trend with slope of 0.0006, and p-value of 0.042 is observed for average AOD over Nepal. This weak but significant increasing trend may be attributed to annual decreasing trend in precipitation in Nepal (1.3 mm per year), although this precipitation decreasing trend is not significant (Department of Hydrology and Meteorology Government of Nepal, 2017).
Figure 7
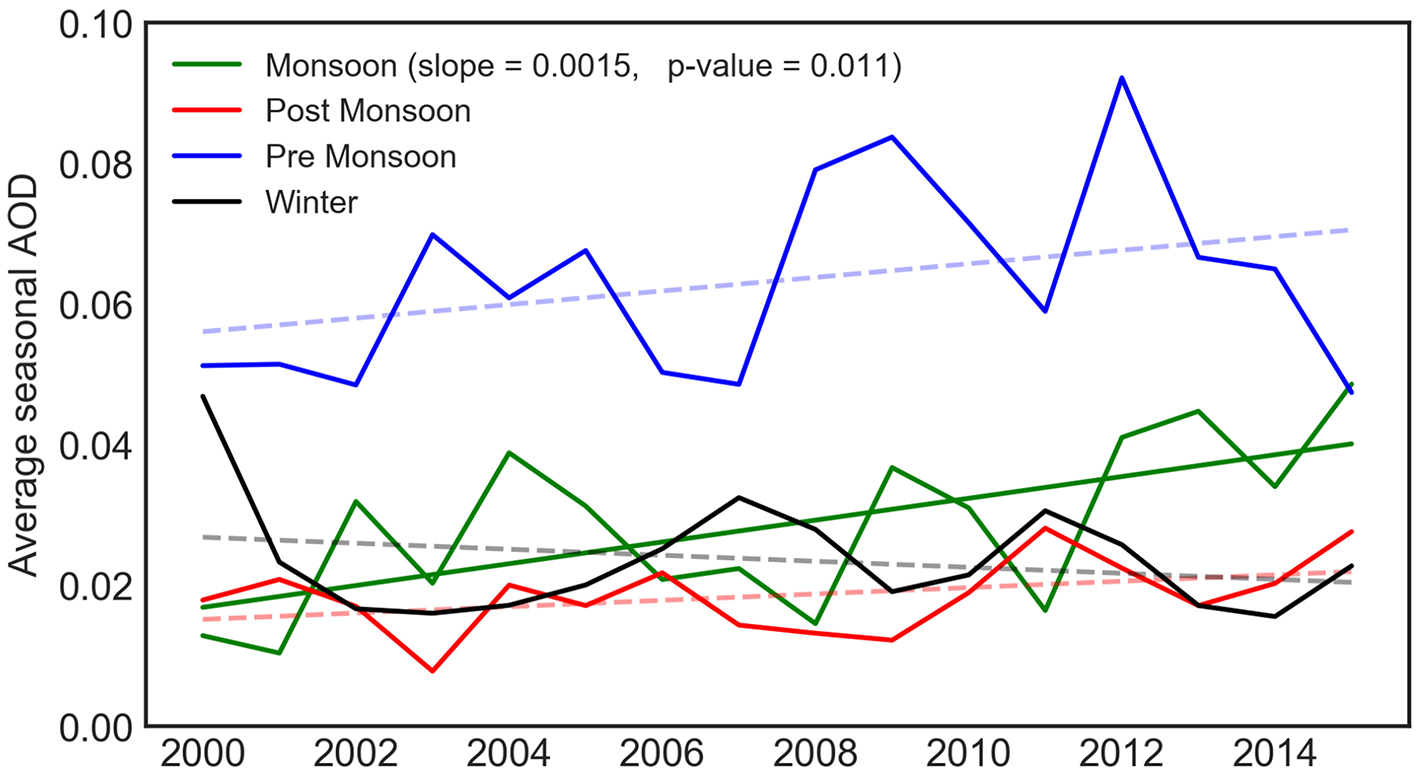
MODIS average dry AOD (2000–2015) with seasonal trend over Nepal.
In order to see the average inter-annual variability of AOD in Nepal, monthly average dry AOD from both MODIS and AERONET data are plotted in Figure 8. Standard deviation about the mean from corresponding nine cell MODIS observation is plotted as shaded part in the plot. From the seasonal AOD analysis, AERONET AOD is found higher than most of AOD observation from the MODIS. Although the seasonal AOD comparison between MODIS and multi wavelength radiometer (MWR) by Guleria et al. (2012), and between MODIS, and Multiangle Imaging Spectro-Radiometer(MISR) by Prasad and Singh (2007) over Indian subcontinent shows that MODIS is overestimating during summer, and underestimating during winter. But we found that in four stations MODIS AOD is lower than AERONET AOD (Figure 8). From MODIS and AERONET observation, the highest AOD is observed during the period of March-May when Nepal experiences heavy spring dust from north-west a feature that might be attributed to the fact that we use dry aerosol in this analysis. The scavenging effect of the rain can be seen from both observations as the lowest AOD is observed during the period of July-August when the monsoon season initiates. The highest AOD observed is at Lumbini during November and December, and likely results from biomass burning for heating in the Terai region (Wang et al., 2013).
Figure 8
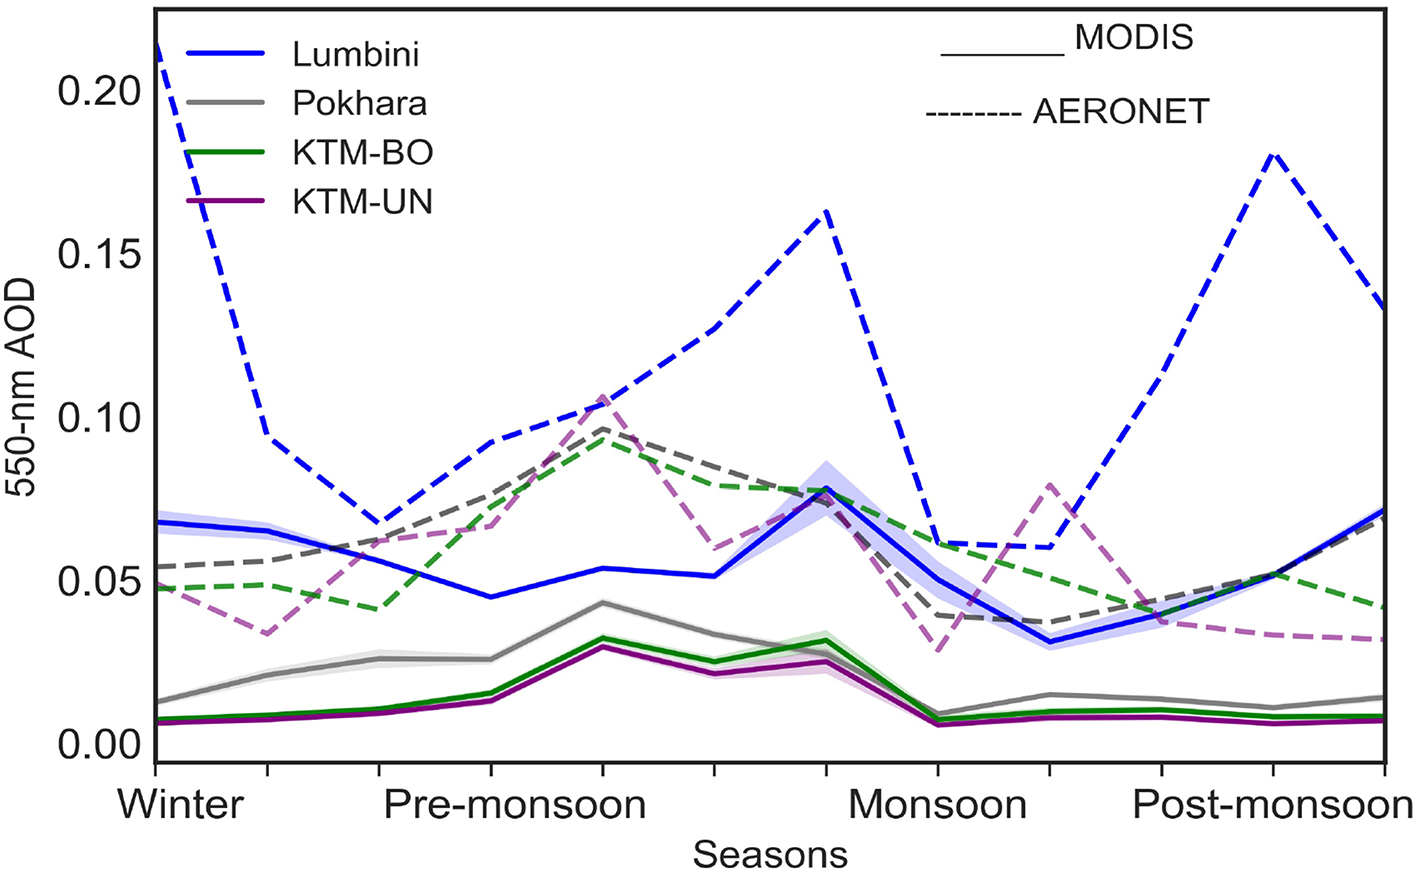
Inter-annual variability of observed dry AOD from MODIS and different AERONET stations. Solid lines with shading are for the MODIS observations. Solid lines represent the mean values while shading represents the variance within nine cells of an AERONET station. Dotted lines are the respective observations from AERONET stations.
4.5. Model Result Analysis
The empirical model obtained from Equation (6) resulting from the multiple linear regression is used to simulate daily dry AOD at different AERONET stations in Nepal. Simulated daily dry AOD values with observed data are plotted in time in Figure 9. The time series can be effectively used to understand the predictability of the model. It is observed that the simulated dry AOD values are similar to the measured values except in Jomsom, and EVK2CNR station. The average bias (difference between observed mean with simulated mean) between simulated and observed value are found to be 0.0002, 0.034, 0.009, 0.013, −0.045, −0.043 for Pokhara, Lumbini, KTM-BO, KTM-UN, Jomsom, and EVK2CNR station, respectively. Results showed that the model underestimated when is used to simulate AOD in lower elevation region than Pokhara station, and overestimated AOD in Jomsom and EVK2CNR, which are located in higher altitude. The correlation coefficient between observed and modeled dry AOD (presented inside each plot) are found to be higher at stations in higher altitude indicating their higher similarity between observed and simulated values.
Figure 9
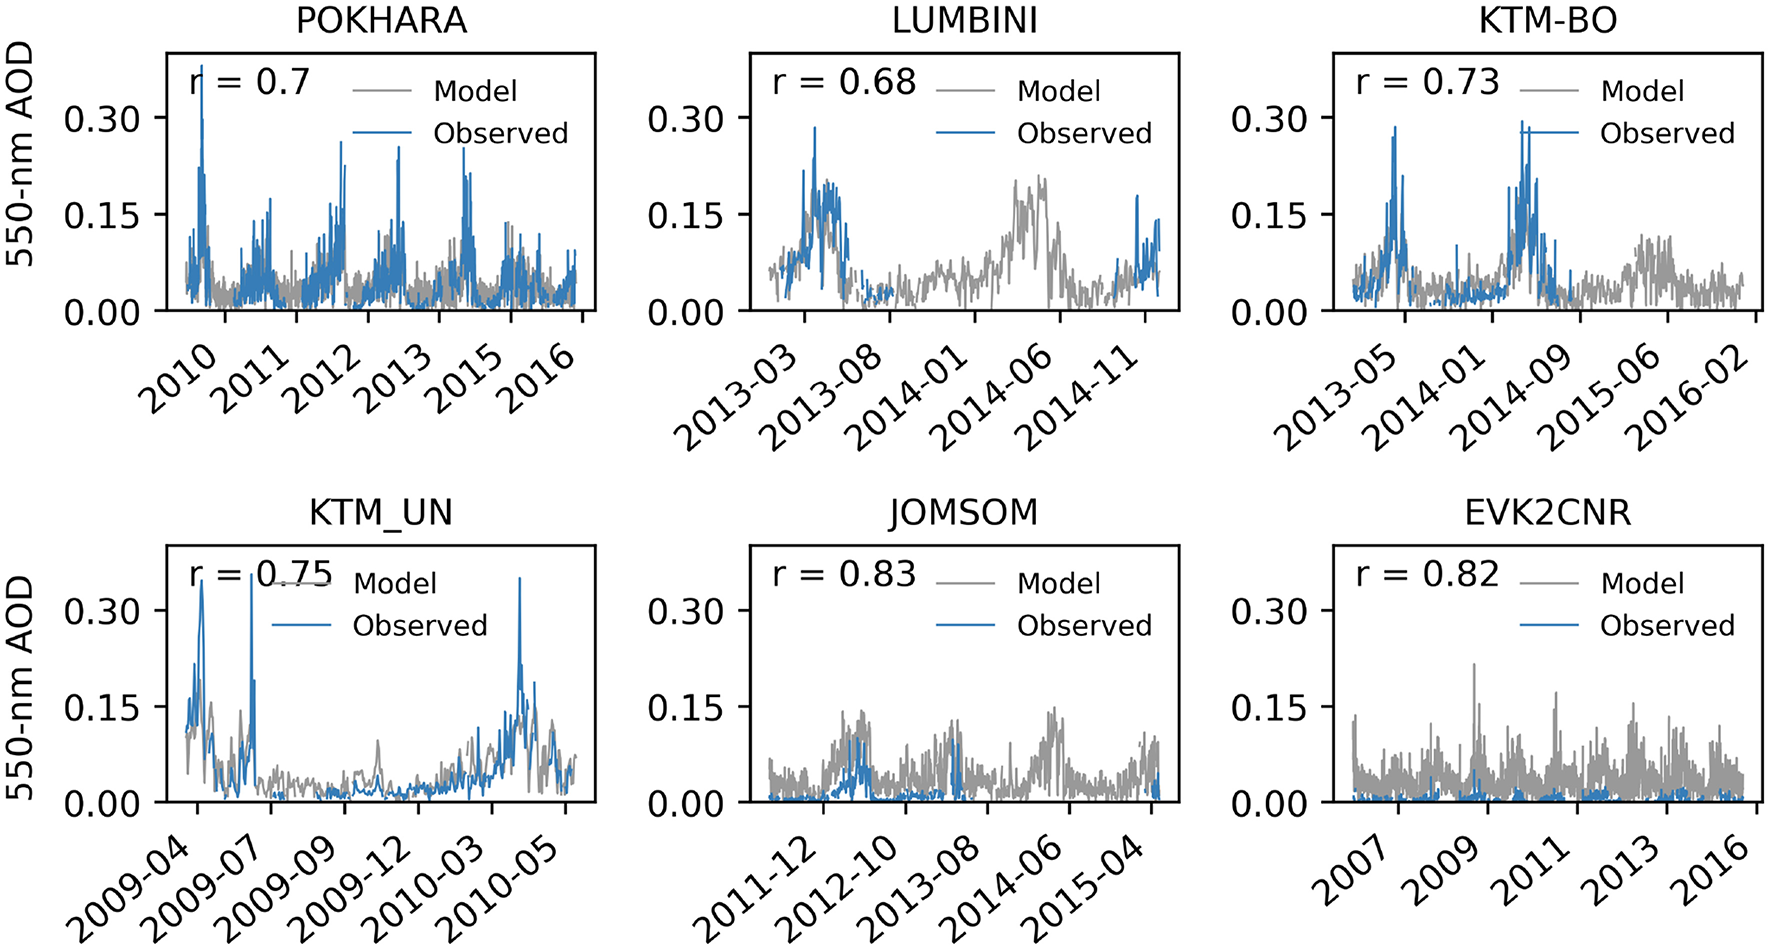
Observed and model aerosol optical depth at different AERONET stations in Nepal. “r” represents the correlation coefficient between observed and model values.
We found that the disagreement (i.e., highest PBIAS and RMSE) between the simulated, and observed AOD is due to the altitudinal dependencies (Figure 5), as it follows the topography with higher AOD values over the low land than over the mountain area (Figure 1). Roux et al. (2008) showed that the lower aerosol load in French mountains are because of high wet deposition due to orographic effects, but in the case of Nepalese mountainous region, lower AOD observed from MODIS and AERONET might be lower anthropogenic activity in the region in addition. As we discussed in sections 4.2 and 4.4 that the aerosol distribution in Himalayan region are not only dependent upon altitude, but also dependent upon seasons, because the Hindu-Kush-Himalayan region is strongly influenced by large-scale atmospheric circulation, which alternates between the wet summer monsoon, and dry season. As the distribution of aerosols over time and space is determined by its type, size, and source (Cristofanelli et al., 2014), aerosols transported to Himalayas mainly from Indo-Gangetic plain during the pre-monsoon season (Ramanathan et al., 2007; Kopacz et al., 2011) are deposited differently over the space. Dhungel et al. (2016) mentioned that the different sources of AOD for the Himalayan region (especially to Nepal) are from biomass burning (mainly in mountain region) and fossil fuels combustion (in low land or Southern parts of Nepal).
To overcome biases between the model and observed AOD, monthly average regression slopes obtained from the linear regression between log elevation and AOD (Figures 4, 5) are used to correct the simulated AOD values from the model over the different stations. Results from three different methods (see section 3.6) are discussed in section 4.5.1.
4.5.1. Model Performance Evaluation After Using Different Regression Slope Values
The three different slope correction models M1, M2, and M3 are compared with the daily average dry AOD values observed from respective AERONET stations. Model evaluation statistics were calculated, and presented in Figure 10. AERONET stations in Figure 10 are arranged in such a way that the station elevations (Figure 2) are in increasing order from Lumbini to EVK2CNR in anticlockwise direction.
Figure 10
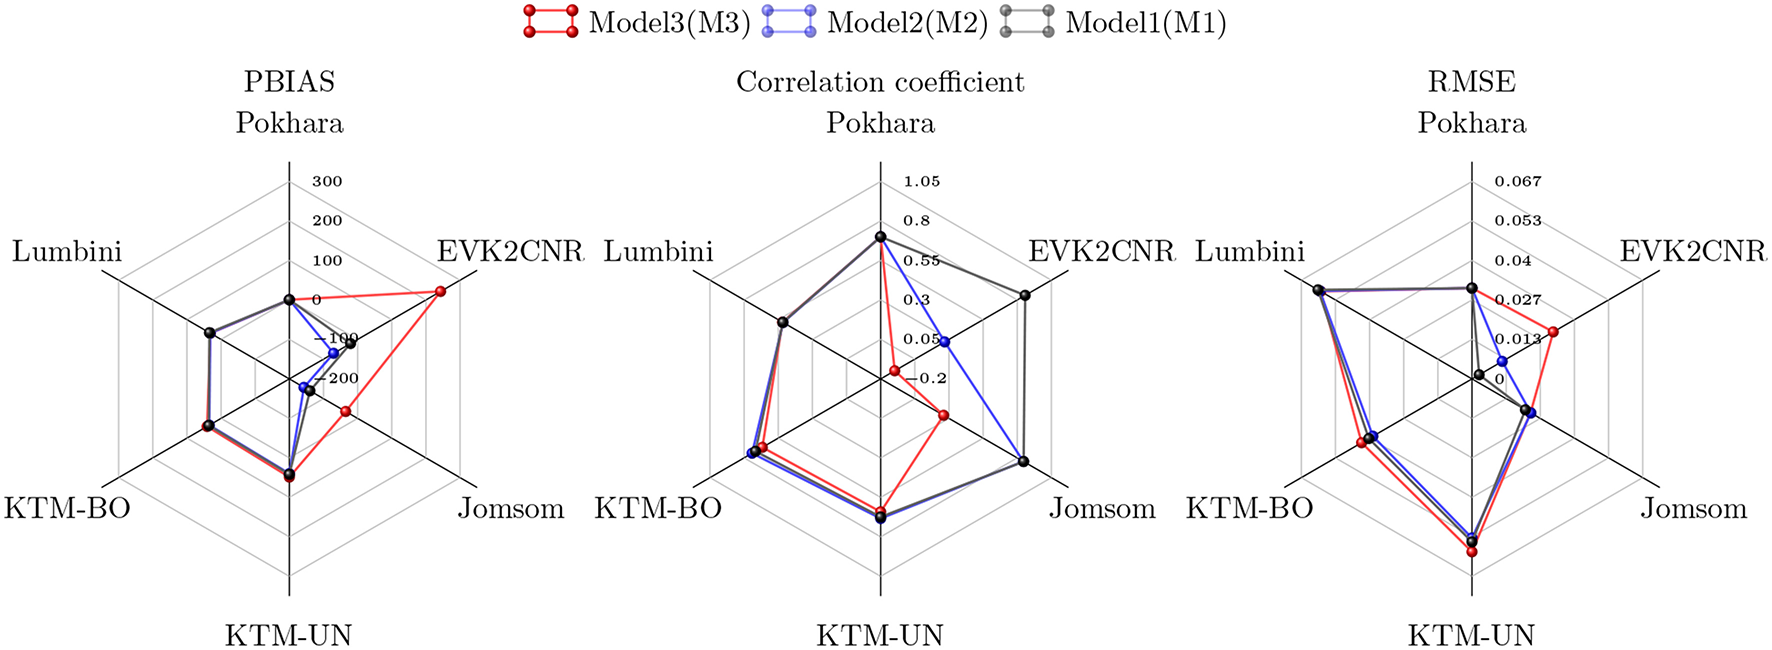
Different model evaluation statistics. Names in each axis represents location of AERONET station and are in increasing station elevation (Lumbini to EVK2CNR) order. Color lines in each radar diagram is for error statistics (correlation, PBIAS, and RMSE) for different models: M1, M2, and M3.
From the calculated error statistics (Figure 10), the models for the stations at the lower elevations are performing at a very close PBIAS, if we compare the PBIAS among all. With increasing station elevation, performance of the model decrease for M2, and M3. Performance difference can be clearly seen at EVK2CNR and Jomsom stations, where correlation coefficient of 0.1, 0.5, 0.82, RMSE of 0.018, 0.01, 0.002 with PBIAS of 136.8, −62.8, 4.9 are observed for the models M3, M2, and M1, respectively at EVK2CNR. Although a higher correlation coefficient of 0.85 is observed in Jomsom station from the model M2 than model M1 (0.83), but the PBIAS and RMSE are better for model M1 (-68.2% and 0.014) compared to M2 (91% and 0.018). M3 performs similar to M1 and M2, however, it also tends to underestimate AOD with increasing elevation. Underestimation of AOD at EVK2CNR station from the model M3, is mainly due to the steeper regression slope obtained from the available monthly average AERONET data compared to the monthly regression slopes from the monthly MODIS AOD. Referring to Figure 5, monthly regression slopes mainly in Oct, Nov, Dec, April, May, and June are steeper when compared with monthly MODIS slope as well as average slope. These steeper slopes force the model M3 to predict relatively lower AOD values resulting overall underestimation and low predictability of the model M3.
Overall, our conclusion is that M1 performs the best of the three. In addition to the improved performance the correction is most simple, using an average regression slope from MODIS, and therefore M1 is recommended for the extrapolation of AOD in the Nepalese Himalaya region. But the selection of model might be different for the different purpose of study. In a study about seasonal patterns, model correction by monthly slope might be appropriate, although the difference between these two models (M1 and M2) is not big. In Figure 11, observed and predicted AOD from M1 is presented. The correlation coefficient between the simulated AOD from model M1 and observed AOD from AERONET stations, Pokhara, Lumbini, KTM-BO, and KTM-UN are 0.7, 0.52, 0.72, and 0.67, respectively. We found that PBIAS in Pokhara, Lumbini, KTM-BO, and KTM-UN are 0.5, 34.4, 36.1, and 41.9%, respectively, indicating a general underestimation from the model. Highest RMSE (0.06) is calculated at Lumbini while the lowest is observed at Pokhara (0.03).
Figure 11
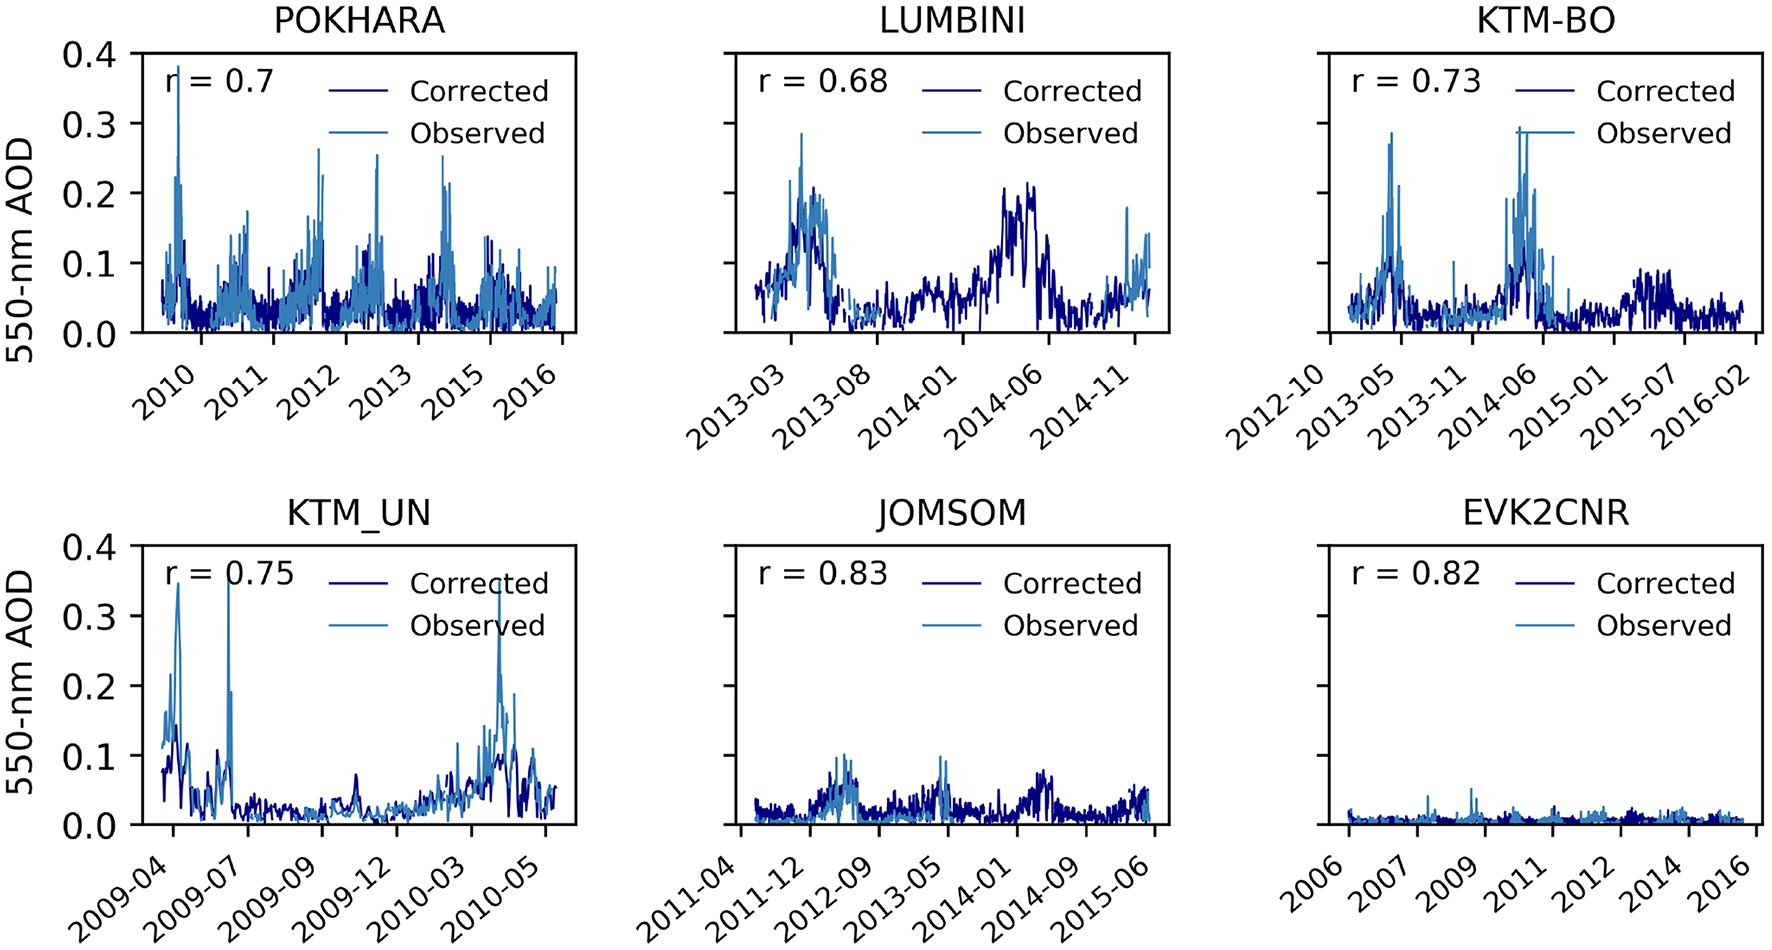
Plot between dry AOD from AERONET and predicted AOD from M1 at different AERONET stations in Nepal. Inside each plot “r” represents the Pearson correlation coefficient.
To better understand the seasonal predictability of the selected model, the longest time series of daily observed and simulated dry AOD data at Pokhara (2010–2016) and EVK2CNR AERONET stations (2006-2015) are taken in to account. During the monsoon season, the simulation give results that agree with measured dry AOD at Pokhara station where correlation coefficient of 0.89, with 0.019 RMSE, and lowest PBIAS of −0.6 were observed, and these values are better than in other seasons. In EVK2CNR, higher correlation coefficient between AERONET and simulated AOD were observed in winter (0.92), and in post-monsoon (0.89) season with RMSE of 0.002 and 0.0015, respectively. Low model performance (i.e., low correlation coefficient, large PBIAS and high RMSE) during the winter season at Pokhara is due to local air pollution. Since 87% of the energy requirement of the county is fulfilled by traditional sources like firewood, animal dung, and some paper residue leaves of trees to warm houses and as a kitchen fuels (Ranabhat et al., 2015), producing human-made aerosols in the form of smoke (Panday and Prinn, 2009). Higher model performance during the post-monsoon and winter season at EVK2CNR is due to the absence of local sources of pollution as compared to Pokhara station. Observed higher performance during the post-monsoon and winter season at EVK2VNR is also due to the number of sufficient observations during that season as the percentage of data point observations in post-monsoon and winter seasons are 35.63 and 26.24%, respectively.
4.5.2. AOD Simulation Compared With MODIS AOD
Since the simulation results from M1 is found better than the other models, it is further used to simulate dry AOD over all Nepal, and results are compared with the corresponding MODIS AOD observations. Comparison is made by calculating correlation coefficients between the simulated AOD with MODIS AOD. We found that the most of the correlation grid (see Figures 13A,B) shows that the values above 0.5 with some exception. We observed that the correlation coefficient between MODIS observation and model simulation is higher at lower elevations in Nepal. As the model is developed by using AERONET data, systematic error between MODIS observation and AERONET observation also leads to lower correlation coefficient. In addition to systematic errors between the two observations, the impact of clouds and coarse spatial resolution of MODIS (10 × 10 km) may also introduce other uncertainties. Figure 12 shows the seasonal distribution of model AOD over Nepal. It follows the same seasonal distribution as we found from MODIS observation.
Figure 12
Seasonal average AOD over Nepal from the M1.
Figure 13
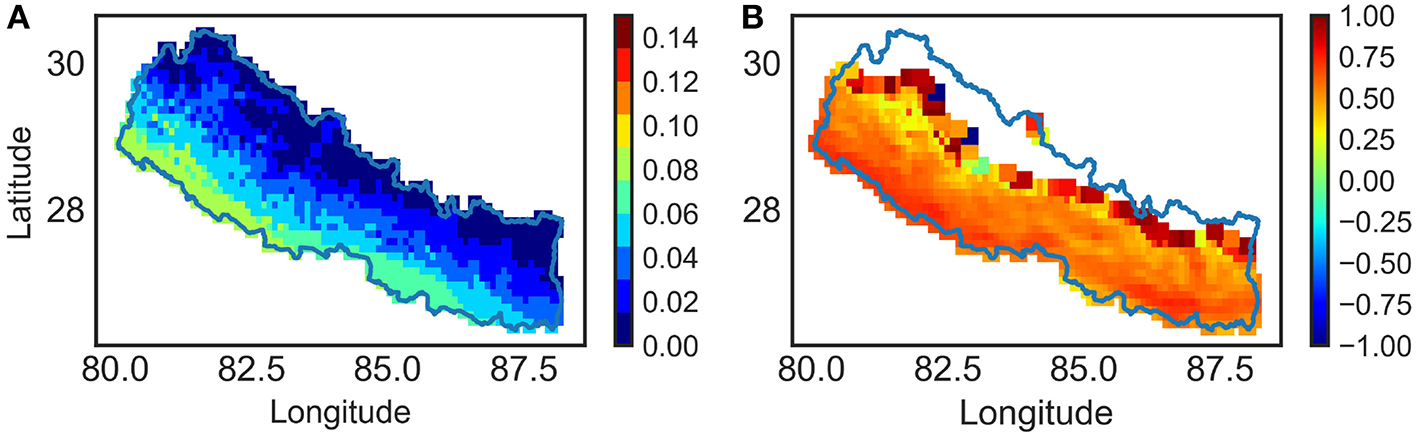
(A) Spatial average dry AOD (2000–2015) from daily model simulation over whole Nepal. (B) Correlation coefficient between M1 output and AOD from MODIS satellite in dry form for each grid cell over Nepal.
4.5.3. Seasonal AOD From MODIS and Model
Figures 6, 12 show the seasonal distribution of dry AOD from MODIS and model. From both, highest AOD is observed during winter and pre-monsoon season and lower AOD during the monsoon and post-monsoon season. In winter spatial distribution of dry AOD shows that for most of the southern part of Nepal, moderate to high values prevail. Cold surface conditions in winter, mostly in the southern plain region of Nepal, produces very dense mist, haze, and fog, through water vapor condensation on carbonaceous aerosol particles from biomass burning leading to elevated AOD, which is well-captured by MODIS observation. Higher average AOD values are observed over the Terai region which may be attributed to biomass burning activity during colder weather (Wang et al., 2013). Increased burning activity, in association with emission from industrial and fossil fuel burning (especially in Terai), also increases atmospheric AOD loading.
In pre-monsoon season, the shifting of the inter tropical convergence zone to Indo-Gangetic plain produces intense heating of the surface resulting in moderate to strong westerlies winds (Nayava, 1980). These westerlies are also associated with strong dust storms (Acharya and Sreekesh, 2013) occurring mostly over the southern part of Nepal, transferring large amounts of dust to the air leading to higher AOD in the atmosphere (Figure 6). The spatial variability of AOD is also controlled by the surface moisture content during this period. Intense temperature, in association with strong surface winds during pre-monsoon, plays an important role in heating and lifting the loose soil. The onset of gusty winds during the pre-monsoon (Shea et al., 2015) caused by convectional instability, produces a large amount of dust aerosol locally leads to an increase in AOD during this season (Flossmann et al., 1985).
The monsoon climate over Nepal controls the seasonal aerosol concentration in the atmosphere. Lower AOD during monsoon is observed from model and MODIS observation (Figures 6, 12). The lower AOD is due to the significant amount of rainfall which occurs during the monsoon, accounting for 60-90% of the total annual rainfall (Nayava, 1980). Higher amount of rainfall leads to higher relative humidity forcing model to predict lower AOD value. Therefore, the concentration of aerosol particles is reduced during this season as they are rapidly removed from the atmosphere through wet deposition (Gonçalves et al., 2010) which is well-captured by model and MODIS. Despite a strong dependence on the monsoon, interestingly the total average MODIS AOD value over Nepal during the monsoon season (0.02) is higher than during winter season (0.017). However, this potentially arises by choosing a fixed date for the monsoon season, rather than meteorological thresholds. Due to the fact that the timing for onset of monsoon in each year is not constant, the AOD values may be rather elevated if the monsoon rains have not yet initiated, leading to higher average values than in winter season. Figures 6, 12 clearly show that the AOD is higher in the western part than in eastern regions. This is a result due to the onset of monsoon from the east (Bhatt and Nakamura, 2005), and slowly moving toward the western region.
By the end of the monsoon, aerosol levels start to rise again during the post-monsoon seasons. It is the transition period between the wet and dry seasons. Retreat of the monsoon trough is accompanied by a high-pressure cell positioned over the Tibetan plateau, generally called the Tibetan high. The cold north-easterly wind from this high-pressure cell spreads over southern Nepal, and makes the surface air relatively dense, restricting the effective convection mechanism. As a result, aerosols are closer to the surface, yielding a large backscattering fraction that increases AOD levels in Terai region (Figures 6, 12). The spatial variability seen in the post-monsoon season shows typical AOD levels in the eastern and south-western parts of Nepal, respectively. As the eastern part of Nepal receives more precipitation compared to the western part (Department of Hydrology and Meteorology Government of Nepal, 2017), AOD distribution over this region is also different, as can be seen in Figures 1, 13. Variability in weather patterns, as well as the nature, and intensity of emissions, produces such dramatic variation in the spatial profile.
After the simulated AOD from model are compared with the MODIS AOD data, model is further used to extrapolate AOD over the cryospheric portion of Nepal, and presented in Figure 13A. It is evident that the model is also able to predict relatively higher AOD value in river valleys (line toward north at around N29, E83.5 in Figure 13A) with settlements, as compared with surrounding mountainous peaks with snow, which was not detected from MODIS instrument, ascertaining its ability to predict with ground reality.
4.5.4. Uncertainty in the Model Prediction
Effective AOD prediction is a complex issue that is easily affected by various factors, including weather and climatic conditions, and emission fluxes. Different input factors as an independent variables also have different degree of impact on the regression results used for dry AOD prediction. In the studied region, AOD is highly seasonal and altitude dependent, inclusion of altitudinal correction factor improves the predictability of the model. However, this study only predicted dry AOD for Nepal, but did not take into consideration any regional differences in the atmospheric environment. Although the results were good, few uncertainties are remained. First, uncertainties in the AOD data sources: on the one hand, this was a reflection of the uneven spatial distribution and few monitoring AERONET station, which are mainly in lower elevation region. Second, uncertainties in the ERA Interim data which were more prone to generating random noise, which affected prediction accuracies. And the third is the uncertainties in the proposed model itself. This study only assumed a possible linear relationship between AOD and three meteorological variables but did not consider the emission fluxes and sources, which would have an impact on the effectiveness of the model. Depending on the region and time period, significant differences exist in dry AOD. The good predictions achieved by the model proposed here were limited to Nepal and over short duration. Further examination would be needed to determine whether the developed proxy model could be applied to dry AOD predictions at other mountain region with longer time periods.
5. Conclusions
This paper presented dry AOD retrieval methods over the cryospheric portion of Nepalese Himalayas. Multivariate regression analysis is carried out to develop proxy an empirical model to predict AOD in dry forms. Three meteorological variables (relative humidity and 10 m wind velocity components) from ERA-Interim, and AOD observation at Pokhara AERONET station (in dry forms) were taken into account for model development. We have presented the results from the model corrected using average regression slope from MODIS (M1). Simulated dry AOD from developed empirical proxy model is validated with AERONET observations. Results showed that the presented model (M1) is able to simulate dry AOD over the different regions of Nepal, indicating model adequacy and establishing the model as an efficient AOD prediction model for Himalayan region. From both MODIS and model, highest dry AOD are observed during winter and pre-monsoon seasons. There are some discrepancies between observed and model values. The possible reason behind this discrepancies are because of the observed AOD represent sample of the population whose mean should correspond to the values predicted by the model. In this empirical proxy model, emission flux and sources are not considered while developing model. Therefore, prediction from model have biases with observations, and also in the case of few measurement data, it is very difficult to validate model results with the fewer observation. With limited observed data, presented proxy model shows sufficient number of grid cells with higher correlation coefficients indicating its adequacy as proxy AOD prediction model for Himalayan region. Identifying the source of aerosol is beyond the scope of this study but as mention in several studies, aerosols over Nepal are transported from Indo-Gangetic plain. The repeated occurrence of forest fires (especially in hilly plain region during pre-monsoon season) contributed to AOD over Nepal. Thus, it can be concluded that the spatial variability of AOD depends upon weather condition, and emission sources, which are subject to change with seasons.
The results of this paper confirms that the use of even the simplest linear regression model will yield very good estimation results for daily average dry AOD data in Nepal. These simple models are indispensable prediction tools for scientist requiring AOD information in the data sparse Himalayan region. It is evident that the model from multivariate regression analysis has universality in statistics, and it can be able to predict most of the spatial AOD variability in the Himalayan regions. It is especially useful for the situation where we do not have explicit knowledge about the AOD. This includes modeling in very complex terrain where very limited observed data sources exist. We tested the model on a few available stations, but it can also be used for other regions for AOD estimation. Our proxy model only uses ASTER DEM and meteorological data from ECMWF, and therefore, these models could be easily applied to other regions with mountain environment, and in related climate research in mountain region.
Statements
Author contributions
BB and JB designed the analysis. BB performed the experiments, derived the models, and analyzed the data. BB and JB wrote the manuscript with input from FS and C-YX who also provided expertise on the statistical modeling.
Funding
This work was conducted within the Strategic Research Initiative Land Atmosphere Interaction in Cold Environments (LATICE) of the University of Olso and partially supported through the Norwegian Research Council's INDNOR program under the Hydrologic sensitivity to Cryosphere-Aerosol interaction in Mountain Processes (HyCAMP) project (NFR no. 222195).
Acknowledgments
We were thankful to entire MODIS science team and NASA providing aerosol data.
Conflict of interest
The authors declare that the research was conducted in the absence of any commercial or financial relationships that could be construed as a potential conflict of interest.
Supplementary material
The Supplementary Material for this article can be found online at: https://www.frontiersin.org/articles/10.3389/feart.2019.00178/full#supplementary-material
References
1
AcharyaP.SreekeshS. (2013). Seasonal variability in aerosol optical depth over India: a spatio-temporal analysis using the MODIS aerosol product. Int. J. Rem. Sens.34, 4832–4849. 10.1080/01431161.2013.782114
2
AdlerJ.ParmrydI. (2010). Quantifying colocalization by correlation: the pearson correlation coefficient is superior to the Mander's overlap coefficient. Cytometry77, 733–742. 10.1002/cyto.a.20896
3
AlamK.Us SaharN.IqbalY. (2014). Aerosol characteristics and radiative forcing during pre-monsoon and post-monsoon seasons in an urban environment. Aerosol Air Qual. Res.14, 99–107. 10.4209/aaqr.2013.05.0154
4
AlexandrovM. D.GeogdzhayevI. V.TsigaridisK.MarshakA.LevyR.CairnsB. (2016). New statistical model for variability of aerosol optical thickness: theory and application to MODIS data over ocean. J. Atmos. Sci.73, 821–837. 10.1175/JAS-D-15-0130.1
5
BendelR. B.AfifiA. A. (1977). Comparison of stopping rules in forward “Stepwise” regression. J. Am. Stat. Assoc.72, 46–53.
6
BerrisfordP.DeeD. P.PoliP.BruggeR.FieldingK.FuentesM.et al. (2011). The ERA-Interim Archive Version 2.0. Reading: Shinfield Park.
7
BhattB. C.NakamuraK. (2005). Characteristics of monsoon rainfall around the Himalayas revealed by TRMM precipitation radar. Am. Meteorol. Soc.133:17. 10.1175/MWR-2846.1
8
BonasoniP.CristofanelliP.MarinoniA.VuillermozE.AdhikaryB. (2012). Atmospheric pollution in the Hindu Kush–Himalaya region. Mount. Res. Dev.32, 468–479. 10.1659/MRD-JOURNAL-D-12-00066.1
9
CBS (2012). National Population and Housing Census 2011(National Report), Vol. 1. Kathmandu: Government of Nepal, National Planning Commission Secretariat, Central Bu reau of Statistics, 1–278.
10
CBS. (2014). Nepal in Figures. Technical report, Central Bureau of Statistics, Government of Nepal, National Planning Commission Secretariat, Kathmandu, Nepal.
11
ChaiT.DraxlerR. R. (2014). Root mean square error (RMSE) or mean absolute error (MAE)?–Arguments against avoiding RMSE in the literature. Geosci. Model Dev.7, 1247–1250. 10.5194/gmd-7-1247-2014
12
CharlsonR. J.SchwartzS. E.HalesJ. M.CessR. D.CoakleyJ. A.HansenJ. E.et al. (1992). Climate forcing by anthropogenic aerosols. Science255, 423–30.
13
ChuD. A.KaufmanY. J.IchokuC.RemerL. A.TanréD.HolbenB. N. (2002). Validation of MODIS aerosol optical depth retrieval over land. Geophys. Res. Lett.29:8007. 10.1029/2001GL013205
14
ChylekP.WongJ. (1995). Effect of absorbing aerosols on global radiation budget. Geophys. Res. Lett.22, 929–931.
15
CristofanelliP.PuteroD.AdhikaryB.LandiT. C.MarinoniA.DuchiR.et al. (2014). Transport of short-lived climate forcers/pollutants (SLCF/P) to the Himalayas during the South Asian summer monsoon onset. Environ. Res. Lett.9:084005. 10.1088/1748-9326/9/8/084005
16
de LeeuwG.AndreasE. L.AnguelovaM. D.FairallC. W.LewisE. R.O'DowdC.et al. (2011). Production flux of sea spray aerosol. Rev. Geophys.49:RG2001. 10.1029/2010RG000349
17
Department of Hydrology and Meteorology Government of Nepal (2017). Observed Climate Trend Analysis of Nepal (1971–2014). Kathmandu: Government of Nepal, Ministry of Population and Environment, Department of Hydrology and Meteorology.
18
DhungelS.KathayatB.MahataK.PandayA. (2016). Transport of regional pollutants through a remote trans-Himalayan valley in Nepal. Atmos. Chem. Phys.18, 1–23. 10.5194/acp-2016-824
19
DingmannL. S. (2015). Physical Hydrology, 3rd Edn.Long Grove, IL: Waveland Press, INC.
20
EckT. F.HolbenB. N.ReidJ. S.DubovikO.SmirnovA.O'NeillN. T.et al. (1999). Wavelength dependence of the optical depth of biomass burning, urban, and desert dust aerosols. J. Geophys. Res. Atmos.104, 31333–31349.
21
FlossmannA.HallW.PruppacherH. (1985). A theoretical study of the wet removal of atmospheric pollutants. Part I: the redistribution of aerosol particles captured through nucleation and impaction scavenging by growing cloud drops. J. Atmos. Sci.42, 583–606.
22
FujisadaH.BaileyG. B.KellyG. G.HaraS.AbramsM. J. (2005). ASTER DEM performance. IEEE Trans. Geosci. Rem. Sens.43, 2707–2713. 10.1109/TGRS.2005.847924
23
GonçalvesF. L. T.BehengK. D.MassambaniO.VautzW.KlockowD. (2010). Scavenging processes of atmospheric particulate matter: a numerical modeling of case studies. Rev. Brasil. Meteorol.25, 437–447. 10.1590/S0102-77862010000400003
24
GovaertsY. M.WagnerS.LattanzioA.WattsP. (2010). Joint retrieval of surface reflectance and aerosol optical depth from MSG/SEVIRI observations with an optimal estimation approach: 1. Theory. J. Geophys. Res.115:D02203. 10.1029/2009JD011779
25
GuleriaR. P.KuniyalJ. C.RawatP. S.ThakurH. K.SharmaM.SharmaN. L.et al. (2012). Validation of MODIS retrieval aerosol optical depth and an investigation of aerosol transport over Mohal in north western Indian Himalaya. Int. J. Rem. Sens.33, 5379–5401. 10.1080/01431161.2012.657374
26
HolbenB.EckT.SlutskerI.TanréD.BuisJ.SetzerA.et al. (1998). AERONET–a federated instrument network and data archive for aerosol characterization. Rem. Sens. Environ.66, 1–16.
27
HussM. (2013). Density assumptions for converting geodetic glacier volume change to mass change. Cryosphere7, 877–887. 10.5194/tc-7-877-2013
28
IchiyanagiK.YamanakaM. D.MurajiY.VaidyaB. K. (2007). Precipitation in Nepal between 1987 and 1996. Int. J. Climatol.27, 1753–1762. 10.1002/joc.1492
29
IchokuC.ChuD. A.MattooS.KaufmanY. J.RemerL. A.TanréD.SlutskerI.HolbenB. N. (2002). A spatio-temporal approach for global validation and analysis of modis aerosol products. Geophys. Res. Lett.29:MOD1-1. 10.1029/2001GL013206
30
IstominaL. G.von Hoyningen-HueneW.KokhanovskyA. A.BurrowsJ. P. (2009). “The retrieval of aerosol optical thickness over snow using AATSR observations,” in American Geophysical Union, Fall Meeting 2009, Abstract NO. A11C-0112.
31
IstominaL. G.Von Hoyningen-HueneW.KokhanovskyA. A.SchultzE.BurrowsJ. P. (2011). Remote sensing of aerosols over snow using infrared AATSR observations. Atmos. Meas. Tech.4, 1133–1145. 10.5194/amt-4-1133-2011
32
KaskaoutisD. G.KambezidisH. D.HatzianastassiouN.KosmopoulosP. G.BadarinathK. V. S. (2007). Aerosol climatology: dependence of the Angstrom exponent on wavelength over four AERONET sites. Atmos. Chem. Phys. Discuss.7, 7347–7397. 10.5194/acpd-7-7347-2007
33
KaufmanY. J.TanreD.BoucherO. (2002). A satellite view of aerosols in the climate system. Nature419, 215–223. 10.1038/nature01091
34
KaufmanY. J.TanréD.RemerL. A.VermoteE. F.ChuA.HolbenB. N. (1997). Operational remote sensing of tropospheric aerosol over land from EOS moderate resolution imaging spectroradiometer. J. Geophys. Res. Atmos.102, 17051–17067.
35
Khatibi BardsiriV.JawawiD. N. A.HashimS. Z. M.KhatibiE. (2014). A flexible method to estimate the software development effort based on the classification of projects and localization of comparisons. Emp. Softw. Eng.19, 857–884. 10.1007/s10664-013-9241-4
36
KimD.WangC.EkmanA. M. L.BarthM. C.LeeD.-I. (2014). The responses of cloudiness to the direct radiative effect of sulfate and carbonaceous aerosols. J. Geophys. Res. Atmos.119, 1172–1185. 10.1002/2013JD020529
37
KinneS.O'DonnelD.StierP.KlosterS.ZhangK.SchmidtH.et al. (2013). MAC-v1: a new global aerosol climatology for climate studies. J. Adv. Model. Earth Syst.5, 704–740. 10.1002/jame.20035
38
KleiberC. (2001). Finite sample efficiency of OLS in linear regression models with long-memory disturbances. Econ. Lett.72, 131–136. 10.1016/S0165-1765(01)00423-2
39
KopaczM.MauzerallD. L.WangJ.LeibenspergerE. M.HenzeD. K.SinghK. (2011). Origin and radiative forcing of black carbon transported to the Himalayas and Tibetan Plateau. Atmos. Chem. Phys.11, 2837–2852. 10.5194/acp-11-2837-2011
40
LauW. (2014). Atmospheric science: desert dust and monsoon rain. Nat. Geosci.7, 255–256. 10.1038/ngeo2115
41
LevyR. C.MattooS.MunchakL. A.RemerL. A.SayerA. M.PatadiaF.et al. (2013). The Collection 6 MODIS aerosol products over land and ocean. Atmos. Meas. Tech.6, 2989–3034. 10.5194/amt-6-2989-2013
42
LevyR. C.RemerL. A.DubovikO. (2007). Global aerosol optical propertites and application to moderate resolution imaging spectroradiometer aerosol retrival over land. J. Geophys. Res. Atmos.112, 1–15. 10.1029/2006JD007815
43
LevyR. C.RemerL. A.KleidmanR. G.MattooS.IchokuC.KahnR.et al. (2010). Global evaluation of the Collection 5 MODIS dark-target aerosol products over land. Atmos. Chem. Phys.10, 10399–10420. 10.5194/acp-10-10399-2010
44
LeysC.LeyC.KleinO.BernardP.LicataL. (2013). Detecting outliers: do not use standard deviation around the mean, use absolute deviation around the median. J. Exp. Soc. Psychol.49, 764–766. 10.1016/J.JESP.2013.03.013
45
LiA.DengW.ZhaoW. (2017). Land cover change and its eco-environmental responses in Nepal. Berlin; Heidelberg: Springer Berlin Heidelberg.
46
LiB.YuanH.FengN.TaoS. (2009). Comparing MODIS and AERONET aerosol optical depth over China. Int. J. Rem. Sens.30, 6519–6529. 10.1080/01431160903111069
47
LiC.BoschC.KangS.AnderssonA.ChenP.ZhangQ.et al. (2016). Sources of black carbon to the Himalayan–Tibetan plateau glaciers. Nat. Commun.7:12574. 10.1038/ncomms12574
48
LiJ.HanZ.ZhangR. (2014). Influence of aerosol hygroscopic growth parameterization on aerosol optical depth and direct radiative forcing over East Asia. Atmos. Res.140–141, 14–27. 10.1016/j.atmosres.2014.01.013
49
MartonchikJ. V.KahnR. A.DinerD. J. (2009). “Retrieval of aerosol properties over land using MISR observations,” in Satellite Aerosol Remote Sensing Over Land, eds KokhanovskyA. A.de LeeuwG. (Berlin; Heidelberg: Springer Berlin Heidelberg), 267–293.
50
MattF. N.BurkhartJ. F.PietikäinenJ.-P. (2018). Modelling hydrologic impacts of light absorbing aerosol deposition on snow at the catchment scale. Hydrol. Earth Syst. Sci.22, 179–201. 10.5194/hess-22-179-2018
51
MeehlG. A.ArblasterJ. M.CollinsW. D. (2008). Effects of black carbon aerosols on the Indian monsoon. J. Clim.21, 2869–2882. 10.1175/2007JCLI1777.1
52
MeiL.IstominaL.Von Hoyningen-HueneW.XueY.KokhanovskyA. A. (2012). “Aerosol optical depth retrieval over Arctic region using AATSR data,” in International Geoscience and Remote Sensing Symposium (IGARSS) (Munich), 2556–2559.
53
MeiL.XueY.KokhanovskyA. A.Von Hoyningen-HueneW.IstominaL.De LeeuwG.BurrowsJ. P.et al. (2013). Aerosol optical depth retrieval over snow using AATSR data. Int. J. Rem. Sens.34, 5030–5041. 10.1080/01431161.2013.786197
54
MillerJ. (1991). Short report: reaction time analysis with outlier exclusion: bias varies with sample size. Quart. J. Exp. Psychol.13, 907–912.
55
MoriasiD. N.ArnoldJ. G.Van LiewM. W.BingnerR. L.HarmelR. D.VeithT. L. (2007). Model evaluation guidelines for systematic quantification of accuracy in watershed simulations. Trans. ASABE50, 885–900. 10.13031/2013.23153
56
NairV. S.BabuS. S.MoorthyK. K.SharmaA. K.MarinoniA.Ajai (2013). Black carbon aerosols over the Himalayas: direct and surface albedo forcing. Tellus Chem. Phys. Meteorol.65, 0–14. 10.3402/tellusb.v65i0.19738
57
NayavaJ. L. (1974). Heavy monsoon rainfall in Nepal. Weather29, 443–450.
58
NayavaJ. L. (1980). Rainfall in Nepal. Nepal Geogr. Soc.12, 1–18.
59
NepalS.FlügelW.-A.ShresthaA. B. (2014). Upstream-downstream linkages of hydrological processes in the Himalayan region. Ecol. Process.3:19. 10.1186/s13717-014-0019-4
60
PaliwalU.SharmaM.BurkhartJ. F. (2016). Monthly and spatially resolved black carbon emission inventory of India: uncertainty analysis. Atmos. Chem. Phys.16, 12457–12476. 10.5194/acp-16-12457-2016
61
PandayA. K.PrinnR. G. (2009). Diurnal cycle of air pollution in the Kathmandu Valley, Nepal: observations. J. Geophys. Res.114:D09305. 10.1029/2008JD009777
62
ParryM.CanzianiO.PalutikofJ.van der LindenP.HansonC. (2007). Climate Change 2007: Impacts, Adaptation and Vulnerability. Cambridge, UK: Intergovernmental Panel on Climate Change.
63
PearsonK. (1895). Note on regression and inheritance in the case of two parents. Proc. R. Soc. Lond.58, 240–242.
64
PearsonK. (1896). The measurement of organs arise when indices are used in spurious correlation which may of theory of evolution–on a form mathematical contributions to the email alerting service. Proc. R. Soc. Lond.1, 489–498.
65
PrasadA. K.SinghR. P. (2007). Comparison of MISR-MODIS aerosol optical depth over the Indo-Gangetic basin during the winter and summer seasons (2000–2005). Rem. Sens. Environ.107, 109–119. 10.1016/j.rse.2006.09.026
66
RamanathanV. (2001). Aerosols, climate, and the hydrological cycle. Science294, 2119–2124. 10.1126/science.1064034
67
RamanathanV.CarmichaelG. (2008). Global and regional climate changes due to black carbon. Nat. Geosci.1, 221–227. 10.1038/ngeo156
68
RamanathanV.RamanaM. V. (2005). Persistent, widespread, and strongly absorbing haze over the Himalayan foothills and the Indo-Gangetic Plains. Pure Appl. Geophys.162, 1609–1626. 10.1007/s00024-005-2685-8
69
RamanathanV.RamanaM. V.RobertsG.KimD.CorriganC.ChungC.et al. (2007). Warming trends in Asia amplified by brown cloud solar absorption. Nature448, 575–578. 10.1038/nature06019
70
RanabhatC. L.KimC.-B.KimC.-S.JhaN.DeepakK. C.ConnelF. A. (2015). Consequence of indoor air pollution in rural area of Nepal: a simplified measurement approach. Front. Public Health3:5. 10.3389/fpubh.2015.00005
71
RemerL. A.KaufmanY. J.TanréD.MattooS.ChuD. A.MartinsJ. V.et al. (2005). The MODIS aerosol algorithm, products, and validation. J. Atmos. Sci.62, 947–973. 10.1175/JAS3385.1
72
RemerL. A.MattooS.LevyR. C.MunchakL. A. (2013). MODIS 3 km aerosol product: algorithm and global perspective. Atmos. Meas. Tech.6, 1829–1844. 10.5194/amt-6-1829-2013
73
RouxL.Le Roux ÃG.PourcelotL.MassonO.DuffaC.-oise VrayF.et al. (2008). Open Archive TOULOUSE Archive Ouverte (OATAO) aerosol deposition and origin in French mountains estimated with soil inventories of 210 Pb and artificial radionuclides. Atmos. Environ.42, 1517–1524. 10.1016/j.atmosenv.2007.10.083
74
SafarpourS.AbdullahK.LimH. S.DadrasM. (2014). Accuracy assessment of Terra-MODIS aerosol optical depth retrievals. IOP Conf. Series Earth Environ. Sci.20:012059. 10.1088/1755-1315/20/1/012059
75
SayerA. M.HsuN. C.BettenhausenC.JeongM.-J. (2013). Validation and uncertainty estimates for MODIS Collection 6 “Deep Blue”aerosol data. J. Geophys. Res. Atmos.118, 7864–7872. 10.1002/jgrd.50600
76
SheaJ. M.WagnonP.ImmerzeelW. W.BironR.BrunF.PellicciottiF. (2015). A comparative high-altitude meteorological analysis from three catchments in the Nepalese Himalaya. Int. J. Water Resour. Dev.31, 174–200. 10.1080/07900627.2015.1020417
77
ShresthaA. B.WakeP. C.DibbJ. E.MayewskiP. A.WhitlowS. I.CarmichaelG. R.et al. (2000). Seasonal variations in aerosol concentrations and compositions in the Nepal Himalaya. Atmos. Environ.34, 3349–3363. 10.1016/S1352-2310(99)00366-0
78
SilhavyR.SilhavyP.ProkopovaZ. (2017). Analysis and selection of a regression model for the use case points method using a stepwise approach. J. Syst. Softw.125, 1–14. 10.1016/j.jss.2016.11.029
79
SolomonS.QinD.ManningM.AverytK.MarquisM. (2007). Climate Change 2007-The Physical Science Basis: Working Group I Contribution to the Fourth Assessment Report of the IPCC. Vol. 4. Cambridge, UK: Cambridge University Press.
80
SoniA. K. (2015). Mining in the Himalayas: An Integrated Strategy.CRC Press
81
SriramG.KrishnamohanN.GopalasamyV. (2004). Analysis of skewness and kurtosis for ambient air quality monitoring data Neyveli thermal plants. J. Sci. Ind. Res.63, 769–775.
82
SrivastavaA. K.DeyS.TripathiS. N. (2012). “Aerosol characteristics over the Indo-Gangetic basin: implications to regional climate,” in Atmospheric Aerosols-Regional Characteristics-Chemistry and Physics, ed HayderA.-R. (London, UK: InTech).
83
TanabeJ.MillerD.TregellasJ.FreedmanR.MeyerF. G. (2002). Comparison of detrending methods for optimal fMRI preprocessing. Neuroimage15, 902–907. 10.1006/nimg.2002.1053
84
TripathiS. N.PattnaikA.DeyS. (2007). Aerosol indirect effect over Indo-Gangetic plain. Atmos. Environ.41, 7037–7047. 10.1016/j.atmosenv.2007.05.007
85
WangS.-Y.YoonJ.-H.GilliesR. R.ChoC.WangS.-Y.YoonJ.-H.et al. (2013). What caused the winter drought in western Nepal during recent years?J. Clim.26, 8241–8256. 10.1175/JCLI-D-12-00800.1
86
ZhangY.ForristerH.LiuJ.DibbJ.AndersonB.SchwarzJ. P.et al. (2017). Top-of-atmosphere radiative forcing affected by brown carbon in the upper troposphere. Nat. Geosci.10, 486–489. 10.1038/ngeo2960
87
ZhengC.ZhaoC.ZhuY.WangY.ShiX.WuX.et al. (2017). Analysis of influential factors for the relationship between PM2.5 and AOD in Beijing. Atmos. Chem. Phys. Discuss. Chem. Phys.1170, 1–57. 10.5194/acp-2016-1170
Summary
Keywords
Himalaya, MODIS aerosol optical depth, AERONET aerosol optical depth, empirical model, cryosphere
Citation
Bhattarai BC, Burkhart JF, Stordal F and Xu C-Y (2019) Aerosol Optical Depth Over the Nepalese Cryosphere Derived From an Empirical Model. Front. Earth Sci. 7:178. doi: 10.3389/feart.2019.00178
Received
11 July 2018
Accepted
24 June 2019
Published
05 July 2019
Volume
7 - 2019
Edited by
Pavla Dagsson-Waldhauserova, Agricultural University of Iceland, Iceland
Reviewed by
Prasenjit Acharya, Vidyasagar University, India; Shubha Verma, Indian Institute of Technology Kharagpur, India; Tommaso Zanca, University of Helsinki, Finland
Updates
Copyright
© 2019 Bhattarai, Burkhart, Stordal and Xu.
This is an open-access article distributed under the terms of the Creative Commons Attribution License (CC BY). The use, distribution or reproduction in other forums is permitted, provided the original author(s) and the copyright owner(s) are credited and that the original publication in this journal is cited, in accordance with accepted academic practice. No use, distribution or reproduction is permitted which does not comply with these terms.
*Correspondence: Bikas Chandra Bhattarai b.c.bhattarai@geo.uio.no
This article was submitted to Cryospheric Sciences, a section of the journal Frontiers in Earth Science
Disclaimer
All claims expressed in this article are solely those of the authors and do not necessarily represent those of their affiliated organizations, or those of the publisher, the editors and the reviewers. Any product that may be evaluated in this article or claim that may be made by its manufacturer is not guaranteed or endorsed by the publisher.