Remagnetization of Marcellus Formation in the Plateau Province of the Appalachian Basin
 Alex Kayla Steullet
 R. Douglas Elmore
 Matt Hamilton2
 - 1Noble Energy, Houston, TX, United States
- 2School of Geosciences, The University of Oklahoma, Norman, OK, United States
An integrated paleomagnetic, magnetic fabric, and petrographic study of two cores (EC, oriented; DB, unoriented) in the Devonian Marcellus Formation from the Plateau Province (PA) indicates the presence of chemical remanent magnetizations (CRMs) and extensive diagenetic alteration. Anisotropy of magnetic susceptibility results indicate a predominately oblate fabric. Some specimens contain a prolate fabric that is interpreted as diagenetically altered. A well-developed viscous magnetization, possibly contaminated by a drilling induced component, is not present in either core, and cannot be used for orientation. An intermediate temperature component (ITN) with steep down inclinations is removed in both cores below ∼300°C. Specimens in DB also contain a component with steep up inclinations (ITR) that is removed between 300 and 440°C. The ITN is interpreted to reside in magnetite and/or possibly pyrrhotite, and the ITR resides in magnetite. The ITN could be a reversal of ITR, acquired in the Cretaceous to Cenozoic based on a comparison with the expected inclinations. Alternatively, the ITN could be a contaminated by a Brunhes viscous magnetization. Specimens from both cores contain a characteristic remanent magnetization (ChRM) with shallow inclinations that is removed by 500°C in DB and 460°C in EC, and is interpreted to reside in magnetite. The DB ChRM has an inclination of −9.0°, which corresponds to a range of ages between 310 and 225 Ma based on the expected inclinations. The ChRM in EC has streaked declinations, which may have been caused by core barrel rotation. Shallow inclinations (−3.7°) in this core suggest a range of acquisition from 305 to 230 Ma. Rock magnetic data are consistent with the presence of magnetite but provide conflicting evidence for pyrrhotite. The ChRM in DB is interpreted as a CRM whereas the ChRM in EC could be thermoviscous in origin. Diagenetic studies indicate a complex paragenesis with authigenic minerals such as barite, sphalerite, baroque dolomite, and sylvite suggestive of alteration by external fluids. The presence of the CRM in highly altered zones suggests it is related to alteration by external fluids, although its presence in other facies suggests that burial diagenetic processes could also be a cause of remagnetization.
Introduction
The recent proliferation of unconventional oil and gas plays such as the Marcellus Formation has prompted interest in the geological and geophysical characteristics of such shales. Paleomagnetic research on unconventional shale gas/oil units has been limited, partly because of the difficulty in sampling shale outcrops. Recently, however, several studies have reported paleomagnetic and rock magnetic results from both outcrops and cores of the Marcellus Formation (e.g., Manning and Elmore, 2012, 2015; Kars et al., 2015; Minguez et al., 2016). Several of the studies report that the Marcellus Formation is remagnetized (e.g., Manning and Elmore, 2012, 2015) and contains neoformed magnetite and pyrrhotite (Kars et al., 2015). Minguez et al. (2016) report that the Marcellus Formation contains a primary as well as secondary magnetizations.
Characterizing the paleomagnetism and magnetic fabric of shales like the Marcellus Formation is important from several points of view. Chemical remanent magnetizations (CRMs) can be used to date diagenetic events such as fluid processes (e.g., orogenic fluids) or burial related processes (e.g., clay diagenesis; Elmore et al., 2012). Determining the origin of secondary magnetizations is also important to better understand remagnetization mechanisms which can aid in uncovering primary magnetizations. Magnetic fabric studies can provide information on tectonism, compaction, and diagenesis (e.g., Schwehr et al., 2006; Parés, 2015; Heij and Elmore, 2019). Integrating petrography with paleomagnetic studies can also address fundamental diagenetic issues such as whether shales are open or closed systems (e.g., Land et al., 1997; Bjørlykke and Jahren, 2012; Elmore et al., 2016).
The objective of this study is to investigate the Marcellus Formation in two cores from the Plateau Province in Pennsylvania (Figure 1) using an integrated paleomagnetic, rock magnetic, magnetic fabric, and petrographic approach. The results are used to test the origin of the magnetizations (primary or secondary) and the mechanisms of remagnetization (e.g., burial diagenesis or external fluids). The results are compared to paleomagnetic, rock magnetic, and diagenetic studies of the Marcellus Formation in outcrop (Manning and Elmore, 2012, 2015) and in core (Minguez et al., 2016) from the Valley and Ridge Province.
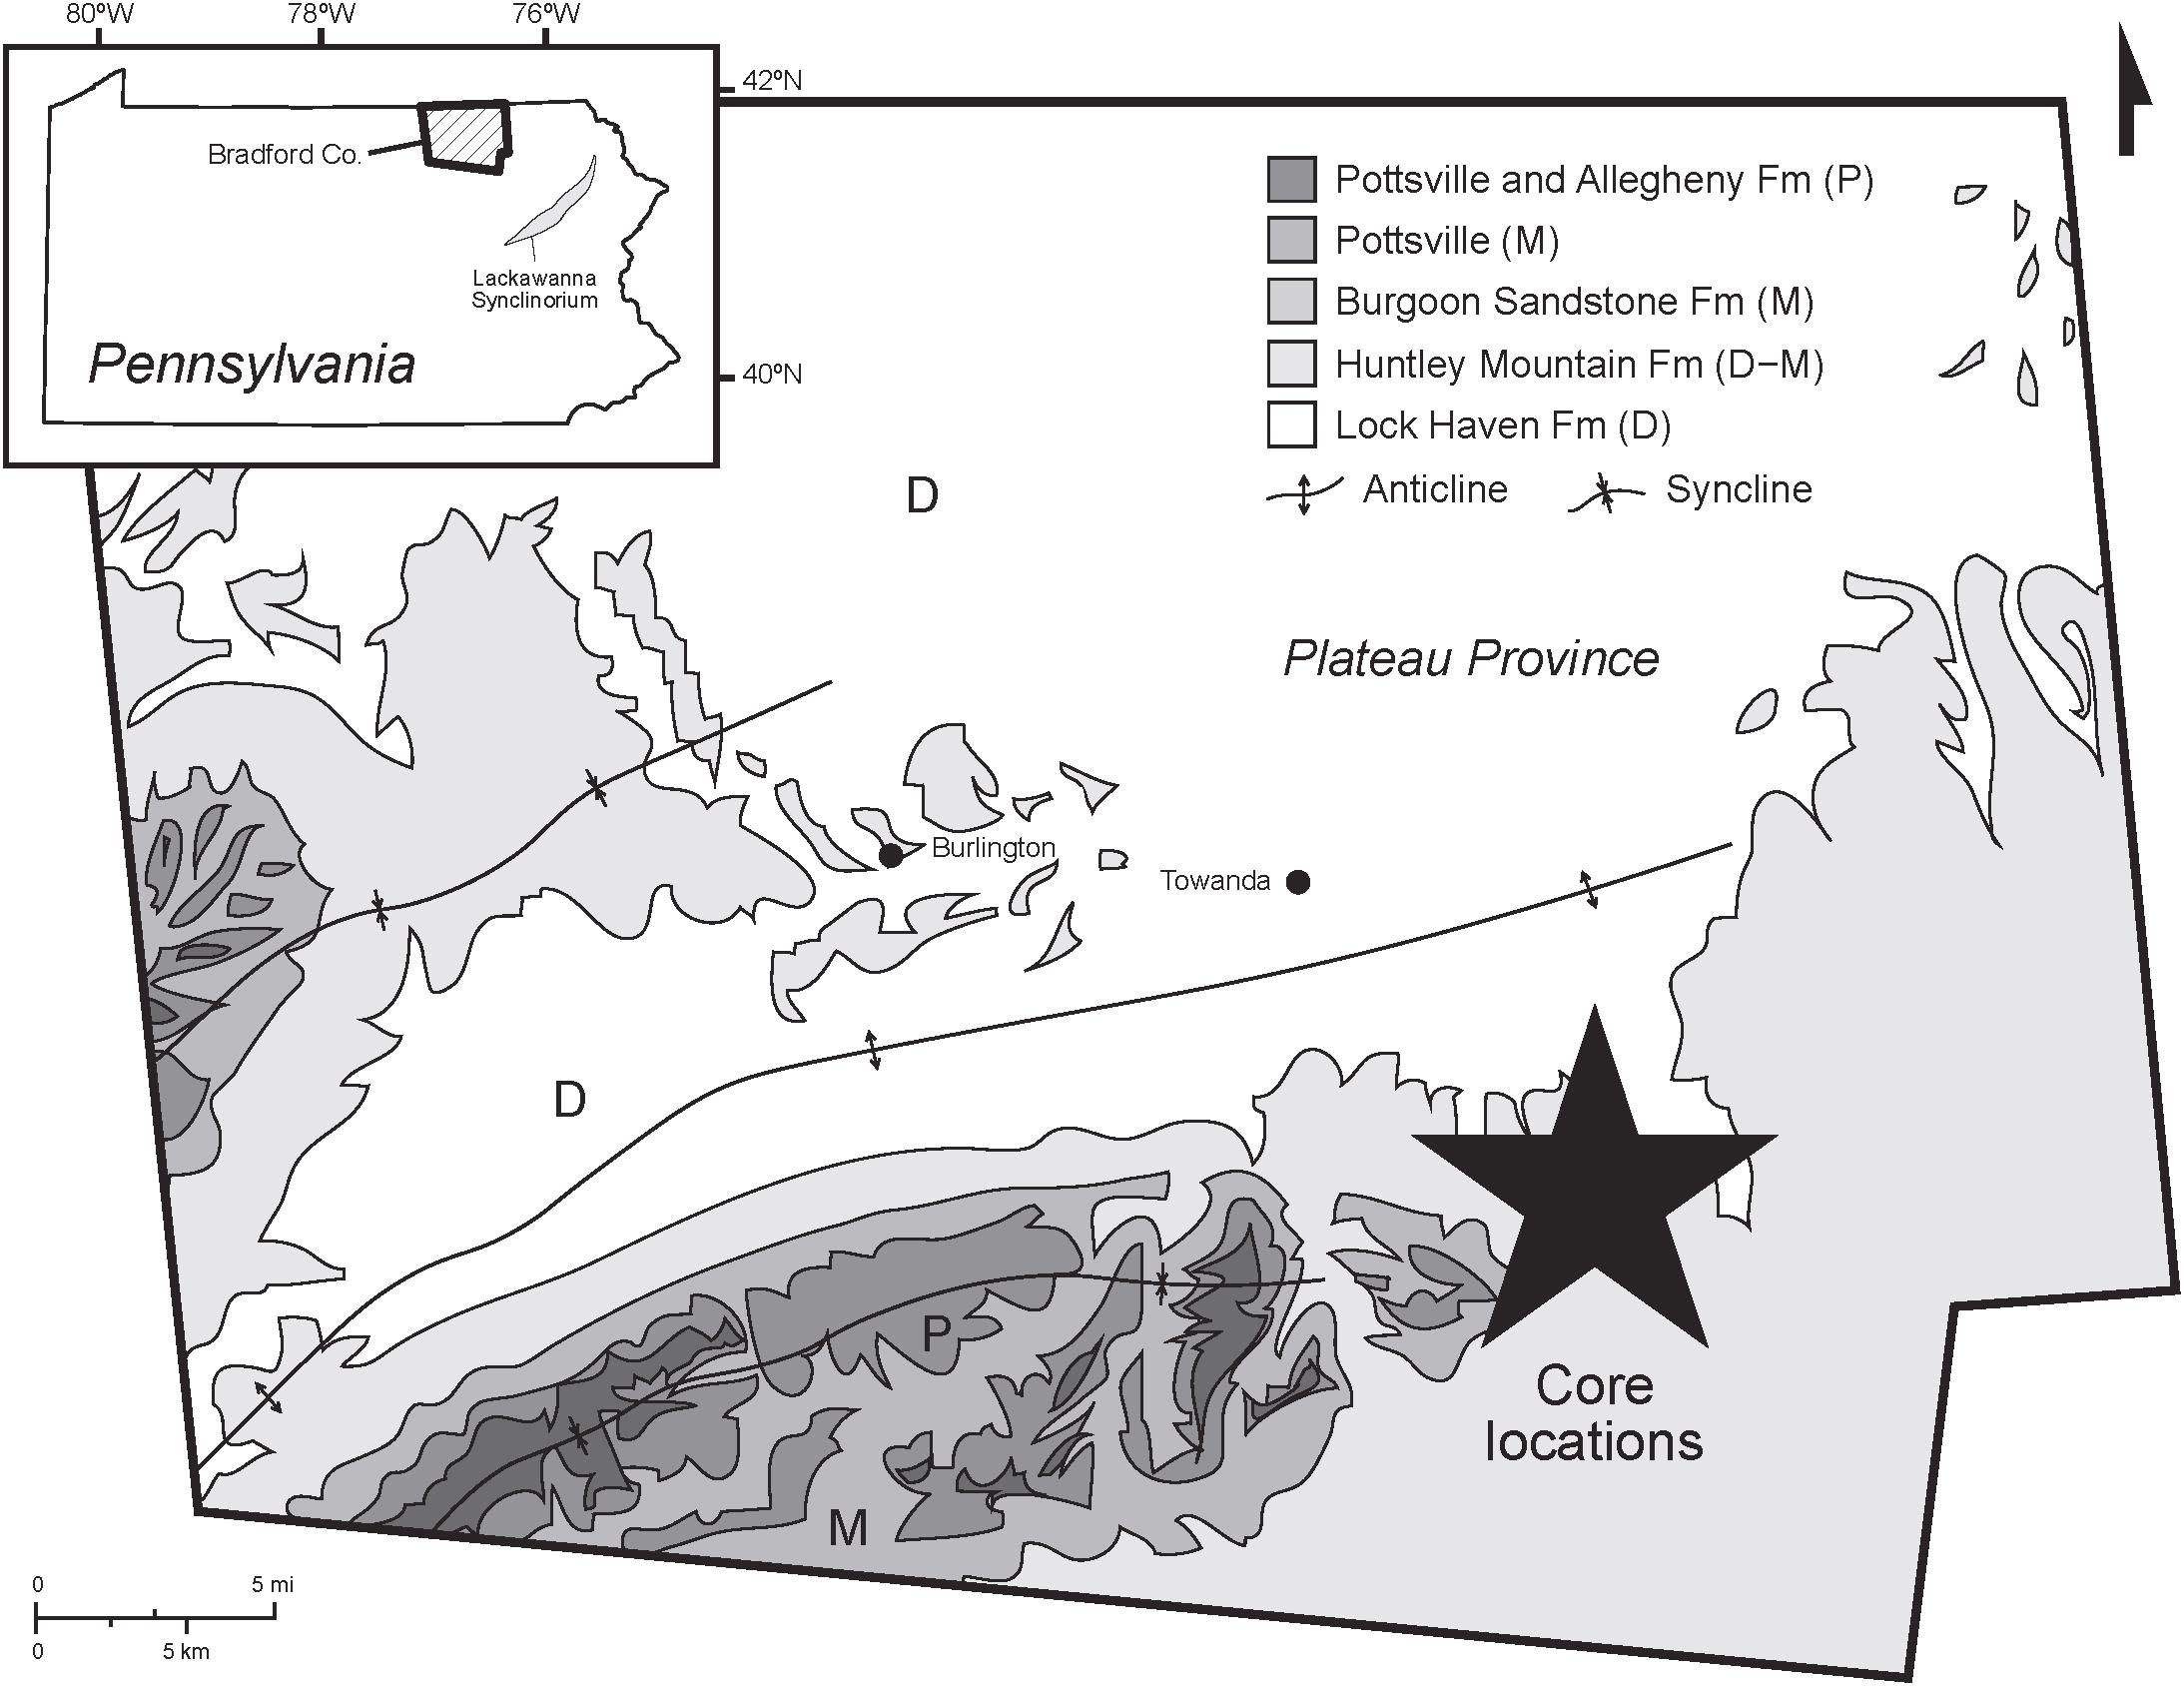
Figure 1. Geologic map showing the study area in Bradford County, PA. The star indicates core locations (Modified from Berg et al., 1980).
In addition, challenges of working with both oriented and unoriented cores are addressed. One core (DB) is unoriented and the other (EC) is oriented. In studies of unoriented cores, the viscous remanent magnetization (VRM) has been utilized in an attempt to orient the core (e.g., Van der Voo and Watts, 1978; Rolphe et al., 1995; Dennie et al., 2012). We evaluate this method to orient the DB core and compare the results to the oriented EC core. In addition, we evaluate using the “inclination only” approach to determine the age of the magnetization(s). We also test for the possibility of a drilling induced magnetization (e.g., Audunsson and Levi, 1989; Wall and Worm, 2001).
Geologic Background
The Devonian Marcellus Formation, the lowest unit in the Hamilton Group, consists of the Union Springs Member at the base, the Cherry Valley Limestone or equivalent shales and sandstones in the middle, and the Oatka Creek Member at the top (Lash and Engelder, 2011). The Marcellus Formation overlies the Onondaga Limestone, and is overlain by the Mahantango Formation of the Hamilton Group (Sageman et al., 2003). The Marcellus Formation is one of the most extensive unconventional shale gas units in the United States (Wang and Carr, 2013). The Marcellus Formation was deposited in the distal part of the Catskill Delta (Ettensohn, 1985) in the Appalachian Foreland Basin during the middle-late Devonian Acadian orogeny (Quinlan and Beaumont, 1984; Lash and Engelder, 2011). Some workers suggest the Marcellus Formation was deposited in relatively deep water (e.g., Ettensohn, 1985; Lash and Blood, 2011; Lash and Engelder, 2011) whereas other workers suggest a shallow water setting (e.g., Werne et al., 2002; Smith et al., 2019). The Marcellus Formation was deformed during the Alleghanian orogeny (Early Pennsylvanian – Late Permian) which resulted in the Plateau, the Valley and Ridge, and the Blue Ridge structural provinces (Hatcher et al., 1989). The two cores used in this study are from Bradford County in northeastern Pennsylvania (Figure 1) in the Plateau Province, where the Marcellus Formation is 91.4 m thick.
Vitrinite reflectance values (Ro) of the Marcellus Formation within the study area are high (>2.0) compared to other areas in Pennsylvania (Milliken et al., 2012; Ryder et al., 2013). To the southeast of the study area the rocks in the Lackawanna synclinorium have higher vitrinite reflectance values and anthracitic coal has been attributed to deep burial during or after the Alleghenian orogeny or to hot orogenic fluids (Harrison et al., 2004).
The Marcellus Formation has been the subject of several recent paleomagnetic/rock magnetic studies (Manning and Elmore, 2012, 2015; Kars et al., 2015; Minguez et al., 2016). Manning and Elmore (2012, 2015) studied the Marcellus Formation from outcrop exposure in the Valley and Ridge Province in West Virginia and Pennsylvania, and found three components: a VRM, and two Permian CRMs residing in pyrrhotite and magnetite. The magnetite CRM was attributed to burial diagenetic processes whereas the pyrrhotite CRM was related to thermochemical sulfate reduction (TSR) (Manning and Elmore, 2015).
Kars et al. (2015) conducted a rock magnetic study of the Marcellus Formation and other late Paleozoic sedimentary rocks in West Virginia and report the presence of neoformed magnetite as well as pyrrhotite. Minguez et al. (2016) report that the Marcellus Formation contains a Devonian primary magnetization in magnetite as well as secondary Permian and Jurassic CRMs in pyrrhotite.
There have been several anisotropy of magnetic susceptibility (AMS) studies of rocks close to the study area in the central Appalachians (e.g., Hirt et al., 1995; Burmeister et al., 2009; Manning, 2011). Hirt et al. (1995) analyzed the AMS of Devonian shale specimens from two cores in the Appalachian Plateau. They found a correlation between the NE-SW orientation of the magnetic fabrics and the alignment of the long axes of chlorite. Manning (2011) reported a similar NE-SW magnetic fabric in the Marcellus Formation in the Valley and Ridge Province. The NE-SW magnetic fabric likely reflects a tectonic influence (Hirt et al., 1995). A NNW-SSE trend in the fabric was also found in both the Hirt et al. (1995) and Manning (2011) studies.
Materials and Methods
The DB and EC cores were provided by Chesapeake Energy and were described and sampled at their core facility in Oklahoma City. The bedding in the cores was horizontal. Core plugs were collected from representative facies as well as around veins, concretions, and distinctive laminae. The EC (78.3 m) was oriented by standard industry scribe methods (e.g., Nelson et al., 1987) and the DB core (103.3 m) was not oriented.
The “butt” sections of the cores were drilled using a fixed, variable-speed, water-cooled drill press with a non-magnetic core bit to obtain the 2.5 cm diameter core plugs in this study. The core plugs were cut into standard paleomagnetic specimens (2.2 cm) using an ASC Scientific dual blade saw. Chips from the cores were used for petrographic analysis.
A total of 86 specimens were collected from DB and 54 specimens were collected from EC. Specimens were also taken from both the inner and outer sections of the core to test for a drilling induced remanent magnetization (DIRM; Audunsson and Levi, 1989; Wall and Worm, 2001). An AGICO MFK-1FA Kappabridge magnetic susceptibility meter was used to measure the magnetic susceptibility and the AMS, which was measured to determine the magnetic fabrics. After AMS measurements were complete, a 2G-Enterprise cryogenic magnetometer was used to measure the natural remanent magnetizations (NRMs).
Twelve specimens were subjected to alternating field (AF) demagnetization in 10 mT steps from NRM to 120 mT. The AF treatment generally resulted in curved demagnetization trajectories on the Zijderveld diagrams and was not successful in isolating the magnetic components. As a result, the remaining cores were subjected to thermal demagnetization using an ASC Scientific Thermal Specimen Demagnetizer in 28 steps from NRM to 580°C for the DB and up to 500°C for EC.
For both thermal and AF demagnetization, orthogonal diagrams (Zijderveld, 1967) were used to analyze the data. Principal components (Kirschvink, 1980) were selected using Super IAPD (Torsvik, 2000) software, and components with maximum angle of deviation (MAD) values less than approximately 15° were selected to calculate mean statistics after Fisher (1953) for EC.
An attempt to orient DB was conducted using the VRM method (Van der Voo and Watts, 1978; Suk et al., 1993; Rolphe et al., 1995; Dennie et al., 2012). The VRM in the specimens analyzed should align with the modern orientation for the magnetization. In addition, an “inclination only” mean was calculated using the method of Arason and Levi (2010) in order to correct for possible shallow-inclination bias. The absolute values of the expected inclinations for the latitude and longitude of the core in Bradford County, PA were plotted versus time (based on data from Torsvik et al., 2012) and compared with the mean inclinations to determine the age of the magnetizations.
A total of 12 samples were selected for isothermal remanent magnetization (IRM) analysis. The selected specimens were subjected to an IRM at field strengths at 25 steps ranging from 10 to 2500 mT using an ASC Scientific Impulse Magnetizer. The samples then were subjected to a stepped IRM to impart three orthogonal IRMs (120, 500, and 2500 mT) and thermally demagnetized.
High field magnetic measurements were performed on representative samples on a Princeton Measurements vibrating sample magnetometer (VSM) 3900-04 at Southern Illinois University Carbondale. An applied field of 0.5 Tesla (T) was applied to saturate the samples with a field step of 2.5 mT and averaging time of 0.5 s. Data processing was performed using HystLab (Paterson et al., 2018). A paramagnetic slope correction and moderate moving window smoothing was applied to raw hysteresis loops (e.g., Jackson and Solheid, 2010). Back-field and IRM acquisition curves were also measured and processed using the Max Unmix program (Maxbauer et al., 2016) to reveal the coercivity spectrum of samples. Error analysis was performed through a Monte-Carlo style resampling routine to assign uncertainty for the optimized model. The 95% confidence intervals were used to display uncertainty in each modeled component distributions.
Seventy-two polished thin sections from the cores were examined using a petrographic microscope in transmitted and reflected light. Fourteen samples were also examined using the FEI Quanta 200 scanning electron microscope (SEM) at the University of Oklahoma, Mewbourne College of Earth and Energy IC3 lab and a Zeiss NEON High Resolution SEM at the University of Oklahoma, Samuel Roberts Noble Microscopy Laboratory.
Doubly-polished thick sections of veins in DB were prepared for fluid inclusion analysis. The fluid inclusions are identified as primary, secondary or pseudosecondary and mapped as fluid inclusion assemblages (Goldstein, 2003). Standard heating and freezing microthermometric procedures were conducted using a USGS heating-freezing stage manufactured by FLUID Inc., at Central Connecticut State University. Tmax values from Rock-Eval pyrolysis were provided by Chesapeake Energy and the vitrinite reflectance (%Ro) were calculated using %Ro = 0.180 × Tmax − 7.16 (Jarvie et al., 2001).
Results and Interpretations
Facies and Diagenesis
The EC and DB cores are divided into five facies on the basis of textural and compositional differences: (1) argillaceous silty shale, (2) wackestone and packstone, (3) pyritic carbonaceous shale, (4) clastic breccia(s), and (5) diagenetically altered and veined breccias. The details of the facies are described in Steullet (2014) and are similar to facies documented by Lash and Engelder (2011). The diagenetically altered and veined breccias are found in the middle of the cores and correspond to the Cherry Valley Limestone.
The diagenesis recorded in cores is complex and can be divided into 26 diagenetic events (Steullet, 2014). Key events in the matrix include formation of carbonate and phosphatic concretions and dissolution of allochems which are replaced by calcite, silica, and barite. Calcite, dolomite, barite, and sphalerite are found in the matrix. Bitumen is found in recrystallized algal cysts and agglutinated forams. Small veins which contain calcite, anhydrite, barite, and pyrite are present in all facies. The diagenetically altered and veined breccias (Figure 2A) in the Cherry Valley Limestone contain calcite, silica, saddle dolomite, barite (Figures 2B,C), sphalerite (Figure 2D), and sylvite (Figure 2F). Intervals with shale flowage are also present (Figure 2E). Neither magnetite nor pyrrhotite were identified in the petrographic study although small (<2–4 μm) Fe-rich reflectant grains that are not pyrite occur within the diagenetically altered EC limestone intervals that could be magnetite.

Figure 2. Photomicrographs from the diagenetically altered breccia facies in both cores. (A) Diagenetically altered and veined breccia in EC. Veins are composed of calcite with minor barite. (B) Cross-polarized thin section photomicrograph containing fibrous barite, and a recrystallized algal cyst in EC. In the recrystallized algal cyst, there is a barite cement, followed by a rim of clays and bitumen, and then more barite. Note stylolite cutting the barite. (C) Backscatter SEM image of barite in the EC (Bar: Barite; Cal; Calcite). (D) Backscatter SEM image of sphalerite (Sph) in calcite veins from the diagenetically altered breccia in EC. The sphalerite is found as crystals within the calcite (Cal) veins and as a milky texture throughout the veins (Qtz; Quartz). (E) Backscatter SEM image of the breccia in EC which shows shale displaying flow patterns. (F) Backscatter SEM image of sylvite (Sylv) and pyrite (cubic, Pyr) within the diagenetically altered breccia in DB.
Two types of fluid inclusions were found in these DB calcite veins: single phase CH4 and CH4+CO2 inclusions which are found as both primary and secondary inclusions (Steullet, 2014). The calculated maximum Ro values for DB are 200 and 300°C for EC (Supplementary Figures S1, S2).
Magnetic Susceptibility and Magnetic Fabric
Bulk magnetic susceptibilities in both cores range from approximately 1 to 12 × 10–8 [m3/kg] (Supplementary Figures S3, S4). The bulk magnetic susceptibility of the specimens in both the DB and EC gradationally decreases with depth, and there is no correlation with facies in the cores.
In DB the Kmin is vertical (Figure 3A) and the shape factor T (Jelinek, 1981) indicates a predominately oblate fabric (Figure 3B) that is interpreted to be carried mostly in paramagnetic clay minerals (e.g., Tarling and Hrouda, 1993). Comparison of raw and corrected hysteresis loops shows two orders of magnitude difference which suggests that paramagnetic minerals are a major contributor to the AMS (Supplementary Materials and Figure 5). The other AMS axes are horizontal in this unoriented core. In EC, an oblate fabric dominates, Kmin displays a moderate girdle in directions, and more specimens have a vertical Kmax than in DB (Figure 3C). The samples with a prolate fabric (Figure 3D) and vertical Kmax are from the diagenetically altered interval (Figure 3C) in the core. The intervals with shale flowage (Figure 2E) occur in the diagenetically altered interval and probably played a role in causing the prolate fabric in some specimens. The Kmax from the other facies in EC has a predominately NNW-SSE trend whereas Kint has an approximate E-W trend. We note that a few samples have high anisotropy values (Figures 3B,D). These specimens are generally from the lower part of the cores in the wackestone and packstone facies (Supplementary Figures S3, S4).
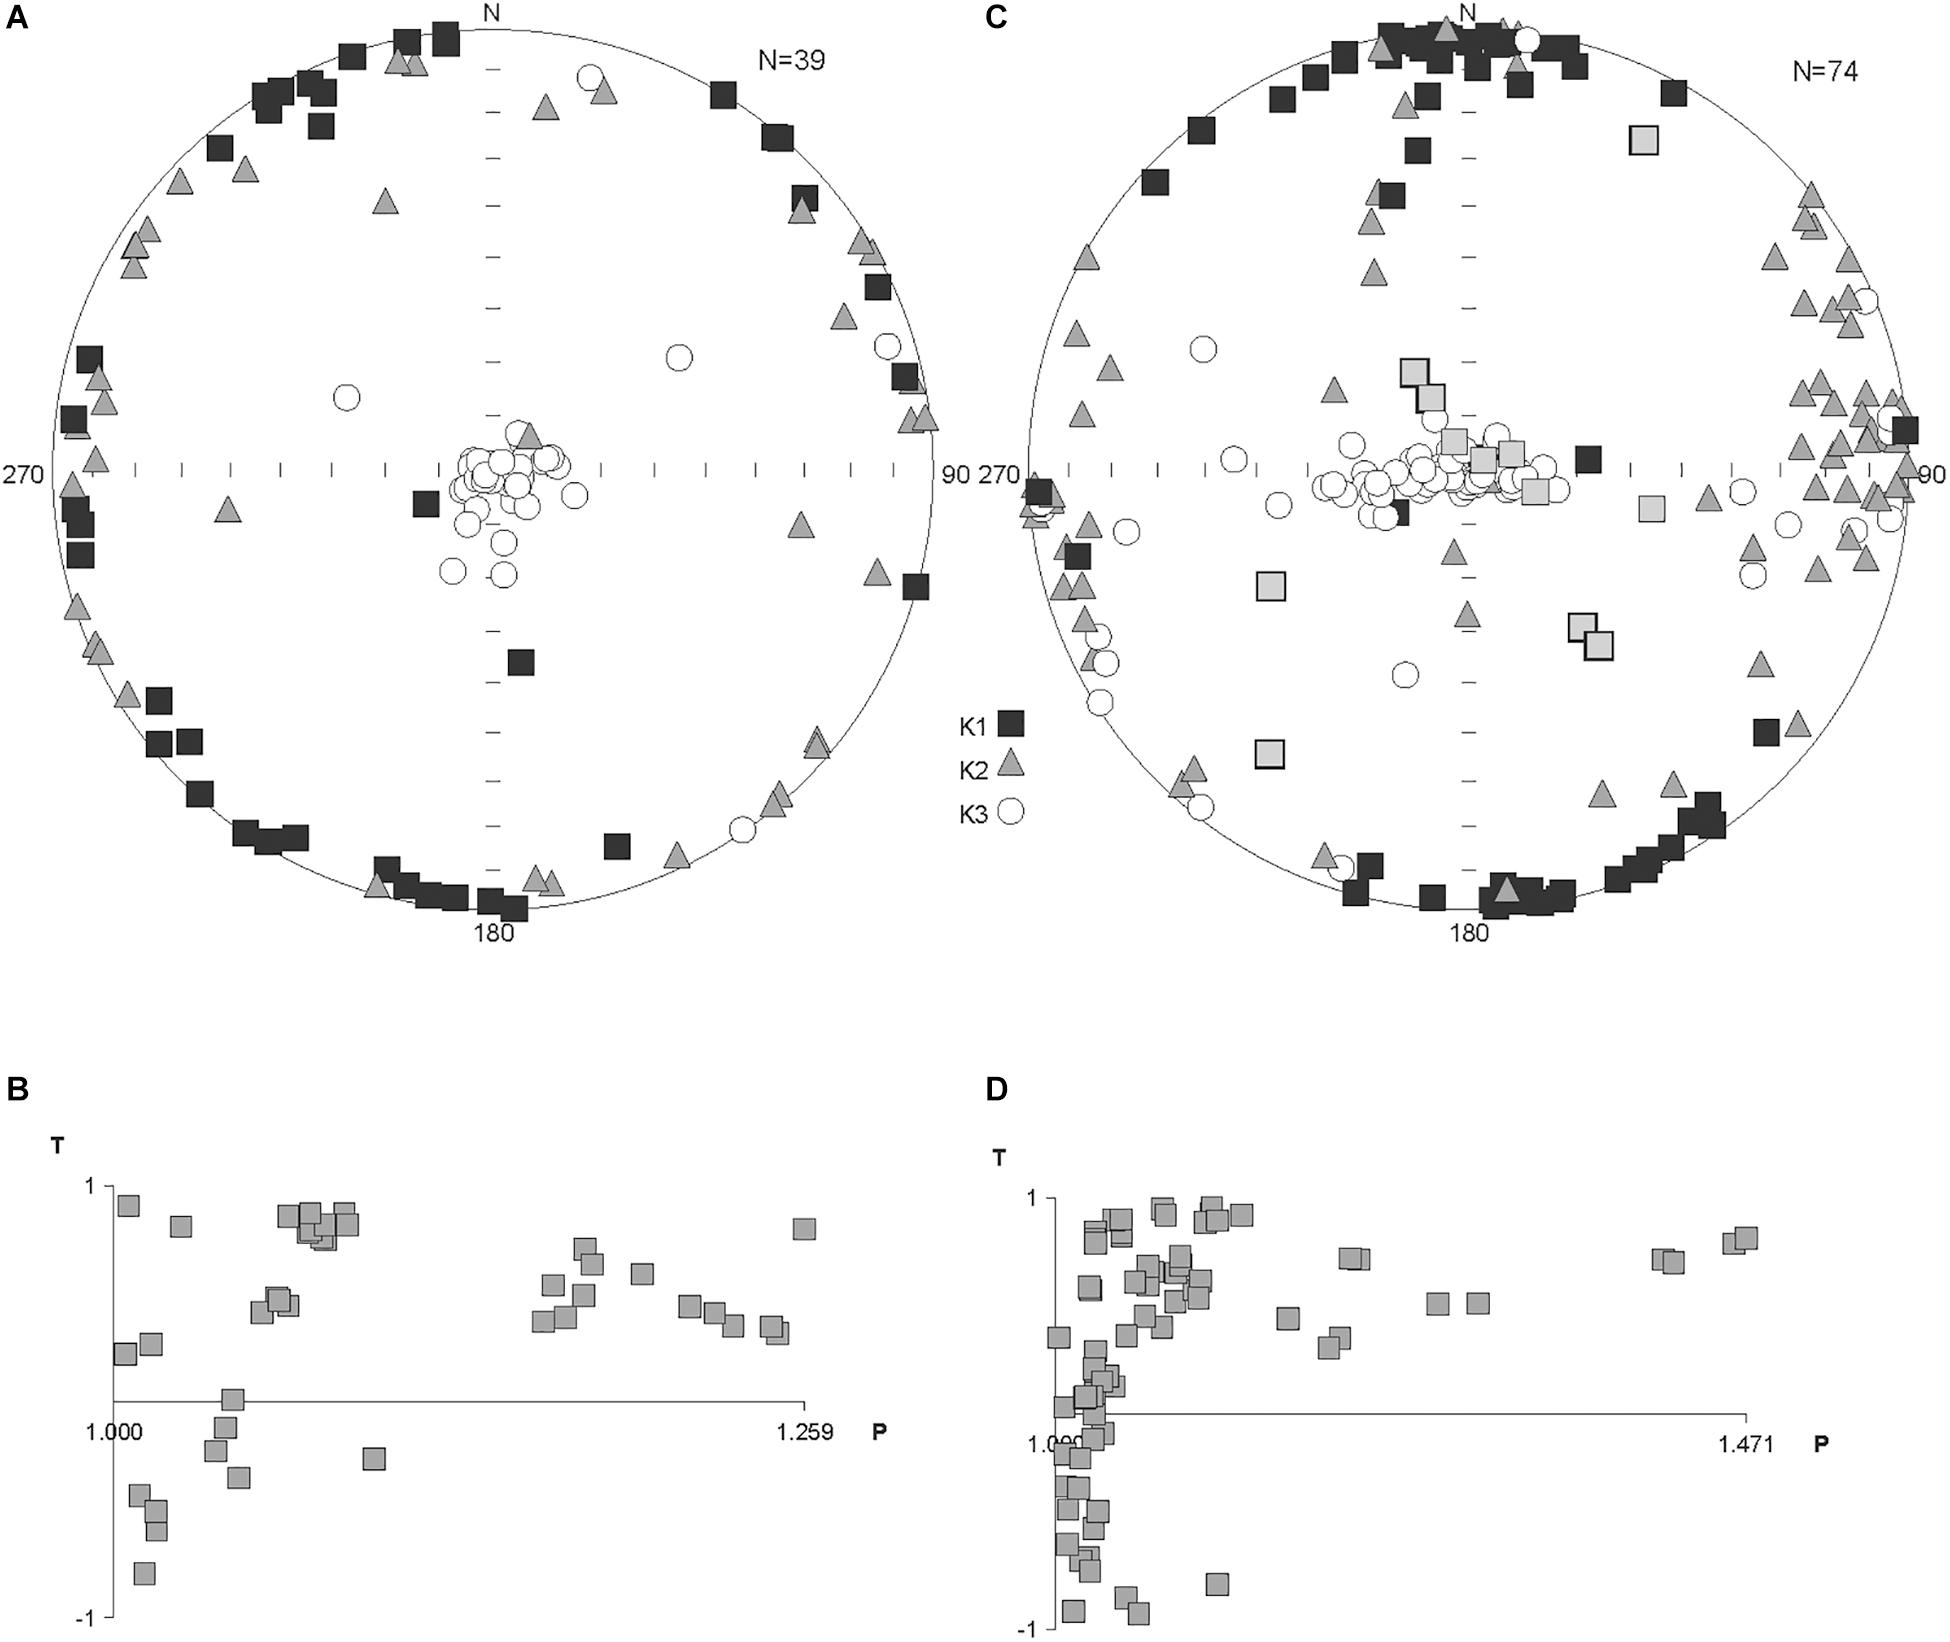
Figure 3. (A) Equal area projection of AMS data from DB (geographic coordinates). Note that Kmin is vertical. The core is not oriented. (B) Jelinek (1981) plot of the shape factor (T) versus the degree of anisotropy (Pj) for the DB data. Note that most specimens have an oblate fabric. (C) Equal area projection of AMS data from EC (geographic coordinates). Note that most of the Kmin axes are vertical but the specimens display a smeared distribution. Gray squares (Kmax) are specimens from diagenetically altered breccia have a vertical or near vertical Kmax. Kmax also has an NNE-SSE trend, and Kint has an E-W trend. (D) Jelinek plot of the shape factor (T) versus the degree of anisotropy (P) for the EC data.
Paleomagnetism – DB
The demagnetization trajectories for specimens subjected to AF treatment are curved on the Zijderveld diagrams (Figure 4A), indicating an overlap of components. Because the AF treatment did not isolate components, principal components were not calculated. The AF treatment removed most of the magnetization by 120 mT (Figure 4A).
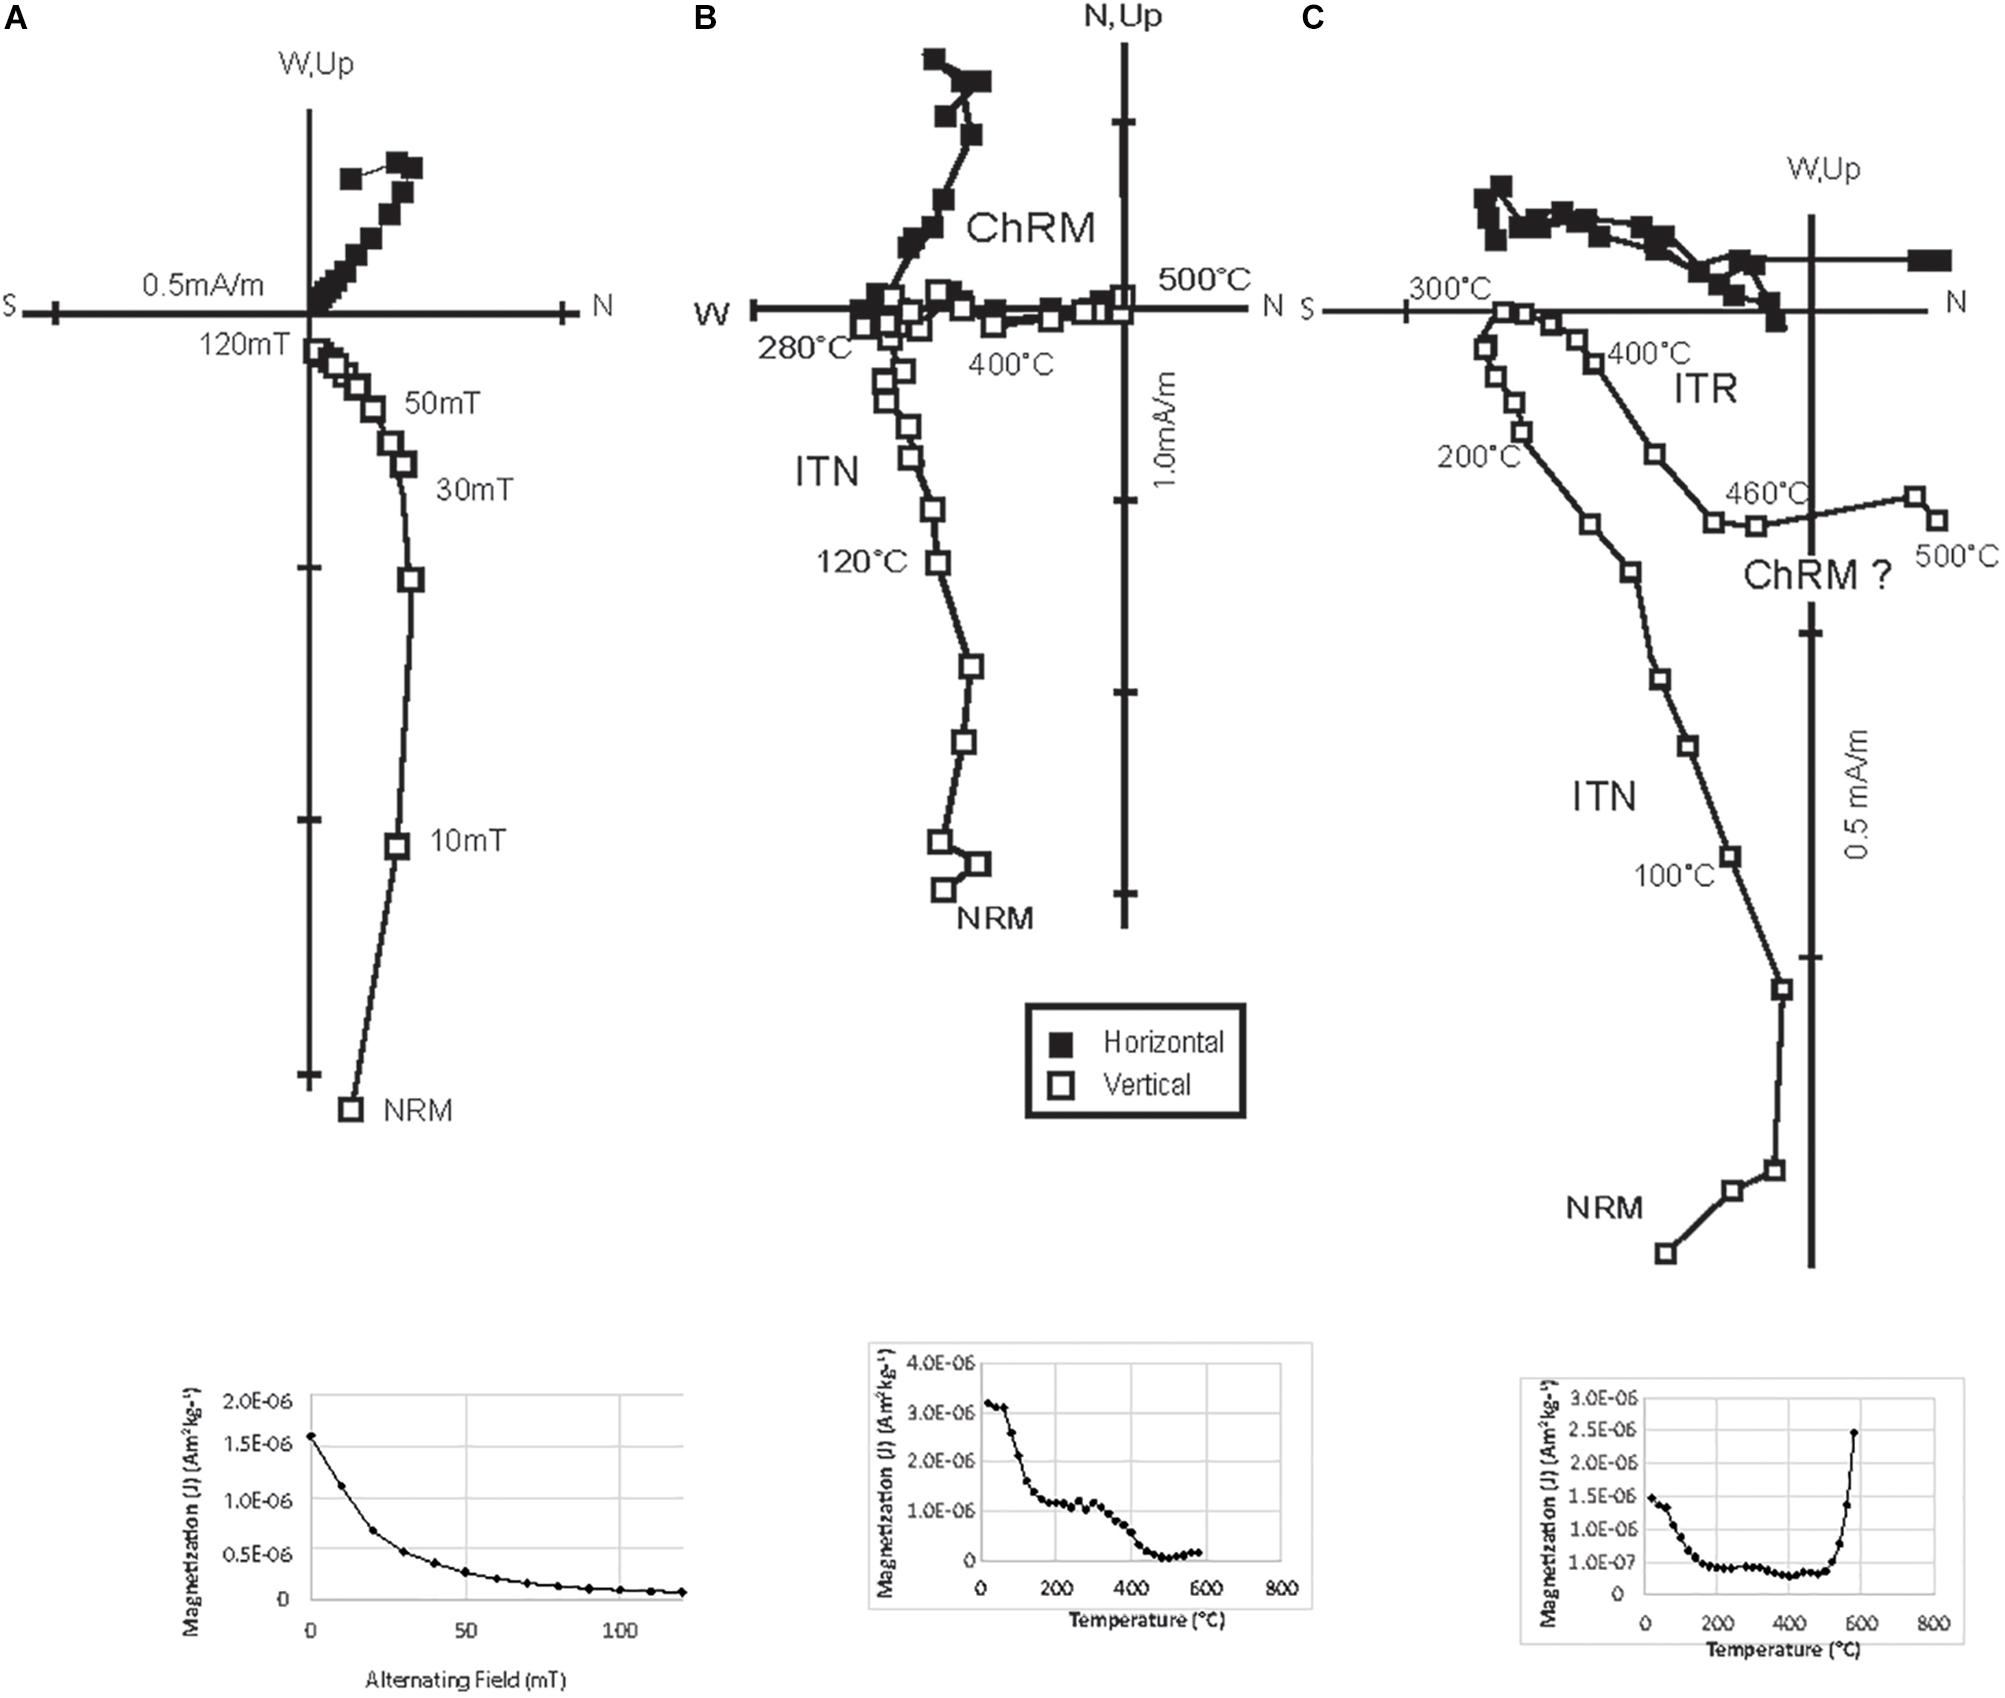
Figure 4. Representative orthogonal projections and NRM decay plots for DB. (A) AF demagnetization of specimen from DB, (B) Thermal demagnetization of a DB specimen showing the ITN and the ChRM, (C) DB specimen showing the ITN and ITR components and a possible ChRM. The magnetization increases above 500°C because of creation of new minerals (e.g., magnetite) and these temperature steps were removed from the orthogonal projection but not on the thermal decay plots.
Thermal demagnetization of specimens from this unoriented core between NRM and 60–100°C removes a poorly defined magnetization with inconsistent inclinations. Between 60–100°C and 180–300°C an intermediate temperature component (ITN) with steep down inclinations and a wide range of declinations is removed (Figure 4B). The ITN in most specimens is removed between 250 and 280°C. Because the core was not oriented and was vertical, “inclination only” means were calculated following Arason and Levi (2010). The ITN has an inclination of 72.7° (k = 80.9; α95 = 1.8°; n = 78) (Figures 4B, 6A and Table 1).
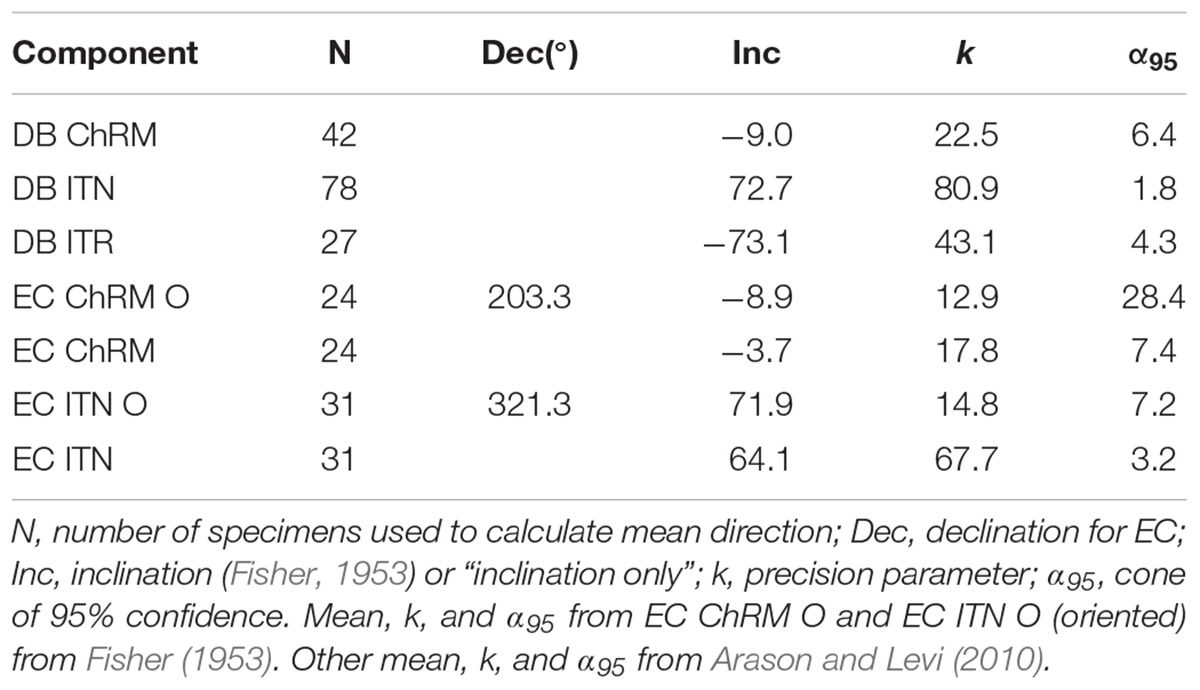
Table 1. Summary of paleomagnetic data.
At higher temperatures (300–440°C) in some specimens, a component (ITR) with steep up inclinations (−73.1°; k = 43.1; α95 = 4.3°; n = 27) and approximately antipodal declinations from the ITN in the same specimen is removed (Figures 4C, 5B and Table 1). A characteristic remanent magnetization (ChRM) with shallow inclinations (−9.0°; k = 22.5; α95 = 6.4°; n = 42) is removed between ∼320 and 500°C (Figures 4B, 5C) in many specimens (Table 1). If the ITR is present in a specimen, the ChRM is poorly developed (Figure 4C) at temperatures above the ITR or is not present.
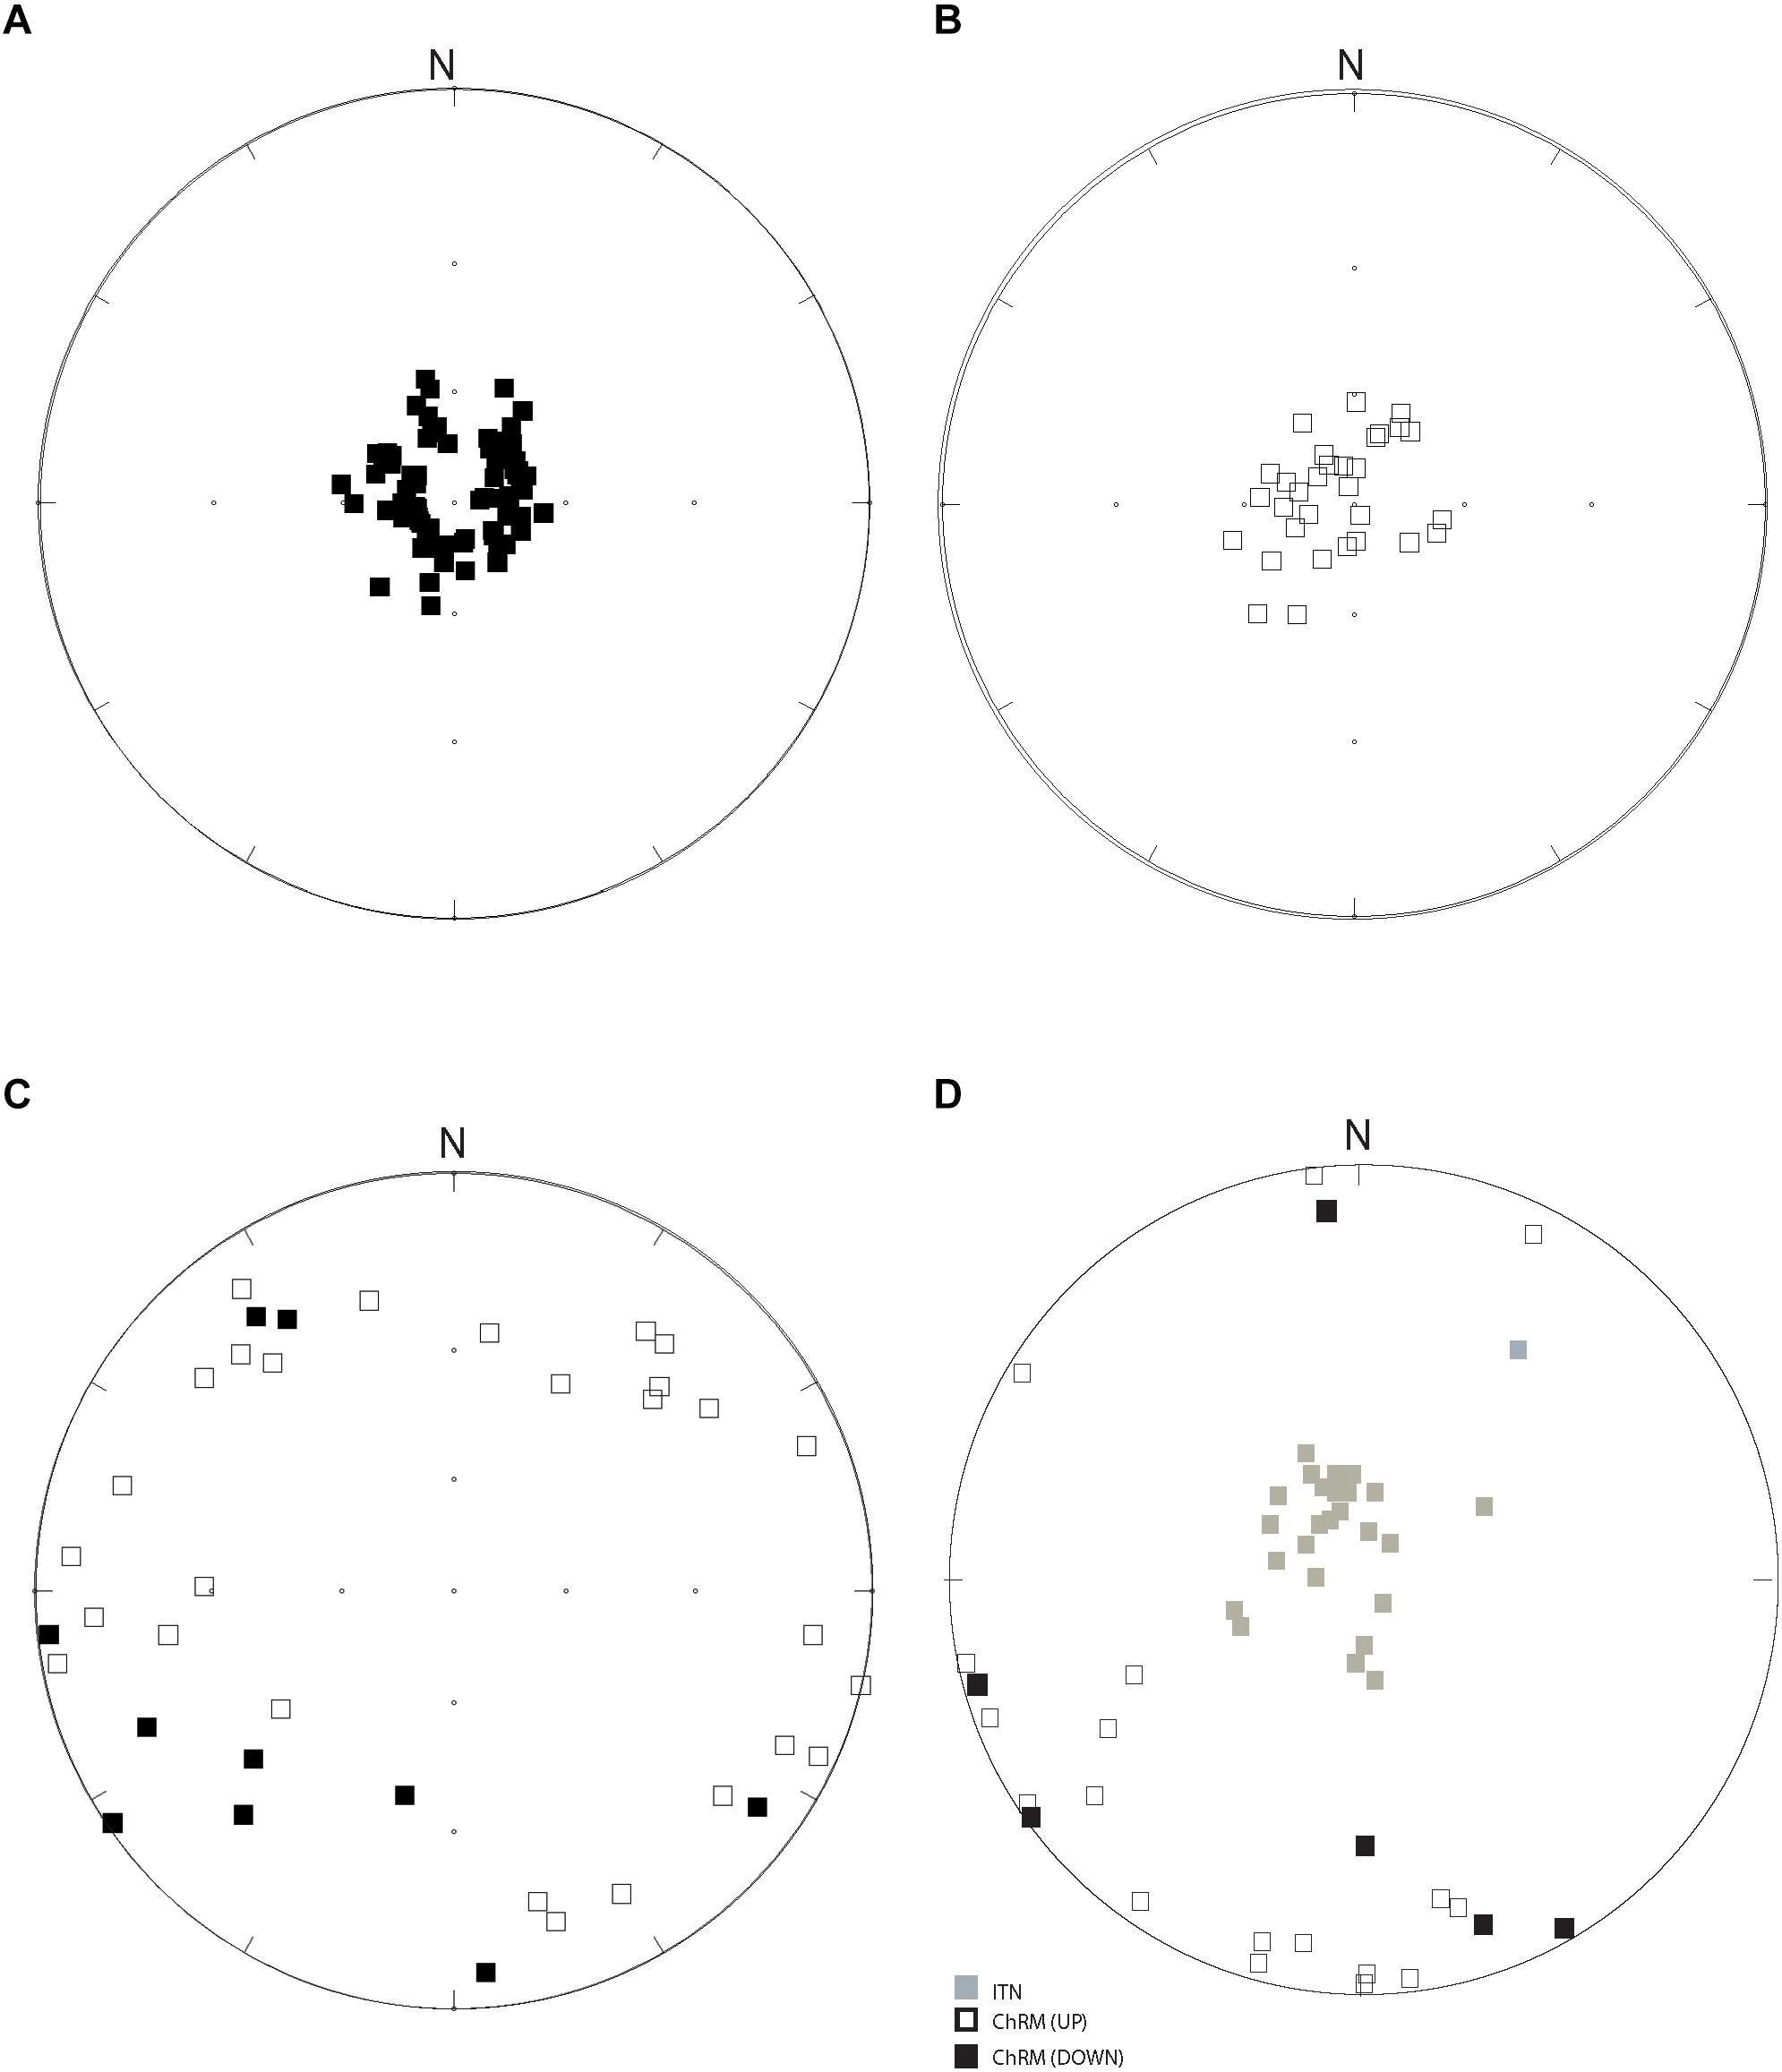
Figure 5. Equal area projections of component (specimen) directions from DB and EC. (A) Equal area projection of ITN from DB. (B) Equal area projection of ITR from DB. (C) Equal area projection of the ChRM from DB. (D) Equal area projection of the ITN and ChRM from EC (squares ChRM; shaded squares ITN). The closed squares indicate down directions and open squares indicate up directions. N, North.
Out of the 86 specimens in DB, most (78) contained the ITN and 27 contained the ITR with MAD values less than 15°. Forty-two of the specimens contained the ChRM with MAD values less than 15°. Out of those remaining, 16 had a likely ChRM but the MAD was higher than 15°. In the remaining specimens, the magnetization intensity increased between 300 and 500°C and is interpreted to have been caused by the creation of magnetite by oxidation of pyrite during thermal demagnetization.
There is no strong correlation with depth and presence of the ChRM (Supplementary Figure S3). There is some evidence that the facies may exert some control on the presence of the ChRM. The ChRM, as well as the ITR and ITN, are found in the diagenetically altered breccia specimens as well as the other less obviously diagenetically altered facies. Out of six specimens from the diagenetically altered breccia, four had the ChRM, and two had the ITR and ITN. The ChRM is also commonly found in the argillaceous silty shales, pyritic carbonaceous shales, and wackestones in the core.
To test for a DIRM, the average NRM intensities of the inner and outer core specimens were compared and the values were similar (Inner – 0.9304 mA/m, Outer – 0.9307 mA/m). However, using Q-factor analysis (Wall and Worm, 2001), 35 outer specimens have 24% higher Q factor than the inner specimens. In contrast, 8 inner specimens have a 13% higher Q-factor than outer specimens. If a DIRM is present, outer specimens would have elevated Q factors compared to inner specimens (Wall and Worm, 2001) so it possible that a low temperature component was contaminated by a DIRM.
Because the core was not oriented and was vertical, the inclinations were plotted on an expected inclination plot to determine the ages of the magnetizations (Figure 6). Expected inclinations were calculated assuming normal polarity from the apparent polar wander path (APWP) of Torsvik et al. (2012). For ages greater than 280 Ma this yields negative inclinations. Since without declination information, this is indistinguishable from a true reversed direction, we consider only the absolute value of the expected inclination (Figure 6). Plotting the inclinations, with the α95 representing the error, the age of the ChRM ranges from 310 to 225 Ma (Figure 6).
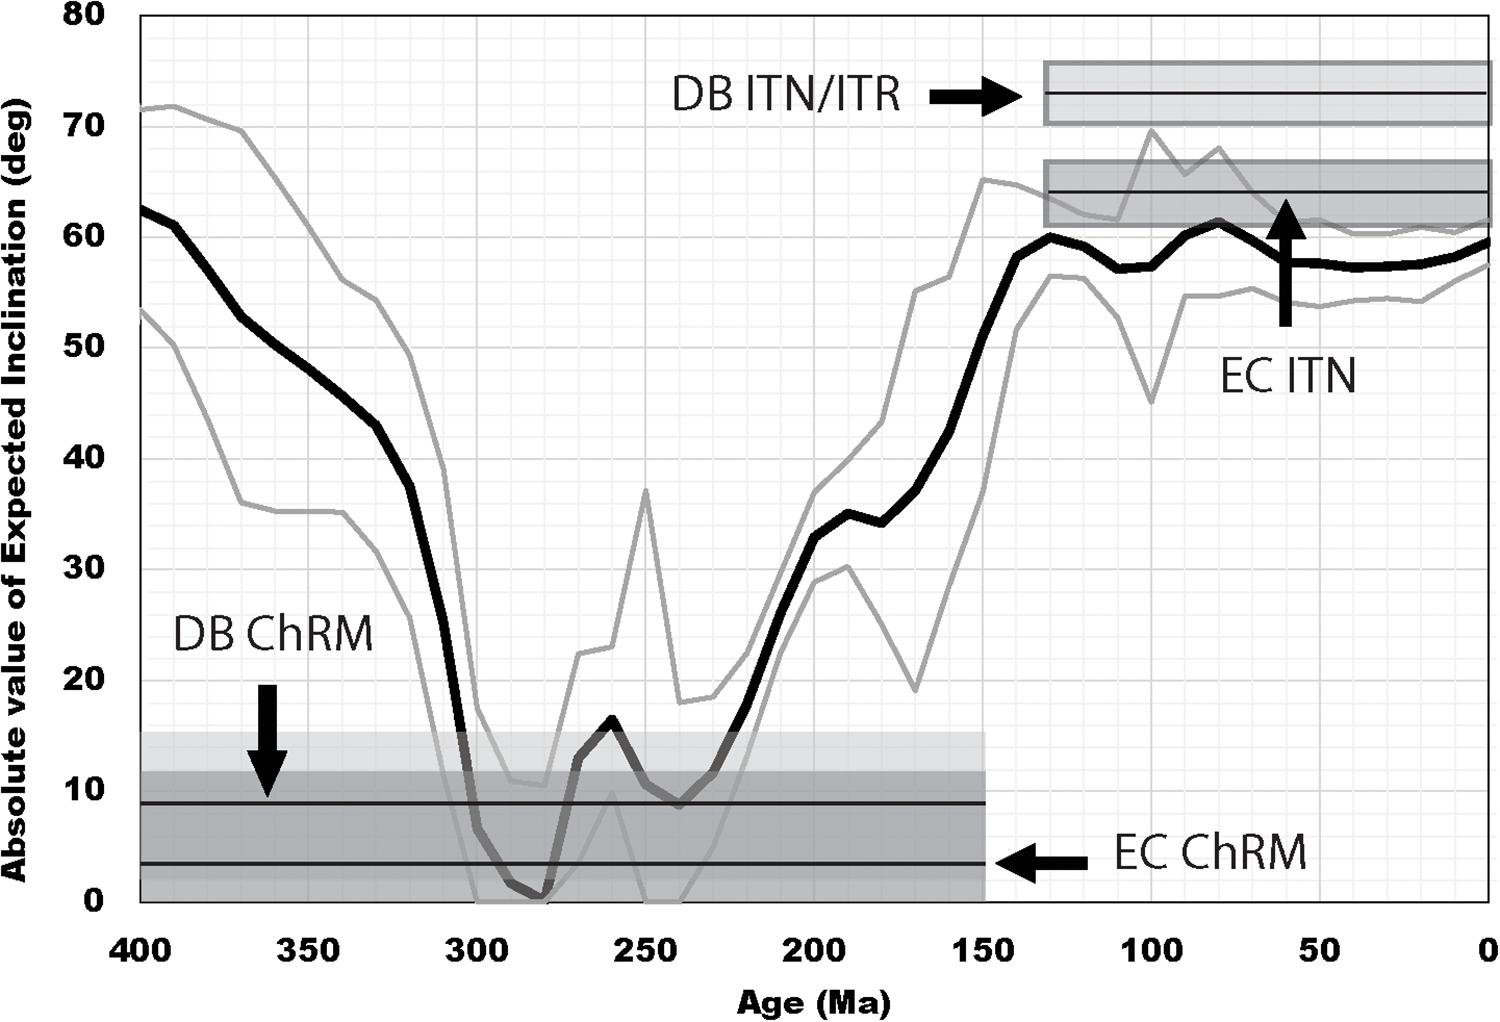
Figure 6. Expected Inclination plot (absolute values of inclinations calculated from Torsvik et al., 2012) with the ChRMs and ITN/ITR mean inclinations for both cores. The thick line represents the expected inclination in Bradford County and the gray lines represent α95 values for the expected inclinations. The labeled arrows point to the mean inclinations for each component and the shaded areas are the age ranges errors for the components based on the α95 values.
After converting the ITR inclinations to their antipodal normal directions, the ITN and ITR are not distinct from each other and could have been acquired through a reversal. The inclinations are relatively steep (72.7°, −73.1°, Table 1) and are interpreted as Cretaceous to Cenozoic in age (Figure 6), although we note that the inclinations are high compared to the expected inclinations.
Paleomagnetism – EC
As with the DB specimens, AF treatment of EC specimens revealed curved trajectories and principal components were not calculated. The AF treatment removed most of the magnetization by 120 mT (Figure 7A). At low temperatures (NRM and 60–100°C) the magnetization had inconsistent inclinations and declinations.
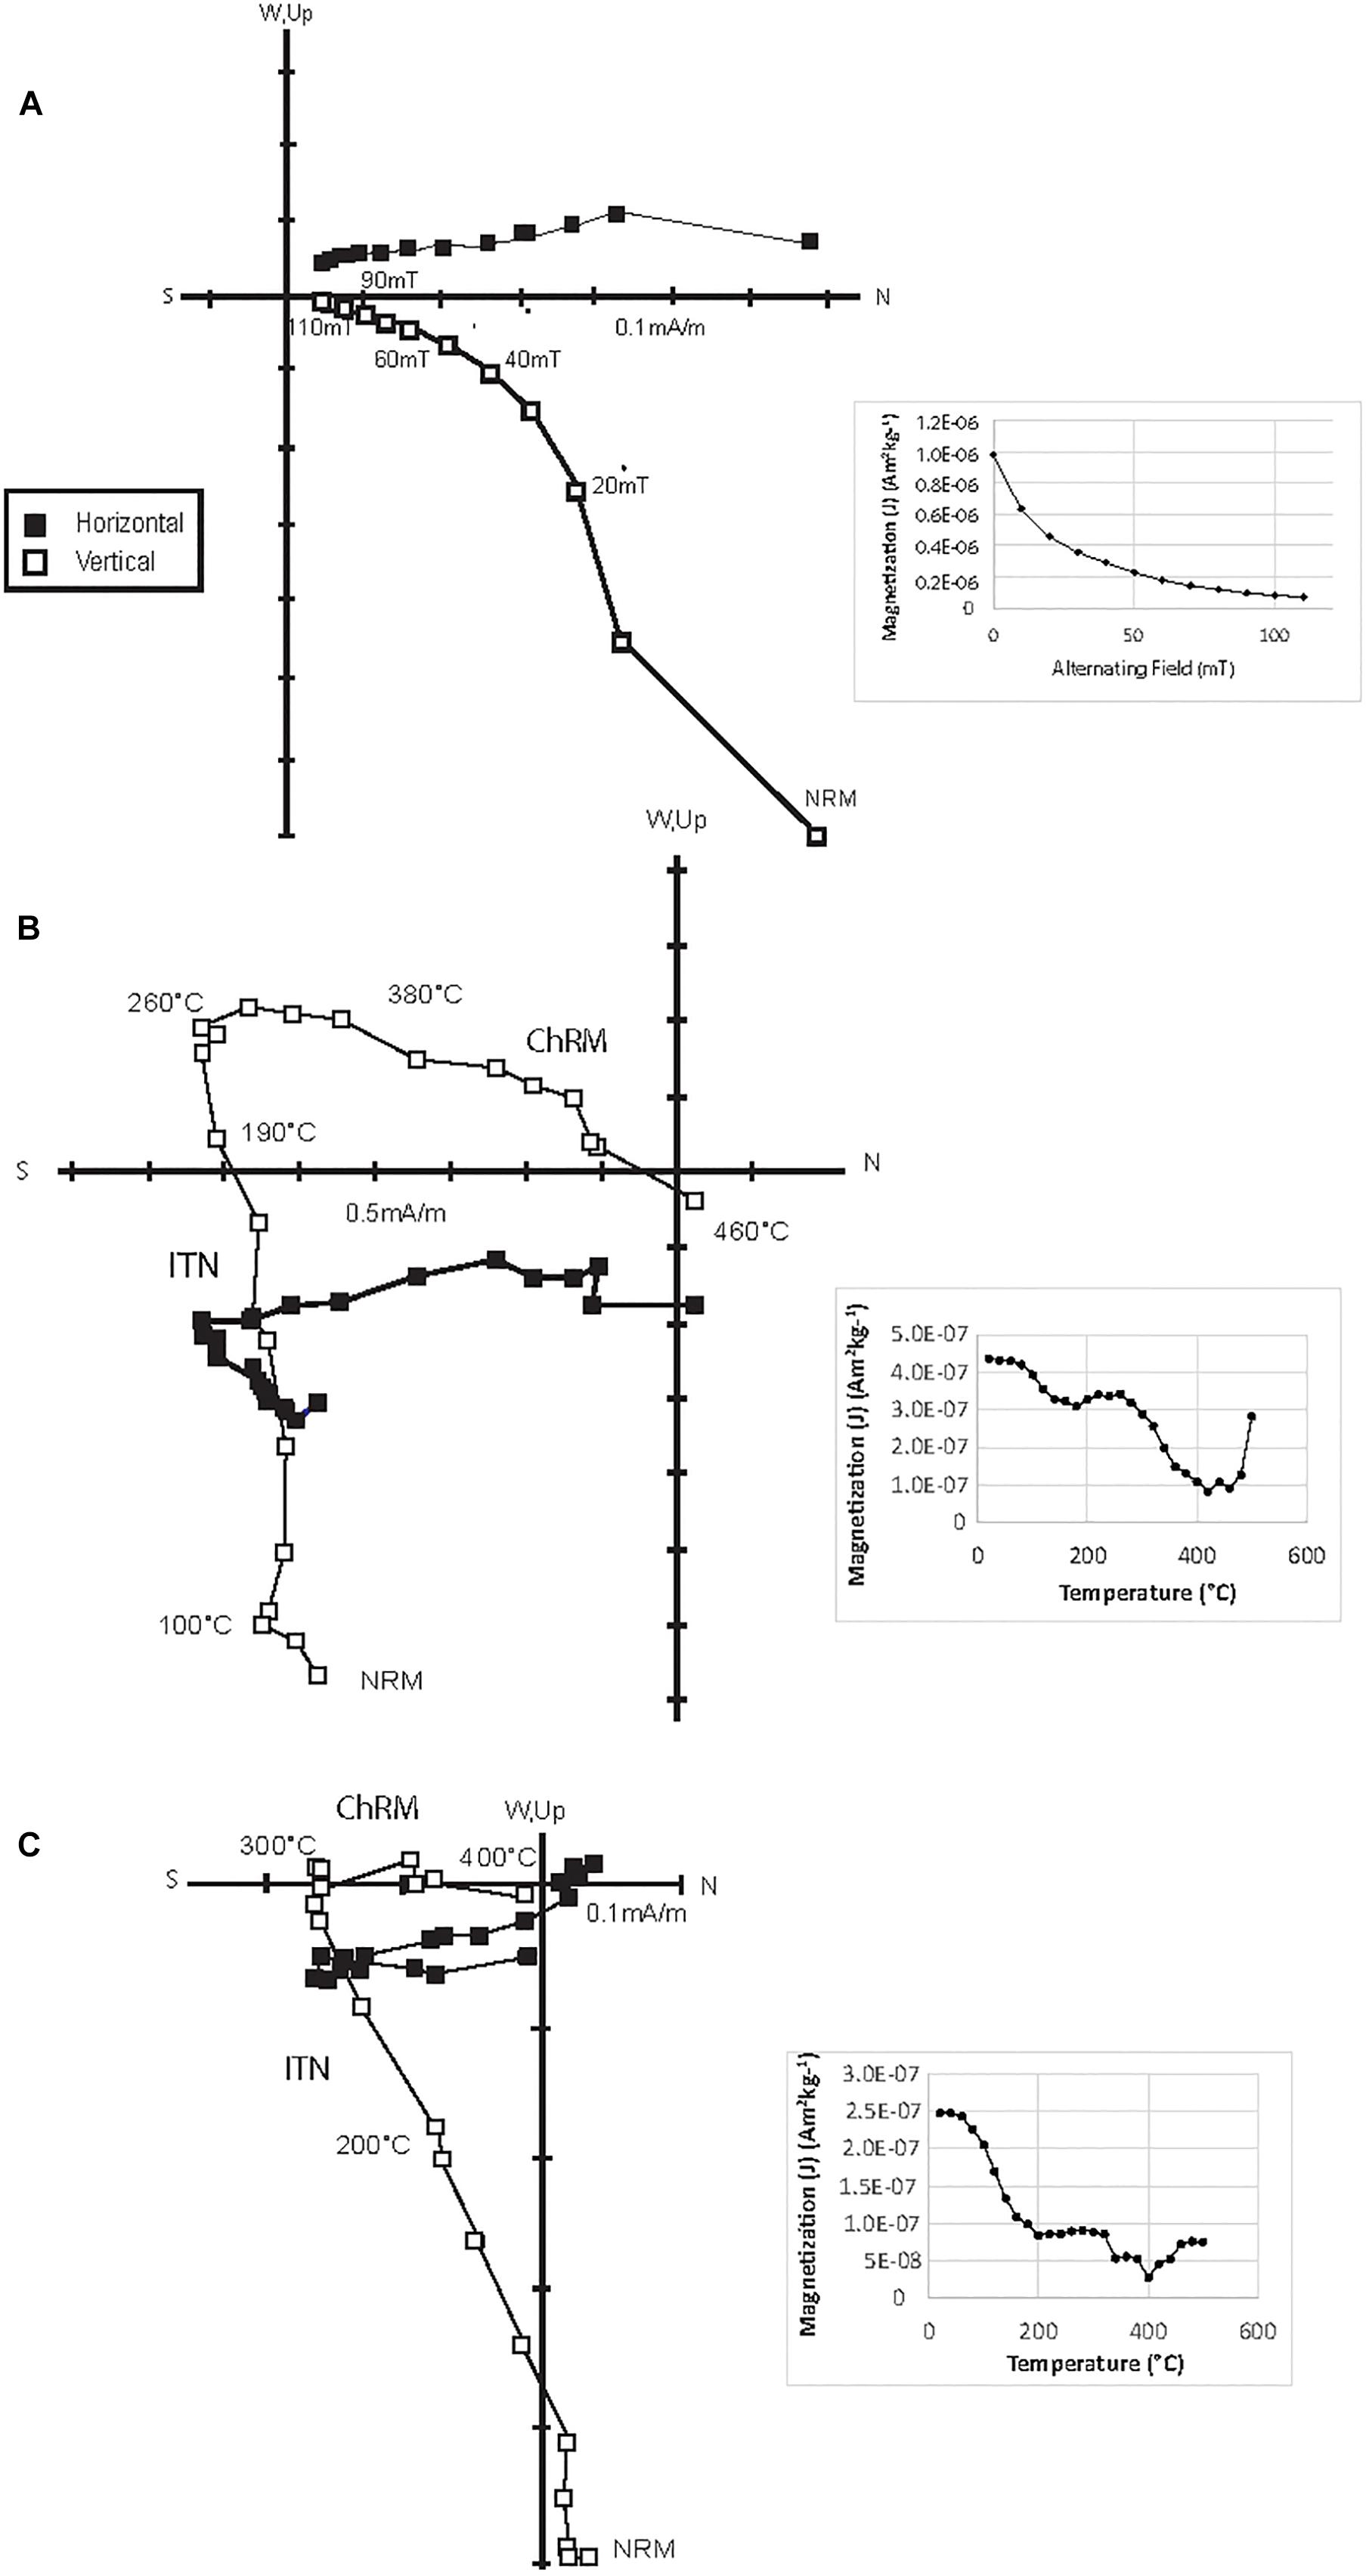
Figure 7. Representative orthogonal projections and NRM decay plots for EC. (A) AF demagnetization of specimen from EC, (B,C) Thermal demagnetization of EC specimens showing the ITNs and the ChRMs. The magnetization increases above 500°C because of creation of new minerals (e.g., magnetite) and these temperature steps were removed from the orthogonal projection but not the thermal decay plot.
The specimens from the oriented EC core contain the ITN (∼100–300°C) and ChRM but do not contain the ITR component (Figures 7B,C and Table 1). Of the 54 specimens in EC, 24 specimens had a ChRM with MAD values less than 15°. The ChRM, removed between ∼300°°C and 400–460°C, has shallow and up directed inclinations with a wide range of streaked declinations (Figures 5D, 7B,C, and Table 1). The mean declination/inclination is 203.3°/−8.9° but the α95 (28.4°; Table 1) is large. Of the remaining specimens, 9 had a likely ChRM with MAD values above 15°, seven specimens have an ITN but not the ChRM, and 14 displayed unstable decay.
The streaked declinations and the large error for the mean ChRM suggests that orienting failed, possibly because of core barrel rotation, and a result, the “inclination only” mean was calculated in this vertical core. The inclination for the ChRM is −3.7° (k = 17.8; α95 = 7.4°, n = 24; Table 1). The ITN component has a mean declination of 321.3° and an inclination of 71.9° (k = 14.8; α95 = 7.2; n = 31; Table 1) and the “inclination only” is 64.1° (k = 67.7; α95 = 3.2; n = 31; Table 1).
The inclination for the ChRM (−3.7°; α95 = 7.4°; Table 1) and ITN (64.1; α95 = 3.2; Table 1) were plotted on an expected inclination plot to determine the age. With the α95 representing the error, the age of the ChRM ranges from 305 to 230 Ma (Figure 6). The interpreted age for the ITN is Cretaceous – Cenozoic (Figure 6).
As with DB, there is no strong correlation with depth and presence of the ChRM (Supplementary Figure S4). The ChRM, however, is present in the diagenetically altered and brecciated interval (Supplementary Figure S4) and is also found in the other facies.
To test for a DIRM, inner and outer specimens were utilized for Q factor analysis in EC. Three outer specimens have an average 34% higher Q factor than the inner specimens. In three other specimen sets, inner specimens have an 11% higher Q-factor than outer specimens. Although the data is limited, these results suggest that the low temperature component was likely contaminated by a DIRM.
Rock Magnetism
The representative IRM acquisition curves show a rapid rise by ∼100–200 mT, a more gradual rise to 500–700 mT, and never completely saturate (Figures 8A,B). This suggests that low coercivity phases dominate but there is a contribution from a higher coercivity phase. Representative triaxial decay for specimens from both cores show a loss of intensity by 500°C and the DB sample shows a small dip in intensity at approximately 320°C (Figures 8C,D). These results suggest the presence of both magnetite and perhaps pyrrhotite.

Figure 8. Representative IRM acquisition (A,B) and triaxial decay (C,D) curves for the DB (A,C) and EC (B,D). The low and intermediate thermal curves decay by 500°C suggesting magnetite. A slight dip at 320°C suggests the presence of pyrrhotite.
Unmixing of back-field data revealed two magnetic components in the majority of samples, with a few samples showing a third, minor component (Figures 9A,B). The observed contribution (OC) of component 1 ranges from 0.51 to 0.79 with a mean log coercivity (Bh) of 1.55 (35.5 mT), component 2 OC ranges from 0.40 to 0.21 with a mean Bh of 2.73 (537 mT) and component 3 OC ranges from 0 to 0.09 with a mean Bh of 2.18 (151.4 mT) (Figures 9A,B). The mean coercivity values for component 1 based on the unmixing data are consistent with magnetite (Egli, 2004). Component 3 is consistent with pyrrhotite whereas component 2 is consistent with a higher coercivity mineral such as hematite which is not interpreted to carry a remanence.
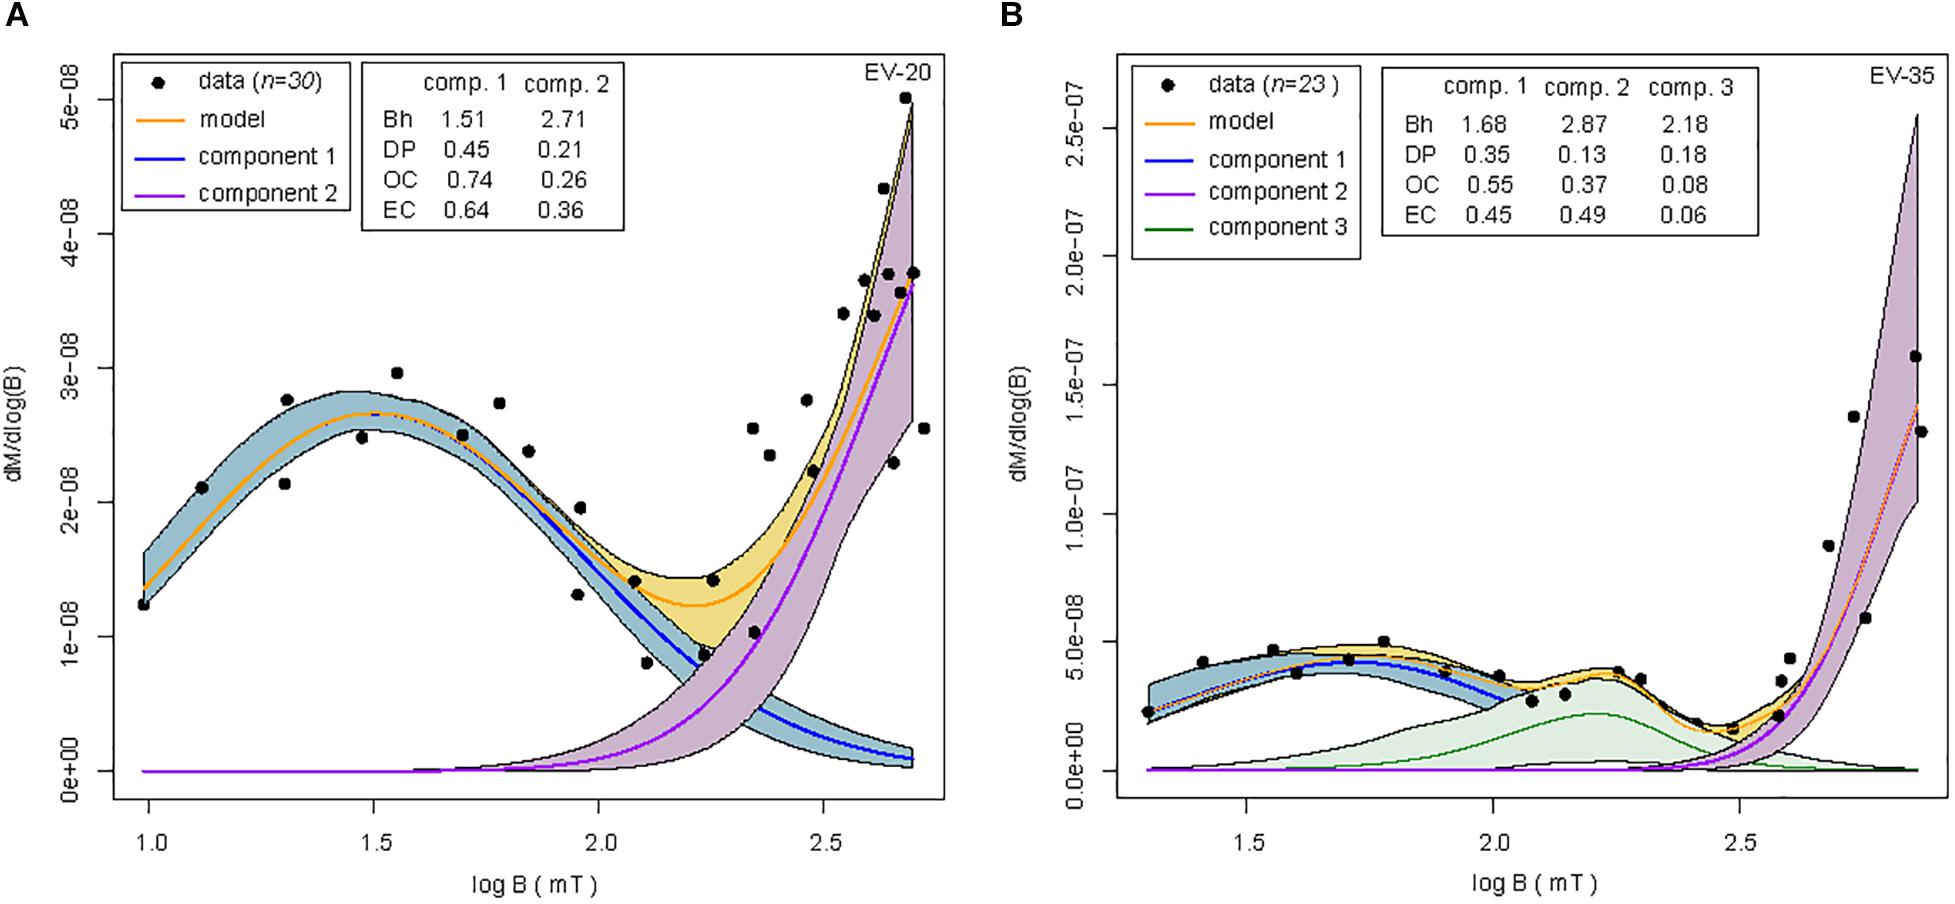
Figure 9. Panels (A,B) representative model fits of coercivity spectrums from back-field measurements. Shaded areas represent 95% error envelopes of model and components. Component 1 likely corresponds to magnetite. In panel (B), component 3 may correspond to pyrrhotite. OC, mean observed contribution; EC, estimated contribution; DP, Dispersion parameter; Bh, mean log coercivity.
Most hysteresis loops show wasp-waisted behavior (Supplementary Figure S5). The nature of wasp-waisted hystersesis loops is attributed to either populations of single-domain and superparamagnetic grains or magnetic phases with different coercivities (e.g., Jackson et al., 1993; Tauxe et al., 1996). Examination of back-field and unmixing data (Figures 9A,B) suggest the latter case in our samples.
Discussion
The results indicate that the AMS in DB is predominately oblate which is interpreted as a sedimentary compactional fabric (e.g., Parés, 2015). In EC, the fabric is oblate but the Kmin is streaked which could be evidence of deformation (e.g., Parés, 2015). Some specimens contain a prolate fabric that is interpreted as diagenetically altered. The reason some specimens lower in the core have high degree of anisotropy values (Figures 3B,D) is puzzling. We note that these samples have low susceptibility and are found in carbonate facies (packstones and wackestones) low in the cores (Supplementary Figures S3, S4) although they are not found in the carbonate facies higher in the cores.
Previous AMS studies in the Plateau Province (Hirt et al., 1995) and the Valley and Ridge (Manning, 2011) found NE-SW and NNW-SSE trends. The NE-SW trends are parallel to the structural trends and likely reflect a tectonic influence. The structural trend in the study area is approximately ENE – WSW and there is not an AMS fabric parallel to that trend.
The origin of the NNW-SSE Kmax trend is difficult to interpret perhaps because of structural complexity. Hirt et al. (1995), using anhysteretic remanent magnetization, concluded that this fabric was carried by magnetite and pyrrhotite and was related to one of three fracture sets present in the Appalachians. The presence of this fabric suggests that the ferromagnetic component may be stronger relative to the paramagnetic component. We note that there is no correlation between the possibly rotated specimens with the northerly or westerly ChRM declinations and the Kmax declinations. Because of the possibility of core rotation, the NNW-SSE trend in the EC core should be viewed with some caution.
The paleomagnetic data from both cores indicate that there are multiple magnetic components: an ITN component is commonly removed below 300°C, an ITR component removed between 300° and 440°C (DB core only), and a ChRM commonly removed between ∼300 and 460–500°C in both cores. No well-defined low temperature VRM could be isolated and no attempt was made to orient the DB core.
The maximum unblocking temperatures suggest the ChRM resides in magnetite which is consistent with rock magnetic data. The mean coercivity values based on the unmixing data for component 1 are consistent with the presence of magnetite (Egli, 2004). Component 3 is consistent with pyrrhotite. Based on this interpretation, the wasp-waisted hystersesis loop is attributed to the presence of the two magnetic phases which have different coercivities (e.g., Jackson et al., 1993; Tauxe et al., 1996). Wasp-waisted loops have also been observed in mixed magnetite/pyrrhotite bearing rocks (Dekkers, 1989; Muttoni, 1995).
Overall, rock magnetic and demagnetization data provide conflicting evidence for the presence of pyrrhotite, however, given that pyrrhotite has been reported by previous studies on the Marcellus (e.g., Manning and Elmore, 2012, 2015; Kars et al., 2015; Minguez et al., 2016), a strong likelihood exists of its presence in our study area. The maximum unblocking temperatures (∼250–300°C) for the ITN suggest it could reside in pyrrhotite or magnetite. The rock magnetic evidence suggests magnetite is present and perhaps pyrrhotite. The results of AF demagnetization, however, are not consistent with pyrrhotite carrying a remanence (Figures 4A, 7A). The ITR is interpreted to reside in magnetite based on the maximum unblocking temperatures of 440°C.
Comparing the inclinations to the expected inclinations indicates the age of the ChRM in DB has a broad range from 310 to 225 Ma (Figure 6). The directions for the ChRM in the oriented EC core are streaked which could have been caused by rotation of core barrels. Because of the variable declinations, an inclination plot was also used to determine that the ChRM has a broad age range of approximately 305–230 Ma (Figure 6).
A DIRM may be present in both cores but probably did not contaminate the ChRM which was removed at relatively high temperatures (e.g., Pinto and McWilliams, 1990; Wall and Worm, 2001). Because the ITN is steep, it is possible that it could be contaminated by a DIRM but it is not clear that the ITR could also be contaminated because it is removed at higher temperatures and it is of reversed polarity. Contamination by a steep down DIRM should have produced a shallower inclination in the ITR.
Many remagnetizations are interpreted as CRMs, however, other remagnetization mechanisms such as thermal viscous remanent magnetizations (TVRMs) are also possible (e.g., Kent, 1985; Dunlop et al., 2000). Thermal maturity values from conodont color alteration indices in areas of northeastern Pennsylvania are relatively high compared to other areas in the central Appalachian Basin (Kent, 1985; Jackson et al., 1988; Milliken et al., 2012). The Ro data from DB equates to a maximum heating temperature of approximately 200°C (Barker and Pawlewicz, 1986). The maximum unblocking temperatures of 500°C in the DB core are too high for the ChRM residing in magnetite to be a TVRM based on the burial temperatures (200°C) and the time temperature relaxation time curves for single domain magnetite (Dunlop et al., 2000) or multi domain magnetite (e.g., Kent, 1985). Therefore, the ChRM in DB is interpreted as a CRM.
Based on the polarities and comparison with the expected inclination plot, the ITN and ITR could be interpreted as normal and reversed Cretaceous to Cenozoic magnetizations (Figure 6). A likely alternative interpretation is that the ITN resides in magnetite and is contaminated by a Brunhes VRM. The ITN in DB and EC has maximum unblocking temperatures of 250–320°C which is consistent with a component contaminated by a Brunhes VRM based on time-temperature relaxation curves (e.g., Dunlop et al., 2000). If the ITN in DB and EC does reside in pyrrhotite, comparison with the time temperature relaxation time curves for pyrrhotite (Dunlop et al., 2000), suggest it is a CRM. The ITR in DB, which has higher unblocking temperatures, and resides in magnetite, is also interpreted as a CRM although a TVRM cannot be ruled out.
The Ro data from the EC suggests maximum burial temperatures were approximately 300°C (e.g., Barker and Pawlewicz, 1986). The burial temperatures are higher than the DB core because EC is located above a large Silurian salt structure and salt has a high thermal conductivity (Corrigan and Sweat, 1995). The burial temperature along with the lower maximum unblocking temperatures for the ChRM in the EC (460°C), suggests the ChRM could be a TVRM based on comparison with the time-temperature relaxation time curves (e.g., Kent, 1985; Dunlop et al., 2000) if the samples contain multi-domain magnetite. Therefore, the ChRM in magnetite in EC could be either a TVRM, CRM or a thermochemical remanent magnetization (TCRM).
Chemical remanent magnetizations can be acquired by alteration triggered by externally driven fluids or burial diagenetic processes (e.g., Elmore et al., 2012). Likely chemical remagnetization mechanisms are clay transformation (e.g., smectite to illite; Katz et al., 2000), maturation of organic matter (Banerjee et al., 1997; Blumstein et al., 2004), and the migration of fluids including hydrocarbons and orogenic fluids (Oliver, 1986, 1992; Elmore et al., 1987, 2001, 2006; Stamatakos et al., 1996; Dennie et al., 2012), and mineralizing fluids (e.g., Symons et al., 2005). Manning and Elmore (2012, 2015) suggest maturation of organic matter caused precipitation of magnetite and acquisition of a CRM in the Marcellus Formation in the Valley and Ridge.
The CRM in DB and EC is found in the diagenetically altered intervals (Cherry Valley) that contain minerals which could be hydrothermal in origin, such as saddle dolomite and sphalerite (e.g., Davies and Smith, 2006). An interpretation of hydrothermal alteration is also consistent with minerals found in the study area which are interpreted to have formed from expulsion of brines (Cathles and Smith, 1983) or hydrothermal fluids (Baldassare et al., 2014). However, the sphalerite and saddle dolomite could be related to TSR (e.g., Machel, 2001) and are not necessarily hydrothermal in origin. A hydrothermal origin of the CRM is consistent with the presence of the CRM in the diagenetically altered and veined facies, but the CRM is also present in the less altered facies. A low-moderate temperature burial diagenetic process is also possible for the CRM (e.g., Manning and Elmore (2015). In summary, the CRM in magnetite was caused by hydrothermal fluids or burial diagenetic processes, or a combination. Although the ChRM in EC could be a TVRM, the magnetite was likely chemical in origin. Fluid alteration or a burial diagenetic process could be the mechanism for formation of the magnetite.
The origin of the ITN component is uncertain (CRM or VRM?). If it resides in magnetite then it is likely a VRM. Pyrrhotite is probably present but it may not be a significant contributor to the remanence. The origin of the pyrrhotite could be TSR. The TSR process creates by-products such as pyrite, pyrrhotite, sphalerite, and saddle dolomite (Machel, 1987, 2001) most of which are found in the diagenetically altered breccias in both cores. Within veins in the DB, fluid inclusions containing methane are present which could also provide evidence for TSR (e.g., Machel, 2001). If the veins with methane inclusions are related to TSR, then they would have been created at a much younger age than Permian veining proposed by Evans et al. (2014). A TSR mechanism may explain pyrrhotite in both cores but not the ITR in DB which resides in magnetite. Magnetite is not a by-product of TSR (Machel, 2001). It could have been caused by external fluids or burial diagenetic processes.
It is interesting to note that other workers have reported post-Permian remagnetizations in the general region of the study area. For example, Minguez et al. (2016) report a Jurassic pyrrhotite remagnetization in the Marcellus Formation in the Valley and Ridge Province that they attributed to a hydrothermal event. They suggested it could be contemporaneous with a Jurassic hydrothermal event reported from the Newark Basin to the east (Witte and Kent, 1991) and to migration of hot fluids at 180 Ma which reset fission-track dates from the Devonian ash beds in the Valley and Ridge (Roden and Miller, 1989). It should be noted that the inclinations reported in this study for the ITN are much steeper than those reported by Minguez et al. (2016). The ITN could be steeper because of contamination by a DIRM, but such contamination does not explain the steep inclination of the ITR component in DB.
Regional remagnetization trends throughout the Appalachians as a result of the Alleghanian Orogeny have been investigated over the past several decades (Oliver, 1986; Miller and Kent, 1988; Jackson et al., 1988; McCabe et al., 1989; Stamatakos and Hirt, 1994; Elmore et al., 2001; Manning and Elmore, 2012). Stamatakos et al. (1996) found that there was a pattern associated with post-folding magnetizations in the hinterland, with syntilting magnetizations in the central part of the belt and pre-folding magnetizations in the foreland. The pattern was consistent with a fluid related remagnetization mechanism. The syntilting CRMs in the Marcellus Formation, reported by Manning and Elmore (2015) in the Valley and Ridge, are consistent with the remagnetization trend observed by Stamatakos et al. (1996). Because of the broad age ranges for the magnetizations reported in this study, it is not possible to test if tectonics influenced their occurrence as reported in other studies (e.g., Stamatakos et al., 1996; Manning and Elmore, 2015; Minguez et al., 2016).
The veins and brecciated diagenetically altered Cherry Velley Limestone intervals indicate alteration by fluids that were at least partially external in origin. This suggest that the Marcellus Formation was at some point an open diagenetic system.
Working with industry cores can provide valuable information that may not be available from outcrops but require oriented samples to reliably interpret paleomagnetic and AMS data. As with this study, specimen orientation has been challenging in some previous core-based studies (e.g., Minguez et al., 2016). Orienting a ChRM using a modern VRM has been successful in some cases (e.g., Rolphe et al., 1995; Dennie et al., 2012), although as demonstrated in this study, this method does not always work. One reason could be a DIRM which can contaminate a VRM. Minguez et al. (2016) reported that a DIRM in the core they were investigating may account for the lack of a VRM. Testing for a DIRM should be performed when working with cores because of the contamination issue (e.g., Minguez et al., 2016). Using cores oriented with scribe method, the conventional approach in the oil industry, should be viewed with caution. In some cases it can work (e.g., Dennie et al., 2012) but core barrel rotation can be a problem. As demonstrated by this study as well as others, using an “inclination only” approach can work if borehole deviation angles are known. The approach is not ideal, however, because the timing that is determined is not necessarily unique and can result in broad ranges for the age of the magnetizations.
Conclusion
The AMS results indicate that both cores contain a predominately oblate sedimentary compactional magnetic fabric. The fabric in EC may be influenced by tectonic deformation and specimens with a prolate fabric are interpreted to be diagenetically altered.
The Marcellus Formation has a complex diagenetic history as indicated by paleomagnetic and petrographic analyses. The DB contains a CRM in magnetite with an age range of 305–225 Ma and is found in veined and brecciated intervals which suggest it may be related to external fluids. The fact that the CRM is also found in all facies suggests that low-moderate temperature burial diagenetic processes could also be responsible for the CRM. The EC ChRM in resides in magnetite and could be a CRM, TVRM, or TCRM. It was acquired between 310 and 230 Ma. Elevated burial temperatures in the EC are interpreted to be related to an underlying salt structure (O’Brien and Lerche, 1984). If a TVRM is present, the magnetite was likely chemical in origin and formed by processes similar to those in DB.
The Cretaceous-Cenozoic ITN and ITR components are present in the DB and the ITN is present in EC. The ITN probably resides in magnetite and could be contaminated by a Brunhes VRM. The ITR in DB resides in magnetite and could be a CRM or TVRM.
The results of this study suggest that shale diagenesis in the Marcellus Formation has a complex paragenesis and was a partially open diagenetic system during its evolution. As other studies have reported, the unit has a complex magnetic history with multiple components (Kars et al., 2015; Manning and Elmore, 2015; Minguez et al., 2016). This study also illustrates the issues and challenges of working with both oriented and unoriented cores.
Data Availability
All datasets generated for this study are included in the manuscript and/or the Supplementary Files.
Author Contributions
AS conducted the original research (M.S. thesis), sampling, data acquisition and analysis, and wrote the first draft of the manuscript. RE acquired permission to access the cores and contributed to the design and analysis of the data as well as performing extensive revisions. MH performed some of the data analysis and as well as reviewing the manuscript. GH acquired and analyzed the rock magnetic data and helped with revisions.
Funding
Chesapeake Energy Corporation provided funding for sampling the cores. RE provided some funds from his discretionary account to perform the research.
Conflict of Interest Statement
AS is employed by Noble Energy. Noble Energy was not involved nor did the company provide any funding for the project.
The remaining authors declare that the research was conducted in the absence of any commercial or financial relationships that could be construed as a potential conflict of interest.
Acknowledgments
We thank Chesapeake Energy Corporation for providing the cores, and the two reviewers for excellent suggestions which improved the manuscript. We also thank Dr. Mark Evans, Dr. Mike Engel, and Dr. Shannon Dulin as well as the undergraduate workers for their help with this project, and Dr. Eric Ferré for providing the hysteresis data.
Supplementary Material
The Supplementary Material for this article can be found online at: https://www.frontiersin.org/articles/10.3389/feart.2019.00185/full#supplementary-material
References
Arason, P., and Levi, S. (2010). Maximum likelihood solution for inclination-only data in paleomagnetism. Geophys. J. Int. 182, 753–771. doi: 10.1111/j.1365-246X.2010.04671.x
Audunsson, H., and Levi, S. (1989). Drilling-induced remanent magnetization in basalt drill Cores. Geophy. J. 98, 613–622. doi: 10.1111/j.1365-246x.1989.tb02294.x
Baldassare, F. J., McCaffrey, M. A., and Harper, J. A. (2014). A geochemical context for stray gas investigations in the northern Appalachian Basin: implications of analyses of natural gases from Neogene – through Devonian –age strata. Am. Assoc. Pet. Geolog. Bull. 98, 342–372.
Banerjee, S., Elmore, R. D., and Engel, M. H. (1997). Chemical remagnetization and burial diagenesis: testing the hypothesis in the Pennsylvanian Belden Formation, Colorado. J. Geophys. Res. 102, 24825–24842. doi: 10.1029/97jb01893
Barker, C. E., and Pawlewicz, M. J. (1986). The Correlation of Vitrinite Reflectance With Maximum Temperature in Humic Organic Matter: Paleogeothermics. Berlin: Springer-Verlag.
Berg, T. M., Edmunds, W. E., Geyer, A. R., Glover, A. D., Hoskins, D. M., MacLachlan, D. B., et al. (1980). Geologic Map of Pennsylvania, 2nd edn. Pennsylvania: Pennsylvania Geol. Sur.
Bjørlykke, K., and Jahren, J. (2012). Open or closed geochemical systems during diagenesis in sedimentary basins: constraints on mass transfer during diagenesis and the prediction of porosity in sandstone and carbonate reservoirs. Am. Assoc. Petrol. Geol. Bull. 96, 2193–2214. doi: 10.1306/04301211139
Blumstein, A. M., Elmore, R. D., Engel, M. H., Elliot, C., and Basu, A. (2004). Paleomagnetic dating of burial diagenesis in Mississippian carbonates. Utah. J. Geophys. Res. 109: B04101. doi: 10.1029/2003JB002698
Burmeister, K., Harrison, M., Marshak, S., Ferre, E., Bannister, R., and Kodama, K. (2009). Comparison of Fry strain ellipse and AMS ellipsoid trends to tectonic fabric trends in very low-strain sandstone of the Appalachian fold–thrust belt. J. Struct. Geol. 31, 1028–1038. doi: 10.1016/j.jsg.2009.03.010
Cathles, L. M., and Smith, A. T. (1983). Thermal constraints on the formation of Mississippi Valley Type lead-zinc deposits and their implications for episodic basin dewatering and deposit genesis. Econ. Geol. 78, 983–1002. doi: 10.2113/gsecongeo.78.5.983
Corrigan, J., and Sweat, M. (1995). Heat flow and gravity responses over salt bodies: a comparative model analysis. Geophysics 60, 1029–1037. doi: 10.1190/1.1443831
Davies, G. R., and Smith, L. B. (2006). Structurally controlled hydrothermal dolomite reservoir facies: an overview. Am. Assoc. Petrol. Geol. Bull. 90, 1641–1690. doi: 10.1306/05220605164
Dekkers, M. J. (1989). Magnetic properties of natural pyrrhotite. II. High-and low-temperature behaviour of Jrs and TRM as function of grain size. Phys. Earth Planet. Inter. 57, 266–283. doi: 10.1016/0031-9201(89)90116-7
Dennie, D., Elmore, R. D., Deng, J., Manning, E. B., and Pannalal, J. (2012). “Paleomagnetism of the Mississippian Barnett Shale, Fort Worth Basin, Texas,” in Remagnetization and Chemical Alteration of Sedimentary Rocks, eds R. D. Elmore, A. R. Muxworthy, M. Aldana, and M. Mena (London: Geological Society of London, Special Publication), 89–106.
Dunlop, D. J., Özdemir, Ö, Clark, D. A., and Schmidt, P. W. (2000). Time-temperature relations for the remagnetization of pyrrhotite (Fe7S8) and their use in estimating paleotemperatures. Earth Planet. Sci. Lett. 176, 107–116. doi: 10.1016/s0012-821x(99)00309-x
Egli, R. (2004). Characterization of individual rock magnetic components by analysis of remanence curves, 1. Unmixing natural sediments. Stud. Geophys. Geodaet. 48, 391–446. doi: 10.1023/b:sgeg.0000020839.45304.6d
Elmore, R. D., Engel, M. H., Crawford, L., Nick, K., Imbus, S., and Sofer, Z. (1987). Evidence for a relationship between hydrocarbons and authigenic magnetite. Nature 325, 428–430. doi: 10.1038/325428a0
Elmore, R. D., Foucher, J., Evans, M., Lewchuk, M., and Cox, E. (2006). Remagnetization of the Tonoloway formation and the Helderberg group in the central appalachians; testing the origins of syntilting magnetizations. Geophys. J. Int. 166, 1062–1076. doi: 10.1111/j.1365-246x.2006.02875.x
Elmore, R. D., Heij, G., and Wickard, A. (2016). Paragenesis of mineralized fractures and diagenesis of prominent North American shales. Sed. Rec. 14, 2–10.
Elmore, R. D., Kelley, J., Evans, M., and Lewchuk, M. T. (2001). Remagnetization and orogenic fluids: #esting the hypothesis in the central Appalachians. Geophys. J. Int. 144, 568–576. doi: 10.1111/j.1365-246x.2001.00349.x
Elmore, R. D., Muxworthy, A. R., and Aldana, M. (2012). “Remagnetization and chemical alteration of sedimentary rocks,” in Remagnetization and Chemical Alteration of Sedimentary Rocks, Vol. 371, eds R. D. Elmore, A. R. Muxworthy, M. Aldana, and M. Mena (London: Geological Society of London, Special Publication), 1–21. doi: 10.1144/sp371.15
Ettensohn, F. R. (1985). The catskill delta complex and the acadian orogeny. A model. Geol. Soc. Am. Spec. Pap. 201, 39–49.
Evans, M. A., DeLisle, A., Leo, J., and LaFonte, C. (2014). Deformation conditions for fracturing in the Middle Devonian sequence of the central Appalachians during the Late Paleozoic Alleghenian orogeny. Am. Assoc. Pet. Geol. Bull. 98, 2263–2299. doi: 10.1306/07221413135
Goldstein, R. H. (2003). Fluid inclusions in sedimentary and diagenetic systems. Lithos 55, 159–193. doi: 10.1186/s12932-017-0041-4
Harrison, M. J., Marshak, S., and Onasch, C. M. (2004). Stratigraphic control of hot fluids on anthracitization, Lackawanna synclinorium, Pennsylvania. Tectonophysics 378, 85–103. doi: 10.1016/j.tecto.2003.10.010
Hatcher, R. D. Jr., Thomas, W. A., Geiser, P. A., Snoke, A. W., Mosher, S., and Wiltschko, D. V. (1989). “Alleghenian orogen,” in The Appalachian-Ouachita Orogen in the United States, Geology of North America, F–2, eds R. D. Hatcher Jr., W. A. Thomas, and G. W. Viele (Boulder, CO: Geol. Soc. Am.), 233–318. doi: 10.1130/dnag-gna-f2.233
Heij, G. W., and Elmore, R. D. (2019). The magnetic fabric of the Wolfcamp Shale, Midland Basin: understanding petrofabric variability, hydrocarbon associations and iron enrichment. Am. Assoc. Petrol. Geol. Bull. doi: 10.1306/04101918140 [Epub ahead of print]
Hirt, A. M., Evans, K. F., and Engelder, T. (1995). Correlation between magnetic anisotropy and fabric for Devonian shales on the Appalachian Plateau. Tectonophysics 247, 121–132. doi: 10.1016/0040-1951(94)00176-a
Jackson, M., Borradaile, G., Hudleston, P., and Banerjee, S. (1993). Experimental deformation of synthetic magnetite-bearing calcite sandstones: effects on remanence, bulk magnetic properties, and magnetic anisotropy. J. Geophys. Res. 98, 383–401. doi: 10.1029/92jb01028
Jackson, M., and Solheid, P. (2010). On the quantitative analysis and evaluation of magnetic hysteresis data. Geochem. Geophys. Geosyst. 11:Q04Z15. doi: 10.1029/2009GC002932
Jackson, M. J., McCabe, C., Ballard, M. M., and Van der Voo, R. (1988). Magnetite authigenesis and diagenetic paleotemperatures across the northern Appalachian Basin. Geology 16, 592–595.
Jarvie, D. M., Claxton, B. L., Henk, F., and Breyer, J. T. (2001). Oil and Shale Gas from the Barnett Shale, Fort Worth Basin, Texas. Denver, CO: AAPG National Convention.
Kars, M., Aubourg, C., and Suárez-Ruiz, I. (2015). Neoformed magnetic minerals as an indicator of moderate burial: the key example of Middle Paleozoic sedimentary rocks, West Virginia, USA. Am. Assoc. Pet. Geol. Bull. 99, 389–401. doi: 10.1306/06301413006
Katz, B., Elmore, D. R., Cogoini, M., Engel, M. H., and Ferry, S. (2000). Associations between burial diagenesis of smectite, chemical remagnetization, and magnetite authigenesis in the Vocontian Trough, SE France. J. Geophys. Res. 105, 851–868. doi: 10.1029/1999jb900309
Kent, D. V. (1985). Thermoviscous remagnetization in some Appalachian limestones. Geophys. Res. Lett. 12, 805–808. doi: 10.1029/gl012i012p00805
Kirschvink, J. L. (1980). The least squares line and plane and the analysis of paleomagnetic data. Geophys. J. R. Astron. Soc. 62, 699–718. doi: 10.1111/j.1365-246x.1980.tb02601.x
Land, L., Mack, L., Milliken, K., and Lynch, L. (1997). Burial diagenesis of argillaceous sediment, south Texas Gulf of Mexico sedimentary basin: a reexamination. Geol. Soc. Am. Bull. 109, 2–15. doi: 10.1130/0016-7606(1997)109<0002:bdoass>2.3.co;2
Lash, G., and Blood, R. (2011). Chemostratigraphic Trends of the Middle Devonian Marcellus Shale, Appalachian Basin: Preliminary Observations. Denver, CO: AAPG National Convention.
Lash, G., and Engelder, T. (2011). Thickness trends and sequence stratigraphy of the Middle Devonian Marcellus Formation, Appalachian Basin: implications for Acadian foreland basin evolution. Am. Assoc. Petrol. Geol. Bull. 95, 61–103. doi: 10.1306/06301009150
Machel, H. G. (1987). Saddle dolomite as a by-product of chemical compaction and thermochemical sulfate reduction. Geology 15, 936–940.
Machel, H. G. (2001). Bacterial and thermochemical sulfate reduction in diagenetic settings – old and new insights. Sedimen. Geol. 140, 143–175. doi: 10.1016/s0037-0738(00)00176-7
Manning, E. B. (2011). An Integrated Paleomagnetic, Rock Magnetic, and Geochemical Study of the Marcellus Shale in the Valley and Ridge province in Pennsylvania and West Virginia. Master’s thesis, University of Oklahoma, Norman, OK.
Manning, E. B., and Elmore, R. D. (2012). “Rock magnetism and identification of remanence components in the Marcellus Shale, Pennsylvania,” in Remagnetization and Chemical Alteration of Sedimentary Rocks, Vol. 371, eds R. D. Elmore, A. R. Muxworthy, M. Aldana, and M. Mena (London: Geological Society of London, Special Publication), 271–282. doi: 10.1144/sp371.9
Manning, E. B., and Elmore, R. D. (2015). An integrated paleomagnetic, rock magnetic, and geochemical study of the Marcellus Shale in the Valley and Ridge province in Pennsylvania and West Virginia. J. Geophys. Res. 120, 705–724. doi: 10.1002/2014JB011418
Maxbauer, D. P., Feinberg, J. M., and Fox, D. L. (2016). Magnetic mineral assemblages in soils and paleosols as the basis for paleoprecipitation proxies, A review of magnetic methods and challenges. Earth Sci. Rev. 155, 28–48. doi: 10.1016/j.earscirev.2016.01.014
McCabe, C., Jackson, M., and Saffer, B. (1989). Regional patterns of magnetite authigenesis in the Appalachian basin: implications for the mechanism of late Paleozoic remagnetization. J. Geophys. Res. 94, 10429–10443. doi: 10.1029/jb094ib08p10429
Miller, J. D., and Kent, D. V. (1988). Regional trends in the timing of Alleghenian remagnetization in the Appalachians. Geology 16, 588–591.
Milliken, K. L., Rudnicki, M., Awwiller, D. W., and Tongwei, Z. (2012). Organic matter– hosted pore system, Marcellus Formation (Devonian), Pennsylvania. Am. Assoc. Petrol. Geol. Bull. 97, 177–200. doi: 10.1306/07231212048
Minguez, D., Kodama, K. P., and Engelder, T. (2016). Paleomagnetism of the Oatka Creek Member of the Marcellus Formation: a Devonian paleopole for North America. Geol. Soc. Am. Bull. 128, 707–718. doi: 10.1130/B31291.1
Muttoni, G. (1995). “Wasp-waisted” hysteresis loops from a pyrrhotite and magnetite-bearing remagnetized Triassic limestone. Geophys. Res. Lett. 22, 3167–3170. doi: 10.1029/95gl03073
Nelson, R. A., Lenox, L. C., and Ward, B. J. (1987). Oriented core: Its use, error, and uncertainty. Am. Assoc. Petrol. Geol. Bull. 71, 357–367. doi: 10.1371/journal.pcbi.1000995
O’Brien, J. J., and Lerche, I. (1984). The influence of salt domes on paleotemperature distributions. Geophysics 49, 2032–2043. doi: 10.1190/1.1441614
Oliver, J. (1992). The spots and stains of plate tectonics. Earth Sci. Rev. 32, 77–106. doi: 10.1016/0012-8252(92)90013-j
Oliver, R. (1986). Fluids expelled tectonically from orogenic belts: their role in hydrocarbon migration and other geologic phenomena. Geology 14, 99–102.
Parés, J. M. (2015). Sixty years of anisotropy of magnetic susceptibility in deformed sedimentary rocks. Front. Earth Sci. 3:4.
Paterson, G. A., Zhao, X., Jackson, M., and Heslop, D. (2018). Measuring, processing, and analyzing hysteresis data. Geochem. Geophys. Geosyst. 19, 1925–1935. doi: 10.1029/2018GC007620
Pinto, M. J., and McWilliams, M. (1990). Drilling-induced isothermal remanent magnetization. Geophysics 55, 111–115. doi: 10.1190/1.1442765
Quinlan, G. M., and Beaumont, C. (1984). Appalachian thrusting, lithospheric flexure, and the Paleozoic stratigraphy of the eastern interior of North America. Can. J. Earth. Sci. 21, 973–996. doi: 10.1139/e84-103
Roden, M., and Miller, D. (1989). Apatite fission-track thermochronology of the Pennsylvania Appalachian Basin. Geomorphology 2, 39–51. doi: 10.1016/0169-555x(89)90005-6
Rolphe, T. C., Shaw, J., Harper, T. R., and Hagan, J. T. (1995). Viscous remanent magnetization: a tool for orienting drill cores. Geolog. Soc. Lond. Spec. Pub. 98, 239–243. doi: 10.1144/gsl.sp.1995.098.01.14
Ryder, R. T., Hackley, P. C., Almi, H., and Trippi, M. H. (2013). Evaluation of Thermal Maturity in the Low Maturity Devonian Shales of the Northern Appalachian Basin. Denver, CO: AAPG National Convention.
Sageman, B. R., Murphy, A. E., Werne, J. P., Ver Straeten, C. A., Hollander, D. J., and Lyons, T. W. (2003). A tale of shales: the relative roles of production, decomposition, and dilution in the accumulation of organic-rich strata, Middle–Upper Devonian, Appalachian basin. Chem. Geol. 95, 229–273. doi: 10.1016/s0009-2541(02)00397-2
Schwehr, K., Tauxe, L., Driscoll, N., and Lee, H. (2006). Detecting compaction disequilibrium with anisotropy of magnetic susceptibility. Geochem. Geophys. Geosyst. 7:Q11002.
Smith, L. B., Schieber, J., and Wilson, R. (2019). Shallow-water onlap model for the deposition of Devonian black shales in New York, USA. Geology 47, 279–283. doi: 10.1130/G45569.1
Stamatakos, J., Hirt, A., and Lowrie, W. (1996). The age and timing of folding in the Central Appalachians from paleomagnetic results. Geol. Soc. Am. Bull. 108, 815–829. doi: 10.1130/0016-7606(1996)108<0815:taatof>2.3.co;2
Stamatakos, J., and Hirt, A. M. (1994). Paleomagnetic considerations of the development of the Pennsylvania salient in the central Appalachians. Tectonophysics 231, 237–255. doi: 10.1016/0040-1951(94)90037-x
Steullet, A. (2014). An Integrated Paleomagnetic and Diagenetic Study of the Marcellus Shale Within the Plateau Province of the Appalachian Basin. Master’s thesis, University of Oklahoma, Norman, OK.
Suk, D., Van der Voo, R., Peacor, D. R., and Lohmann, K. C. (1993). Late Paleozoic remagnetization and its carrier in the Trenton and Black River carbonates from the Michigan Basin. J. Geol. 101, 795–808. doi: 10.1086/648275
Symons, D. T., Pannalal, S. R., Coveney, R. M., and Sangster, D. F. (2005). Paleomagnetism of late Paleozoic strata and mineralization in the Tri-state lead zinc ore district. Econ. Geol. 100, 295–309. doi: 10.2113/100.2.295
Tarling, D. H., and Hrouda, F. (1993). The Magnetic Anisotropy of Rocks. London: Chapman and Hall, 217.
Tauxe, L., Mullender, T. A. T., and Pick, T. (1996). Potbellies, wasp-waists, and superparamagnetism in magnetic hysteresis. J. Geophys. Res. 101, 571–583. doi: 10.1029/95jb03041
Torsvik, T. H. (2000). Super IAPD Interactive Analysis of Paleomagnetic Data. Available at: www.geodynamics.no/software.htm (accessed December 1, 2018).
Torsvik, T. H., Van der Voo, R., Preeden, U., Niocaill, C. M., Steinberger, B., Doubrovine, P. V., et al. (2012). Phanerozoic polar wander, palaeogeography and dynamics. Earth Sci. Rev. 14, 325–368. doi: 10.1016/j.earscirev.2012.06.007
Van der Voo, R., and Watts, D. R. (1978). Paleomagnetic results from igneous and sedimentary rocks from the Michigan Basin borehole. J. Geophys. Res. 83, 5844–5848. doi: 10.1029/jb083ib12p05844
Wall, H. D., and Worm, H. U. (2001). Recognition of drilling induced magnetization by Q-factor analysis, A case study from the KTB drillholes. J. Appl. Geophys. 46, 55–64. doi: 10.1016/s0926-9851(00)00039-2
Wang, G., and Carr, T. (2013). Organic-rich Marcellus Shale lithofacies modeling and distribution pattern analysis in the Appalachian Basin. Am. Assoc. Petrol. Geol. Bull. 97, 2173–2205. doi: 10.1306/05141312135
Werne, J., Sageman, B., Lyons, T., and Hollander, D. (2002). An integrated assessment of a “type euxinic” deposit; evidence for multiple controls on black shale deposition in the Middle Devonian Oatka Creek Formation. Am. J. Sci. 302, 110–143. doi: 10.2475/ajs.302.2.110
Witte, W. K., and Kent, D. V. (1991). Tectonic implications of a remagnetization event in the Newark Basin. J. Geophys. Res. 96, 19569–19582. doi: 10.1029/91jb01866
Keywords: remagnetizations, paleomagnetism, rock-magnetism, diagenesis, Marcellus
Citation: Steullet AK, Elmore RD, Hamilton M and Heij G (2019) Remagnetization of Marcellus Formation in the Plateau Province of the Appalachian Basin. Front. Earth Sci. 7:185. doi: 10.3389/feart.2019.00185
Received: 15 February 2019; Accepted: 01 July 2019;
Published: 19 July 2019.
Edited by:
Eric Font, University of Coimbra, PortugalReviewed by:
Juan Jose Villalain, University of Burgos, SpainMike Jackson, University of Minnesota Twin Cities, United States
Copyright © 2019 Steullet, Elmore, Hamilton and Heij. This is an open-access article distributed under the terms of the Creative Commons Attribution License (CC BY). The use, distribution or reproduction in other forums is permitted, provided the original author(s) and the copyright owner(s) are credited and that the original publication in this journal is cited, in accordance with accepted academic practice. No use, distribution or reproduction is permitted which does not comply with these terms.
*Correspondence: R. Douglas Elmore, delmore@ou.edu