Estimation of the Thermal Structure Beneath the Volcanic Arc of the Northern Andes by Coda Wave Attenuation Tomography
 Carlos A. Vargas
 Luis H. Ochoa
 Alexander Caneva
- Department of Geosciences, Universidad Nacional de Colombia, Bogotá, Colombia
In the Northern Andes, the magmatic arc rises from a broad area of active volcanism in the South, at the border between Ecuador and Colombia, to a linear north-directed trend of active and inactive volcanic cones. A ∼240-km-long west-east-striking slab tear (Caldas Tear) located approx. 5.5°N creates an offset in the volcanic arc. This tear looks like a significant controller of volcanic activity: its quasi-WE structure separates inactive magmatic bodies of late Miocene age or older in the North from Quaternary magmatic activity in the South. Coda wave attenuation tomography applied on seismic waveforms recorded between 1993 and 2018 illuminates the volcanic arc, which appears as a segmented structure derived from the complex process of subduction of the Nazca and Caribbean plates under the South America Continent. The attenuation measurements are transformed into thermal measurement using standard rock physics relationships, supported by thermal estimations and geothermal gradient observations measured in wells. Active and inactive magmatic belts are associated with a range of relatively low temperatures (∼640 to ∼810°C in the depth range of 25–100 km), which may be a consequence of the fluid content in hydrous minerals. Along the volcanic arc, the isotherms become shallower from South to North and are interrupted by a cold structure; this structure may reflect a lateral change of the mantle viscosity that prevents the continuity of the volcanic arc. Our estimations show an irregular depth-geometry of the isotherms, probably associated with recent slip events that have perturbed the thermal state along the study area. The isotherms also deepen to the West, probably due to the subduction process of the Nazca Plate (∼0–5°N). In some areas, the isotherms follow a trend similar to that of a thrust fault-related folding geometry, which suggests a recent process of regional perturbation. We hypothesize that the Panama Arc collision at the north and the effect that imprint the Carnegie Ridge against the continent at the South are responsible for these thermal effects. The northern anomaly suggests thickening of the lithospheric system that prevents the development of the volcanic arc at the north of the Caldas Tear.
Introduction
During the past decades, the study of the thermal structure of the lithosphere was carried out indirectly, due to the technical restriction imposed by direct measurements at significant depths. The deepest drilling in the world has exceptionally exceeded 10 km (see, e.g., the Kola Superdeep Borehole with 12.262 m, in Ramberg et al., 2008), so that, its information only allows to verify trends of thermal behavior in the most superficial part of the Earth’s lithosphere. Under certain conditions, magmatic or hydrothermal surface manifestations are mechanisms for control and verification of indirect observations. However, estimates based on exploratory hydrocarbon programs and geothermal exploitation purposes have been the most accepted approaches to establish the trend of isotherms in depth. Indirect measurements based on seismological and magnetotelluric datasets have deserved special attention as deeper exploration mechanism, but these geophysical approaches still incorporate significant uncertainties that limit the understanding of the lithospheric system (see, e.g., Ricard et al., 2014; Poletto et al., 2018).
The thermal structure along convergent regions, such as those where coexist subduction zones, volcanic arcs, and the mantle wedges, depends upon diversity of dynamic and rheological factors (Kincaid and Sacks, 1997). In some cases, the presence of magmatic activity hints that temperatures must give fluidization conditions someplace inside the mantle wedge. This scenario promotes buoyancy of the upper lithosphere which modifies the structural and magmatic development of the overriding plate and the retreating plate boundaries that can prevent subduction rollback, a process that may locally pin the subduction hinge and promotes tectonic anomalies, including cusps and slab tearing.
The lithospheric system of the NW South America is a consequence of different conditions of relief, age and converging velocities of at least three slabs (see, e.g., Trenkamp et al., 2002; Cediel et al., 2003; Gutscher and Westbrook, 2009; Carrillo et al., 2016), which promote a broad variety of subduction types along approx. 2000 km on the Pacific and Caribbean margins (Figure 1). It is also thought that the Northern Andes morphology is the result of the deep interaction of the Nazca and Caribbean plates under NW South America (Taboada et al., 2000; Mora et al., 2015). The orogen in this region is broad at the south and splits into three cordilleras northward with changes in the spatial distribution of the volcanic arc, direction, composition, dominant age of the basement lithologies, and structural styles (Parra et al., 2012; Reyes-Harker et al., 2015). These changes generate a complex lithospheric system with significant uncertainties about its thermal structure.
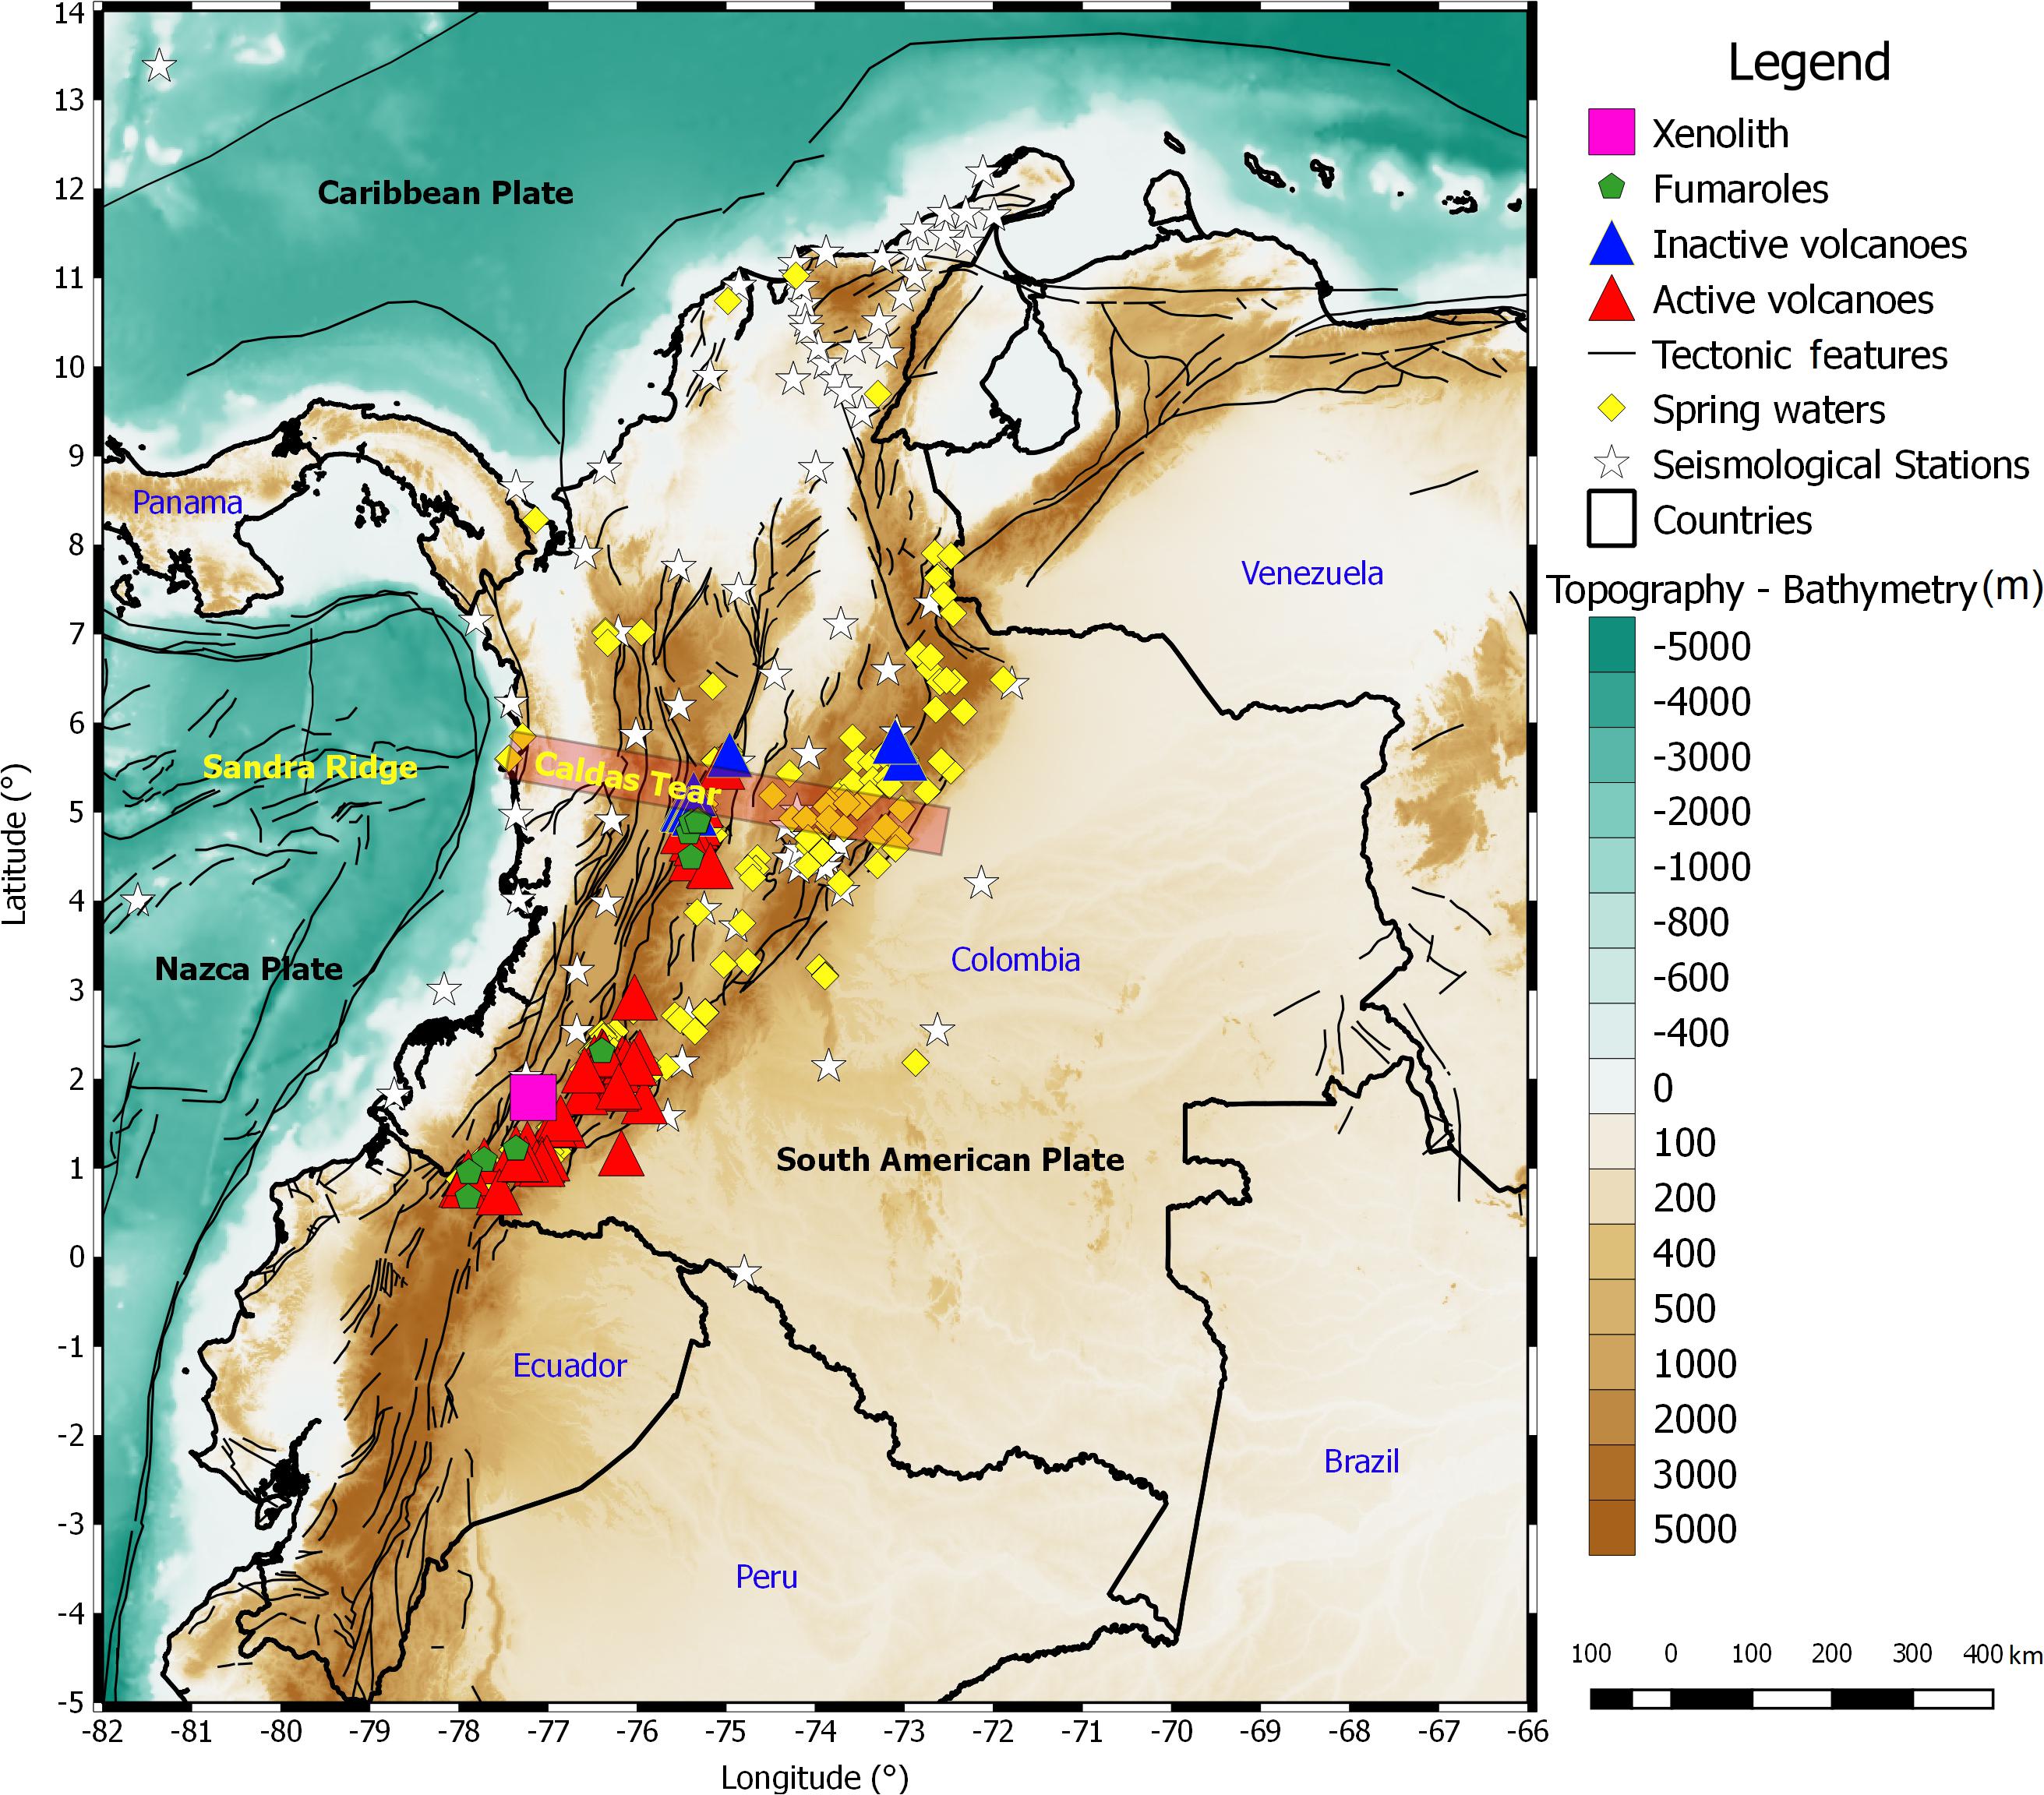
Figure 1. Location of the volcanic arc of the Northern Andes. Triangles represent the active (red) and inactive (blue) volcanoes. Hydrothermal activity is represented by spring waters (yellow diamonds) and fumarolic activity (green pentagons). Tectonic features (black lines) are represented on a bathymetric-topographic map where is highlighted the collinear trend of the Sandra Ridge and the Caldas Tear (pink band). White starts correspond to seismological stations of the Servicio Geológico Colombiano.
In this work, we are presenting an analysis of the active volcanic arc of the NW South America using seismic attenuation tomography, geothermal datasets and xenolith information presented in previous works. This information is used to evaluate the thermal structure of the upper lithospheric system and illuminating the thermal anomalies associated with the volcanic arc. Finally, we present a conceptual model supported in the tomographic images and isotherm estimations to explaining the spatial pattern of the active volcanic arc, the role of a lithospheric tear that controls the most north occurrence of volcanic bodies of the Andes, as well as the thermal perturbations, promote by the present-day regional collisions.
Geotectonic Setting
NW South America conforms a tectonic mosaic where interact three lithospheric plates: the Nazca and Caribbean plates of oceanic origin and the South American Plate, a continental plate with a sizeable tectonic history. The Northern Andes are also a consequence of the repeated interaction between terranes of different affinity, age and stress regimes that accreted against the continental margin of NW South America, which resulted in three cordilleras with pulses of uplift from the Paleogene (Gomez et al., 2003; Parra et al., 2009; Parra et al., 2012; Reyes-Harker et al., 2015; Anderson et al., 2016) to the present.
The Nazca Plate was formed by the splitting of the oceanic Farallon Plate in the early Neogene into the Nazca and Cocos plates (Lonsdale, 2005; Colgan et al., 2011). Presently, the Nazca Plate is converging eastward relative to South America with tectonic activity mostly along the continental boundaries and under the Andes range (see Figures 1, 2). A relevant bathymetric feature inside this plate is the Sandra Ridge, a submarine structure that has been suggested as an aborted rift, and part of an early axis of magmatic diffusion with activity since 12–9 Ma (Lonsdale, 2005). Currently, the seismicity is associated with this structure, which has been considered evidence of residual tectonism or reactivated since the late Miocene.
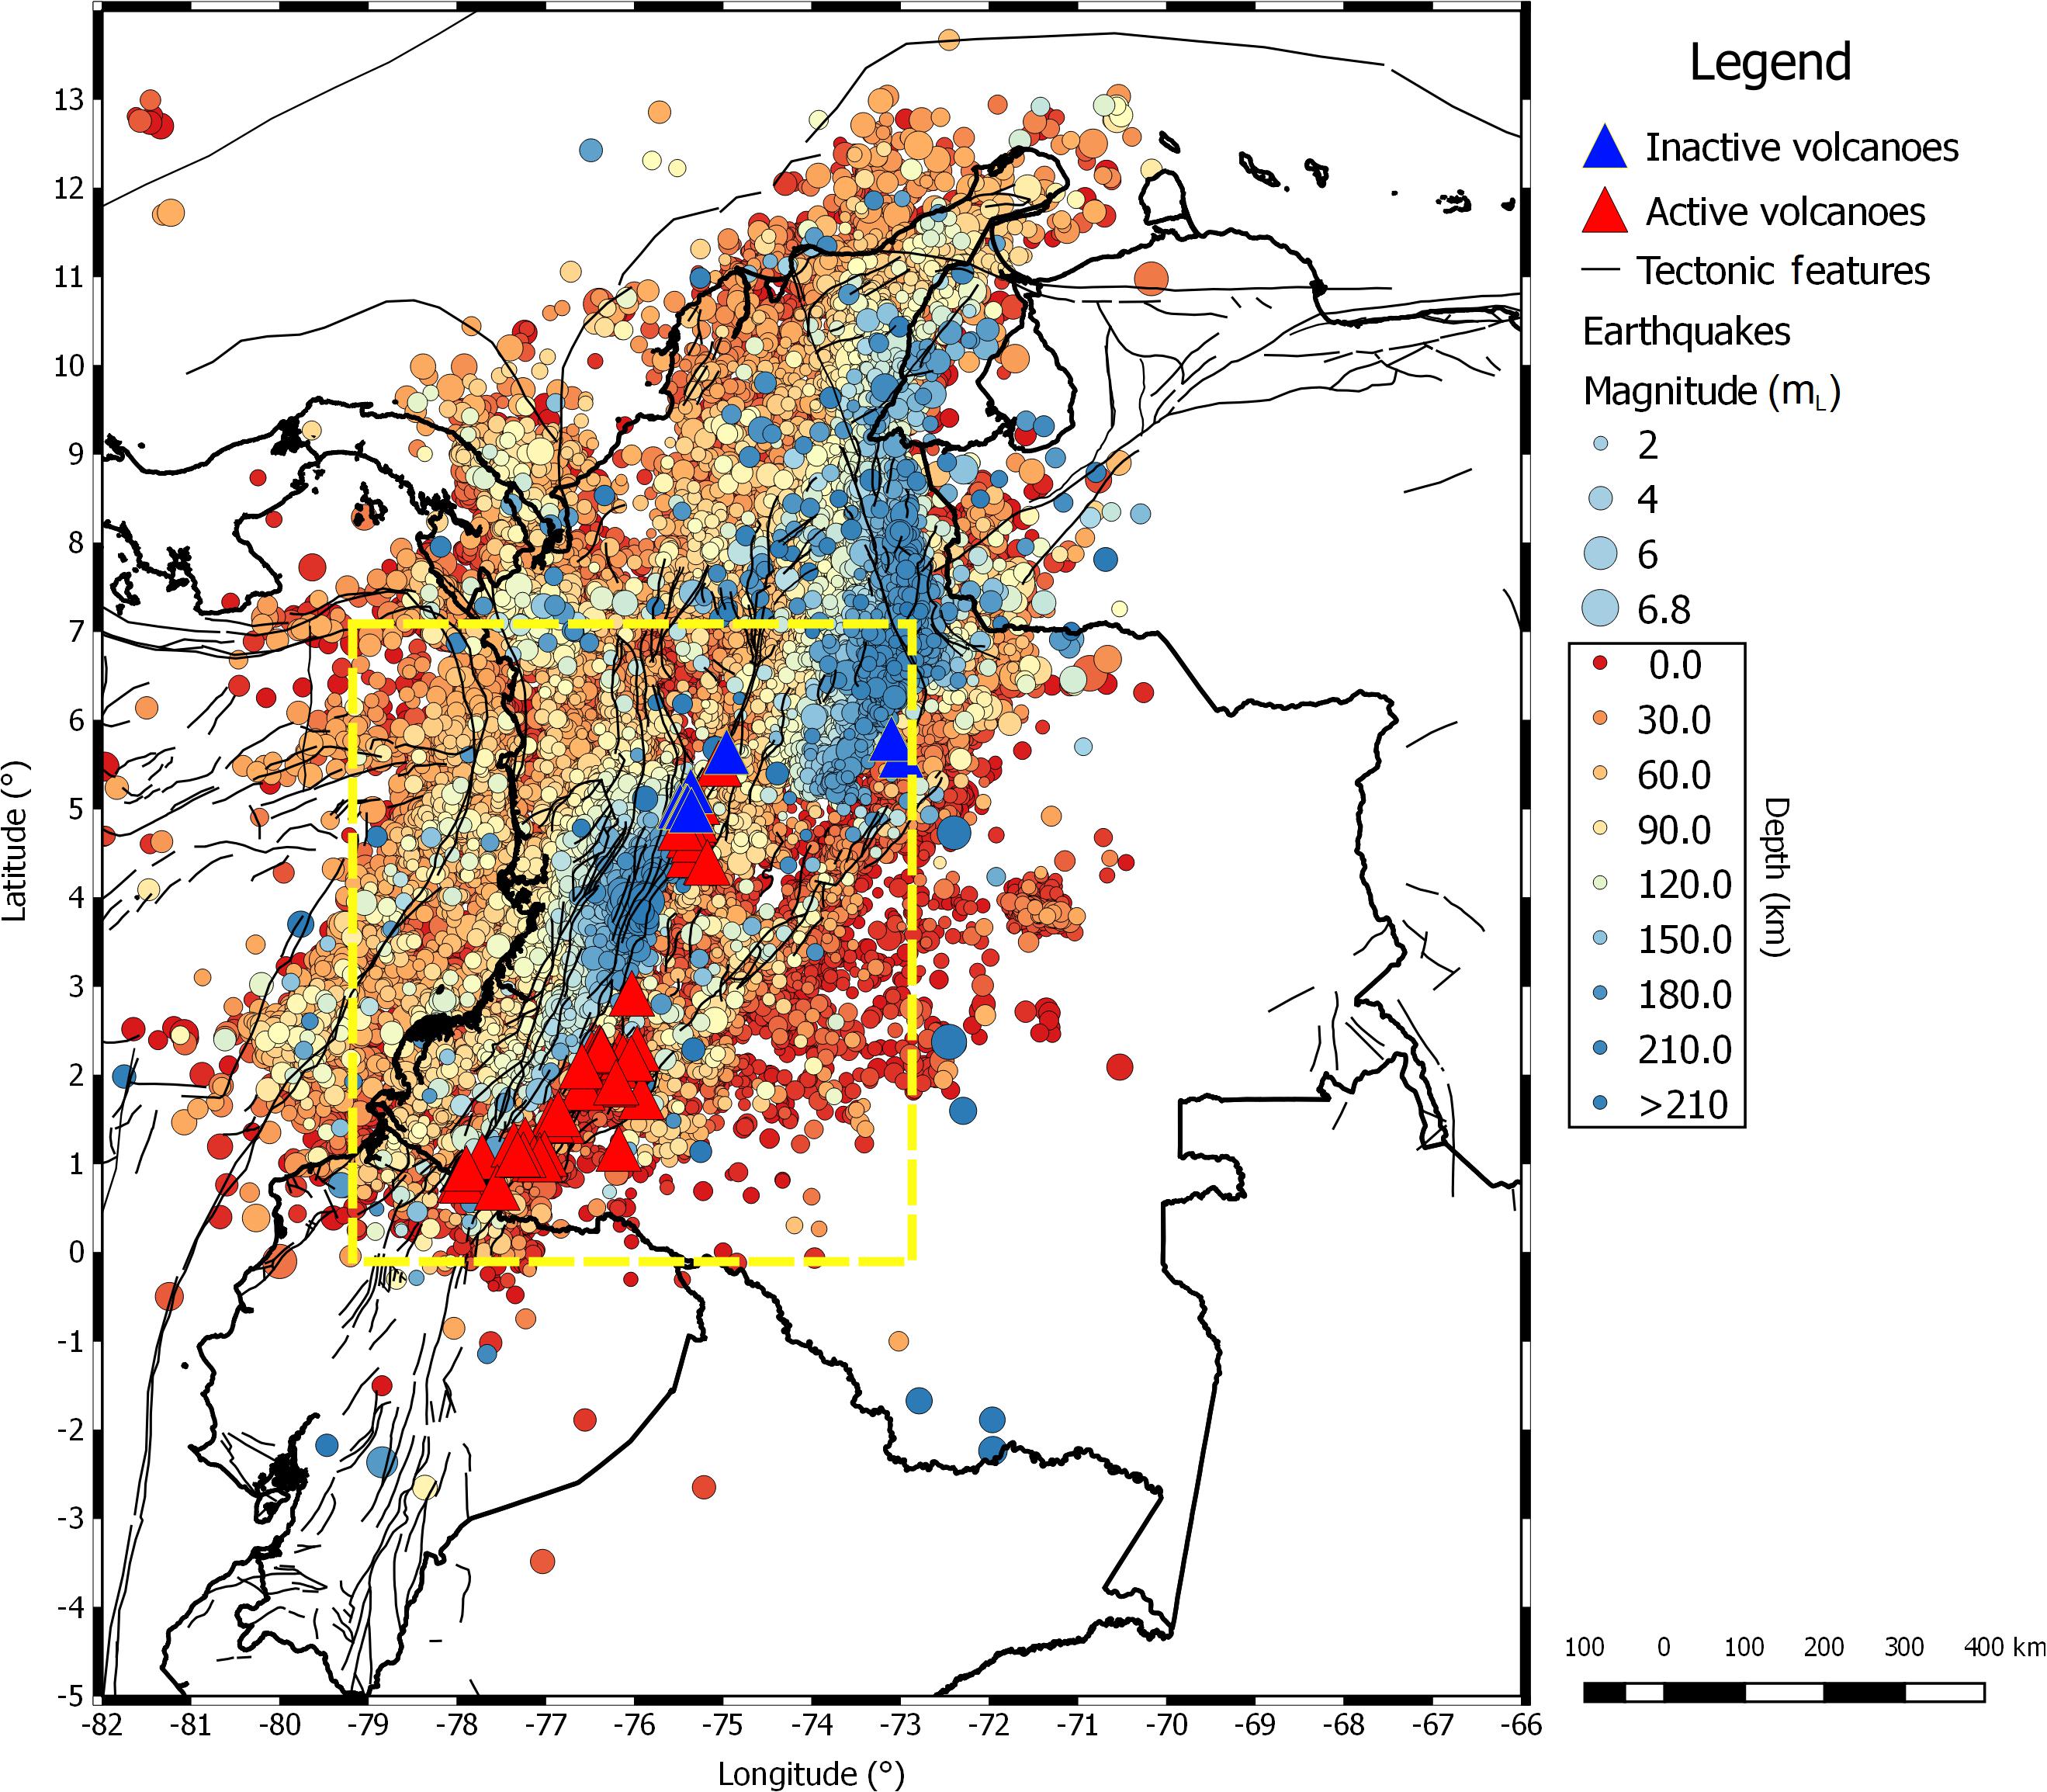
Figure 2. Distribution of earthquakes recorded by the Servicio Geológico Colombiano between 1993–2018. In the map have been represented tectonic features (black lines), the volcanic arc of the Northern Andes (red and blue triangles), and the study zone where was performed the seismic attenuation tomography presented in this work (yellow dashed line).
Collinear with the Sandra Ridge, W-E trend and located inside the continental area, is the Caldas Tear (Vargas and Mann, 2013). This offset of the volcanic arc, associated with an approx. 240 km long west-east-striking slab tear, and located approx. 5.5°N, looks like the main control that explains the presence of inactive-magmatic bodies of late Miocene age and older at the north, and Quaternary magmatic activity at the south of this structure. According to Taboada et al. (2000), the former Nazca and Caribbean plates have approached NW South America since the Cretaceous, promoting oblique subduction along the W continental margin. At present, both plates converge in different directions at approx. 60 and 20 mm/y, respectively (Veloza et al., 2012), generating a compressive regime in the Andes range belt that is undergoing active deformation and uplift. The slow convergence velocity of the Caribbean Plate could be related to a flat subduction process at the north of approx. 5.5°N (Figure 2).
As stated by Marín-Cerón et al. (2019), Neogene volcanism and hypabyssal porphyritic magmatism within Colombia’s Central Cordillera is the product of an intricate evolution of the Nazca plate and its subduction history under the NW margin of continental South America. These authors suggest, that the evolution of the volcanic calc-alkaline arc starts in the mid-Miocene and continues up to nowadays. Evaluation of whole-rock major, trace and REE data for these sample suites suggest that almost all these rocks are magmatic products related to a segmented subduction of the Nazca Plate, and some few located at the east of the arc axis seem to be controlled by faults systems throughout Riedel-type synthetic and antithetic planes. In this sense, Pedraza et al. (2007) also denote that changes in the geometry of the Wadati-Benioff Zone under this region may be associated with variations in the composition of rocks of the volcanic arc.
Based upon the presence of adakite-like characteristics in the Neogene volcanic rocks of this region, Marín-Cerón et al. (2019) proposed a model for the production of primary subduction-related magmas, which includes dehydration/decarbonization and melting of the subducted plate. In this petrogenetic proposal, the lower crust promotes a significant effect upon rock composition during magma rise, and the possible retention of the primary mantle-derived magmas (including slab fluids/melts) within lower crustal magma chambers located along the entire volcanic arc.
Datasets and Methods
Estimation of the
The seismological information for the period since 1993–2018, which is used in this study, was gathered by the Servicio Geológico Colombiano – SGC (Geological Survey of Colombia). For purposes of the seismic attenuation analysis, we used 6.449 waveforms associated with 1.637 events and recorded in 12 seismological stations, mainly with a natural frequency, f0 = 1 Hz (Table 1). Technical details of the seismological stations, whose data is used in this work, can be consulted at the web page https://www.datos.gov.co/widgets/sefu-3xqc. Events used were restricted to the coordinates bounded between Longitude 79°W and 73°W, Latitude 0°N and 7°N, depths ranging between 0 and 200 km, and local magnitude in the range 0.2 ≤ML < 6.4 (Figure 2). Hypocentral solutions were estimated with the program Hypocenter (SEISAN ver. 10.5.0, Ottemöller et al., 2016). Waveforms used were downloaded from the website of the National Seismological Network of Colombia of the SGC1.
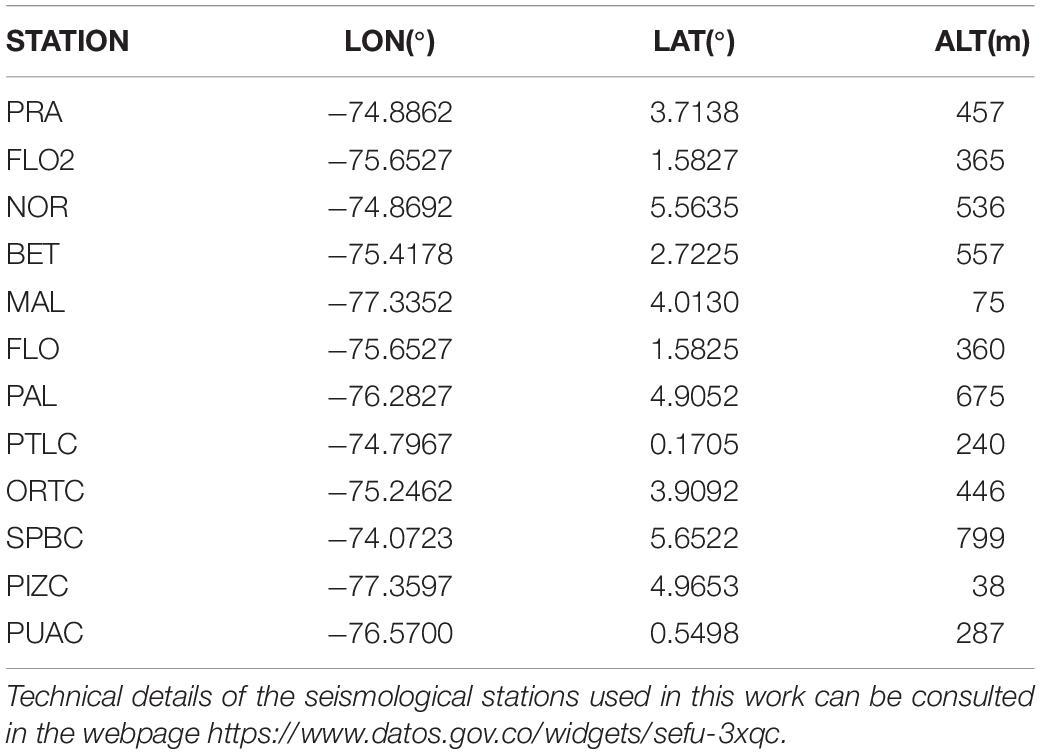
Table 1. Seismological stations used for estimating .
For the sake of simplicity, we estimated the attenuation following one of the simple scattering models, which does not necessarily represent the total attenuation but offers a straightforward way to find the attenuation structure of the study area. We used the method suggested by Aki and Chouet (1975), where the coda waves attenuation () is estimated using the following approach:
In this formula, P(ω,t) corresponds to the time-dependent coda power spectrum for an angular frequency (ω), and a shear wave velocity (β). The variable |S(ω)| represents the source spectrum and g(θ) signifies the azimuthal scattering coefficient, that is defined as 4π multiplied by the fractional loss of energy by scattering per unit travel distance of body waves and per unit solid angle at the radiation azimuth θ measured from the direction of primary wave spreading (backward scattering is considered when θ = π). For this hypothesis, the geometrical spreading is proportional to r−1, being r the distance between the hypocenter and the record system and applies specifically to body waves propagating in a homogeneous half-space. The source is considered as a constant value for a particular frequency. Hence, in equation (1) the time-dependent coda power spectrum is estimated as the mean squared amplitudes of the coda Aobs(f|r,t) from bandpass filtered seismograms, and can be calculated as the slope of the least-squares fit of ln[t2P(ω,t)] versus ωt, for t > 2tβ, where tβ is the S-wave travel time (Rautian and Khalturin, 1978; Vargas et al., 2004).
The program SEISAN (Ottemöller et al., 2016) was used for calculating the values at a frequency centered in 4.0 Hz, with a bandwidth of 3.0 Hz, a signal to noise ratio ≥2, and S-wave velocity β = 3.5 km s–1. values obtained from a least-squares fit with |R|2 > 0.7 were kept. This was the larger dataset estimated in comparison with other central frequencies in order to guarantee a proper coverage for tomographic purposes. values were calculated for lapse times (W) of 20.0, 50.0 and 75.0 s, for all stations and the same bandwidth. We report values computed for the vertical component of seismograms due to the horizontal components offer almost the same behavior of calculated values for the same frequency and W, which is consistent with the expected isotropic model chosen, where the scattering process guarantees that the coda waves spread with similar performance in all directions, and consequently the attenuation values are equivalent.
Previous results about discrimination of the seismic attenuation using the multiple isotropic scattering model (see, e.g., Zeng, 1991) for the same study region and reported by Vargas et al. (2004), suggested that the values are proportional to values (total attenuation), but also proportional to (intrinsic absorption) in the range 1–19 Hz. In this region, the scattering attenuation is low when it is compared with the intrinsic effect. Eleven from twelve seismological stations, whose data is used in the present study, match geographically or are near to those used by Vargas et al. (2004). Hence, we performed a correlation between and at 4 Hz from the former study for inferring at the present work a single value from each value. Similar correlation was performed between and . We prioritized the intrinsic attenuation for finding the best fit model due to its physical meaning has been associated with transformations of elastic to thermal energy. An analysis of goodness-of-fit statistics shows that the best solution is a Gaussian model for both correlations. Figure 3 shows the established correlations, including confidence bounds, excluded observations, and goodness-of-fit statistics.
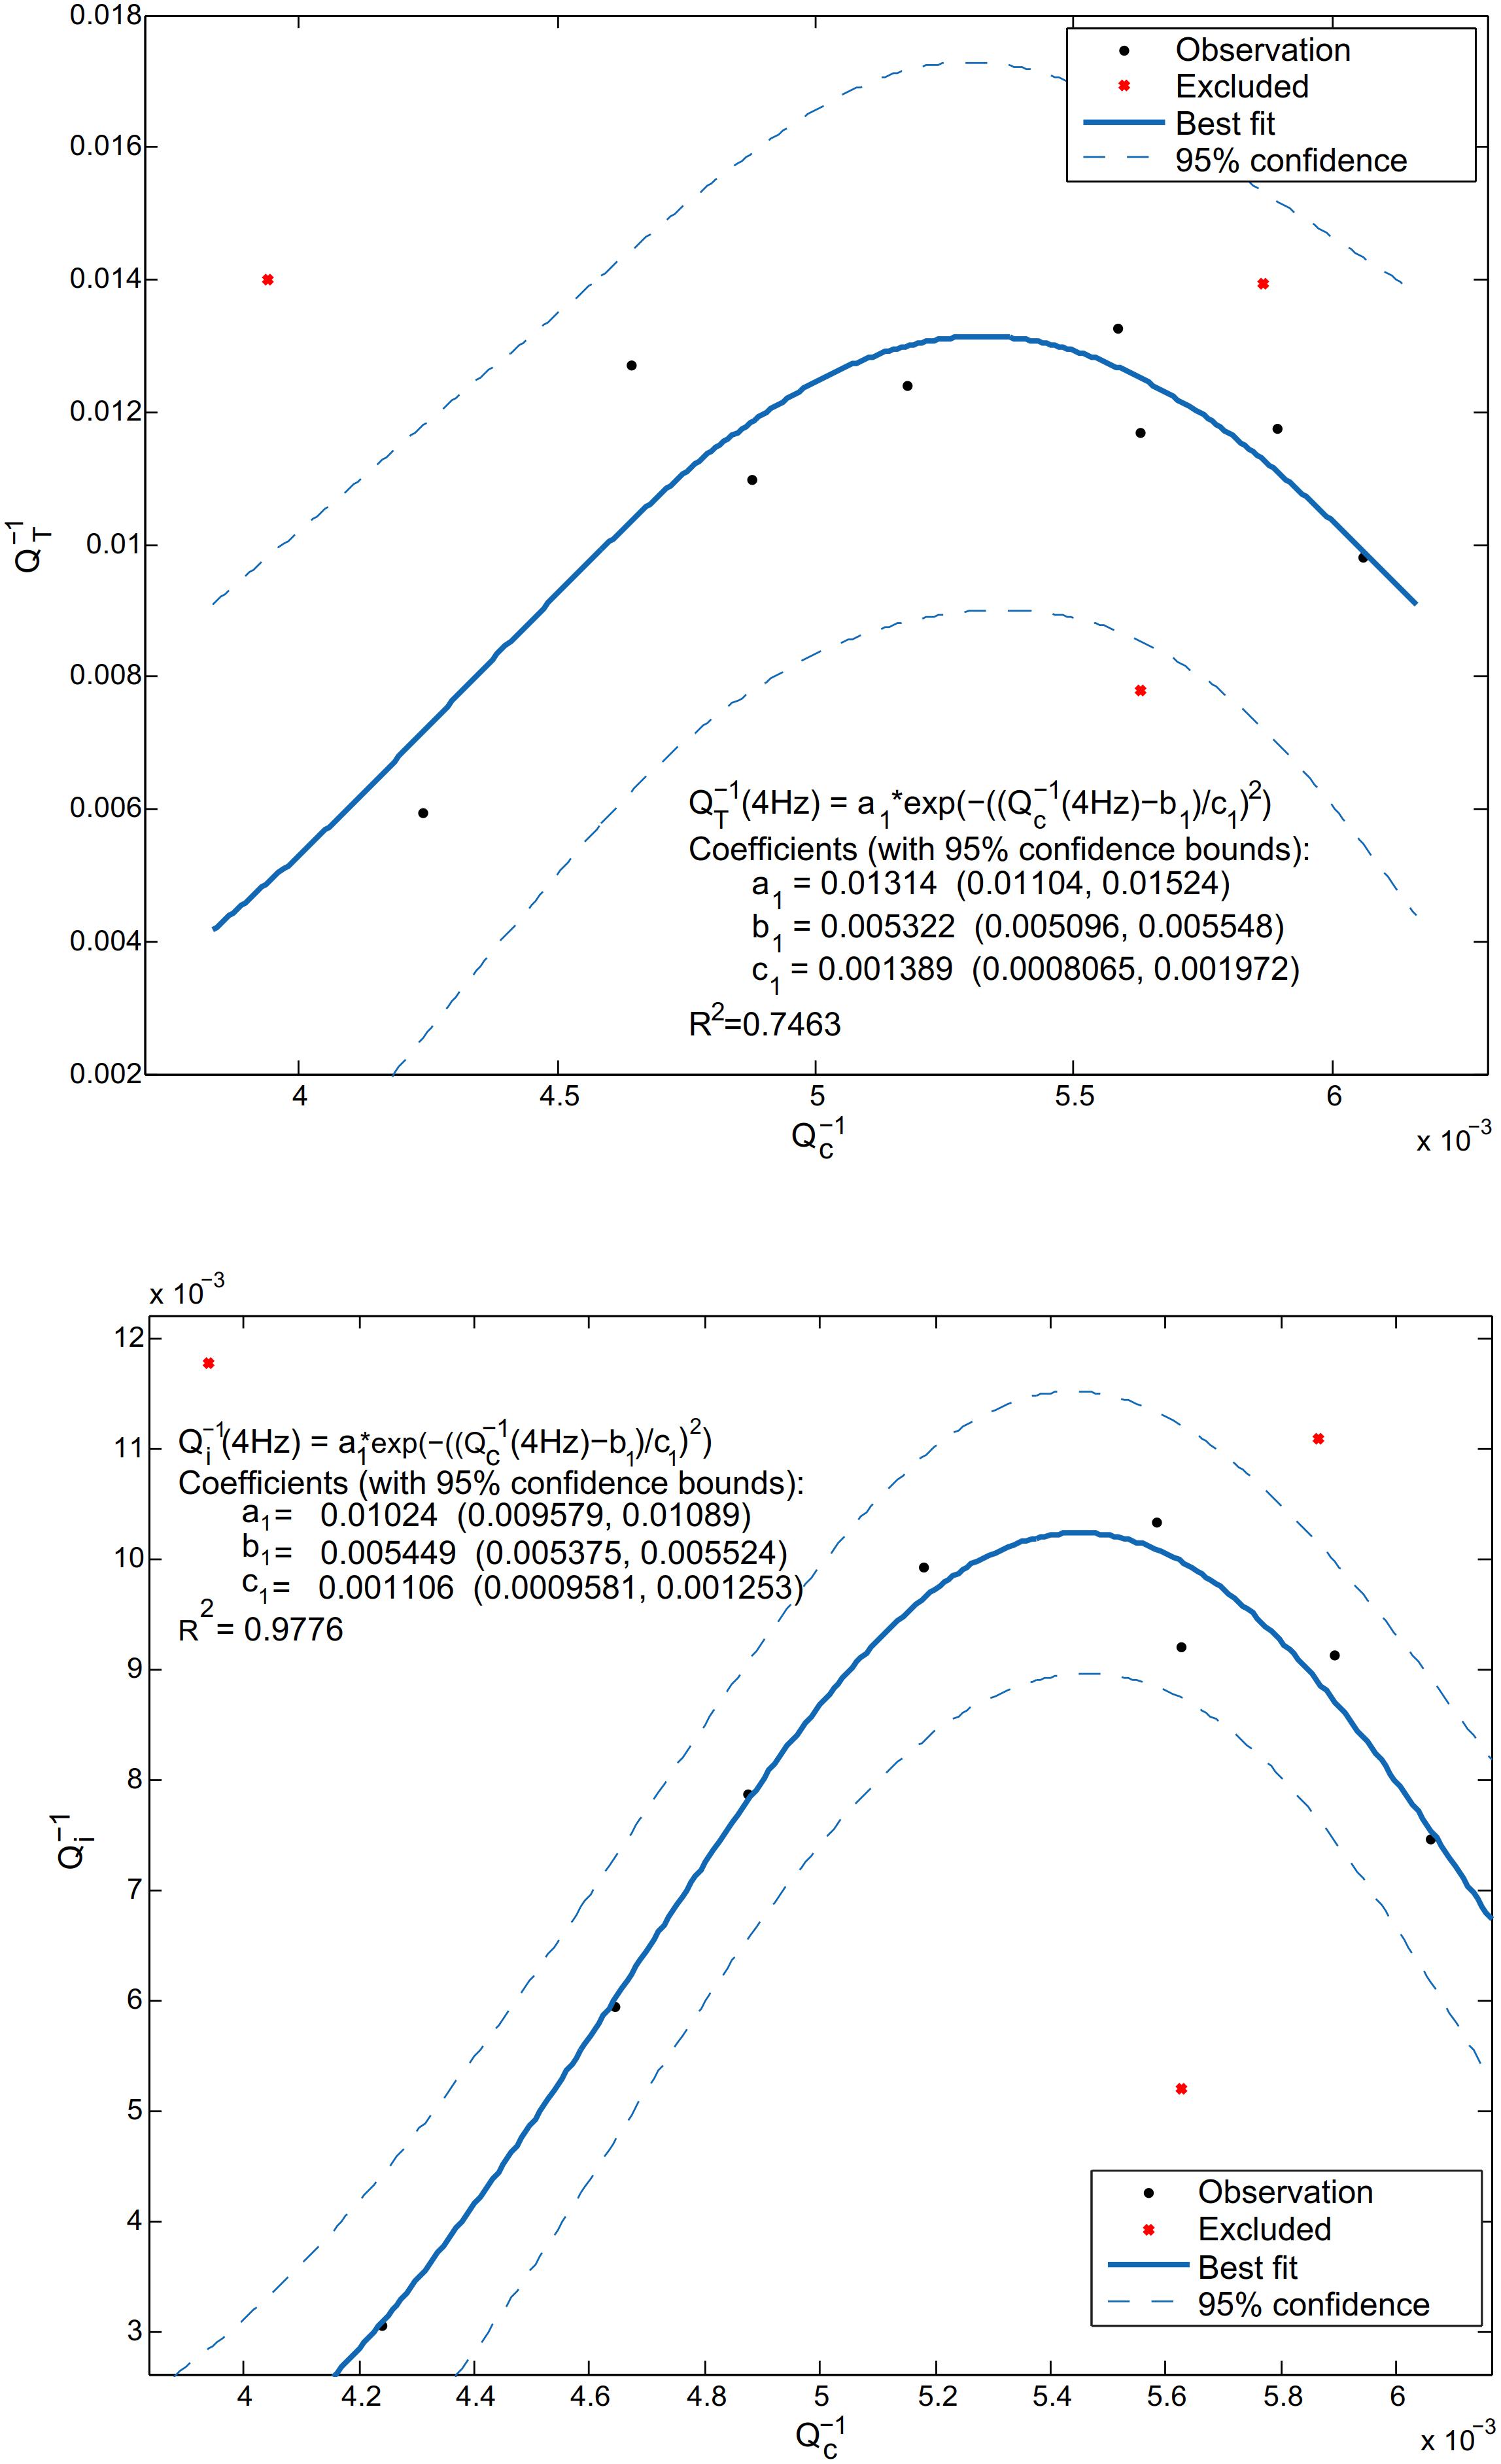
Figure 3. Correlations between and (upper panel) at 4 Hz using results presented by Vargas et al. (2004). After analyzing the goodness-of-fit statistics, the best correlation was found using a Gaussian model. For guaranteeing the best fit, we exclude three outliers (located at the North of Colombia) of the eleven stations reported in that study. Similar correlation was performed between and (lower panel).
Mapping Seismic Attenuation
We have used the method proposed by Vargas and Mann (2013) based on the hypothesis of simple scattering for calculating the spatial distribution of Q−1 by means an inverse approach, and an ellipsoidal geometrical function related to the volume sampled by coda waves at all time t. The ellipsoidal volume presents a large semi-axis a1 = βt/2, and the other small semi-axis , where r is the source–receiver distance (Malin, 1978). The average lapse time is associated with an ellipsoidal shell, defined for tc = tstart + W/2, being tstart = 2tβ, and W the coda-wave time window evaluated at several values. Therefore, knowing the values of tc, W, and β, we can calculate the volumes of ellipsoidal shells where the seismic energy is scattered. The spatial distribution of the attenuation is finally obtained by a generalized inversion in a geographic grid. Thus, each one of the values represents the average attenuation () enclosed by the foci, whose values are associated to the ellipsoidal shell. Hence, attenuation and bulk sampled can be related by means of the next expression:
where VBlock–j corresponds to the fraction of volume (block) covered by the coda waves, that is enclosed in the ellipsoidal shell, and has the true attenuation (or ). Taking β as constant, we can establish the volume crossed by a beam of rays that travel from the hypocenter, hit the ellipsoidal shell defined by W, and then are scattered toward the receptor. The process is repeated for all foci consideredk. Figure 4 shows the horizontal projection of the ellipsoids estimated in this work. This construction can be formulated as a system of k-equations, being k the number of foci, with n-unknowns or the total number of blocks. Hence, we may define , and ai = VBlock−i/VTOTAL, or as matrix expression AX = Y, being A the k×ncoefficient matrix (k×n), X then×1 unknowns vector (n×1), and Y the k×1vector of observations (k×1). This system can be resolved by an iteratively damped least-squares technique using the numerical method of Levenberg-Marquardt (see, e.g., Pujol, 2007). Thus, the solution (X) and resolution (R) matrix can be determined using the following expressions:
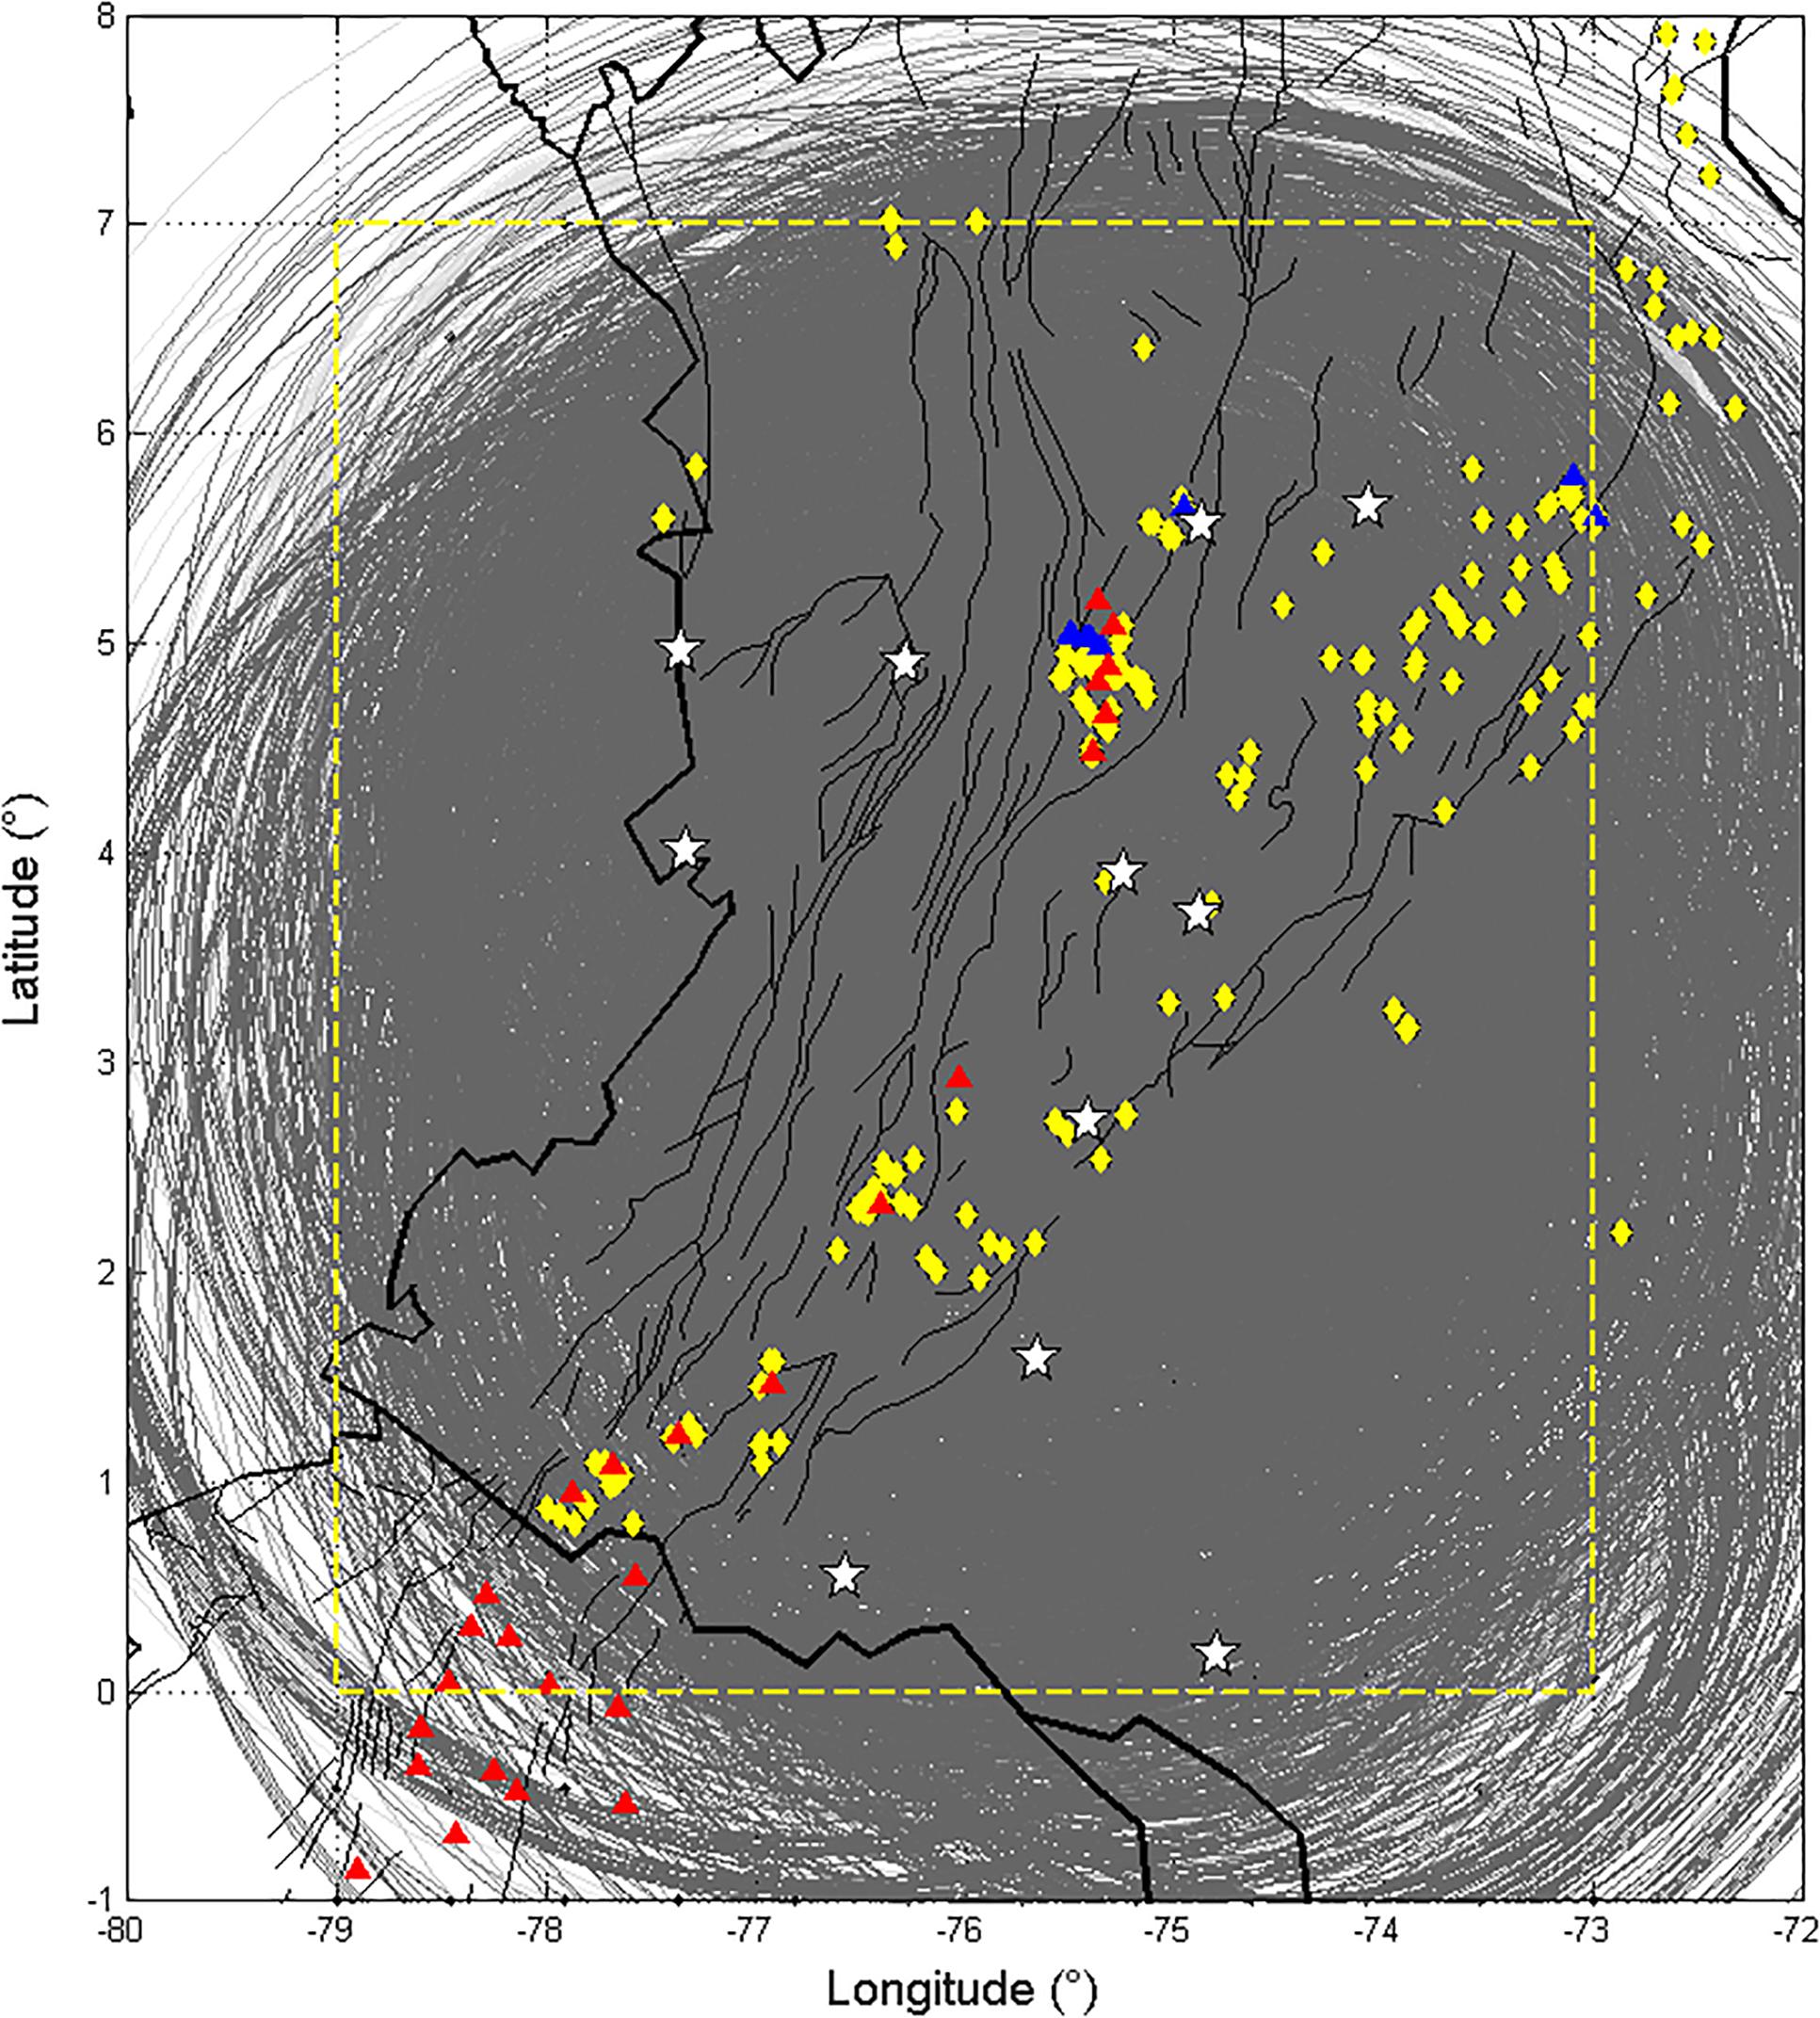
Figure 4. The gray ellipses are horizontal projections of ellipsoids related to the sampled volume during the simple backscattering process (Aki and Chouet, 1975), using as foci each event-station pair. The map highlights the study area where the coda wave attenuation tomography was performed (yellow dashed line), the location of the seismological stations, which data was used (white starts), the volcanic arc (red and blue triangles), the main tectonic faults (black lines) and spring water occurrences (yellow diamonds) reported by the Servicio Geológico Colombiano.
Note that the identity matrix (𝐈) is being contaminated by the factor σ2 to facilitates a proper inversion of the term between brackets, using a trade-off strategy for minimizing the model resolution spread with its variance size (see, e.g., Menke, 2018). In this work, the 3D inversion of attenuation was achieved using 6.549 observations of Q−1 and a grid of 12 × 16 × 8 cubes situated between Longitude 73°W and 79°W, Latitude 0°N and 7°N, with block proportions of ∼55 km (Longitude) × ∼55 km (Latitude) × ∼25 km (Thickness) to distinguish regional anomalies, and σ2 = 0.00001. The final conditions for achieving the inversion were either a total of 5000 iterations or a difference between two consecutive iterations less than 0.000001. Verification of the strength of the tomographic result was supported on three methods (see e.g., Vargas and Mann, 2013; Vargas et al., 2018): (a) resolving a chequer-board test; (b) plotting the diagonal elements of the resolution matrix (RDE) by using expression (4); and (c) counting the number of hits of ellipsoidal shells per block (NEB).
Estimation of the Thermal Structure
According to Karato (2004), the anelasticity in rocks at elevated temperatures and low frequencies can be expressed as:
where f means the frequency in Hz, α represents a constant, H∗(P) constitutes the activation enthalpy in kJ/mol, P represents the pressure in GPa, R means the gas constant with units J/(mol ⋅ K), and T is the temperature in KH∗(P) = E∗ + PV∗E∗V∗V∗V∗/E∗ = 3.3×10⁻². Thus, having the three-dimensional distribution of attenuation we may infer the thermal structure of the upper lithospheric system. Following the same approach used by Nakajima and Hasegawa (2003), equation (5) can be written for a reference attenuation as:
Considering the relative contribution of on for each block of the attenuation tomography, and combining equations (5) and (6), now we obtain:
We considered as initial conditions a representative regional geothermal gradient. Therefore, we used the dataset estimated by Vargas et al. (2009), who reported a regional map that evaluated approx.4.400 direct observations of Bottom Hole Temperature (BHT). This dataset contains corrections for the thermal effects of drilling fluid circulation and surface temperature variations, and was constructed over seven depth intervals (500–1000, 1000–2000, 2000–3000, 3000-4000, 4000-5000, 5000-6000, and >6000 m). Besides, Weber et al. (2002) reported xenolith samples in the Granatífera Tuff, a late Cenozoic sequence located in the Mercaderes–Río Mayo area of SW Colombia (see Figure 1), possibly associated with deep crust and upper mantle processes in the NW Andes. The Granatífera Tuff includes diverse type of rocks, among them, granulites, hornblendites, pyribolites, pyroxenites and gneisses, mafic material, and felsic rocks. Their P–T analyses for the pyribolite assemblages suggested ∼720–850°C and 10–14 kbar. Based on these observations we use a geothermal gradient of 27°C/km, which is the regional average of the Vargas et al. (2009) study, and matches with the P–T ranges of the xenolith observation reported by Weber et al. (2002).
According to Artemieva (2011), intrinsic parameters in rocks of the lithosphere and mentioned in Equation (7) have been experimentally constrained by other previous authors. Following this author, E∗ is ranging from 400 to 700 kJ/mol, and α between 0.1 and 0.3. α = 0.2E∗ = 500. Hence, applying the observed values of and to expression (7), we can estimate a temperature at each block of the tomography. In this work, we hypothesize that the observed attenuation anomalies are generated by the thermal effects.
Results
Seismic Attenuation Tomography
After running several synthetic tests for assessing the stability and resolution of the tomography and used observations (see results and 3D model in MatLab® format in Supplementary Material), we present eight depth tomographic sections at 0, 25, 50, 75, 100, 125, 150 and 175 km measured from the surface. Figure 5 shows the mosaic of slices at those depths mapping the final inversion of the seismic attenuation accompanied with a chequer-board test (reference and inverted with the available dataset), RDE and NEB. Only peripheral areas have low reliability. Elsewhere within the volume of the inversion array, there is a reasonable reconstruction of the reference model, even having low values of RDE, which are due to the different number of shells passing along all blocks, and the ratio of unknowns solved with available observations.
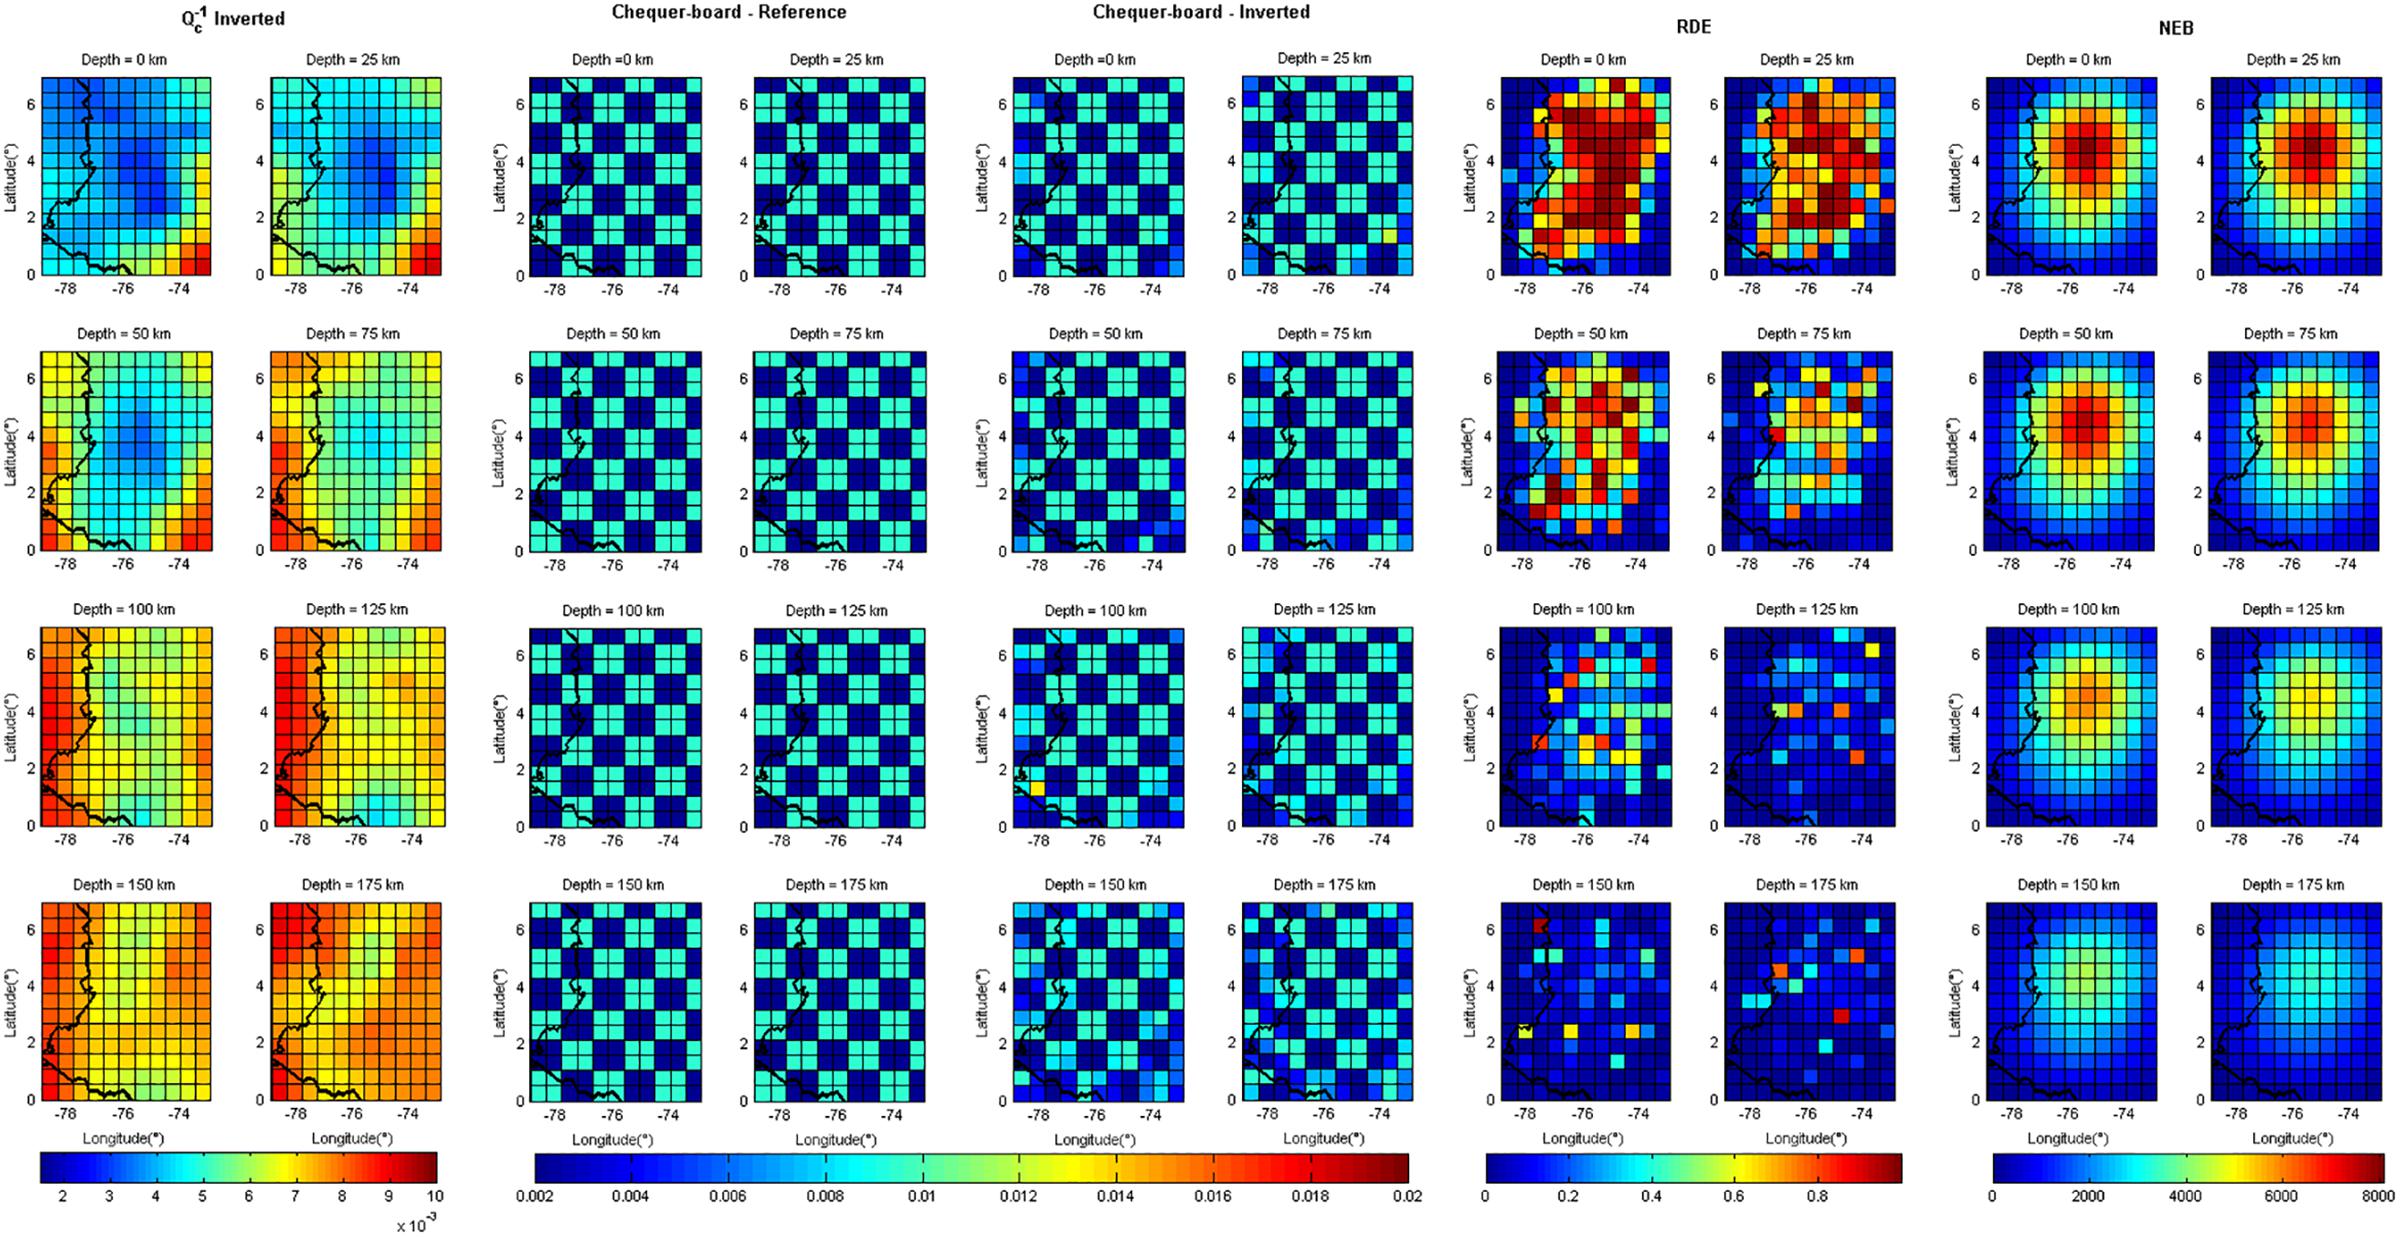
Figure 5. Results of the spatial inversion of accompanied with the chequer-board test for presenting the robustness of the tomography, and the mapping of the diagonal elements of the resolution matrix (RDE) and the hit count of ellipsoidal shells in each block (NEB). Image shows that the spatial inversion reconstructs satisfactory almost all study area, with a reduced quality only in the peripheral areas.
In general terms, we find low attenuation patterns in shallow depths (< 75 km), which vanishing in deeper sections and leave only weak patches in the central area and southern border. In contrast, high attenuation anomalies appear in the SE of the shallowest sections, and are expanding in depth almost along the entire study area. The inversion shows values that reach 9.5542×10⁻³, and consequently the attenuation interpolations show values that reach up to 9.0572×10⁻³, and 11.5000×10⁻³ for and , respectively.
High attenuation anomalies at the West may reflect the oceanic nature of the lithospheric system, as well its age, and lateral variation of the processes that govern the subduction of the Nazca Plate under the South America sub-continent (see Figures 1, 5). For its part, the low anomalies are mainly concentrated under the Andean orogen, with the lowest values located in shallow slices and on the NW sector.
Thermal Structure
Due to the lack of information about the parameters E∗ and α in equations (5) and (7) for the study area, we have carried out a variability analysis to establish proper values that ensuring consistency with temperatures calculated using other approaches. Figure 6 shows the estimated temperatures using low, medium and high values reported for these parameters (see, e.g., Kampfmann and Berckhemer, 1985; Karato, 2010; Artemieva, 2011), suggesting that for the range 25 – 100 km-depth temperatures are relatively low for this region, between ∼520°C and ∼830°C. Following these considerations and in the sake of simplifying the analysis, in this work we choose intermedium values of α = 0.2, and E∗ = 550 kJ/mol, which promoted the temperature range between ∼640 and ∼810°C.
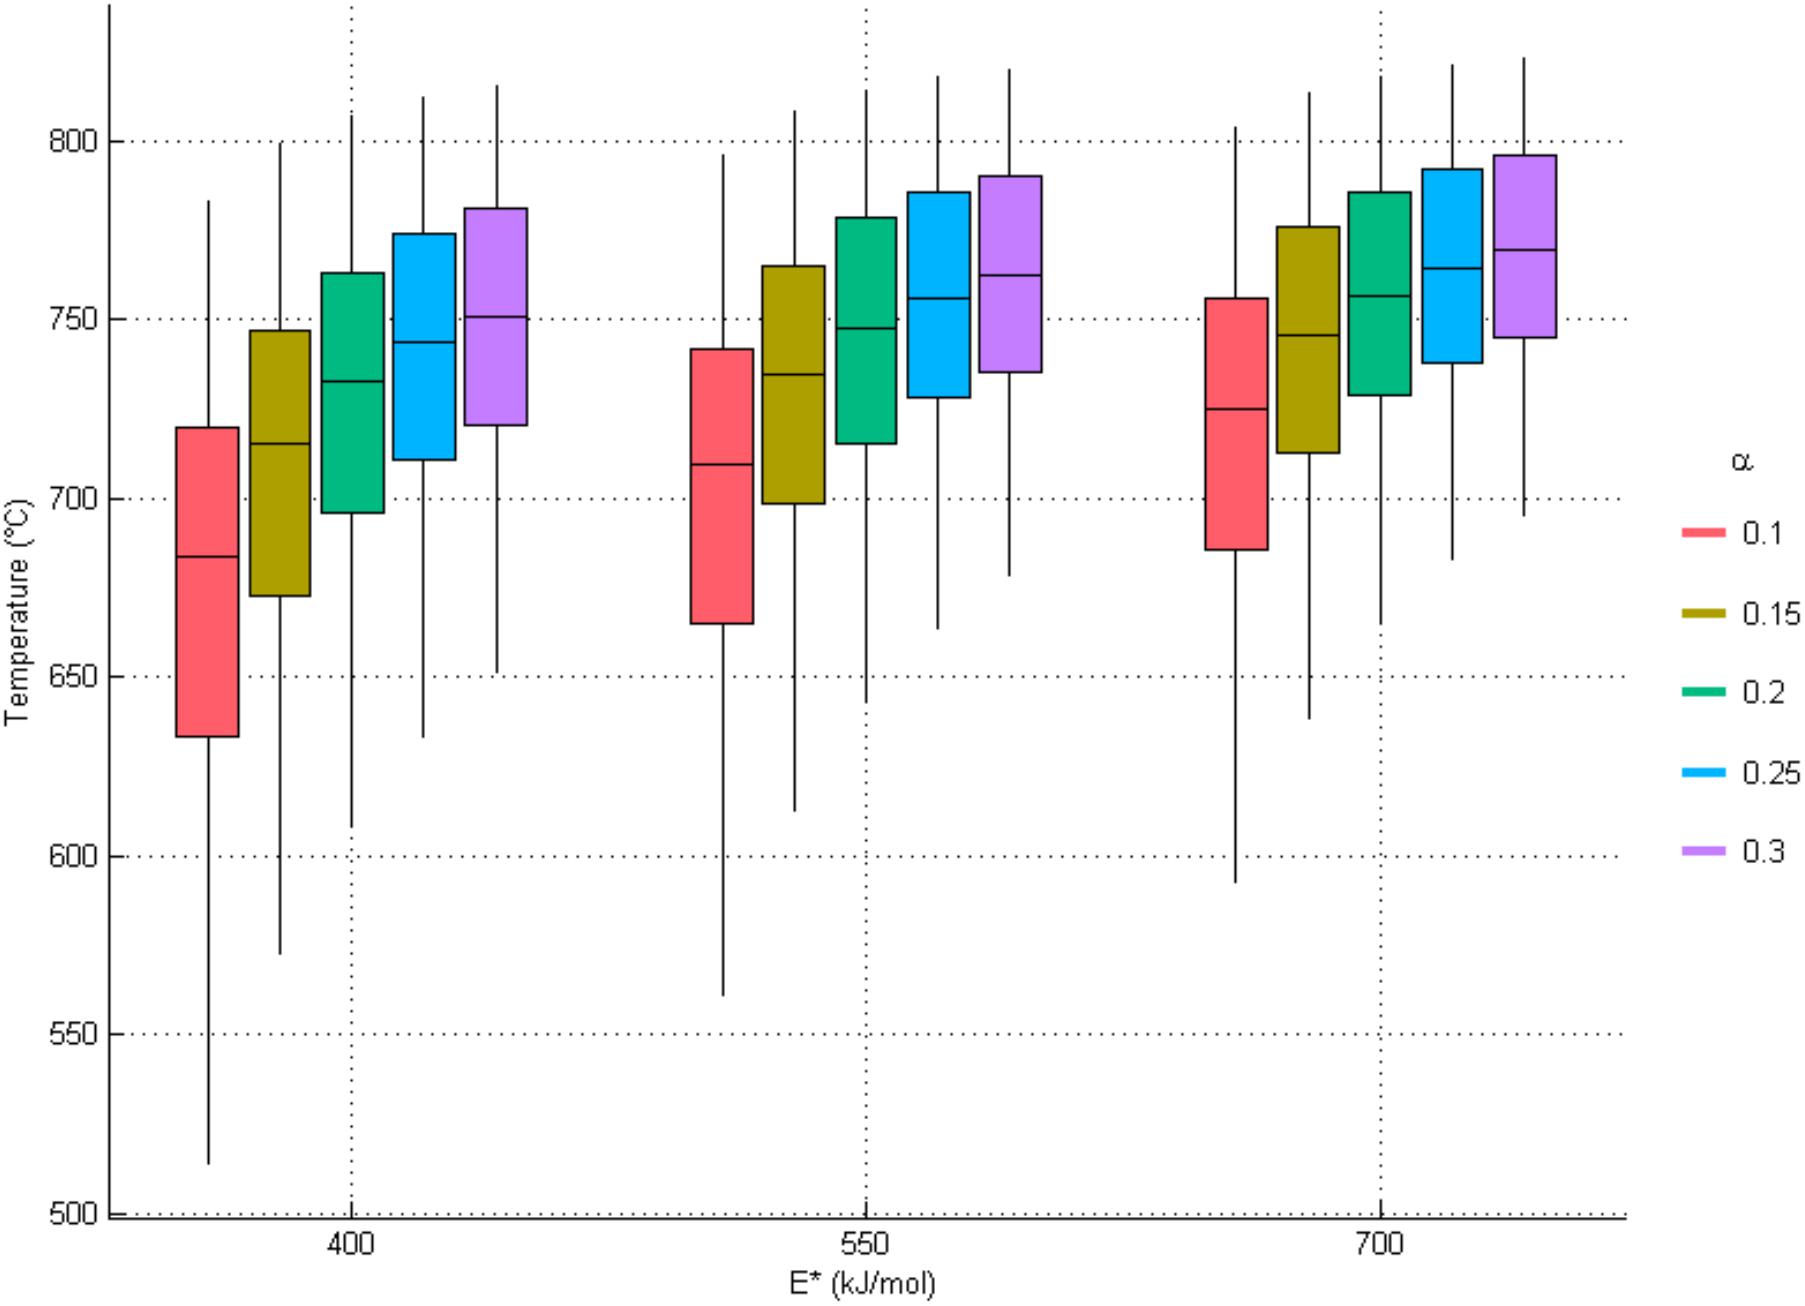
Figure 6. Variation of temperatures using the ranges 400≤E∗≤700, 0.1≤α≤0.3, and 25≤depth≤100 km. Temperatures estimated are relatively low for this region, between ∼520 and ∼830°C. In order to tie coherently other thermal observations (xenoliths and geothermal gradient records) we chose the next values: α = 0.2, and E∗ = 550 kJ/mol.
Figure 7 shows the distribution of isotherms at 25, 50, 75, and 100 km depth. At the section 25 km depth there is a main low-value thermal anomaly (starting ∼680°C at 25 km and ending ∼780°C at 100 km) located beneath the center of the zone of study where is interrupted the present-day active volcanic arc of the NW Andes (∼75–76°W and ∼3–4°N). This anomaly maintains almost the same geometry along the four analyzed sections. Other two additional low-value thermal anomalies are in the W and NE of the study area, and may be detected only in the deeper layer. In contrast, there are two relevant high-value thermal anomalies located at NW and SE of the main low-value anomaly (starting ∼790°C at 25 km and ending ∼810°C at 100 km).
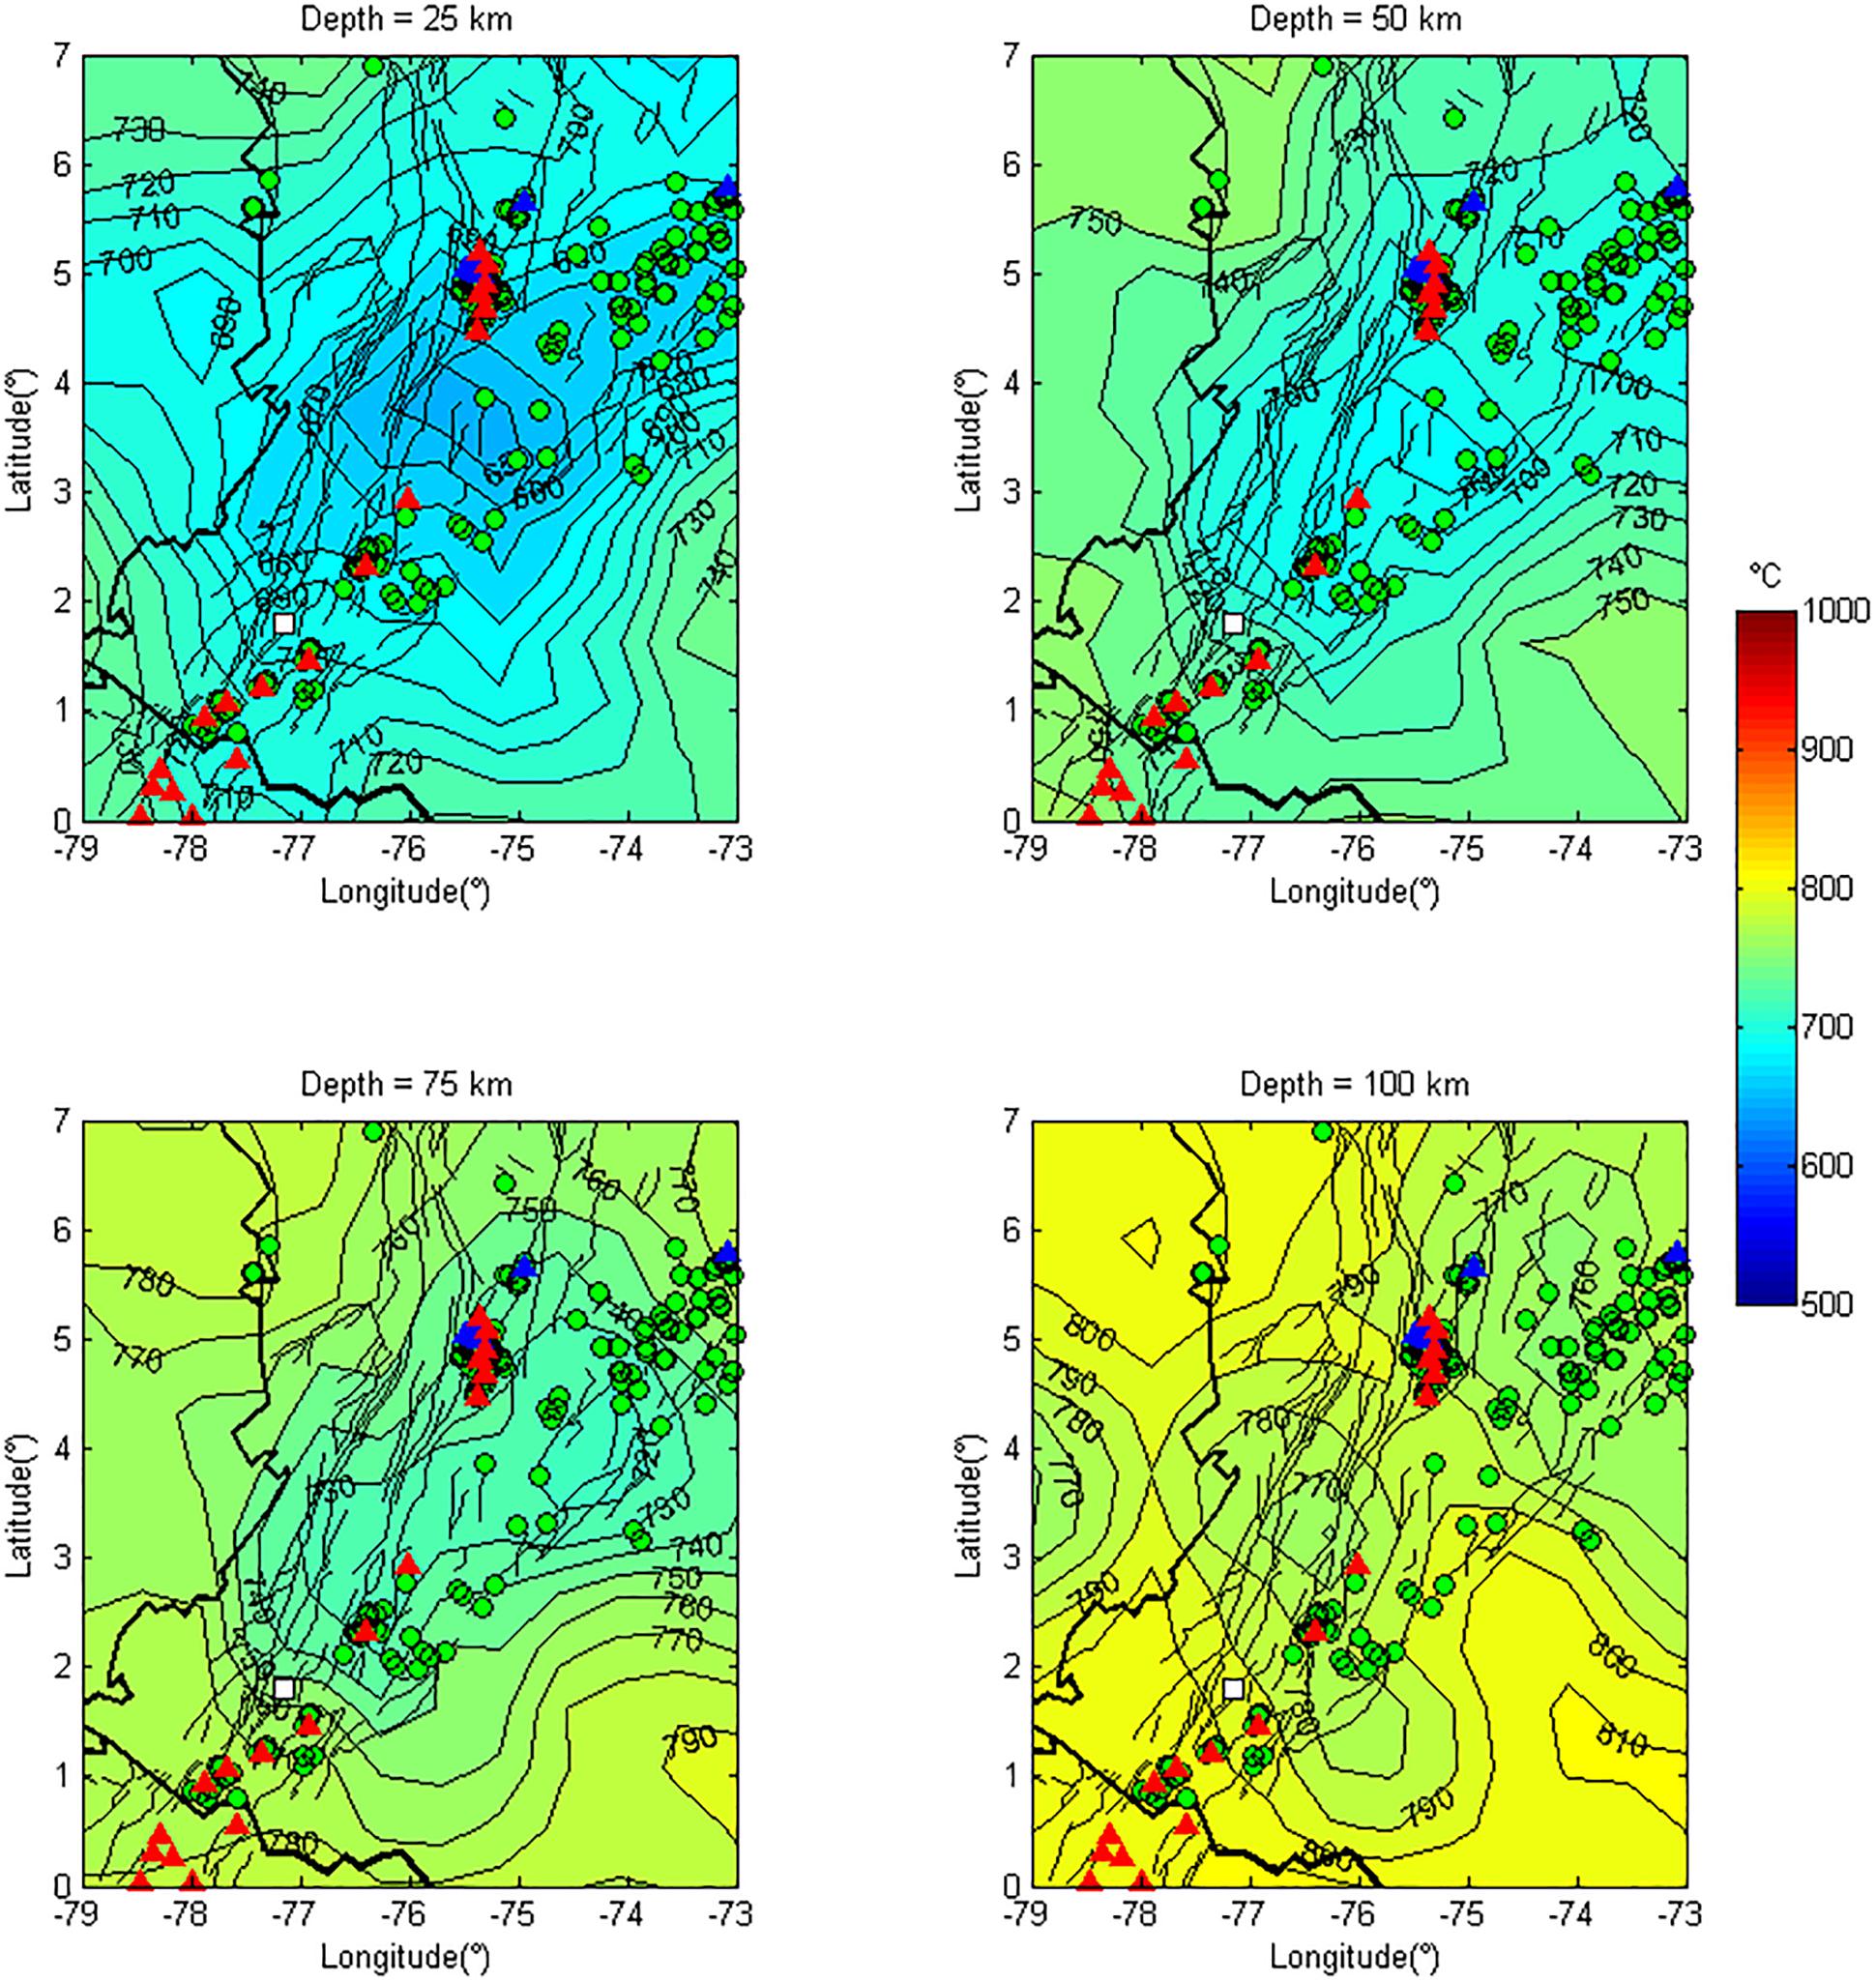
Figure 7. Estimations of the thermal structure for four of the eight slices presented in the attenuation tomography. The isotherm distribution in the volcanic arc of the Northern Andes suggests the presence of a low-intensity thermal anomaly, which matches with a zone of lack of active volcanism, also surrounded by spring water occurrences. The white square symbol corresponds to the localization of the xenoliths reported by Weber et al. (2002).
In any case, the present-day active volcanic arc looks like emplaced under a specific range of temperature for almost all sections, which may be also similar for the hydrothermal activity (see, e.g., the spring water occurrences in Figure 7). A comparable condition is found for the inactive volcanoes of the NE of the study area.
Discussion
The Geometry of Isotherms and Implications
A relevant result of this work is to identify the irregular geometry of the isotherms in depth, probably associated to recent events (tectonic and/or magmatic) that have not allowed a thermal stabilization in the entire study area. Indeed, Figure 8 shows a 3D view that may detect a shallowing of the isotherms along the volcanic arc, interrupted by a cold structure (∼75–76°W and ∼3–4°N, see also in Figure 7). The temperature range of the north and south segments of the volcanic arc satisfices the description of high-temperature gases produced in-depth and proposed by Aiuppa et al. (2017). According to Errázuriz-Henao et al. (2019), all this volcanic arc is almost founded by rich-Mg# calc-alkaline intermediate volcanic material related to continental arcs, but with distinct trace element and isotopic features that could be associated with contamination by fluids and melts of diverse kinds of subducted sediments detached from the plate and raised as diapirs at distinct depths. Their approach suggests a reprocessing of refractory carbonates into the magmatic arc and propose that the geochemical variety of the magmatic arc is mostly governed by the subducted materials and their exhumation routes inside the mantle wedge. Thereby, the thermal range in the study zone is lower in contrast with other active volcanic arcs (see, e.g., Nakajima and Hasegawa, 2003).
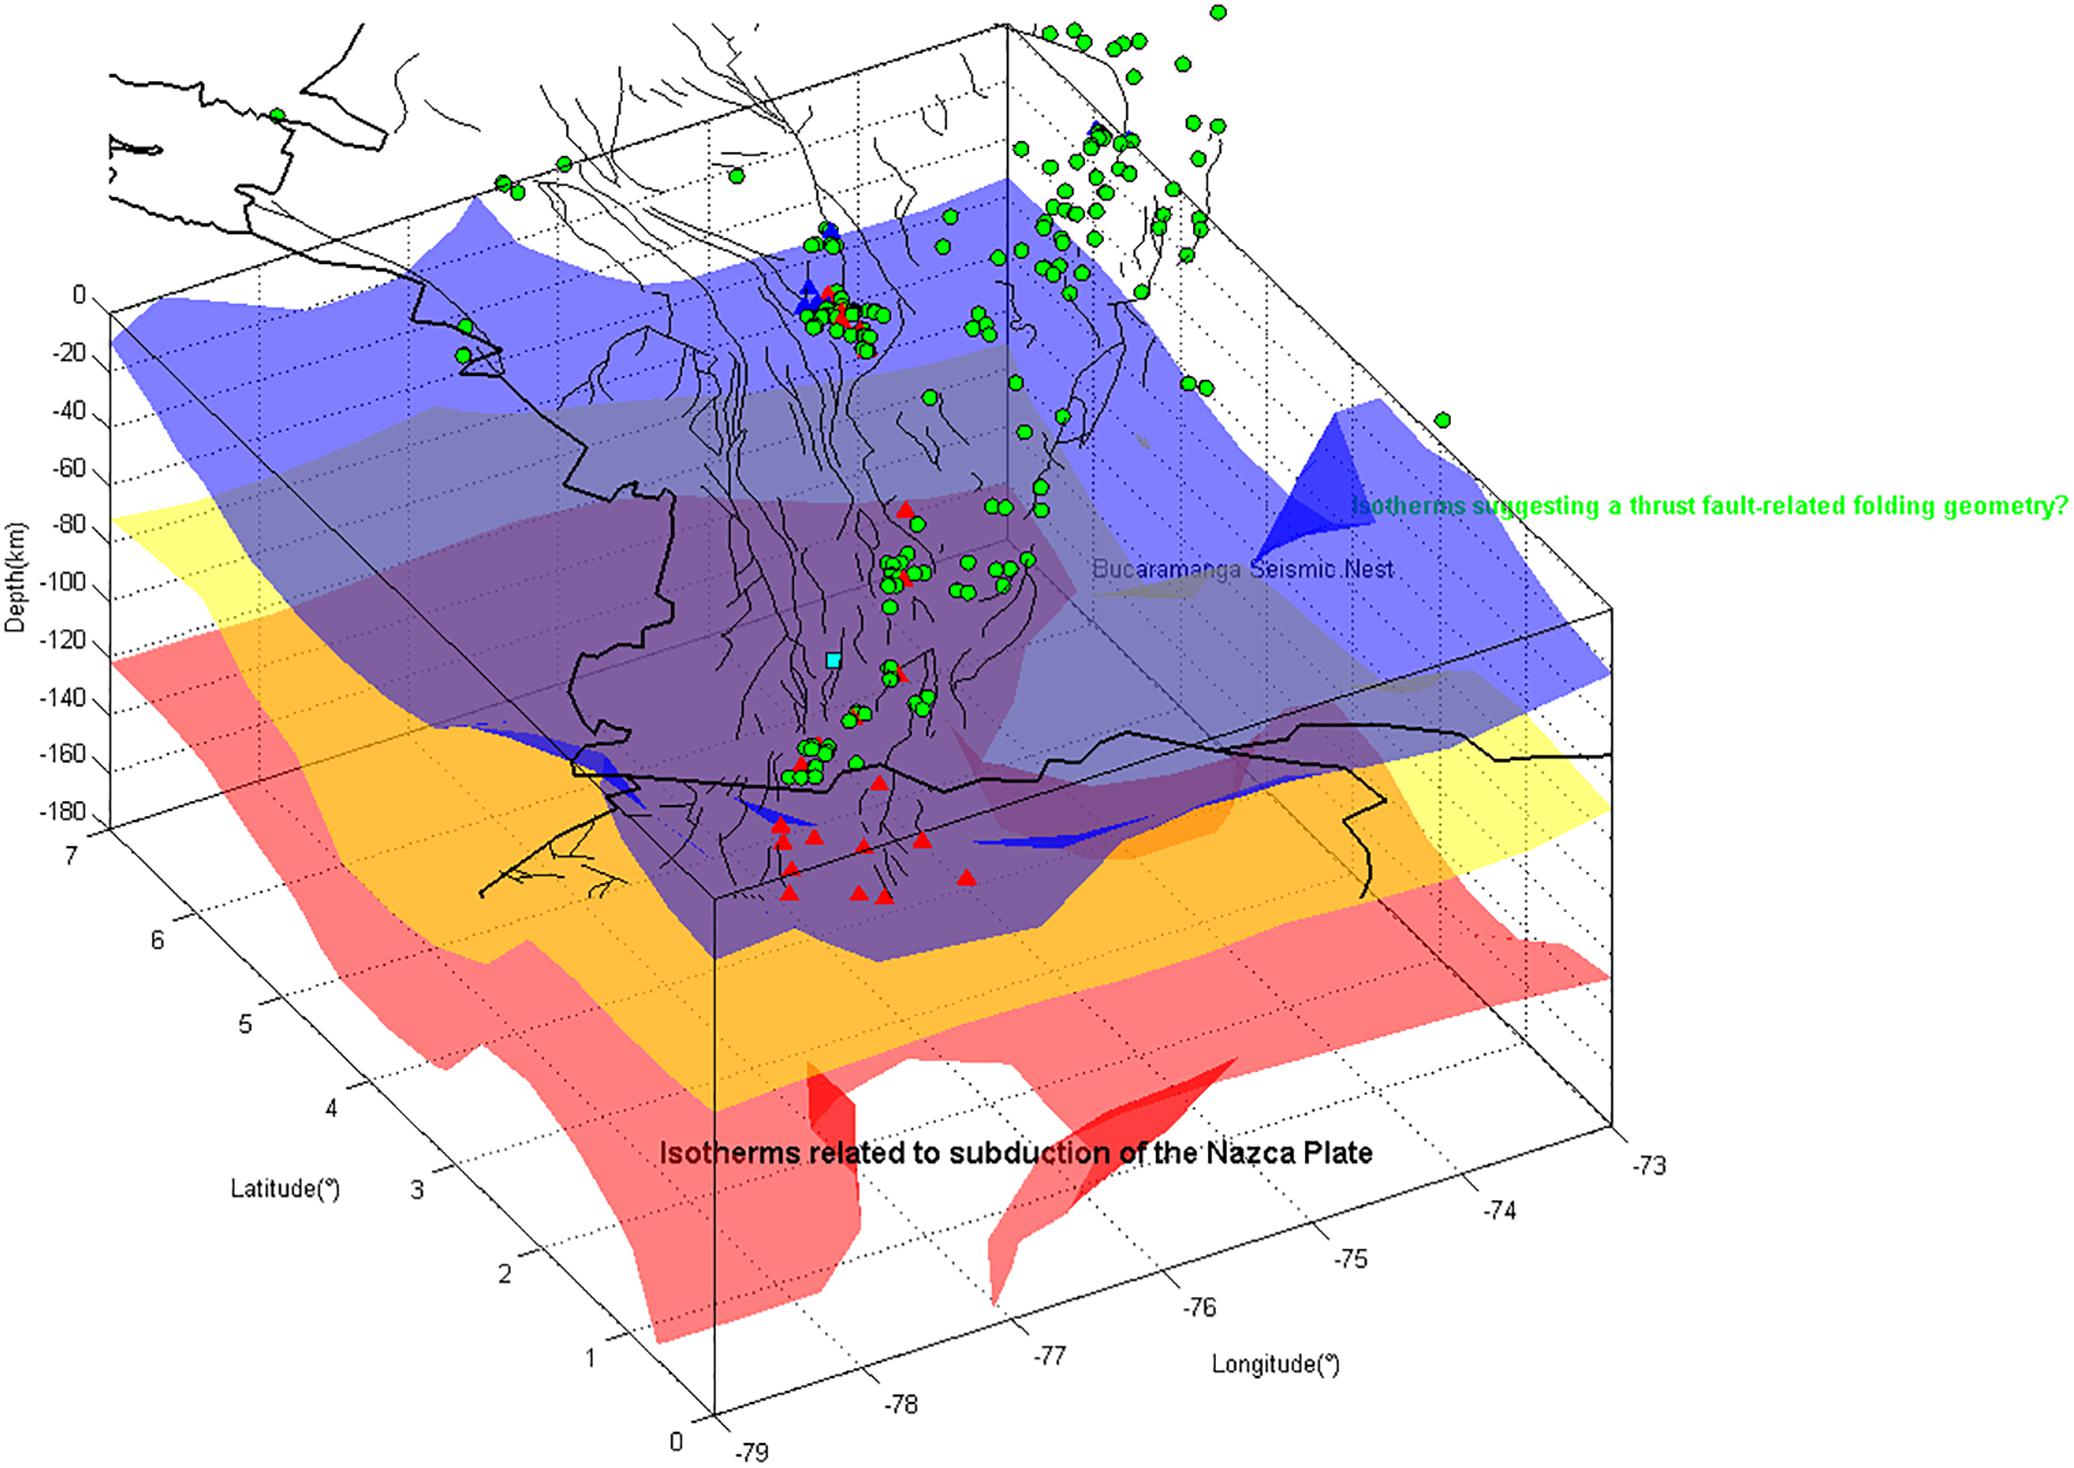
Figure 8. 3-D view of isotherms 730°C (blue), 780°C (yellow), and 830°C (red). A video showing different views is provided as Supplementary Material. The model shows a perspective from SE, and allow to see irregular geometries of the isotherms, suggesting a recent process of thermal perturbation. Isotherms are deepening eastward, probably following the dip of the subduction of the Nazca Plate. The perspective also suggests a thermal trend similar to thrust fault-related folding geometries probably associated with recent tectonic collision processes. Some text have been included to highlights reference places. Thin continuous lines represent faults. Green circles correspond to hot springs. Triangles represent active (red) and inactive (blue) volcanoes.
Bloch et al. (2017) suggest that the mantle and crustal xenoliths of the Granatífera Tuff contain evidence of recent and likely active crustal foundering. They found that almost all of these xenoliths stabilized in the range of depth between 60–80 km, or ∼7 – 27 km underneath the seismic Moho in this area, and that probably one crustal garnet clinopyroxenite re-stabilized at depths >95 km. They also report a garnet clinopyroxenite stabilized at depths ∼150 km and both are constituent of the lithospheric material or product of the interaction among peridotite and a mobile constituents (both silicic melt and fluids) at >4 GPa. These authors mention that the garnet clinopyroxenites are not buoyant in relation to the asthenosphere, and that the occurrence of minor quantities of amphibole and orthopyroxene, joined with the lack of major-element retrograde zonation in primary phases within these xenoliths, indicates that these rocks were rapidly transported to, and briefly resided at, shallow depths before eruption. According to their Lu–Hf ages from garnets, this material is <5 Ma and approximate the time at which these xenoliths were transported to shallow depths before the eruption. They propose that a large-magnitude positive geoid anomaly and relatively low mean surface elevations indicate that the gravitationally unstable crustal root is still largely attached to the overriding crust in this part of the volcanic arc. They suggest that the lowermost crust in this region is a partial melt zone, and argue rheological weakening in the presence of melt, which has led to the foundering of relatively small parcels of gravitationally unstable crustal material. In contrast, the cold structure, which is also surrounded by spring waters, may reflect a lateral change of the mantle viscosity that prevents the continuity of the volcanic arc, or a zone where the crustal root has not reached the critical point of melting as occurred at north and south of this thermal anomaly.
We also note a deepening of isotherms from west to east, probably related to the subduction process of the Nazca slab (∼0–5°N). This phenomenon may respond to the dipper angle and velocity of subduction of this plate in contrast with the flat subducting effect that governs the Caribbean Plate and the overriding Panama Block (Vargas and Mann, 2013). The deepening of isotherms is also observed at NE. We hypothesize that the break-off process of the Caribbean Plate that probably generates the Bucaramanga seismic Nest near to this deepening of isotherms (Vargas and Mann, 2013) is associated with the process of permanent cascading thermal shear runaway described by Poli et al. (2016), and that may generate magmatic instability in depth.
Finally, we found that in some areas the isotherms abruptly change their dip and in other cases follow a trend similar to a thrust fault-related folding geometry, for instance there is a significant change in dip from West to East with a trend almost parallel to the Caldas Tear (∼79°W and ∼5°N), and an inversion of the temperature with the depth at South (∼76°W and ∼1°S). Both cases suggest a recent process of regional perturbation (collision of tectonic blocks). We hypothesize that the Panama Arc at the North, and the effect that imprints the collision of the Carnegie Ridge at the South (Idarraga-Garcia et al., 2016), are responsible for these thermal effects. In the case of the northern anomaly, it suggests a thickness of the lithospheric system that prevents a developing of the volcanic arc at the north of this latitude. In the Southern case, the effect of the collision is mainly located at the east of the present-day volcanic arc.
In any case, the range of temperatures observed in this area is relatively low (∼640° to ∼810°C), which highlights the coherence of the assumed hypothesis associating seismic attenuation with temperature. However, at south and north of the lack volcanoes area (Figure 7), coda waves attenuation increases accompanied with the presence of active volcanoes, which could be a response of available free H2O and/or hydrous minerals (Karato, 2004). This author suggests that high attenuation values may be related to high-water content, and although in this work we have not evaluated the water content, indeed this issue should be boarded in the future. Karato (2004) also mentions that in subduction areas, the attenuation observations suggest that the volcanic arcs are not only warm areas but also wet bulks. Thus, our observations related to the lateral variation of seismic attenuation, and contrasting presence of volcanic activity, thermal anomalies and water content, may suggest diverse conditions of viscosity and/or lateral changes of dip of the Nazca slab.
Uncertainties and Other Considerations
Several sources of uncertainties should be considered for proper analysis and interpretation of the results presented in this work:
1. Parameters of the formulas (5–7) play an important role in the shallowing or deepening of the isotherms. For example, taking values P-T from xenoliths as was suggested by Nakajima and Hasegawa (2003), may generate significant distortions in the thermal structure due to the wide range of emplacement conditions related to the xenoliths in the Granatífera Tuff (Weber et al., 2002). In this work, we have tried to minimize this effect by starting with a regional geothermal gradient to later fitting the observations derived from the xenoliths. However, other experimental parameters such as activation enthalpy (E∗) and the α constant could have lateral variations that would also impact the estimates.
2. Given the impossibility of using a robust dataset of direct estimates of and , the inference of these values from could incorporate a source of error over the entire attenuation inversion. However, we believe that any deviation of the tomography is systematic and would only affect the values of isotherms, not the general trend of the thermal structure of the study area. Thus, future works should be oriented to estimating enough and values to guarantee a proper cover of the study area. In that case, if multiple scattering hypothesis is incorporated, then the inversion should use a spatial approach that mapping properly the and anomalies (see, e.g., Del Pezzo et al., 2018).
3. Our estimations at 4Hz were a product of the availability of data and coherence with the work of Vargas et al. (2004), who evaluated for this region a broad range of values for discriminating scattering attenuation and intrinsic absorption (up to 255 of hypocentral distances; frequency band between 1–19 Hz; local magnitude between 2.9–6.0, and three windows of 0–15 s, 15–30 s, and 30–45 s for applying the MLTWA technique, Hoshiba, 1993). According to those parameters, it looks like any change of the attenuation regime due to depth, frequency band and distances were taking into account for establishing the proper empirical relations between and , as well between and . However, owing to that work did not use a robust dataset, we do not discard changes in the regime underlying coda propagation inside this frequency or higher frequencies due to contribution from surface waves more than regional body waves, as was suggested in other regions (see, e.g., Mayor et al., 2016), or as consequence of lateral variations of the crustal thickness.
4. The hypothesis of attenuation anomalies associated directly with thermal anomalies used in this work discards other processes that may affect the thermal estimations. Thus, while is a dominant process in the area (Vargas et al., 2004), the presence of fluids and their role in the thermal convection, as well as the transformation of elastic energy into other types of energy (e.g., piezoelectricity), may deviate the temperature estimates. As in the previous case, the deviation of the attenuation values is systematic and would only affect the values of isotherms, not the general trend of the thermal structure.
5. The radioactive decomposition in the crust, in contrast with the mantle, could imply a different distribution of the isotherms between these two media. Although in this work we have tried to involve only the lithospheric mantle, and perhaps the mantle wedge, the uncertainty in the geometry of the Moho and the lithosphere-asthenosphere boundary may generate potential distortions in the estimation of the isotherms.
6. The simplistic solution for linking our seismic attenuation observations and the thermal structure of the upper lithosphere in the study region may incorporate unknown parameters that restrict the validity of the assumed hypotheses. Thus, even being presented general interpretations, we do not discard limitations of the techniques and dataset used, neither the methods implemented, which could inhibit a precise identification of underlying processes. Future works should board these issues, including the proper mapping of the multiple scattering, depth-dependence of the seismic scattering, anisotropy, and depth/thickness of the main seismic discontinuities on the thermal estimations (Margerin, 2017; De Siena et al., 2017; Del Pezzo et al., 2018; Sanborn and Cormier, 2018).
Conclusion
We have performed a seismic attenuation spatial inversion that allowed us to infer lateral changes in the thermal structure along the northern volcanic arc of the Andes. We observe that the range of temperatures observed in this area is relatively low (∼640 to ∼810°C), which may be a consequence of the seismic attenuation spatial distribution. Thermal structure in the study area shows a shallowing of the isotherms along the volcanic arc, interrupted by a cold structure, which may reflect a lateral change of the mantle viscosity that prevents the continuity of the volcanic arc. Other interpretation rests on considering that the crustal root has not reached the critical point of melting as occurred at north and south of this thermal anomaly.
Our estimations show an irregular geometry of the isotherms in depth, probably associated with recent events that have not allowed a thermal stabilization in the entire study area. Deepening of isotherms at west is probably associated with the subduction process of the Nazca Plate (∼0–5°N). This phenomenon may respond to the dipper angle and velocity of subduction of this plate in contrast with the flat subducting effect that governs the Caribbean Plate and the overriding Panama Block. The deepening of isotherms is also observed at NE. We hypothesize that the break-off process of the Caribbean Plate that generates the Bucaramanga seismic Nest is associated with the process of the permanent cascading thermal shear runaway.
In some areas, the isotherms follow a trend similar to a thrust fault-related folding geometry. The inversion of the temperature with the depth suggests a recent process of regional perturbation (collision of tectonic blocks). We hypothesize that the Panama Arc at the North and the effect that imprint the collision of the Carnegie Ridge at the South are responsible for these thermal effects. In the case of the northern anomaly, it suggests a thickness of the lithospheric system that prevents a developing of the volcanic arc at the north of this latitude. In the southern case, the effect of the collision is mainly located at the east of the present-day volcanic arc.
Data Availability
Results generated for this study are included as Supplementary Material.
Author Contributions
CV estimated the tomography. All authors contributed to the discussions, interpretation, and writing of the manuscript.
Funding
COLCIENCIAS and Universidad Nacional de Colombia have funded this research partially through Grant #FP44842-006-2016 (Análisis 4D de Vp, Vs y la relación Vp/Vs en la Esquina NW de Suramérica).
Conflict of Interest Statement
The authors declare that the research was conducted in the absence of any commercial or financial relationships that could be construed as a potential conflict of interest.
Acknowledgments
The authors thank the Department of Geosciences, Universidad Nacional de Colombia for supporting this research. Earthquake and hot springs data were obtained from the Servicio Geológico Colombiano. The authors appreciate the constructive comments suggested by the Associate Editor, GF, as well as by the two reviewers, MK and LDS.
Supplementary Material
The Supplementary Material for this article can be found online at: https://www.frontiersin.org/articles/10.3389/feart.2019.00208/full#supplementary-material
DATA SHEET S1 | MatLab® figure format showing different views of the isotherms 730°C (blue), 780°C (yellow), and 830°C (red). The reader may rotate, zoom for detailing features, and overlay other information to the model using MatLab.
DATA SHEET S2 | MatLab® data file with results of the tomographic inversion and isotherms distribution. This file contains the following variables: F, W, and M correspond to polygons of regional faults, country boundaries, and spring water occurrences, respectively. MatrizI, MatrizR, and WS, contain the spatial matrix of attenuation anomalies, RDE, and NEB, respectively (see Figure 5). XV, YV, and ZV are the spatial coordinates of the 3D cube analyzed. Tsoft550_a_020 is the 3D matrix with the estimated isotherms. vac and vin, represent the coordinates of active and inactive volcanoes in the study area.
VIDEO S1 | Video showing different views of the isotherms 730°C (blue), 780°C (yellow), and 830°C (red). The isotherms have anomalously high values on surface, probably due to boundary effects caused by lower information density and restrictions of the inversion towards the boundaries of the cube studied. This anomalous thermal data is reported in the sake of transparency, although the reader is advised to be cautious of its interpretation, particularly in external nodes.
Footnotes
References
Aiuppa, A., Fischer, T. P., Plank, T., Robidoux, P., and Di Napoli, R. (2017). Along-arc, inter-arc and arc-to-arc variations in volcanic gas CO2/ST ratios reveal dual source of carbon in arc volcanism. Earth Sci. Rev. 168, 24–47. doi: 10.1016/j.earscirev.2017.03.005
Aki, K., and Chouet, B. (1975). Origin of coda waves: source, attenuation and scattering effects. J. Geophys. Res. 80, 3322–3342. doi: 10.1029/jb080i023p03322
Anderson, V. J., Horton, B. K., Saylor, J. E., Mora, A., Tesón, E., Breecker, D. O., et al. (2016). Andean topographic growth and basement uplift in southern Colombia: implications for the evolution of the magdalena, orinoco, and amazon river systems. Geosphere 2, 1235–1256. doi: 10.1130/GES01294.1
Artemieva, I. M. (2011). The Lithosphere: An Interdisciplinary Approach. Cambridge: Cambridge Press.
Bloch, E., Ibañez-Mejia, M., Murray, K., Vervoort, J., and Müntener, O. (2017). Recent crustal foundering in the northern volcanic zone of the andean arc: petrological insights from the roots of a modern subduction zone. Earth Planet. Sci. Lett. 476, 47–58. doi: 10.1016/j.epsl.2017.07.041
Carrillo, E., Mora, A., Ketcham, R., Amorocho, R., Parra, M., Costantino, D., et al. (2016). Movement vectors and deformation mechanisms in kinematic restorations: a case study from the colombian eastern cordillera. Interpretation 4, T31–T48. doi: 10.1190/INT-2015-0049.1
Cediel, F., Shaw, R. P., and Cáceres, C. (2003). “Tectonic assembly of the northern andean block,” in The Circum-Gulf of Mexico and the Caribbean: Hydrocarbon habitats, Basin Formation, and Plate Tectonics, eds C. Bartolini, R. T. Buffler, and J. Blickwede (Tulsa, Oklahoma: AAPG).
Colgan, J. P., Egger, A. E., John, D. A., Cousens, B., Fleck, R. J., and Henry, C. D. (2011). Oligocene and miocene arc volcanism in northeastern California: evidence for post-eocene segmentation of the subducting Farallon plate. Geosphere 7, 733–755. doi: 10.1130/GES00650.1
De Siena, L., Amoruso, A., Del Pezzo, E., Wakeford, Z., Castellano, M., and Crescentini, L. (2017). Space-weighted seismic attenuation mapping of the aseismic source of campi flegrei 1983–1984 unrest. Geo-phys. Res. Lett. 44, 1740–1748. doi: 10.1002/2017GL072507
Del Pezzo, E., De La Torre, A., Bianco, F., Ibañez, J., Gabrielli, S., and De Siena, L. (2018). Numerically calculated 3D space-weighting functions to image crustal volcanic structures using diffuse coda waves. Geosciences 8:175. doi: 10.3390/geosciences8050175
Errázuriz-Henao, C., Gómez-Tuena, A., Duque-Trujllo, J. F., and Weber, M. (2019). The role of subducted sediments in the formation of intermediate mantle-derived magmas from the Northern colombian andes. LITHOS 336–337, 151–168. doi: 10.1016/j.lithos.2019.04.007
Gomez, E., Jordan, T., Almandiger, R., Hegarty, K., Kelly, S., and Heizler, M. (2003). Controls on architecture of the late cretaceous to cenozoic southern middle magdalena valley basin, Colombia. Geol. Soc. Am. Bull. 115, 131–147. doi: 10.1130/0016-7606(2003)115<0131:coaotl>2.0.co;2
Gutscher, M. A., and Westbrook, G. K. (2009). “Great earthquakes in slow-subduction, low-taper margins,” in Subduction Zone Geodynamics, eds S. Lallemand and F. Funiciello (Heidelberg: pringer-Verlag).
Hoshiba, M. (1993). Separation of scattering attenuation and intrinsic absorption in Japan using the multiple lapse time window analysis of full seismogram envelope. J. Geophys. Res. 15:824.
Idarraga-Garcia, J., Kendall, J. M., and Vargas, C. A. (2016). Shear wave anisotropy in northwestern South America and its link to the caribbean and nazca subduction geodynamics, geochem. Geophys. Geosyst. 17, 3655–3673. doi: 10.1002/2016GC006323
Kampfmann, W., and Berckhemer, H. (1985). High-temperature experiments on the elastic and anelastic behaviour of magmatic rocks. Phys. Earth Planet. Inter. 40, 223–247. doi: 10.1016/0031-9201(85)90132-3
Karato, S. (2004). “Mapping water content in the upper mantle,” in The Subduction Factory, Geophysical Monograph, ed. J. Eiler (Washington, D. C: American Geophysical Union).
Karato, S.-i. (2010). Rheology of the deep upper mantle and its implications for the preservation of the continental roots: a review. Tectonophysics 481, 82–98. doi: 10.1016/j.tecto.2009.04.011
Kincaid, C., and Sacks, S. (1997). Thermal and dynamical evolution of the upper mantle in subduction zones. J. Geophys. Res. 12:315.
Lonsdale, P. (2005). Creation of the cocos and nazca plates by fission of the farallon plate. Tectonophysics 404, 237–264. doi: 10.1016/j.tecto.2005.05.011
Malin, P. E. (1978). A First Order Scattering Solution for Modeling Lunar and Terrestrial Seismic Codas. Ph.D. thesis, Princeton University, Princeton, NJ.
Margerin, L. (2017). Breakdown of equipartition in diffuse fields caused by energy leakage. Eur. Phys. J. Special Topics 226, 1353–1370. doi: 10.1140/epjst/e2016-60165-6
Marín-Cerón, M. I., Leal-Mejía, H., Bernet, M., and Mesa-García, J. (2019). “Late cenozoic to modern-day volcanism in the northern andes: a geochronological, petrographical, and geochemical review,” in Geology and Tectonics of Northwestern South America, eds F. Cediel and R. P. Shaw (Cham: Springer).
Mayor, J., Calvet, M., Margerin, L., Vanderhaeghe, O., and Traversa, P. (2016). Crustal structure of the Alps as seen by attenuation tomography. Earth Planet. Sci. Lett. 439, 71–80. doi: 10.1016/j.epsl.2016.01.025
Mora, A., Parra, M., Rodriguez-Forero, G., Blanco, V., Moreno, N., Caballero, V., et al. (2015). What Drives Orogenic Asymmetry in The Northern Andes: A Case Study from The Apex of The Northern Andean Orocline. Tulsa, OK: American Association of Petroleum Geologists.
Nakajima, J., and Hasegawa, A. (2003). Estimation of thermal structure in the mantle wedge of northeastern Japan from seismic attenuation data. Geophys. Res. Lett. 30:1760. doi: 10.1029/2003GL017185
Ottemöller, L., Voss, P., and Havskov, J. (2016). Seisan Earthquake Analysis Software for Windows, Solaris, Linux and MacosX, Version 10.5. Available at: http://seisan.info
Parra, M., Mora, A., López, C., Rojas, L. E., and Horton, B. K. (2012). Detecting early shortening and deformation advance in thrust-belt hinterlands: example from the Colombian Andes. Geology 40, 171–174. doi: 10.1130/G32519.1
Parra, M., Mora, A., Sobel, E. R., Strecker, M. R., and González, R. (2009). Episodic orogenic-front migration in the northern Andes: constraints from low-temperature thermochronology in the Eastern Cordillera, Colombia. Tectonics 28:TC4004. doi: 10.1029/2008TC002423
Pedraza, P., Vargas, C. A., and Monsalve, H. (2007). Geometric model of the nazca plate subduction in southwest Colombia. Earth Sci. Res. J. 11, 117–130.
Poletto, F., Farina, B., and Carcione, J. M. (2018). Sensitivity of seismic properties to temperature variations in a geothermal reservoir. Geothermics 76, 149–163. doi: 10.1016/j.geothermics.2018.07.001
Poli, P., Prieto, G. A., Yu, C. Q., Florez, M., Agurto-Detzel, H., Mikesell, T. D., et al. (2016). Complex rupture of the M6.3 2015 March 10 Bucaramanga earthquake: evidence of strong weakening process. Geophys. J. Int. 205, 988–994. doi: 10.1093/gji/ggw065
Pujol, J., (2007). The solution of nonlinear inverse problems and the Levenberg-Marquardt method. Geophysics 72, W1–W16. doi: 10.1190/1.2732552
Ramberg, I. B., Bryhni, I., and Nøttvedt, A. (2008). The Making of a Land: Geology of Norway. London: Geological Society of London.
Rautian, T. G., and Khalturin, V. I. (1978). The use of coda for determination of the earthquake source spectrum. Bull. Seism. Soc. Am. 68, 923–948.
Reyes-Harker, A., Ruiz, C. F., Mora, A., Ramirez-Arias, J. C., Rodriguez, G., De la Parra, F., et al. (2015). Cenozoic paleogeography of the andean foreland and retroarc hinterland of Colombia. AAPG Bull. 99, 1407–1453. doi: 10.1306/06181411110
Ricard, Y., Durand, S., Montagner, J.-P., and Chambat, F. (2014). Is there seismic attenuation in the mantle? Earth Planet. Sci. Lett. 388, 257–264. doi: 10.1016/j.epsl.2013.12.008
Sanborn, C. J., and Cormier, V. F. (2018). Modelling the blockage of Lg waves from three-dimensional variations in crustal structure. Geophys. J. Int. 214, 1426–1440. doi: 10.1093/gji/ggy206
Taboada, A., Rivera, L. A., Fuenzalida, A., Cisternas, A., Philip, H., Bijwaard, H., et al. (2000). Geodynamics of the Northern Andes; subductions and intracontinental deformation (Colombia). Tectonics 19, 787–813. doi: 10.1029/2000tc900004
Trenkamp, R., Kellog, J. N., Freymueller, J. T., and Mora, H. (2002). Wide plate margin deformation, Southern Central America and northwestern South America, CASA GPS observations. J. South Am. Earth Sci. 15, 157–171. doi: 10.1016/s0895-9811(02)00018-4
Vargas, C. A., Alfaro, C., Briceño, L. A., Alvarado, I., and Quintero, W. (2009). “Mapa geotérmico de colombia,” in Proceedings of X Simposio Bolivariano Exploración Petrolera en Cuencas Subandinas, (Cartagena).
Vargas, C. A., and Mann, P. (2013). Tearing and breaking off of subducted slabs as the result of collision of the panama arc-indenter with Northwestern South America. Bull. Seismol. Soc. Am. 103, 2025–2046. doi: 10.1785/0120120328
Vargas, C. A., Pulido, J. E., and Hobbs, R. W. (2018). Thermal structure of the panama basin by analysis of seismic attenuation. Tectonophysics 730, 81–99. doi: 10.1016/j.tecto.2018.02.017
Vargas, C. A., Ugalde, A., Pujades, L. G., and Canas, J. A. (2004). Spatial variation of coda wave attenuation in northwestern Colombia. Geophys. J. Int. 158, 609–624. doi: 10.1111/j.1365-246X.2004.02307.x
Veloza, G., Styron, R., and Taylor, M. (2012). Open-source archive of active faults for northwest South America. GSA Today 22, 4–10. doi: 10.1130/gsat-g156a.1
Weber, M. B. I., Tarney, J., Kempton, P. D., and Kent, R. W. (2002). Crustal make-up of the northern Andes: evidence based on deep crustal xenolith suites. Mercaderes, SW Colombia. Tectonophysics 345, 49–82. doi: 10.1016/s0040-1951(01)00206-2
Keywords: seismic attenuation, tomography, thermal structure, volcanic arc, Colombia
Citation: Vargas CA, Ochoa LH and Caneva A (2019) Estimation of the Thermal Structure Beneath the Volcanic Arc of the Northern Andes by Coda Wave Attenuation Tomography. Front. Earth Sci. 7:208. doi: 10.3389/feart.2019.00208
Received: 02 May 2019; Accepted: 26 July 2019;
Published: 21 August 2019.
Edited by:
Gaetano Festa, University of Naples Federico II, ItalyReviewed by:
Masanori Kameyama, Ehime University, JapanLuca De Siena, Johannes Gutenberg University Mainz, Germany
Copyright © 2019 Vargas, Ochoa and Caneva. This is an open-access article distributed under the terms of the Creative Commons Attribution License (CC BY). The use, distribution or reproduction in other forums is permitted, provided the original author(s) and the copyright owner(s) are credited and that the original publication in this journal is cited, in accordance with accepted academic practice. No use, distribution or reproduction is permitted which does not comply with these terms.
*Correspondence: Carlos A. Vargas, cavargasj@unal.edu.co