Counterfactual Analysis of Runaway Volcanic Explosions
 Willy Aspinall1,2*
  Gordon Woo3
- 1School of Earth Sciences, University of Bristol, Bristol, United Kingdom
- 2Aspinall & Associates, Tisbury, United Kingdom
- 3Risk Management Solutions — RMS, London, United Kingdom
“Few, beside the student of such phenomena, will be able to realize what would have resulted from a more concentrated liberation of the accumulating energy if, for instance, instead of being separated into moderate earth movements and gas emissions spread over more than a 100 weeks of time, all this energy had been manifested in a single week? It is safe to say that, even if the island itself might still grace the map of the world, there would not have remained upon it so much as one human habitation.” Report by Dr. Frank Perret to the Commissioner of Montserrat, 1935 (held in archives of the United Kingdom Foreign & Commonwealth Office). These words were written by the pre-eminent pioneering volcanologist Dr. Frank Perret, commenting on the earthquakes and volcanic unrest on the island of Montserrat in the period 1933–1935. Perret’s way of thinking presaged the form of reasoning we identify now as “counterfactual analysis.” One of the major challenges in volcano crisis decision-making arises when some significant eruptive activity has begun, and the threat potential exists of a massive sudden eruption. Even a small chance of this happening may warrant an urgent call for evacuation. For most active volcanoes, there is only a very limited geological and historical record upon which to base an estimate of the chance of a massive eruption. However, this database may be expanded by considering analog volcanoes, e.g., within a hierarchical model construct, or by stochastic modeling of past crises at the particular volcano of concern that had the potential for a dangerous event but did not ultimately result in a massive eruption. We adopt the latter approach and present a conceptual framework for the counterfactual analysis of runaway volcanic explosions, with reference to other extreme geohazards and georisks. This innovative type of probabilistic analysis has widespread application and is illustrated with the example of the well-documented 1997 Montserrat Vulcanian explosions sequence. An alternative possible mode of eruptive behavior might have substituted this sequence with fewer but larger explosive eruptions or even by a single runaway extreme event. This latter contingency was considered at the time, and motivated a brief, temporary evacuation of the building then housing the Montserrat Volcano Observatory; in response to the escalating violence of explosions, the base for observatory operations was subsequently re-located much further away from the volcano. Absent counterfactual thinking, it would be easy for volcanologists to fail to articulate fully, for decision makers, the possible scales and implications of plausible, potentially dangerous, future eruptive scenarios, thereby laying themselves open to charges of dereliction of duty or even professional negligence.
Introduction
Our understanding is continually evolving about the internal form and processes that take place within a volcano producing an eruption, whether explosive or effusive. Contemporary volcanological thinking is that eruptible magma is present in various geochemical and geophysical forms, such as crystal-rich mushes, residing in a complex network of dikes, sills and reservoirs over a wide range of depths below the edifice (see, e.g., Cashman et al., 2017; Jackson et al., 2018). This represents a paradigm shift from the usual textbook depiction of a volcano as comprising a large, long-lived “magma chamber” containing melt-dominated magma, with potential to be transported to the surface via a single conduit. Recently, evidence has been emerging that is inconsistent with that simple, traditional conceptual model, with the realization that magmatic processes can progress dynamically faster, or slower, than previously thought, and the recognition that explosive volcanism can develop over a range of timescales, sometimes very quickly (Cashman et al., 2017).
From a physicist’s perspective, the non-linear complexity of volcano dynamics precludes the possibility of predicting deterministically the outcome of a volcano crisis, irrespective of the sophistication, resolution and extent of volcano monitoring instrumentation. An eruption outcome is one particular realization of an intrinsically stochastic process, and is just one sample from a probability distribution of possible outcomes, which might have turned out better or worse for society, as per Perret’s comments, above.
Clearly, counterfactual scenarios are a subclass of the full range of possibility. But they are of particular importance because they are rooted in history, and thereby easier to understand and appreciate than some other extreme scenarios that may be proposed.
In scanning the future risk horizon, volcanologists would benefit from having a better appreciation of this probability distribution of possible outcomes of past volcanic crises. This requires research effort and analytical resources, but so much more knowledge can be gleaned from the past than information retrieved about what actually transpired. For amongst these possible outcomes may be discovered some extreme unprecedented scenarios that might have been categorized as “unknown unknowns” or “Black Swans” (Taleb, 2007) had they actually occurred. Across the broad spectrum of natural hazards, most extreme events have either happened before, almost happened before – or might have happened before (Woo, 2018b, c).
Even for regions with a rich documented past, a historical event catalog constitutes just a finite sample from the domain of potential extremes. In a future volcanic crisis, over-reliance on what specifically happened in a past crisis may be a misleading guide, if interpreted with the negative belief that what did not happen before is unlikely – or even considered impossible – to happen in future. Indeed, if, by following this restrictive evidential precept, scientists fail to articulate the full range of potential eruption scenarios that might occur, for certain they would be heavily censured after the event (e.g., at an inquest into any deaths or in legal actions).
Given the very short history of formal volcanic hazard assessments, it is difficult to suggest a clear example of a recent eruption that was unexpectedly large or violent; however, the case of the 2004 Indian Ocean tsunami (Satake and Atwater, 2007) comes to mind as an analogy and an object lesson. Thus, the relative likelihood of what actually happened during a past volcanic crisis is rarely given much attention; what did happen is regarded, by many, as the unique and exclusive destiny, given conditions, and is implicitly assigned a relative occurrence chance of unity.
Yet, the inherent random consequences implicitly embedded within an event catalog should always be kept in mind. According to the vagaries of chance and mechanisms for dynamic triggering, a period of unrest might have developed into an eruption; a minor eruption might have evolved into a major disaster.
Whenever an event occurs that takes risk analysts by surprise, questions are asked how the loss might have been averted, or what additional risk mitigation measures might have reduced the loss. It is unusual for questions to be asked how the loss might have been worse. To ponder what would have happened if things had turned for the worse is called a downward counterfactual. By contrast, an upward counterfactual considers what would have happened if things had been better.
Psychologists of counterfactual thinking (Roese, 1997) observe that upward counterfactual thoughts are much more common than downward ones. Not just volcanic eruptions, but indeed all perils represent some form of stochastic process, of which actual historical events constitute a specific realization. Beyond the existing event catalogs, worse events are possible that may yet be imagined, because people tend to avoid thinking about downward counterfactuals. A general assessment of counterfactual risk analysis has been undertaken (Woo, 2018a), explaining the purpose and highlighting the value of stochastic modeling of the past, rather than treating history as somehow fixed and pre-determined.
Consider, for example, the risk assessment of severe river flooding in a region with a wet climate and overseen by an advanced meteorological agency with supercomputer facilities. Alternative realizations of past storms can be generated through numerical weather forecasting. Suppose that there is a detailed library of rainfall ensemble forecasts going back a few decades, where the forecast uncertainty is captured by an ensemble of several dozen alternative projections. Through the stochastic simulation of alternative past outcomes, the risk of record levels of severe flooding can be computed. This modeling agenda has been carried out for England (Thompson et al., 2017), and has generated results indicative of record rainfall actually observed a few years later. Compared with probabilistic analyses used for future weather forecasting, this is a counterfactual analysis in that an ensemble of alternative weather forecasts of the past has been used to assess how much worse the weather might have been. This is a good example of how counterfactual risk analysis can address the question: how much worse could a loss outcome be?
Of course, in volcanology, unlike meteorology, the sparse and indirect knowledge of the dynamics of a volcano negates prospects for viable and tractable ensemble forecasting. However, the exercise of revisiting past historical eruptions is rewarded by fresh insights, unobtainable from the historical event archives themselves. In the parallel geophysical context of seismology, Woo and Mignan (2018) have sought seismic hazard insights into extended fault ruptures, through the counterfactual analysis of runaway earthquakes. As with runaway volcanic eruptions, runaway earthquakes pose a major extreme but rare societal threat, having the potential of causing catastrophic losses over a very large area.
Downward Counterfactual Thought Experiment
Consider a specific historical volcanic crisis. Although it is impossible to travel back in time to experiment physically on the past, it is always possible to conduct thought experiments. The purpose of any kind of scientific experimentation is discovery. With counterfactual thought experiments, Black Swans may ultimately be discovered. Indeed, such experiments provide one of the most systematic methods for tracking Black Swans (Woo, 2018a).
The following downward counterfactual thought experiment can be conducted to explore alternative evolutions of the volcanic crisis. To begin, think of possible ways in which the loss outcome might have been 5% worse. Then think of possible ways in which the loss outcome might have been 10% worse. Keep increasing the incremental loss until the range of possible loss phenomena has been exhausted, and no more realistic pathways to greater loss can be identified.
Suppose there had been an evacuation of a particular region around the volcano. Then a downward counterfactual might consider the casualty toll in the absence of that evacuation. This is a useful exercise for emergency management and planning by civic authorities, especially if the logistics of evacuation had been difficult to organize and execute.
Another downward counterfactual might consider the casualty toll if the actual eruption had been much larger than it actually was. A specific version of this downward counterfactual is where a runaway explosion occurs, with all of the ejecta from a historical sequence of lesser events being disgorged from the crater in just a single enormous event. This important runaway explosion scenario is the focus of the analysis presented here. The specific example of the Montserrat Vulcanian explosions of 1997 is developed to showcase the downward counterfactual risk analysis, but the methodology could be adopted and easily transferred to many active volcanoes around the world where volcanologists fret anxiously over the prospect of a runaway explosion. In this regard, two recent, powerful explosive eruptions come to mind: the unexpected awakening of Chaitén volcano, Chile, in 2008 (Carn et al., 2009), and the 2015 sub-Plinian eruptions of Calbuco volcano, Chile (Castruccio et al., 2016).
The Montserrat Vulcanian Explosions of 1997
The more complex and non-linear the characterization of a dynamical system, the larger the range of alternative states to which it can evolve. Various studies of non-linear dynamics suggest that counterfactual analysis would be an instructive and rewarding exercise for the Soufrière Hills Volcano, Montserrat. The non-linear dynamics of lava dome extrusion at the volcano was numerically modeled by Melnik and Sparks (1999). Following on from this, Connor et al. (2003) showed that the repose time intervals between 75 explosions between September 22 and October 21, 1997 followed a log-logistic distribution, consistent with a physical model driven by competing processes: pressurization due to rheological stiffening and gas exsolution, and depressurization due to development of permeability and gas escape. This empirical log-logistic distribution would follow if the underlying dynamics were describable by a classic Verhulst equation (i.e., a differential equation describing a logistic/sigmoid growth model), which is known to have unstable chaotic solutions. So, the temporal pattern of explosions was subject to a significant degree of stochastic variability.
Mason et al. (2006) elaborated the conduit and magma conditions which influence the evolution, and restraint, of explosive eruptions of Soufrière Hills Volcano by considering mass transfer processes of gas diffusion into bubbles caused by decompression. Melnik and Sparks (2002) had proposed two end member cases corresponding to complete equilibrium and complete disequilibrium. In the first case, diffusion is fast enough to maintain the system near equilibrium and a long-lived explosive eruption develops. In the latter case, pre-existing bubbles expand following decompression, but diffusive gas transfer is negligible. This leads to an eruption of shorter duration. Mason et al. (2006) developed their model to include the role of mass transfer by investigating transient flows at the start of an explosive eruption triggered by a sudden decompression. Their simulations showed a spectrum of behaviors from sustained to short-lived highly non-equilibrium Vulcanian-style explosions lasting a few tens of seconds, through longer lasting eruptions that can be sustained for tens of minutes and finally to eruptions that can last hours or even days.
Thus, the evolution of initial unsteady conduit flow depends on the physical conditions in the magma column before an eruption is triggered. For Soufrière Hills Volcano, Mason et al. (2006) modeled a situation of on-going slow magma ascent in the conduit, which set up the initial conditions for progressing to an explosive eruption. As the eruption develops, the chamber continues to feed magma into the conduit. However, for the Montserrat Vulcanian explosions in 1997, magma erupted in the initial transient stage involved only material in the conduit, with erupted volume much smaller than the reservoir volume; as these Vulcanian explosions are short-lived perturbations, the chamber pressure could be assumed little affected by these particular eruptive processes.
In addition, the Montserrat andesite magma was very phenocryst rich and so had very high viscosity and low bulk water content. Mason et al. (2006) suggested that in this case initial unsteady explosive flow in the conduit declined quite rapidly to a condition where fragmentation stalls and gas escape becomes sufficiently effective to preclude the possibility of a sustained explosive eruption.
While this may be valid for an explosive fragmentation process that is self-limiting in the way outlined by Mason et al. (2006), thereby restricting drawdown to remain wholly within the conduit, there is a question of how close the drawdown of any of these explosions might have come to reaching the upper crustal magma reservoir, potentially provoking explosive activation of reservoir magma (i.e., a downward counterfactual outcome). Based on Druitt et al. (2002), we may note that the series of more than 88 Vulcanians that took place on Montserrat in the period July – October 1997 probably erupted magma in excess of 25 × 106 m3 (DRE). Given an overall volume of more than 1 km3 of magma was erupted in the whole eruption episode on Montserrat, between 1995 and 2010, and that it is inferred there was total long-term magma storage of about 13 km3 below the volcano (Wadge et al., 2014), it is reasonable to presume that sufficient magma was available at depth in 1997 to feed a single explosive eruption of order 25 × 106 m3 (DRE), had relevant conditions in the volcano been different. The key issue is: how different?
While these characterizations of the volcano’s magma storage and supply came much later, in autumn 1997 concern was expressed by some volcanologists (but not all) at the Montserrat Volcano Observatory (MVO) that the Soufrière Hills Volcano might be capable of producing a major sub-Plinian or even Plinian eruption, given the way activity was escalating1. At the time, this was regarded by some as, at best, a contentious if not implausible scenario because there was no indisputable evidence for Plinian deposits from any previous Soufrière Hills eruption (this was to change substantively, later: Smith et al., 2007; Le Friant et al., 2008, 2015; Jutzeler et al., 2017). One of us (WA) was MVO Chief Scientist in June 1997, when the first Vulcanians occurred following the major, and fatal dome collapse of June 25, 1997. On Saturday June 28, 1997, a vigorous explosion started; as Chief Scientist, WA was sufficiently concerned about our exposure at MVO[S] that twelve (of sixteen) staff were instructed to leave the building and position themselves as observers, further away from the volcano and the Belham Valley.
Here we consider the possibility that the Soufrière Hills explosivity might have escalated to produce a single massive eruption, following a pathway bifurcation that would have taken its activity far beyond the stochastic variation in the pattern of repeating small explosions actually observed in September – October 1997. Such an intensification of explosive magnitude would have had markedly different societal risk implications for the management of the crisis, and not least for the scientists stationed at the Montserrat Volcano Observatory MVO[S]. At this juncture, MVO[S] was located in a rented house in Old Towne, about 300 m from the Belham Valley (see Figure 1), a major drainage channel sourced high on the northwest flanks of the volcano. (MVO operations moved subsequently in 1997 to the north of the island, then, a few years later, to the purpose-built observatory at Flemmings – see Figure 7).
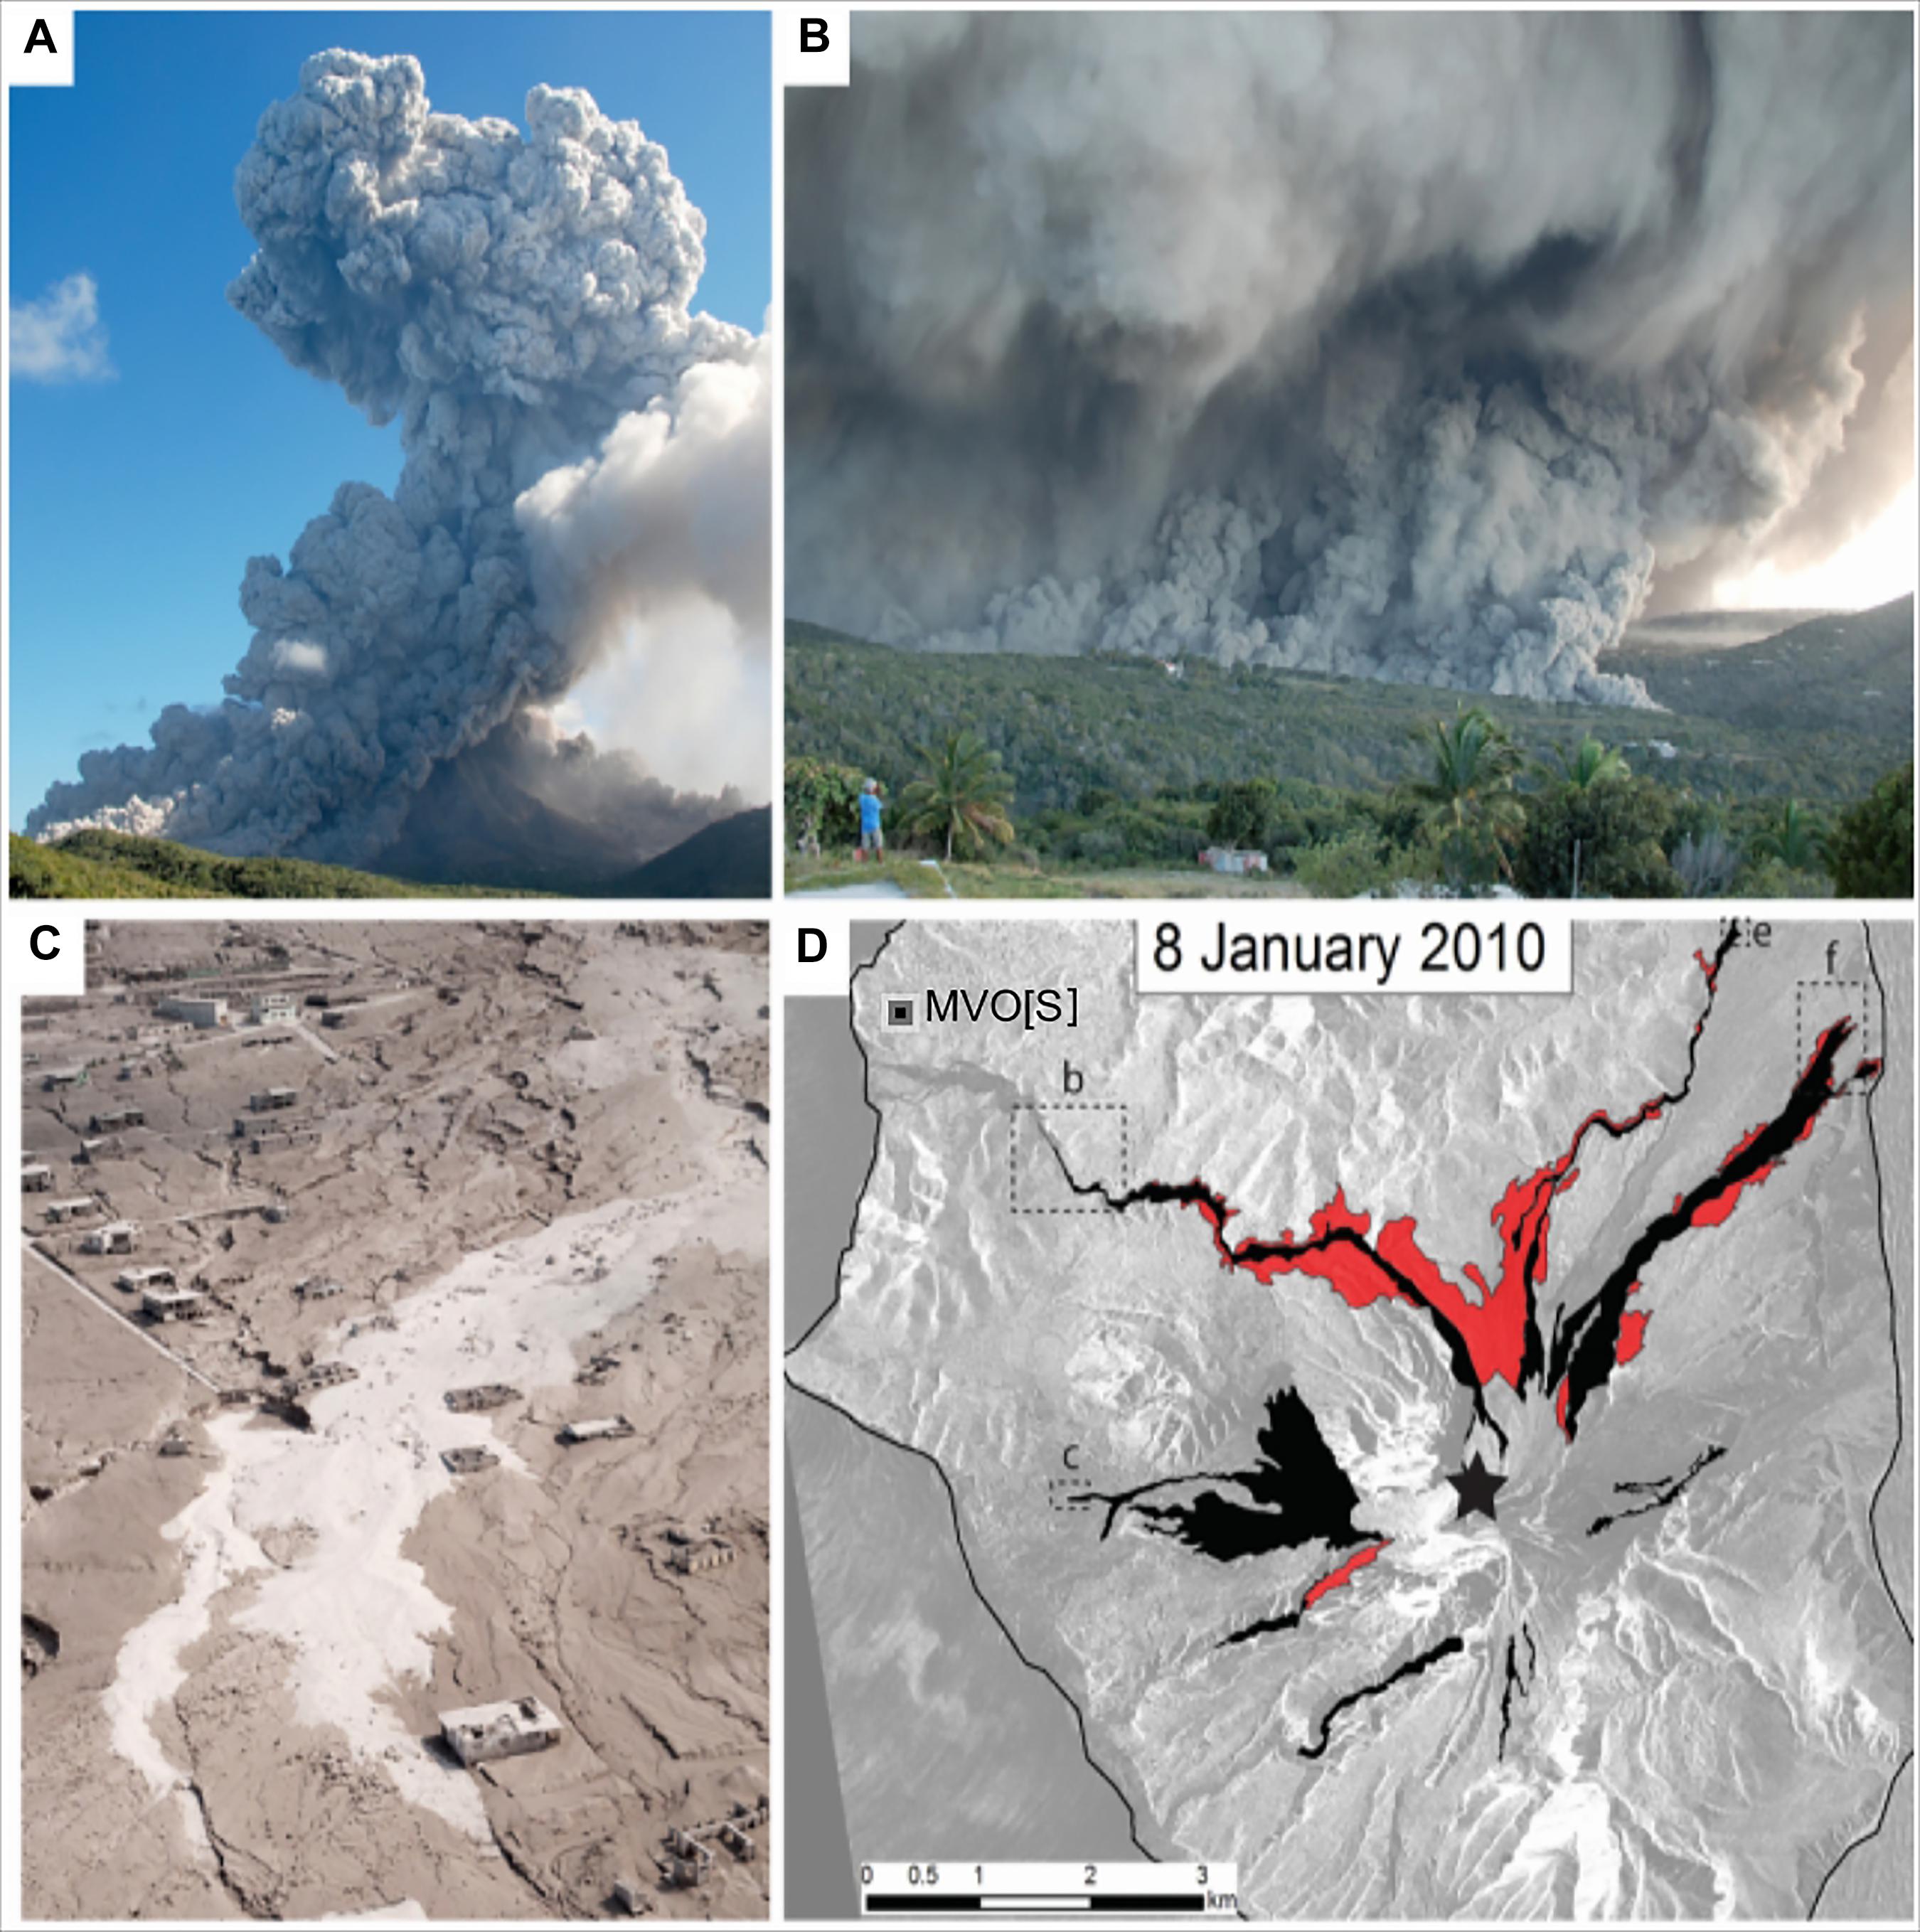
Figure 1. Three images and a pyroclastic density current (PDC) flow map of the January 8, 2010 explosion of the Soufrière Hills Volcano. (A) Explosion plume after 30 s, with ground-hugging PDCs moving predominantly to the NW (right in photo) and to the NE (left). (B) PDC moving down the Belham Valley to the NW. (C) PDC deposits in Plymouth, 4 km to the west. (D) Map showing the extent of the high-particle concentration PDCs (black) and low-particle concentration PDCs (red). The crater location is marked on panel (D) by a star and the locations of photographs (b) and (c) are indicated by broken line rectangles [photos (e) and (f) photos are not here]. For the counterfactual discussion of hazard and risk at MVO[S], due to a hypothetical runaway explosion down the Belham Valley, note in panel (b) the pyroclastic flow progressing down the valley, 5 km from the volcano; MVO[S] was about 6.5 km from the volcano. This event and its runout distance are used to calibrate the MOLASSES flow model (see text). [Figure reproduced with permission from Figure 5.5 of Cole et al. (2014), courtesy of the authors and the Geological Society of London].
It is in the specific context of the hazard level at MVO[S] observatory that a hypothetical alternative evolution of the 1997 Soufrière Hills Volcano explosive activity is explored below, using a counterfactual approach. At the time, the observatory was not within the exclusion zone then in force, and some members of the local population were also present in the same area.
Runaway Explosion Scenario Analysis for Montserrat
Here, we address this question retrospectively in relation to the latent hazard of a pyroclastic density current (PDC) flow reaching the site of MVO[S], due to a violent explosion of the nearby volcano. Pyroclastic density currents are fast-moving, hot mixtures of volcanic gases, blocks and ash, which are invariably lethal to anyone caught in their path. We evaluate the conditional probability of occurrence of such a PDC flow, given an explosion, using a very simple formulation that considers only conduit dimensions and total conduit volume as uncertain variables.
For appraising the plausibility of a runaway explosion – if the fragmentation depth approaches or reaches the magma chamber – it would be desirable to place such a study in a full physical dynamical context. This said, we do not embark on a detailed dynamic and physical numerical modeling of conduit magma and melt processes, such as that described by Mason et al. (2006) and references therein. Instead, we rely on an elementary first order volumetric modeling approach because our main purpose is to elucidate the counterfactual concept with a well recorded case history. Following Thomas et al. (2018), we restrict our calculations to consider magma drawdown volumes just within a conduit of nominal length 5 km, i.e., to a point where the conduit may meet an upper reservoir. We place a narrow uncertainty on this value (5th percentile 4.8 km; 95th percentile 5.2 km) because here we are interested in the influence of conduit radius, as the main uncertain variable; testing reservoir depth as an uncertain variable would be straightforward with our numerical counterfactual model, described below.
Another reason to limit our model to the conduit is that dynamic interactions between erupting conduit magma and reservoir magma could become complex and possibly non-linear, if we were to consider much larger volume eruptions. As the fragmentation level deepens, pressure gradients will increase and magma in the reservoir may no longer play a quasi-passive role in the eruption. Instead, the sudden disturbance of reservoir magma could work to sustain the explosion above and increase its strength and duration. Thus, our goal here is simply to estimate the approximate size of a Vulcanian eruption of Soufrière Hills Volcano (as it was in 1997), that might have caused a perturbation of the upper reservoir, had the conduit dimensions been slightly different.
To provide a context for this counterfactual analysis, we select a few explosion scenarios that were representative of the 1997 events, against which to anchor our simple model.
Scenario Explosions
Druitt et al. (2002, p299) record that in September – October 1997 a detailed field survey of PDC deposits relating to a single explosion was carried out for just one individual event; otherwise, the Vulcanian volumes were determined as averages from deposits laid down over several events.
Given the sparseness of volume data from the field in the case of most of these explosive events (see Druitt et al., 2002), we adopt indicative values for our present purpose. These values should not be ascribed any precise metric meaning in respect of the individual cases; they are used more as figurative examples with emphasis on the large associated uncertainties.
Whereas there is only a very limited amount of field survey data furnishing individual PDC flow volumes, there is a substantial amount of data about the initial explosive durations of these events, as recorded by seismological instruments, and reported by Druitt et al. (2002), Formenti et al. (2003), Cole et al. (2014). We use their tabulated duration data for events with defined flow volumes to develop a robust Markov Chain Monte Carlo (MCMC) regression of volume on duration, using algorithms presented in Chapter 17 of Kruschke (2015, Ed. 2). This regression allows us to make posterior predictive estimates of flow volumes for individual explosions from their measured seismic duration, with suitable uncertainties taken into account as priors.
On Table 1, we identify five observed or representative explosion events from Montserrat, together with two counterfactual examples.
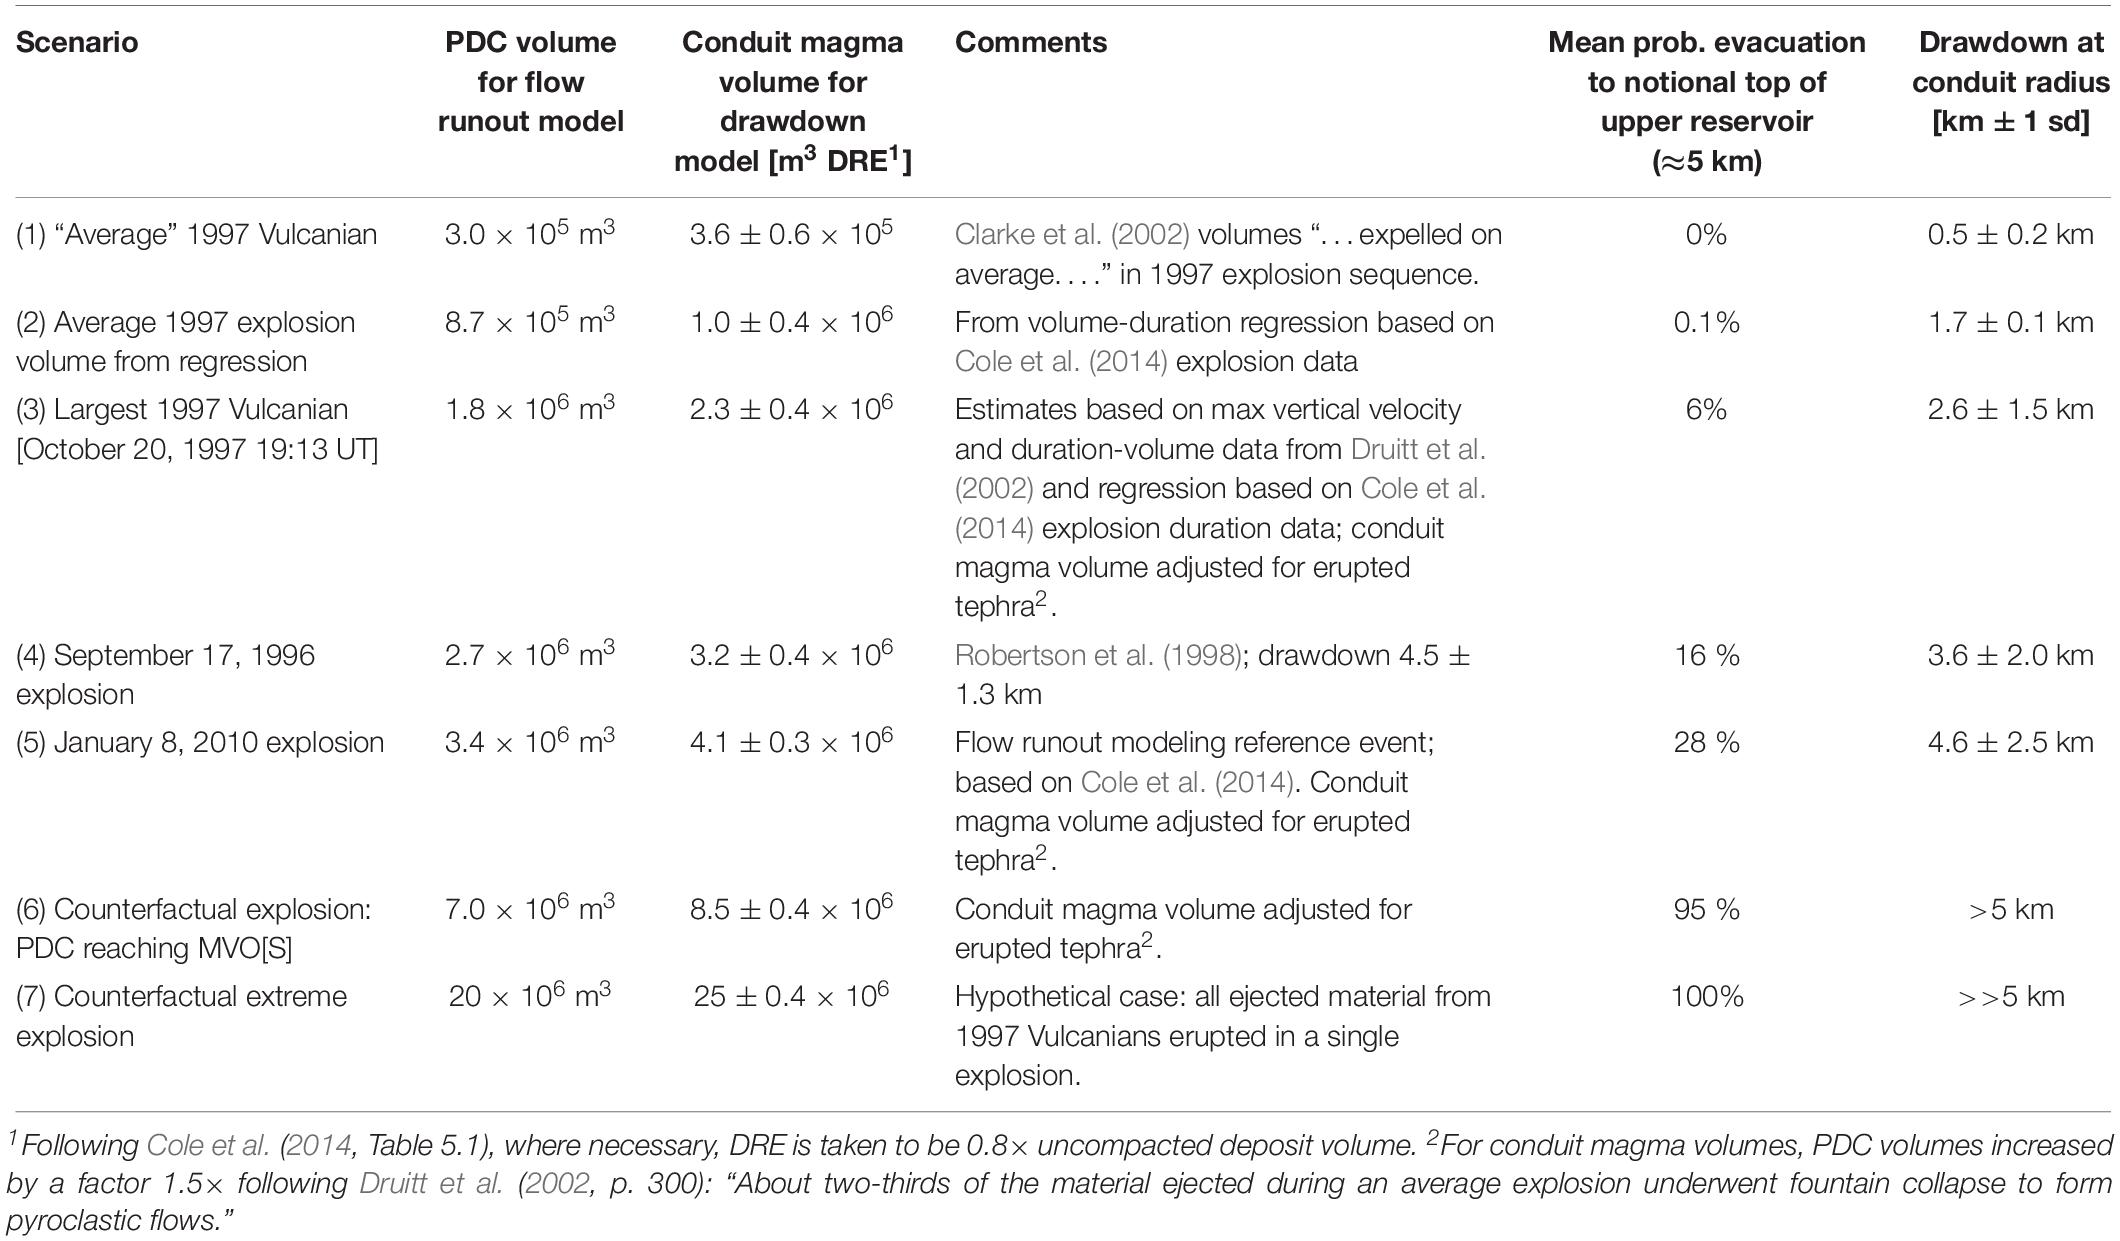
Table 1. Details of explosion scenarios used in the counterfactual analysis and results of drawdown model tests.
The first three on Table 1 are archetypal explosions considered representative of the September – October 1997 sequence, with two differently evaluated “average” Vulcanian explosions and one event (on October 20, 1997, near the end of the sequence) which we gauge as likely to have been the largest single event in the series.
Although pre-dating the 1997 sequence, for context we include on Table 1 the explosion of September 17, 1996. This was a major event, just over a year after the eruption crisis started, and signaled a marked escalation of eruptive violence. Details of the size and nature of the event were given in its wake by Robertson et al. (1998), including the important deduction – in the light of what we discuss below – that conduit drawdown was 4.5 ± 1.3 km. As noted by Mason et al. (2006), some uncertainty persists about the duration of the explosive stage of the event, and therefore it is debatable whether it was a sub-Plinian or Vulcanian explosive eruption. Ambiguity is unsurprising in this regard because the explosion occurred at night, and following a major, prolonged dome collapse of several hours which generated a great deal of airborne ash, which settled widely on Montserrat. This said, the erupted volume and drawdown estimates of Robertson et al. (1998) are well founded and help inform our counterfactual analysis.
For a second authoritative reference case, we rely on the later explosion of January 8, 2010, for which Cole et al. (2014) provide good volume data and a map of the PDC flow footprint (see Figure 1). We use Figure 1D to anchor our scenario flow mapping model, discussed in a later section, below.
The two remaining entries on Table 1 are hypothetical scenarios (6 and 7), which we devise for counterfactual analysis; their parameterizations are explained in the section on flow runout simulations, following the uncertainty analysis of volume-based potential drawdowns for each of the seven scenarios outlined on Table 1.
Model Geometry
We use the Soufrière Hills Volcano conduit geometry outlined by Thomas et al. (2018) in their investigation of conduit property controls on seismicity as a function of depth and, in or analysis, adopt their point values for the conduit dimension parameters hn, rn, as central values for our uncertainty distributions. The latter parameters are shown on Figure 2 and comprise:
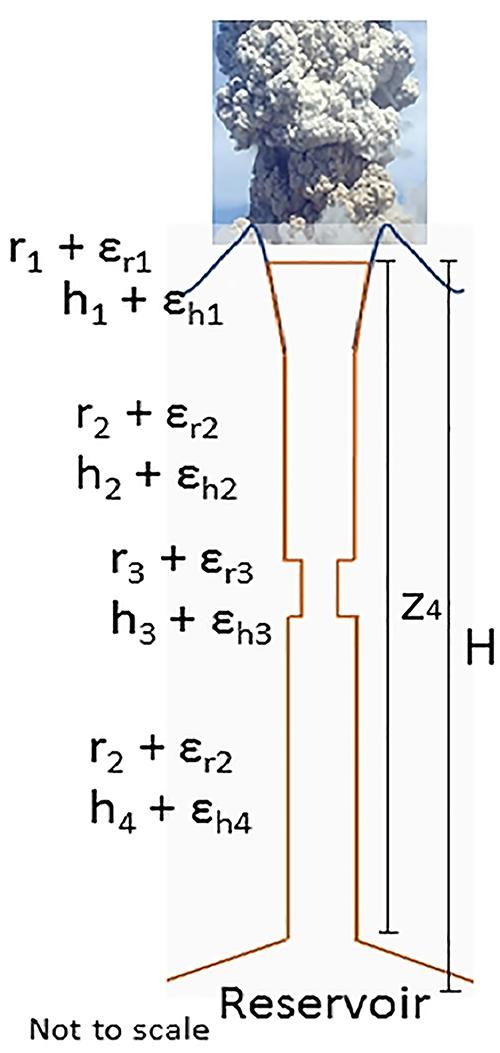
Figure 2. Schematic model conduit geometry for Soufriere Hills volcano (after Thomas et al., 2018; see text); conduit radii and lengths are denoted by rn and hn, with related uncertainties εn. Dimensions z4 and H refer to nodes on Figure 3 and represent BBN random variables: overall conduit length and depth to effective level of the magma reservoir, respectively. z4 is the sum of random variables h1 + h2 + h3 + h4; H is modeled equal to or greater than z4 to allow for the possibility of a small reservoir cap sealing eruptible reservoir magma from the conduit proper.
r1 = radius of open crater
h1 = depth of crater to top of upper conduit
h2, r2 = length and radius of upper conduit
h3, r3 = length and radius of conduit constriction (see Thomas et al., 2018)
h4, r2 = length and radius of lower conduit
Additionally, for uncertainty quantification in our calculations, we introduce randomized variations εhn, εrn on these parameters (see Figure 2 and Supplementary Information for details).
Although small in extent, for consistency with their model we retain the constriction, h3, r3, which they locate part way down the conduit where hybrid seismic events were detected (the constriction turns out to be of negligible consequence for our volumetric model).
One key variable is radius r2, which characterizes the average cross-sectional area of the main conduit from just below the crater down to where magma is stored in an upper reservoir; Thomas et al. follow several authors in setting the conduit dimension to 50 m diameter for Soufrière Hills Volcano, mainly on observed dimensions of spine extrusions. We remark that the spines generally emerged in flared craters or excavations in a dome edifice and, as a result, may have materialized as entities that are wider than the feeding conduit; estimates of the effective (i.e., average) diameter of the conduit at depth are only loosely constrained by other considerations relating to throughput extrusion rates and explosion dynamics. Thus, we assume 25 m radius is the upper bound for r2, and introduce a distribution skewed toward narrower radius values in our uncertainty analysis.
Another important variable is the effective depth to the upper magma reservoir feeding the conduit. From petrological evidence, seismicity and deformation observations, this is generally held to be at about 5 km depth in the case of the Soufrière Hills Volcano (but see discussion in Wadge et al., 2014, concerning differing indications). Thus, in our calculational model, we allow the effective depth to the upper reservoir to vary, to a limited degree, about this notional value of 5 km.
In reality, there may be no definite single depth at which one can say a transition is made from conduit to upper reservoir. Therefore, in our drawdown model we calculate the depth to which magma is evacuated in an explosion from a conduit of given (but uncertain) radius, and restrict discussion of our findings by relating them to the assumed depth of the top of the upper reservoir.
Numerical Model for Counterfactual Scenarios
We use the UNINET package (Ababei, 2016) in Bayesian Belief Net (BBN) mode to perform Monte Carlo sampling of the variable uncertainty distributions.
The basic concept behind the treatment of uncertainty in Bayesian networks is conditional probability (Jensen, 2001). A BBN is a directed acyclic graph, comprising a set of variables (nodes) representing states of a system, together with a set of directed links (arcs) representing conditional dependencies between the nodes (Jensen, 2001). Bayesian networks form the basis of many expert systems, originally in medical diagnosis and decision making to bioinformatics (Spiegelhalter et al., 1993), and have found widespread application in hazard and risk assessments of many kinds and high dimensionality complexity e.g., Ale et al., 2008, including volcanology (e.g., Aspinall and Woo, 2014).
The model framework is shown in Figure 3, comprising a number of random variable probability nodes linked to functional (calculation) nodes. Summary properties of the BBN nodes and their distribution statistics are reported in Supplementary Material.
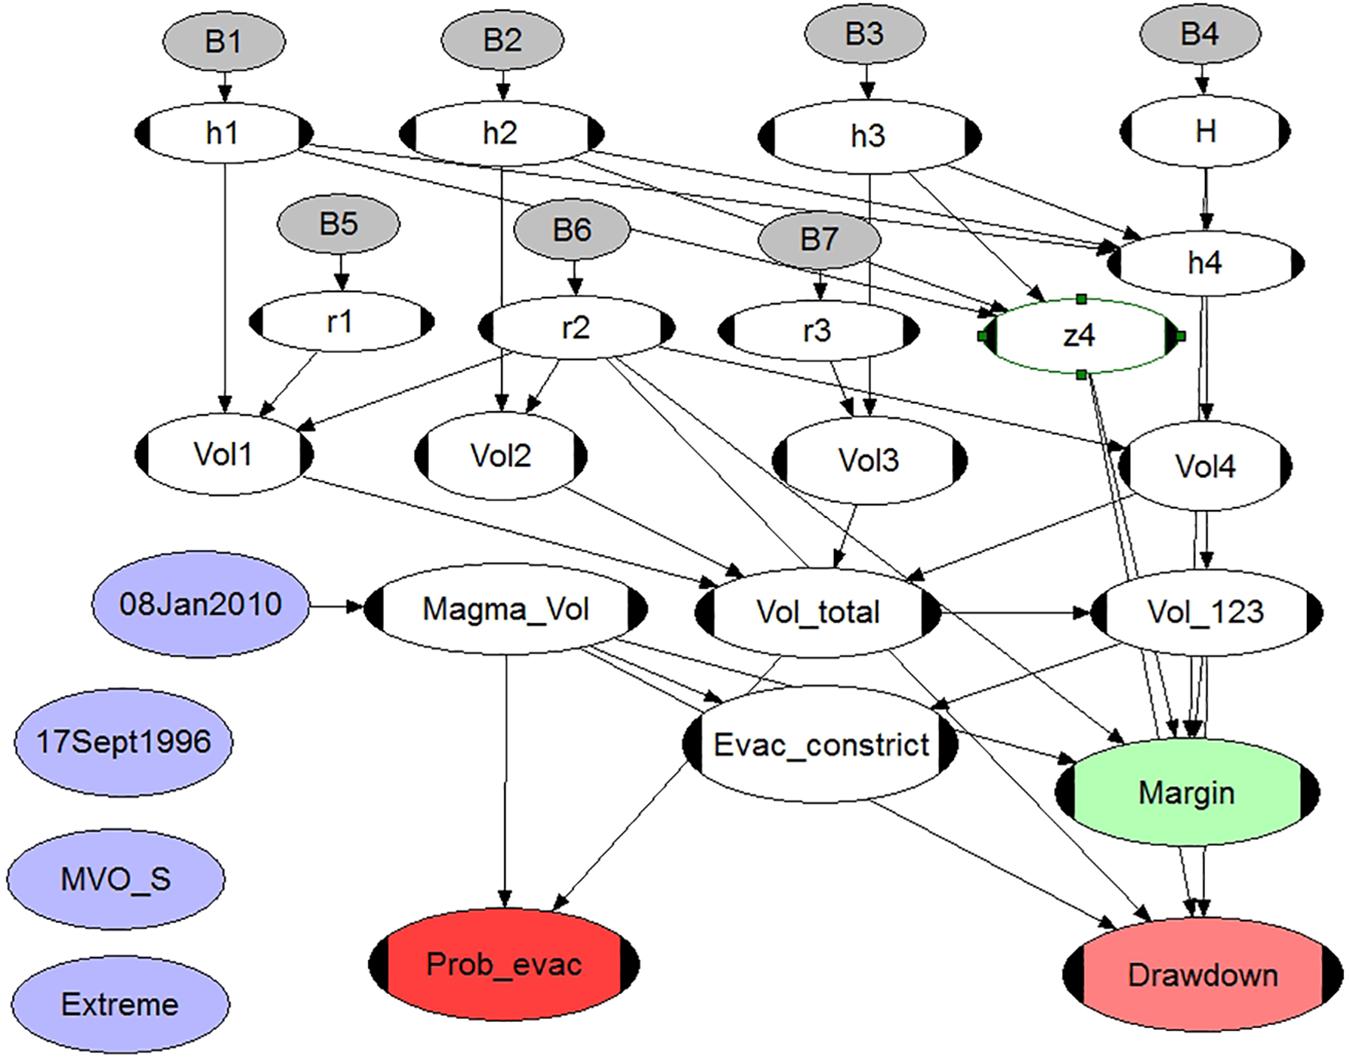
Figure 3. UNINET BBN model for performing uncertainty analyses when calculating scenario-based conduit evacuation probabilities and conduit drawdowns. Four different explosion scenarios are shown as light purple nodes; these represent the “calibration” event, January 08, 2010 (actively linked in this analysis); the earlier September 17, 1996 explosion; MVO_S is the model-based minimum explosion volume needed to reach the observatory; and Extreme, a hypothetical scenario in which all the material erupted in the 1997 Vulcanians is modeled as erupted in one major event (see text and Supplementary Material).
The conduit dimension variable nodes (rows 2 and 4) are labeled h1, r1, etc, corresponding to the notation of Figure 2, and their uncertainty spreads ε are re-sampled independently with beta distributions (gray nodes, rows 1 and 3). At each Monte Carlo iteration, these radii and depth spans are converted jointly to conduit sector (and crater) volumes (row 5), summed in row 6 to enumerate total conduit volume (Vol_total) and the volume of the upper three depth sectors to the bottom of the constriction (Vol_123). The latter node was included to allow us to test the impact, if any, of the Thomas et al. (2018) constriction in relation to the volume erupted; this is tested at the node Evac_constrict.
The scenario erupted volume, with uncertainties, is introduced via the light purple node (e.g., September 17, 1996, in Figure 3) and Monte Carlo samples are passed directly to the Magma_vol node for testing against corresponding samples from the node Vol_total, which expresses conduit volume uncertainty (this two-stage implementation obviates the need to re-type dependence relation equations in the several other child nodes whenever the scenario volume is changed).
Three target nodes are evaluated at each iteration: Prob_evac (red), Drawdown (red), and Margin (green); all Monte Carlo samples, usually 50,000 in total, are collected for each of these nodes and provide the basis for the results of our model’s probabilistic uncertainty analysis. The first target node (Prob_evac) estimates the probability that the given scenario eruption could lead to the conduit being evacuated right down to the upper reservoir depth, node H (which itself varies for each iteration).
The BBN also contains a subsidiary target node labeled Margin (green) which indicates how close the sampled evacuation depths were to reaching the upper reservoir. This margin is not retrievable directly from corresponding Drawdown samples because the reservoir top depth is also allowed to vary in the sampling.
The Drawdown node computes the depth of evacuation at each iteration, given the variations in all the conduit dimension parameters. The BBN output for this node is shown as Figure 4 (with depth in meters): the distribution mean and its standard deviation, and the 5th, 50th, and 95th percentiles are reported by UNINET.
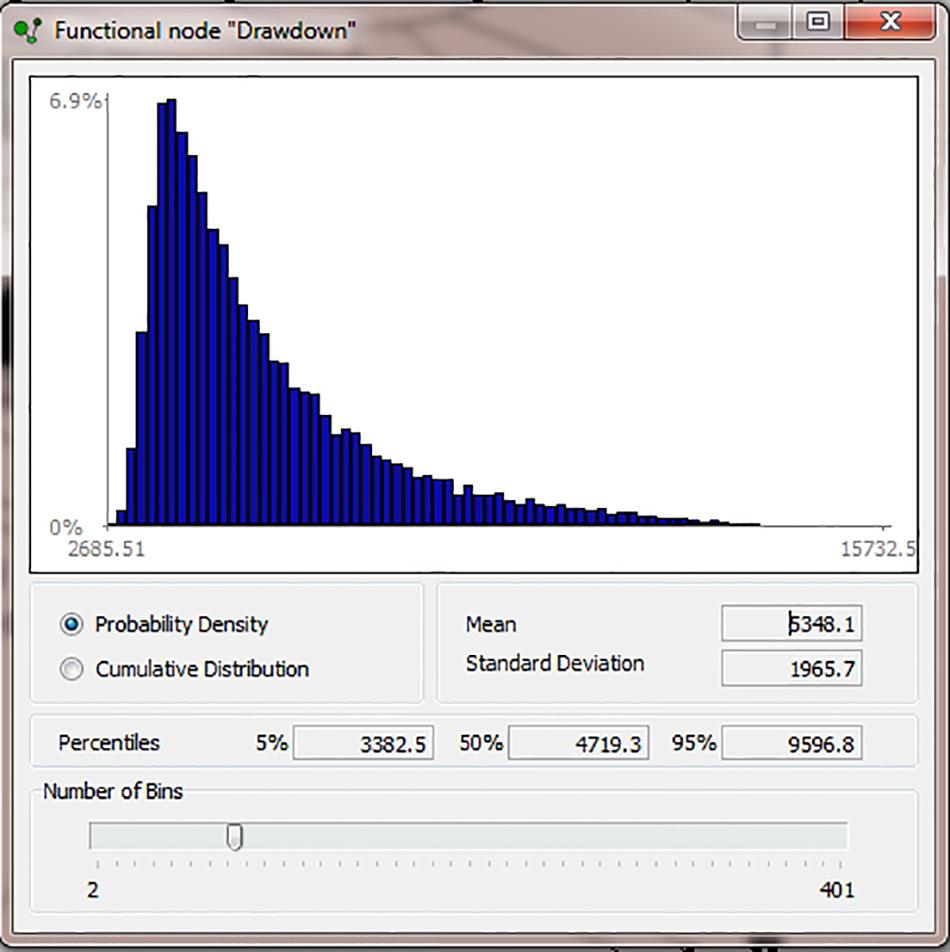
Figure 4. Example of UNINET BBN output: September 17, 1996 explosion uncertainty analysis for Drawdown node (in m). Robertson et al. (1998) estimated drawdown to have been 4.5 ± 1.3 km.
This distribution may be compared with other, independent estimates of drawdown for certain scenarios; for the September 17, 1996 explosion – here, the benchmark case allowing direct comparison with other findings – the BBN computes a mean drawdown of 3.6 ± 2.0 km (1 sd). Robertson et al. (1998) estimated the drawdown for this event to have been 4.5 ± 1.3 km. While these mean values differ moderately, they each fall within the substantial overlap in the respective uncertainty spreads.
However, these basic first- and second moment descriptive statistics do not tell us anything about the shape of the corresponding distributions. To illustrate the non-normal shape of the BBN drawdown solution for the September 17, 1996 reference case, the 90% credible interval is 1.9 – 7.4 km, with median 3.0 km (from 50,000 BBN samples of the model variables). The third and fourth moments of the distribution are +2.9 (skewness) and 14.5 (kurtosis) – in other words, it is lopsided toward higher drawdown values, and is “heavy tailed” in that direction (leptokurtic). The results of running our BBN for all seven explosion scenarios outlined above are reported in the two rightmost columns of Table 1 (only the means and standard deviations are recorded; the corresponding distributions all possess skewness and leptokurtic properties, similar to those of the September 19, 1996 reference case, just discussed). In terms of the probabilities that a given explosion might intercept the notional depth of the top of the upper reservoir, the 1997 Vulcanian cases (scenarios 1 – 3, Table 1) suggest negligible to very low probabilities that this could have happened: for the largest event of the 1997 sequence (scenario 3: October 20, 2010 19:13 UT), the assessed probability of its drawdown reaching about 5 km depth is 6%.
When we turn to the two big observed explosions, outside the 1997 sequence (scenarios 4 and 5: September 17, 1996 and January 8, 2010), these evince moderate probabilities that their drawdowns could have reached a depth close to the top of the upper reservoir: 16 and 28%, respectively. However, both are less likely than not to have plumbed such depths and, even if either did get close, it is likely that magma flow out of the reservoir into the conduit would counteract the downward progress of a fragmentation front (RSJ Sparks, pers. comm.).
In contrast, the two hypothetical explosion scenarios (6 and 7) evince very high probabilities of connecting with the upper conduit: 95 and 100% (rounded up value). These suppositional cases are characterized by presumed conduit magma volumes which are, respectively, roughly twice and six times the volume erupted in the largest actual explosion, 8 January 2010. In the case of scenario 6, PDC runout modeling (below) indicated that this was the order of eruption magnitude needed to produce a PDC that would reach close to MVO[S]; scenario 7 is included to model the counterfactual situation in which all the material ejected in the 1997 series of Vulcanians would be erupted in a single giant explosion.
Corresponding conduit drawdown means and ±1 sd values are tabulated in the righthand column of Table 1. These range from a few hundred meters for an “average” 1997 Vulcanian, to well in excess of 5 km for the two counterfactual explosion scenarios. On this basis, it can be conjectured that the 8 January 2010 explosion may have come very close to interacting with the upper reservoir or might even have done so, without provoking further intensification of the explosion (see Figure 5).
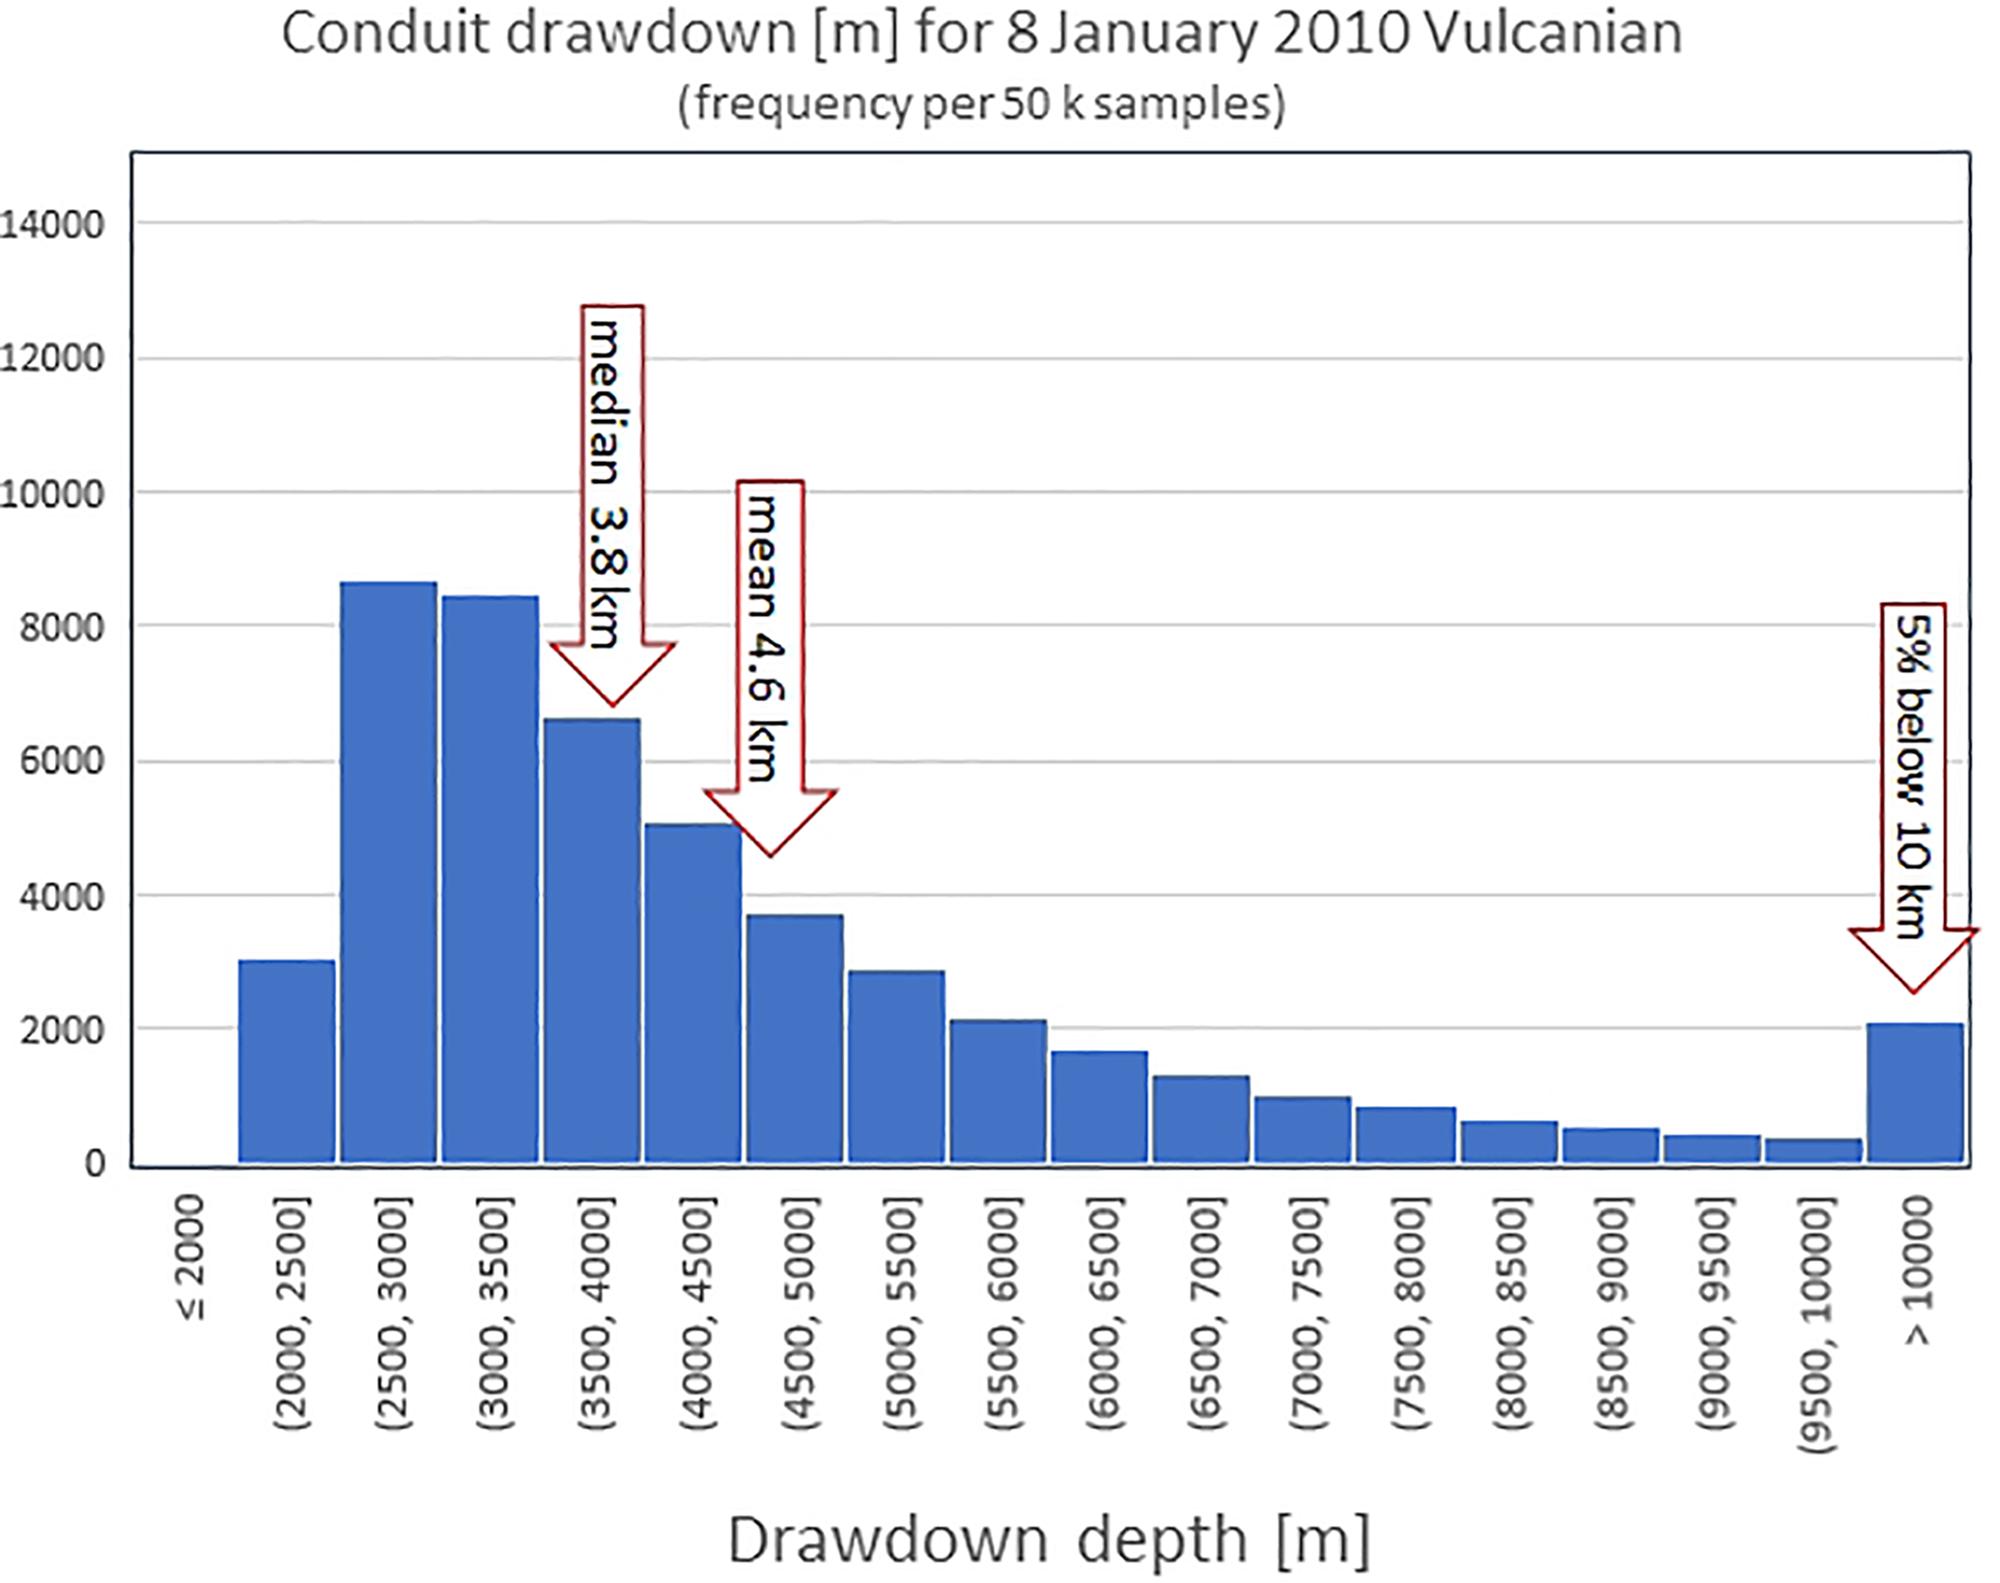
Figure 5. The largest Montserrat explosion: January 8, 2010. Uncertainty distribution for drawdown depth (a total of 50,000 Monte Carlo samples are distributed into the depth ranges shown on the x-axis). The top of the upper reservoir is assumed at an approximate depth of 5 km (following Thomas et al., 2018).
A noteworthy feature of this plot is that the drawdown distribution is very long-tailed, and certainly not normally distributed about its mean. This skewness is also evident for other scenario drawdowns, with implications for reliable low-probability hazard assessment; citing only mean and standard deviation values may be ambiguous or even misleading.
It can be remarked that there were four more, much smaller, Vulcanian explosions in the succeeding 34 days after January 8, 2010 (Cole et al., 2014; Table 5.1), at which time significant surface eruptive activity ceased at the Soufrière Hills Volcano with a major dome collapse (Wadge et al., 2014).
Sensitivity Analysis
One of the very powerful capabilities of the UNINET software package is the ease with which probabilistic computations can be performed with conditioning on single values or ranges of values for random variables in the net.
We illustrate this analytical feature for scenario 5, the January 8, 2010 explosion (Figure 6). Here, the main conduit radius r2 (4th row) is conditionalized to fall only within the range 10 – 20 m, with mean 16.4 m (the full uncertainty range for radius r2 in the BBN model is 5.7 – 25 m, with mean 18.3 m).
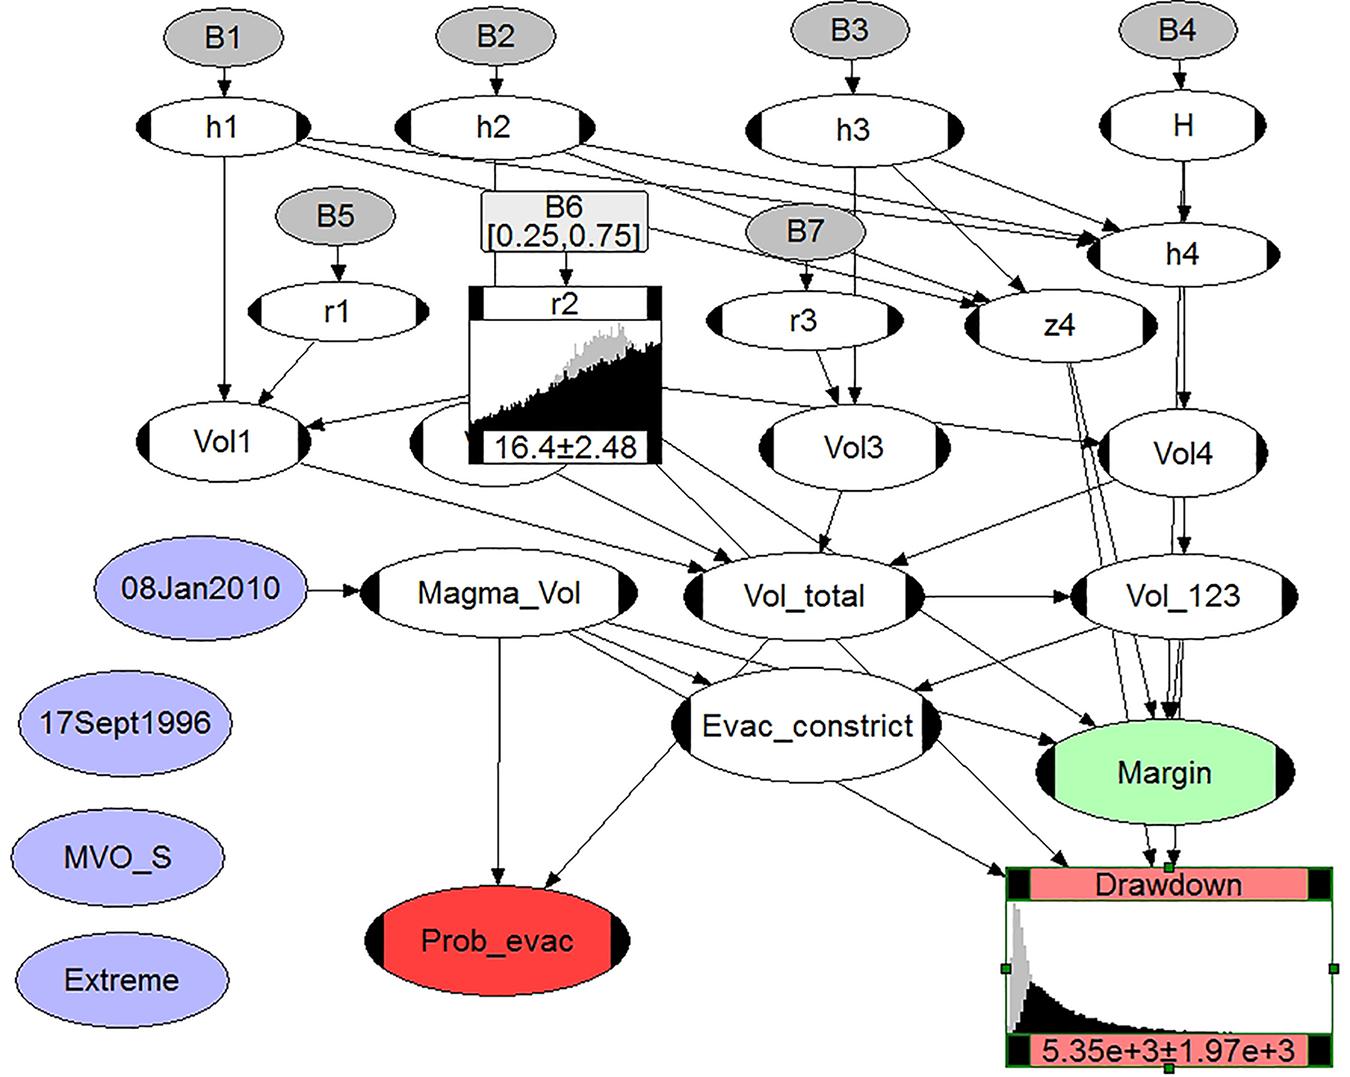
Figure 6. The January 8, 2010 explosion BBN with conduit radius r2 conditionalized to a range of values in the center of its uncertainty spread and resulting revised distribution for Drawdown node. Prior distributions are shown as light gray histograms (see text).
The Drawdown node is displayed as the resulting conditional distribution, indicating a mean drawdown of 5.4 ± 2.0 km would obtain for this limited range of conduit radius values; the non-conditionalized model drawdown result (Table 1) is 4.6 ± 2.5 km. This sensitivity test is illuminating: restricting conduit radius sampling to values that lie in the middle 50% interval of the relevant range, where there is substantial distributional support, produces an increased mean estimate of drawdown, albeit with reduced standard deviation. In this case, there is a small decrease in the mean of the modeled radius, due to the conditionalization, so some increase in drawdown might be expected.
This said, however, actual numerical impacts on the results for multiple BBN nodes – produced by conditionalizing variables in this way – are not easily anticipated. We can conclude from this simple single example that, given any complicated multivariate uncertainty model, it will be difficult to predict dependably which factors control hazard level estimates, and to what extent different factors influence scenario probability estimates.
Undertaking a range of such sensitivity tests can be crucial for understanding which factors shape tail properties and hence extreme eruptive behavior, in particular.
Scenario PDC Footprint Mapping
To map PDC footprints for our scenario events we use an experimental PDC flow simulator, MOLASSES (MOLASSES is open-source, freely available from GitHub2), a program under development by C. Connor and L. Connor (pers. comm.).
MOLASSES uses a cellular automata framework to investigate the topographic dependence of runout of pyroclastic density currents from an explosive eruption. The cellular automata (CA) concept is one modeling framework that can be adopted for investigation of surface flows, such as lava flows and rock avalanches (Connor et al., 2012; Kubanek et al., 2015; Gallant et al., 2018). However, it has not previously been applied, as far as is known, to highly mobile pyroclastic density currents. (Other, alternative approaches to PDC modeling exist: see Ogburn and Calder (2017) for a detailed review of several accepted empirical, statistical or physical computer codes; where computational speed is critical, the emulation approach of Spiller et al. (2014) could be helpful in the present context).
A grid of cells is created, corresponding to the geographical extent of the simulation. Topography is described using a digital elevation model (DEM), with one value of elevation for each grid cell. The flow is added to the DEM at a source cell, representing the volcanic vent. This volume of material is then distributed to neighboring cells, using a rule set which depends on the flow volume in each cell, the direction of flow, and the local topographic slope (defined as the difference in elevation between adjacent grid cells, weighted by their separation; diagonal cells receive less weight). Active grid cells receive mass from “parent” cells, but do not pass mass back, only onward to adjacent cells (this is more fully explained in Connor et al., 2018).
In the present application, the main parameters specified are the total flow volume and the flow residual thickness. The flow thicknesses and volumes used in the model (and reported in Figures 7A–D) represent the total thickness and volume of the moving flow for a given simulation, which includes pyroclasts, lithic fragments, volcanic gas, entrained air, and accidental material swept up into the flow as it moves across the surface. Because a large proportion of the volume of the moving flow is gas and entrained air, the values of thickness and volume used in the simulations are much greater than the thickness and volume as mapped after the flow comes to rest and forms a deposit: the measured deposit volume and thickness will be only a fraction of the flow volume and thickness. As such, the ultimate deposit thicknesses and volumes do not figure in the estimation of total area inundated in the MOLASSES model.
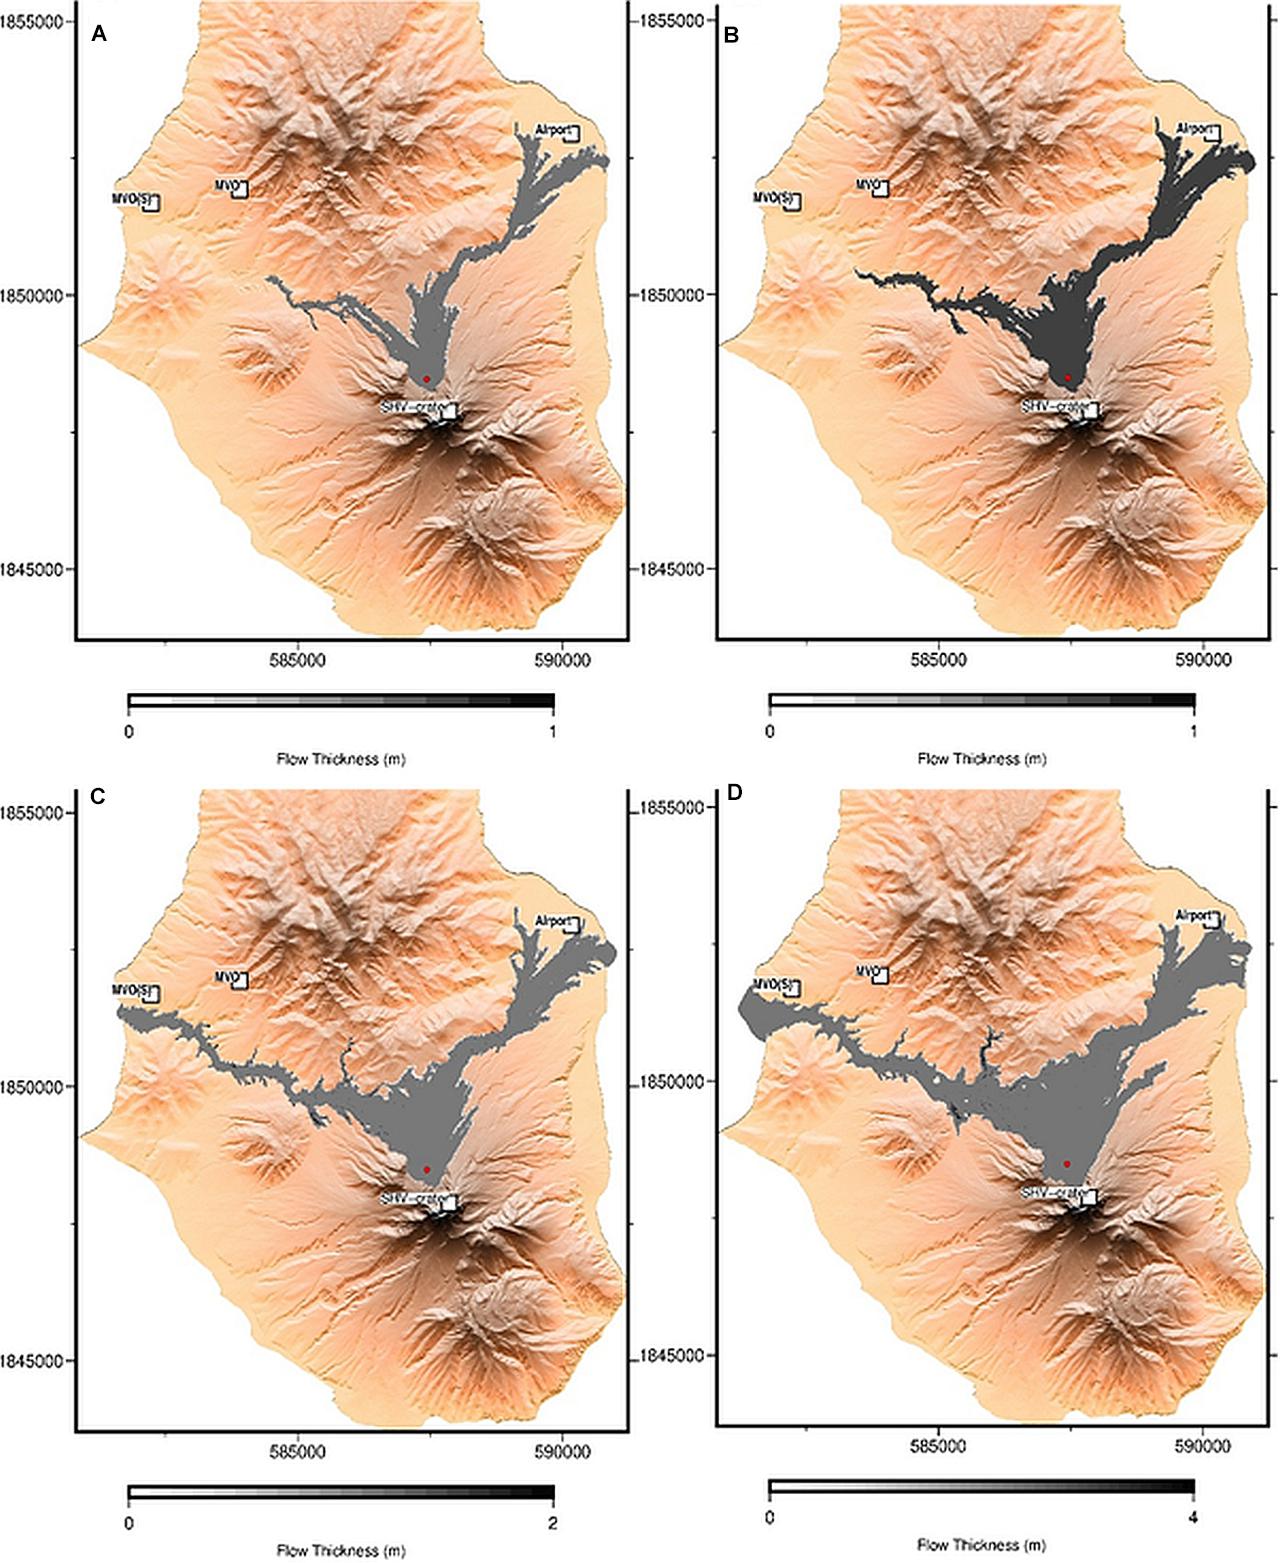
Figure 7. MOLASSES simulations of Soufriere Hills Volcano PDC flow footprints for explosion scenarios: (A) scenario 3: largest 1997 Vulcanian explosion; (B) scenario 5: January 8, 2010 explosion; (C) scenario 6: counterfactual event just reaching MVO[S]; and (D) scenario 7: hypothetical extreme explosion (see Table 1). Scenarios 3 and 5 can be compared to actual deposits and runout extents, for instance: Panel (B) footprint emulates the mapped deposits reported by Cole et al. (2014); see Figure 1D; in panel (C), a flow volume that just reaches MVO[S] was determined by trial and error. Average flow thicknesses vary in each scenario, from 0 to 1.0 m in (A); 0.6 to 1.0 m in (B); 1.0 to 2.0 m in (C); and 2.0 to 4.0 m in scenario (D). The respective flow areas are: (A) 3.7 km2; (B) 5.0 km2; (C) 7.2 km2; (D) 9.7 km2.
In MOLASSES, the flow mass is, in effect, released instantaneously at the source position and “flows” to attain a relatively uniform footprint thickness, on average, over the area mapped inundated, without fully reflecting the marginal effects of local topographic slopes. The vent is taken to be a point source and is constrained to a single pixel; thus, more extended sources cannot be modeled with the present version of the program. With this limitation, the positioning of the vent is critical and has been chosen here to reflect the approximate position of the vent which was active on the northern part of the dome at the time of the 1997 Vulcanians explosions (crater topography changed subsequently due to further dome building and wastage activity). As a consequence, not all the flows – which spread to the south-west and east of the volcano from individual explosions – are mapped by MOLASSES using the restriction on vent configuration.
For speed of execution and tolerable spatial accuracy, we base our mapping runs on a pre-1997, 10 m DEM for Montserrat, which reflected most closely the crater topography at the time; while a new DEM with 3 m resolution over the volcano has been created by Stinton (2015), the latter maps a crater topography that had become much changed by subsequent activity, after 1997. The 3 m DEM due to Stinton is an appealing option; however, the corresponding small pixel size has critical impact on the vent location relative to local topography and on the simulated flow trajectory; the finer mesh also incurs greatly increased computing times and, currently, creates some issues with the MOLASSES cellular automata flow rule set that require further development.
Here we show four representative scenario flow footprint maps, as Figure 7. Respective flow thickness ranges and flow areas for these four scenarios are reported in the figure caption.
Each of these mapped flow footprints shows the spatial dispersal of the main, denser part of the PDC; they do not depict the forward or lateral spread of any associated surge clouds. In respect of our counterfactual bigger flows down the Belham Valley, toward MVO[S] (e.g., Figures 7C,D and Table 1 Scenarios 6, 7), the valley sides would likely confine and channel the main flow; however, accompanying surges would be almost certain to reach the building where MVO[S] was situated in 1997. Such an eventuality would have carried critical implications in terms of risk to observatory personnel (see section, above, describing the situation regarding MVO[S] at the time of the Vulcanians of 1997). We discuss putative risk issues associated with this counterfactual scenario in the next section.
While the MOLASSES emulator is not the most sophisticated code for predicting pyroclastic flow runouts, it has the virtues of being simple to implement and fast to run and, as such, lends itself nicely to rapid scenario testing and indicative counterfactual analysis.
MVO[S] Evacuation Cost-Benefit Analysis
In late June 1997, as mentioned earlier, one of the hazard possibilities being considered by volcanologists at the Montserrat Volcano Observatory location at MVO[S] was of an explosive eruption that might tap into the magma reservoir and produce a much larger explosion or explosions. At the time, there seemed to be very limited scientific constraints, if any, on such a scenario.
Concern over the possibility of a sudden runaway explosion led to the Montserrat Volcano Observatory (MVO[S]) being evacuated for a few hours on 30 June 1997. It is instructive to assess this decision using a simple cost-benefit analysis framework (Marzocchi and Woo, 2007; Woo, 2014).
In the (hypothetical) event of such a runaway explosion, it is possible that a member of the MVO staff might have become a casualty. A special duty of care is owed to people in employment. Based on United States. economic studies of hazardous occupations, the willingness to pay to avoid a workplace fatality is about $4 million with an extra $1 million where there is lingering morbidity from injuries (Gentry and Viscusi, 2016).
Take, for example, one of the counterfactual scenarios depicted in Figures 7C,D and assume a small 1% chance that such a runaway explosion might catch a member of staff in post at MVO[S], unable to escape in time. If they were killed, or injured with serious morbidity, the expected monetized loss would be estimated at about 1% of $5 million or $50,000. Allowing for the GDP per capita factor, this equates to about eight person-months of staff down-time. On June 30, 1997, about eight MVO personnel were evacuated, so even if the period of evacuation from MVO[S] had extended for several weeks, this would have been warranted by the exposure of that number of people due to the risk of a rapid, runaway explosion – especially at night.
Indeed, as a direct consequence of escalating explosive activity, a few weeks later, in September 1997, a decision was taken (by others) to re-locate MVO operations to Mongo Hill, in the north of Montserrat (Aspinall et al., 2002).
As an alternative to this type of cost-benefit analysis, Deligne et al. (2018) circumvent the challenges of using value-of-life metrics with their life-safety risk decision-support tool. Their approach provides a quantitative procedure for assessing the occupational risk of a New Zealand volcanologist becoming a fatality when undertaking fieldwork at times of volcanic unrest, relative to other occupational exposures. For a wider discussion of volcanic risk assessment concepts, see also Aspinall and Blong (2015).
Conclusions
Once an eruption has occurred during a volcanic crisis, the prospect of a sudden runaway explosion scenario with little warning is a worrying contingency for volcano decision-makers responsible for public and staff safety. If there is no historical precedent for such a scenario, there may be little precursory evidence to assist making an evacuation decision and vindicate a costly unfulfilled alarm.
For hazard managers, it is imperative they are alerted by volcanologists to the possibility of different eruption scenarios. As happened more than once on Montserrat, “You didn’t tell us so-and-so might happen” was an accusation leveled by officials at volcanologists providing scientific advice. With the benefit of hindsight (e.g., at an inquest), failure by scientists to have advised the nature, possible scale and implications of any conceivable eruption scenario might be deemed a very damning omission post hoc, perhaps tantamount to professional negligence.
Gauging the likelihood of such a catastrophic scenario may be made easier and more transparent if a benchmark comparison is made with runaway explosion counterfactual risk estimates established from past volcanic crises. Near-misses from the past are a potentially valuable yet often neglected resource in augmenting the sparse historical event catalog and enhancing scientific intuition about volcanic behavior. In the absence of counterfactual analysis, near-misses will, in time, diminish as part of collective volcanological experience; a future realization – as an actual event of an apparently unprecedented scenario – may come as a Black Swan surprise to future generations of volcanologists.
An example of this type of analysis has been provided for the Montserrat Vulcanian explosion activity of 1997. The results of the BBN analysis, discussed in “Numerical Model for Counterfactual Scenarios,” indicates that – for the largest Vulcanian in 1997 – there was a small but nevertheless noteworthy chance of about 6% (Table 1 Scenario 3) that a fragmentation wave might have reached down into the top of the upper magma chamber and perhaps triggered a runaway, reservoir-fed explosion. This finding affirms that there was a sufficient risk to warrant the temporary evacuation of non-essential staff from the MVO[S] building.
The task of estimating the chance of a massive eruption is notoriously difficult. Counterfactual risk analysis provides a retrospective laboratory for helping to support this task. The amount of information about individual historical volcanic crises will vary. For some crises at other volcanoes, sufficient amount of information should be available to allow such counterfactual thought experiments to be carried out. And, in an unrest situation with potential for explosions, pyroclastic flow runout scenarios can be charted to a first order approximation using a fast flow simulator, such as MOLASSES. Documenting the outcomes of these experiments, and the related circumstances which give rise to acute volcanological anxiety, will fill a gap in the scientific communication of volcano risk. This gap is currently only partly bridged by an oral tradition of specific past episodes and experiences in volcanology that may be unfamiliar to other or younger volcanologists.
Data Availability
The datasets generated for this study are available on request to the corresponding author.
Author Contributions
GW took the lead on the counterfactual analysis conceptualization and cost-benefit analysis. WA was lead author on Montserrat volcanology and modeling the drawdown, and flow mapping aspects. Both authors contributed jointly to this study and to the drafting of the text.
Funding
WA was supported in part by his position in the School of Earth Sciences, University of Bristol, Bristol, United Kingdom.
Conflict of Interest Statement
WA was a self-employed consultant, holding a part-time position at the University of Bristol. GW was employed by RMS.
Acknowledgments
We thank the reviewers for insightful and constructive comments, and the editor for kindly steering this contribution through review. We also thank Steve Sparks and Kathy Cashman for volcanological advice, and Chuck Connor and Laura Connor for their support with MOLASSES. We are grateful to Adam Stinton for assistance with DEM mapping, Dan Ababei and Roger Cooke for technical help with UNINET, and to Rod Stewart for providing access to MVO in-house science meeting notes. We also thank Jenni Barclay for drawing to our attention the Perret quote used in the abstract.
Supplementary Material
The Supplementary Material for this article can be found online at: https://www.frontiersin.org/articles/10.3389/feart.2019.00222/full#supplementary-material
Footnotes
- ^ Extracts from informal notes of in-house Montserrat Volcano Observatory science meetings following dome collapse on June 25, 1997 (statements unattributed): 08:00 local June 26, 1997 – “Violent explosive activity imminent?” 12 noon local June 27, 1997 – “Moving toward explosion? Recent samples of 27 May had very greenish hornblendes – came up fast from depth. Only other green hornblendes are in previous Plinian eruption deposits. Vertical explosions without warning?” June 29, 1997 – “Need a fall-back position with protection from explosion. Hot suits – surge protection;” June 30, 1997 – “[What is] Probability of surge hitting MVO [?]. No major flows down Belham Valley without Plinian column collapse in present mode of activity. …Demarcate an area of safety from “rogue” surge? …. Relocate EOC/MVO, or plan to do so?” (Reproduced with permission of the Director, MVO).
- ^ http://gscommunitycodes.usf.edu/gs/public/molasses/pdc.php (accessed August 22, 2019).
References
Ababei, D. (2016). UNINET. Software designed by the Risk and Environmental Modeling Group, Delft University of Technology. Developed by D. Ababei, Lighttwist Software. Available at www.lighttwist.net/wp/uninet (accessed March 17, 2016).
Ale, B., Bellamy, L. J., Cooke, R., Duyvis, M., Kurowicka, D., Lin, P. H., et al. (2008). Causal Model for Air Transport Safety: Final Report. Rotterdam: Ministerie van Verkeer en Waterstaat.
Aspinall, W. P., and Woo, G. (2014). Santorini unrest 2011–2012: an immediate Bayesian belief network analysis of eruption scenario probabilities for urgent decision support under uncertainty. J. Appl. Volcanol. 3:12. doi: 10.1186/s13617-014-0012-8
Aspinall, W. P., Loughlin, S. C., Michael, F. V., Miller, A. D., Norton, G. E., Rowley, K. C., et al. (2002). “The Montserrat Volcano observatory; its evolution, organization, role and activities,” in The eruption of Soufriere Hills Volcano, Montserrat from 1995 to 1999, eds T. H. Druitt and B. P. Kokelaar (London: Geological Society)
Aspinall, W., and Blong, R. (2015). “Volcanic Risk Management,” in The Encyclopedia of Volcanoes, Second Edn, eds H. Sigurdsson, B. Houghton, S. McNutt, H. Rymer, and J. Stix (Cambridge, MA: Academic Press), 1215–1234.
Carn, S. A., Pallister, J. S., Lara, L., Ewert, J. W., Watt, S., Prata, A. J., et al. (2009). The unexpected awakening of Chaitén volcano, Chile. Eos Trans. Am. Geophys. Union 90, 205–206. doi: 10.1029/2009EO240001
Cashman, K. V., Sparks, R. S. J., and Blundy, J. D. (2017). Vertically extensive and unstable magmatic systems: a unified view of igneous processes. Science 355:eaag3055. doi: 10.1126/science.aag3055
Castruccio, A., Clavero, J., Segura, A., Samaniego, P., Roche, O., Droguett, B., et al. (2016). Eruptive parameters and dynamics of the April 2015 sub-Plinian eruptions of Calbuco volcano (southern Chile). Bull. Volcanol. 78:62. doi: 10.1007/s00445-016-1058-8
Clarke, A. B., Neri, A., Voight, B., Macedonio, G., and Druitt, T. H. (2002). “Computational modelling of the transient dynamics of the August 1997 Vulcanian explosions at Soufrière Hills Volcano, Montserrat: influence of initial conduit conditions on near-vent pyroclastic dispersal,” in The Eruption of Soufrière Hills Volcano, Montserrat, from 1995 to 1999, eds T. H. Druitt and B. P. Kokelaar (London: Geological Society).
Cole, P. D., Smith, P. J., Stinton, A. J., Odbert, H. M., Bernstein, M. L., Komorowski, J. C., et al. (2014). “Vulcanian explosions at Soufrière Hills Volcano, Montserrat between 2008 and 2010,” in The Eruption of Soufrière Hills Volcano, Montserrat from 2000 to 2010, eds G. Wadge, R. E. A. Robertson, and B. Voight (London: Geological Society). doi: 10.1144/M39.5
Connor, C. B., Connor, L. J., Richardson, J. A., Gallant, E., and Miller, D. (2018). “Using MOLASSES, a Lava Flow Simulation Code, to Interpret the Morphology of Volcanoes: Example of Olympus Mons (Mars),” in Proceedings of the 49th Lunar And Planetary Science Conference 2018, (Woodlands, Tx)
Connor, C. B., Sparks, R. S. J., Mason, R. M., Bonadonna, C., and Young, S. R. (2003). Exploring links between physical and probabilistic models of volcanic eruptions: the Soufrière Hills Volcano, Montserrat. Geophys. Res. Lett. 30:1701. doi: 10.1029/2003GL017384
Connor, L. J., Connor, C. B., Meliksetian, K., and Savov, I. (2012). Probabilistic approach to modeling lava flow inundation: a lava flow hazard assessment for a nuclear facility in Armenia. J. Appl. Volcanol. 1:3.
Deligne, N. I., Jolly, G. E., Taig, T., and Webb, T. H. (2018). Evaluating life-safety risk for fieldwork on active volcanoes: the volcano life risk estimator (VoLREst), a volcano observatory’s decision-support tool. J. Appl. Volcanol. 7:7. doi: 10.1186/s13617-018-0076-y
Druitt, T. H., Calder, E. S., Cole, P. D., Hoblitt, R. P., Loughlin, S. C., Norton, G. E., et al. (2002). “Episodes of cyclic vulcanian explosive activity with fountain collapse at Soufrière Hills Volcano, Montserrat,” in The Eruption of Soufrière Hills Volcano, Montserrat, from 1995 to 1999, eds T. H. Druitt and B. P. Kokelaar (London: Geological Society).
Formenti, Y., Druitt, T. H., and Kelfoun, K. (2003). Characterisation of the 1997 Vulcanian explosions of Soufrière Hills Volcano, Montserrat, by video analysis. Bull. Volcanol. 65, 587–605. doi: 10.1007/s00445-003-0288-8
Gallant, E., Richardson, J., Connor, C., Wetmore, P., and Connor, L. (2018). A new approach to probabilistic lava flow hazard assessments, applied to the Idaho National Laboratory, eastern Snake River Plain, Idaho, USA. Geology 46, 895–898. doi: 10.1130/g45123.1
Gentry, E. P., and Viscusi, W. K. (2016). The mortality and morbidity components of the value of a statistical life. J. Health Econ. 46, 90–99. doi: 10.1016/j.jhealeco.2016.01.011
Jackson, M. D., Blundy, J., and Sparks, R. S. J. (2018). Chemical differentiation, cold storage and remobilization of magma in the Earth’s crust. Nature 564, 405–409. doi: 10.1038/s41586-018-0746-2
Jutzeler, M., Manga, M., White, J. D. L., Talling, P. J., Proussevitch, A., Le Friant, A., et al. (2017). Submarine deposits from pumiceous pyroclastic density currents traveling over water: an outstanding example from offshore Montserrat (IODP 340). Geol. Soc. Am. Bull. 129, 392–414. doi: 10.1130/B31448.1
Kruschke, J. K. (2015). Doing Bayesian Data Analysis: a Tutorial with R, BUGS and Stan, 2nd Edn. Cambridge, MA: Academic Press/Elsevier.
Kubanek, J., Richardson, J. A., Charbonnier, S. J., and Connor, L. J. (2015). Lava flow mapping and volume calculations for the 2012–2013 Tolbachik, Kamchatka, fissure eruption using bistatic TanDEM-X InSAR. Bull. Volcanol. 77:106.
Le Friant, A., Ishizuka, O., Boudon, G., Palmer, M., Talling, P., Villemant, B., et al. (2015). Submarine record of volcanic island construction and collapse in the lesser antilles arc: first scientific drilling of submarine volcanic island landslides by IODP Expedition 340. Geochem. Geophys. Geosyst. 16, 420–442. doi: 10.1002/2014GC005652
Le Friant, A., Lock, E. J., Hart, M. B., Boudon, G., Sparks, R. S. J., Leng, M. J., et al. (2008). Late Pleistocene tephrochronology of marine sediments adjacent to Montserrat, lesser antilles volcanic arc. J. Geol. Soc. Lond. 165, 279–289. doi: 10.1144/0016-76492007-019
Marzocchi, W., and Woo, G. (2007). Probabilistic eruption forecasting and the call for evacuation. Geophys. Res. Lett. 34, 1–4.
Mason, R. M., Starostin, A. B., Melnik, O. E., and Sparks, R. S. J. (2006). From Vulcanian explosions to sustained explosive eruptions: The role of diffusive mass transfer in conduit flow dynamics. J. Volcanol. Geothermal Res. 153, 148–165. doi: 10.1016/j.jvolgeores.2005.08.011
Melnik, O. E., and Sparks, R. S. J. (2002). “Modelling of conduit flow dynamic during explosive activity at Soufrière Hills Volcano, Montserrat,” in The Eruption of Soufrière Hills Volcano, Montserrat, From 1995 to 1999, eds T. H. Druitt and B. P. Kokelaar (London: Geological Society)
Melnik, O., and Sparks, R. S. J. (1999). Nonlinear dynamics of lava dome extrusion. Nature 402, 37–41. doi: 10.1038/46950
Ogburn, S. E., and Calder, E. S. (2017). The relative effectiveness of empirical and physical models for simulating the dense undercurrent of pyroclastic flows under different emplacement conditions. Front. Earth Sci. 5:83. doi: 10.3389/feart.2017.00083
Robertson, R., Cole, P., Sparks, R. S. J., Harford, C., Lejeune, A. M., McGuire, W. J., et al. (1998). The explosive eruption of Soufrière Hills Volcano, Montserrat, West Indies, September 17, 1996. Geophys. Res. Lett. 25, 3429–3432. doi: 10.1029/98GL01442
Satake, K., and Atwater, B. (2007). Long-term perspectives on giant earthquakes and tsunamis at subduction zones. Ann. Rev. Earth Planet. Sci. Ann. Rev. 35:351. doi: 10.1146/annurev.earth.35.031306.140302
Smith, A. L., Roobol, M. J., Schellekens, J. H., and Mattioli, G. S. (2007). Pre-historic stratigraphy of the Soufrière Hills – South Soufrière Hills volcanic complex, Montserrat, West Indies. J. Geol. 115, 115–127. doi: 10.1086/509271
Spiegelhalter, D. J., Dawid, A. P., Lauritzen, S. L., and Cowell, R. G. (1993). Bayesian analysis in expert systems. Stat. Sci. 8, 219–247. doi: 10.1214/ss/1177010888
Spiller, E. T., Bayarri, M. J., Berger, J. O., Calder, E., Patra, A. K., Pitman, E. B., et al. (2014). Automating Emulator Construction for Geophysical Hazard Maps. SIAM/ASA J. Uncertain. Quantif. 2, 126–152. doi: 10.1137/120899285
Stinton, A. J. (2015). A new Digital Elevation Model of the Soufrière Hills Volcano, Montserrat. Open File Report OFR 15-01. Montserrat: Montserrat Volcano Observatory.
Thompson, V., Dunstone, N. J., Scaife, A. A., Smith, D. M., Slingo, J. M., Brown, S., et al. (2017). High risk of unprecedented UK rainfall in the current climate. Nat. Commun. 8, 107. doi: 10.1038/s41467-017-00275-3
Wadge, G., Voight, B., Sparks, R. S. J., Cole, P. D., Loughlin, S. C., and Robertson, R. E. A. (2014). “An overview of the eruption of Soufrière Hills Volcano, Montserrat from 2000 to 2010,” in The Eruption of Soufrière Hills Volcano, Montserrat from 2000 to 2010, eds G. Wadge, R. E. A. Robertson, and B. Voight (London: Geological Society), doi: 10.1144/M39.5
Woo, G. (2014). “Cost-benefit analysis in volcano risk,” In Volcanic hazards, risks and disasters, eds J. F. Shroder and P. Papale (Amsterdam, NL: Elsevier). doi: 10.1515/jbca-2012-0006
Woo, G. (2018a). “Counterfactual analysis for tracking Black Swans,” in Proceedings of the AOGS-EGU Joint Conference: New Dimensions for Natural Hazards in Asia, (Tagaytay, PH).
Woo, G. (2018b). Counterfactual disaster risk analysis. Var. J. Casual. Actuar. Soc. 10, 279–291. doi: 10.1016/S2542-5196(18)30209-2
Woo, G. (2018c). Stochastic modeling of past volcanic crises. Front. Earth Sci. 6:1. doi: 10.3389/feart.2018.00001
Keywords: counterfactual analysis, runaway eruption, Vulcanian explosion, pyroclastic flow, hazard assessment, risk
Citation: Aspinall W and Woo G (2019) Counterfactual Analysis of Runaway Volcanic Explosions. Front. Earth Sci. 7:222. doi: 10.3389/feart.2019.00222
Received: 02 April 2019; Accepted: 14 August 2019;
Published: 30 August 2019.
Edited by:
Christina Robyn Magill, Macquarie University, AustraliaReviewed by:
Christina Widiwijayanti, Earth Observatory of Singapore, SingaporeMark Bebbington, Massey University, New Zealand
Copyright © 2019 Aspinall and Woo. This is an open-access article distributed under the terms of the Creative Commons Attribution License (CC BY). The use, distribution or reproduction in other forums is permitted, provided the original author(s) and the copyright owner(s) are credited and that the original publication in this journal is cited, in accordance with accepted academic practice. No use, distribution or reproduction is permitted which does not comply with these terms.
*Correspondence: Willy Aspinall, willy.aspinall@bristol.ac.uk