Time Variation in the Chemical and Isotopic Composition of Fumarolic Gasses at Kusatsu-Shirane Volcano, Japan
 Takeshi Ohba1*
  Muga Yaguchi2
  Kana Nishino1
  Nozomi Numanami1
  Urumu Tsunogai3
  Masanori Ito3
  Ryo Shingubara3
- 1Department of Chemistry, School of Science, Tokai University, Hiratsuka, Japan
- 2Meteorological Research Institute, Tsukuba, Japan
- 3Graduate School of Environmental Studies, Nagoya University, Nagoya, Japan
Minor seismicity may occur at volcanoes with hydrothermal system before a steam eruption. To forecast any steam eruption, it is indispensable to detect and understand the nature of this shallow seismicity. As the fumarolic gas resides in the hydrothermal system, it may provide insights for elucidating the nature of any seismicity and thus forecast steam eruptions. At Kusatsu-Shirane volcano Japan, intense seismic activity took place in 2014 and 2018. To investigate the relationship between the seismicity and gas chemistry, five fumarolic gas discharges have been repeatedly analyzed. Since July 2014 to November 2017 a monotonic decrease in CO2/H2O, He/H2O and N2/H2O ratios was recorded in the fumarolic gasses located north of the summit of volcano, suggesting the decline of the magmatic component. On the contrary the CH4/H2O ratio significantly increased during the seismically quiet period, indicating that reduced conditions developed in the hydrothermal system, favoring the formation of CH4. The high N2/He ratio in the quiet period indicates the addition of N2, likely deriving from the crustal rocks hosting hydrothermal reservoir. The N2/He ratio in 2018 was significantly lower than those recorded in 2014, indicating the evolution of magma with the progress of degassing. The δD(H2O) and δ18O(H2O) values and the CO2/H2O ratios of fumarolic gas discharges were modeled with the following processes: generation of vapor phase after the mixing between magmatic gas and a cold groundwater with meteoric origin, addition of vapor phase with meteoric origin, and partial condensation of water vapor near surface. Only a single magmatic gas is necessary for the above modeling. These data suggest that at Kusatsu-Shirane volcano the activation of seismicity was synchronized with the increase of the magmatic component in the fumarolic gas. It is postulated that the injection of magmatic gas increased the fluid pressure in the reservoir, which triggered seismicity. The injection would have been triggered by a break of the sealing zone surrounding the degassing magma. The injection of magmatic gas can be detected by monitoring the composition of the fumarolic gas, thus giving the possibility to forecast any future seismicity.
Introduction
Minor seismicity episodically occurs at volcanoes with hydrothermal system. Such seismicity could be the precursor to a steam-driven explosive eruption (hereafter “Steam eruption”). The steam eruption is generally small in scale (Barberi et al., 1992), and difficult to forecast, due to the scarcity of precursors. Therefore, to forecast steam eruptions, it is indispensable to determine the cause of the seismicity occurring in the hydrothermal system. The fumarolic gas observed at volcanoes resides in the hydrothermal reservoir. Therefore, it may be useful for elucidating the occurrence and the nature of shallow seismicity.
Mt. Kusatsu-Shirane is an active volcano developed on the “volcanic front” (Sugimura, 1960) on Honshu Island, Japan and the summit consists of several pyroclastic cones and craters (Figure 1). One of the craters, Crater Yugama (Yg in Figure 1, the other acronyms used in the following text are listed in Table 1) has been filled with an acidic lake water. Mt. Kusatsu-Shirane has produced andesitic volcanic rocks with two age periods, which are hereafter termed the old and young eras. Eruptions of the old era terminated at 0.25 Ma (Kaneko et al., 1991). The recent active young era began approximately 14,000 years ago (Hayakawa and Yui, 1989). The pyroclastic cones occupying the summit area of Mt. Kusatsu-Shirane (Figure 1) formed 14,000 years ago. The lava flows extending from the summit area to the east slope of the volcano were developed 3,000 to 5,000 years ago (Hayakawa and Yui, 1989). The first historical eruption at Mt. Kusatsu-Shirane took place in 1882. Before the eruption, there was a long dormant period when the summit area was covered with groves (Ohashi, 1914), and fish lived in the lake within Crater Mizugama (Mi in Figure 1). The lake water within the Crater Yugama was acidic, although the temperature of the water was similar to ambient air temperature. From 1882 to the present day, Mt. Kusatsu-Shirane has undergone several active periods and intervening dormant periods. All of the historical eruptions were phreatic (Uto et al., 1983). Most of the historical eruptions occurred near Crater Yugama. Following the first historical eruption, several eruptions took place over the period 1897 to 1905, with an eruption in 1902 at Crater Yumiike (Ym in Figure 1). After an eruption in 1905 there was a dormant period lasting 20 years. The volcanic activity was maximized over the period 1925 to 1942. In 1932, Crater Yugama experienced the largest historical eruption, with 20 cm of volcanic ash deposition at 2 km east of Crater Yugama (Minakami et al., 1942). In 1976, a steam eruption took place within Crater Mizugama. One year prior to the eruption, an increase of the SO2/H2S ratio from the fumarolic gasses was observed (Ossaka et al., 1980). In 1982 and 1983, steam eruptions occurred at Crater Yugama (Ossaka et al., 1997). Lithics of 0.5–1 m in diameter were thrown over 500 m from the crater. Although the magnitude of the eruption was only 1 in the VEI scale (Global Volcanism Program, 2013), visitors would certainly have been at risks. Fortunately, the eruption occurred during winter when the access road was closed. In 1990, a large number of volcanic earthquakes occurred beneath Crater Yugama although no eruption took place. After the seismic activity started, the pH of lake water in Crater Yugama decreased, accompanying an increase of chloride concentration (Ohba et al., 1994, 2000). Ohba et al. (2008) estimated that the activity was caused by the break of sealing zone (Fournier, 1999) and subsequent “dry degassing” (Giggenbach, 1997). Based on the observation by Japan Meteorological Agency (JMA) two hypocenter clusters of volcanic seismicity have been recognized on the summit of volcano (Figure 1). One is a cluster beneath Crater Mizugama (Mi) and another cluster is located east of Ainomine peak (Ap). The hypocenters are distributed in the range of depth between sea level and the surface (up to 2000 m above sea level; Figure 1). In January 2018, a small steam eruption took place near Motoshirane peak (Er in Figure 1). This eruption occurred in an unexpected place far from Crater Yugama. In April 2018, a large number of volcanic earthquakes happened beneath Crater Mizugama (Mi) and the east side of Ainomine cone (Ap), although no eruption has yet occurred.
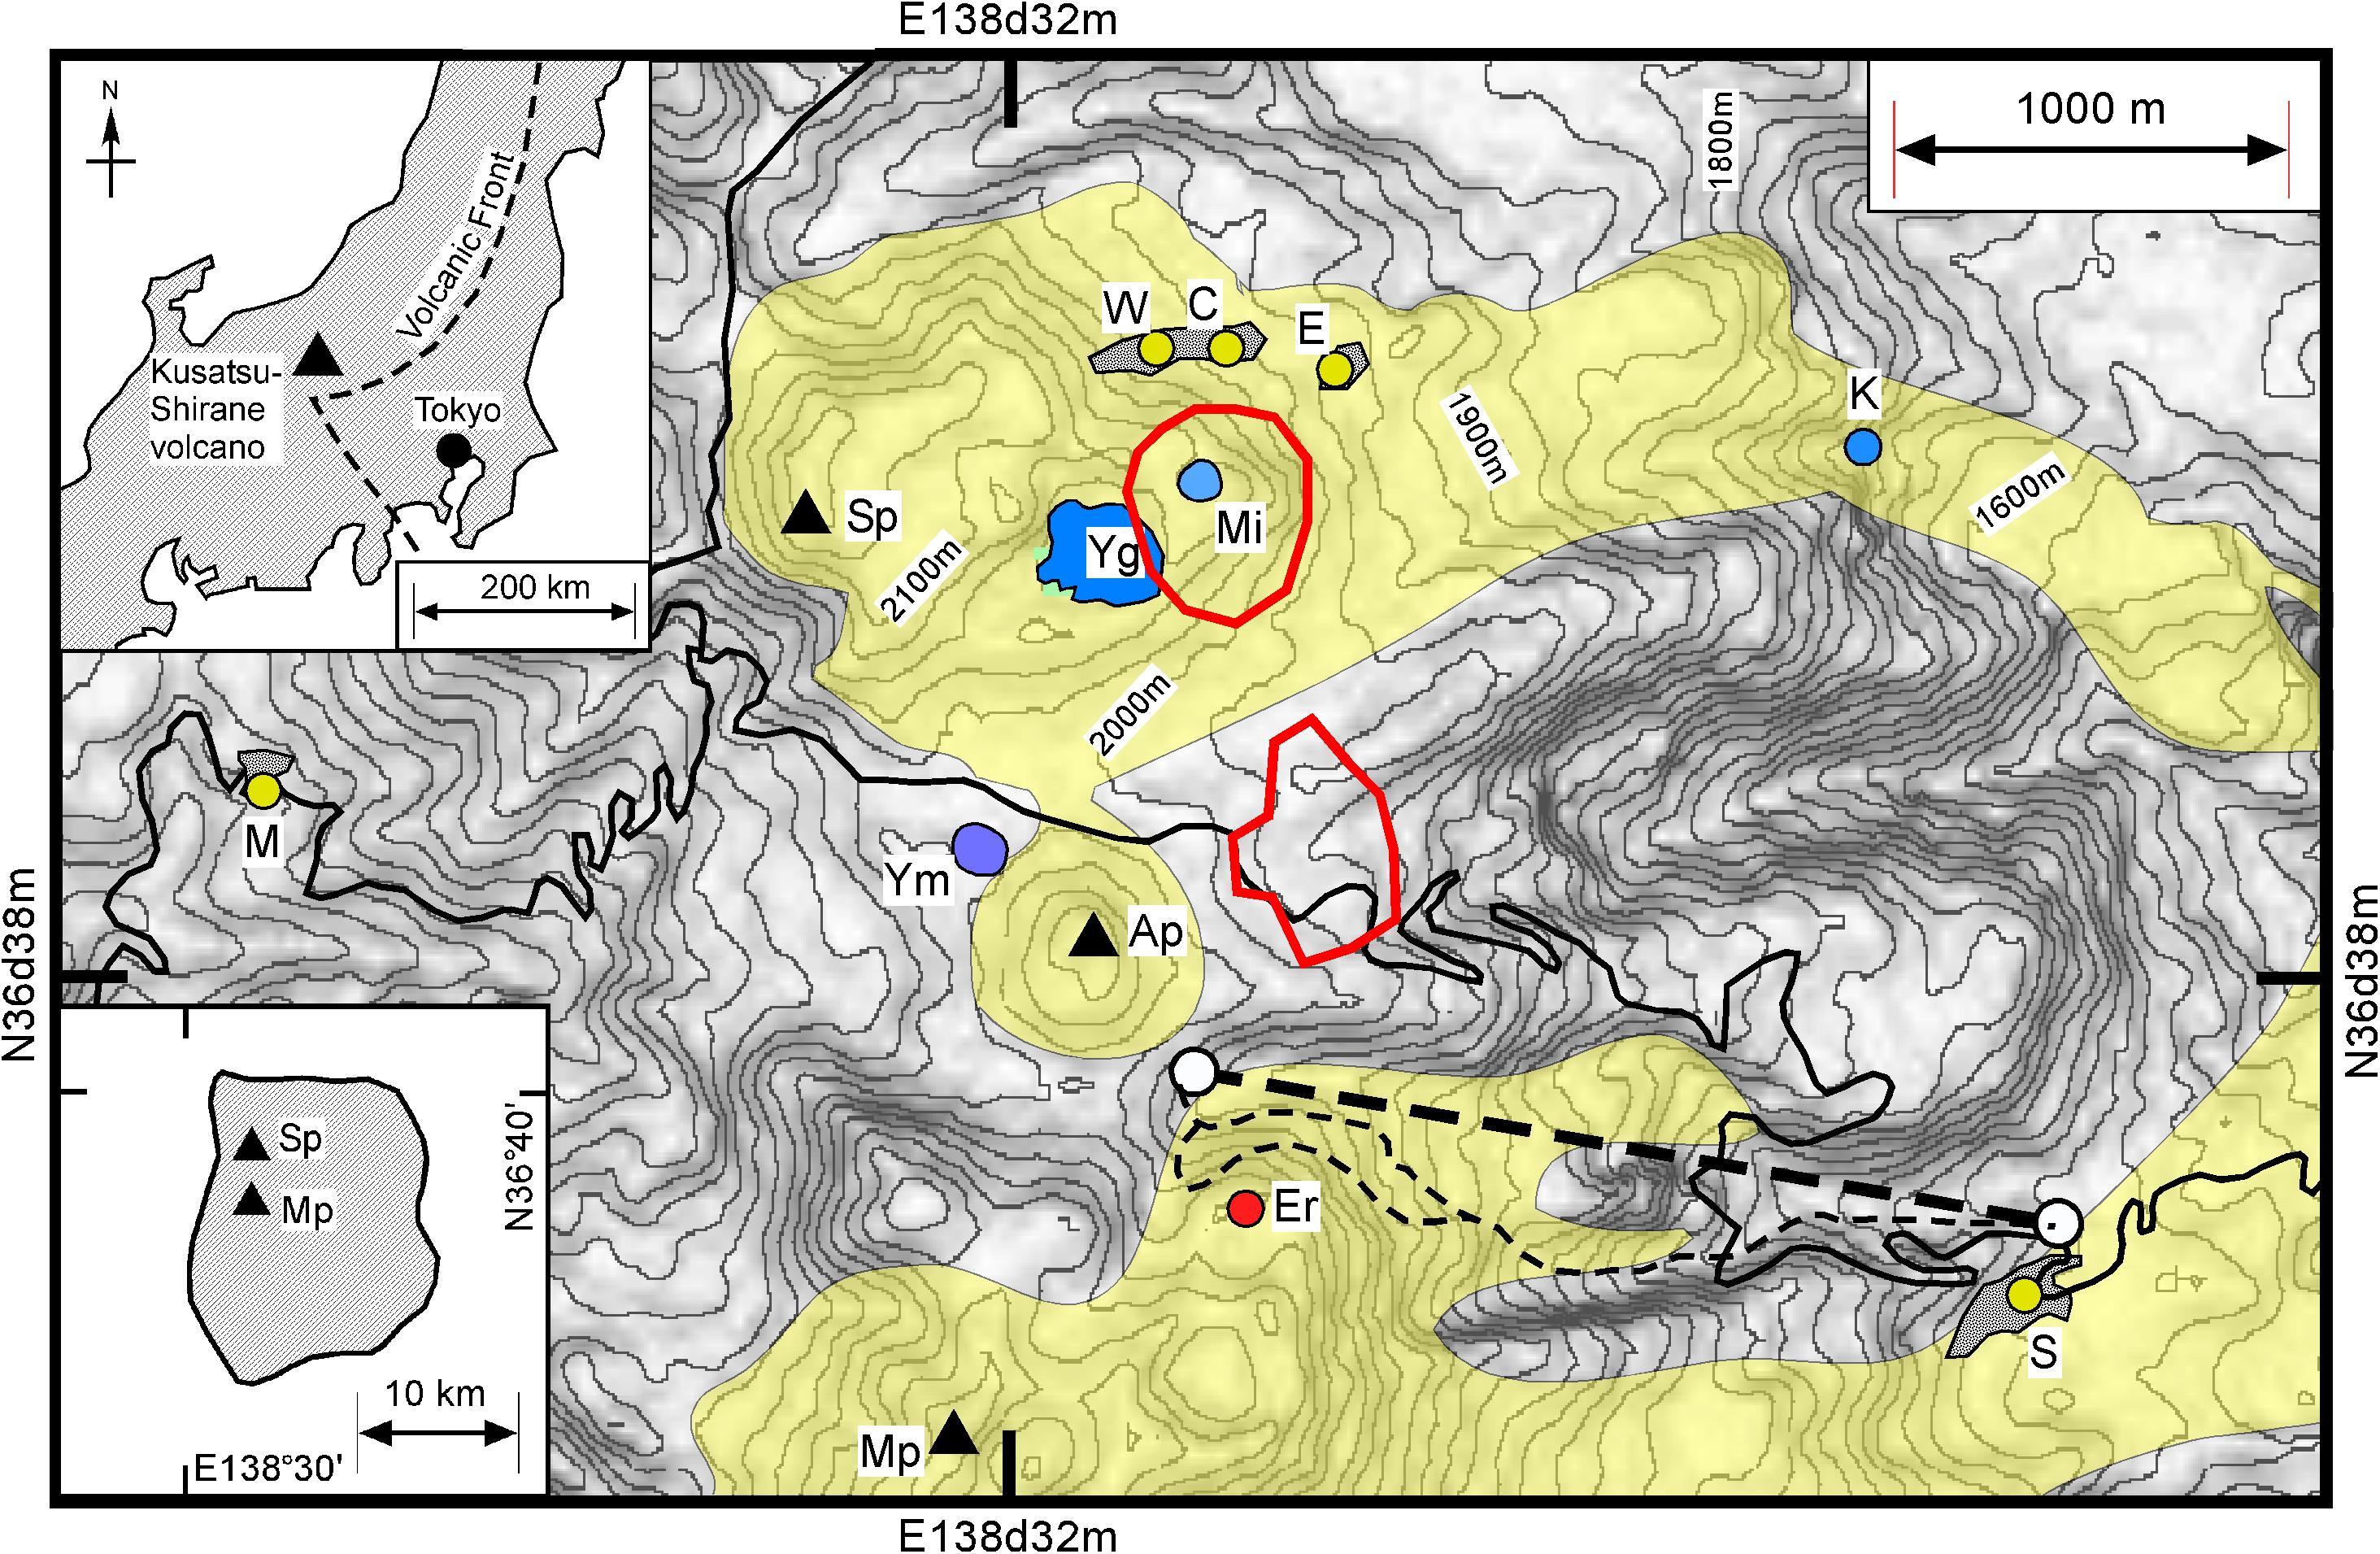
Figure 1. Location of fumarolic gasses, W, C, E, S and M. The shaded regions overlapping the fumaroles indicate the region with geotherm. Yugama (Yg), Mizugama (Mi) and Yumiike (Ym) are craters with lake water. Sirane (Sp), Ainomine (Ap) and Motoshirane (Mp) are pyroclastic cones. The inserted figure on the upper left corner shows the location of Kusatsu-Shirane volcano on Island of Honshu, Japan with the volcanic front (Sugimura, 1960). The inserted figure on the lower left shows the distribution of lava and pyroclastic deposits emitted from Kusatsu-Shirane volcano, which are younger than 1,4000 years (Uto et al., 1983). The yellowish areas indicate the lava and pyroclastic deposit younger than 7,000 years (Hayakawa and Yui, 1989). The hypocenters of volcanic earthquake are distributed within the two bold red circles (HP of Japan Meteorological Agency (JMA), https://www.data.jma.go.jp). The hypocenters of the volcanic earthquakes cluster at a depth between sea level and up to 2000 m above sea level. A small steam explosion occurred at Er in January 2018. K is the position of hot spring water which contains high concentration of Cl–. Ohba et al. (2000) suggested K represents the liquid phase of the hydrothermal system beneath Crater Yugama. The bold broken line shows the ropeway. Thin broken curves indicate the ski slopes. The altitude interval of the contour line is 20 m. The thin solid curve indicates the car road.
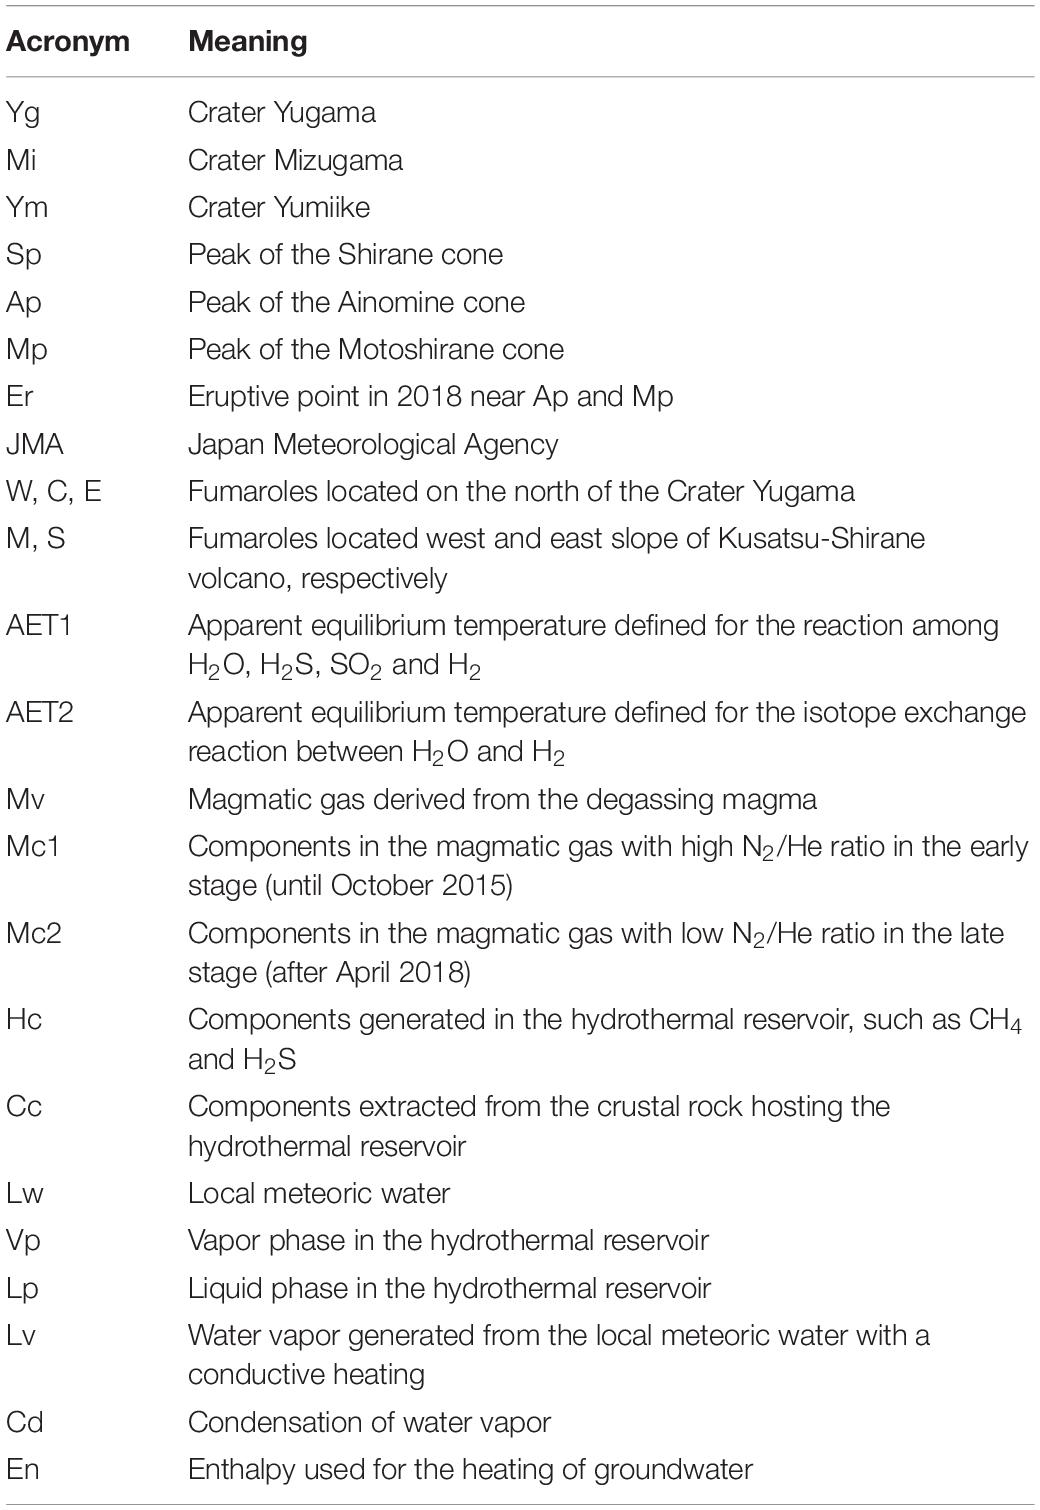
Table 1. Acronyms used in the text.
The unusual green–gray color of the lake water in Crater Yugama attracts sightseers who climb to a belvedere situated on the southern rim of the crater. The Crater Yugama is an important resource for the local economy. In order to reveal the relationship between the seismic activity and fumarolic gas composition, a periodical (2 or 3 times per year) sampling and analysis of five fumarolic gas discharges was carried out since July 2014 until August 2018. In this study we aim to investigate the processes affecting the magmatic-hydrothermal system beneath Crater Yugama on the basis of the chemical and isotopic composition of fumarolic gasses.
Materials and Methods
Fumarolic gasses had been sampled since July 2014 until August 2018, with a frequency of a few times per year at the points W, C and E (Figure 1). The total number of samples was 10, 10 and 9 for the points W, C and E, respectively. Additionally fumarolic gasses were sampled at the points S and M (Figure 1). The total number of samples was 8 and 3 for the points S and M, respectively. Gas sampling was carried out with a titanium pipe that was inserted into the fumarolic orifice. One end of the titanium pipe was connected to a rubber tube. The end of the rubber tube was connected to a 120 ml Pyrex glass bottle with air tight stop cock (Giggenbach, 1975), in which a 5 molar 20 ml KOH solution was put. The head-space of the gas bottle was evacuated prior sampling. Water and acidic gasses were absorbed by the KOH solution. In the headspace, the residual gasses (hereafter R-gas) such as N2, O2, Ar, He, H2 and CH4 were collected. Components absorbed in the KOH solution, such as H2O, CO2, H2S and SO2 were analyzed according to the method by Ozawa (1968). The ratio of SO2/H2S in the fumarolic gas was determined using a KI-KIO3 solution (Ozawa, 1968). The molar amount of R-gas was calculated by the gas state equation accounting the head space volume of bottle and the inner pressure in the head space at room temperature. Based on the molar amount of H2O, CO2, H2S, SO2 and R-gas, the relative concentration (%) of those components was calculated (Table 2).
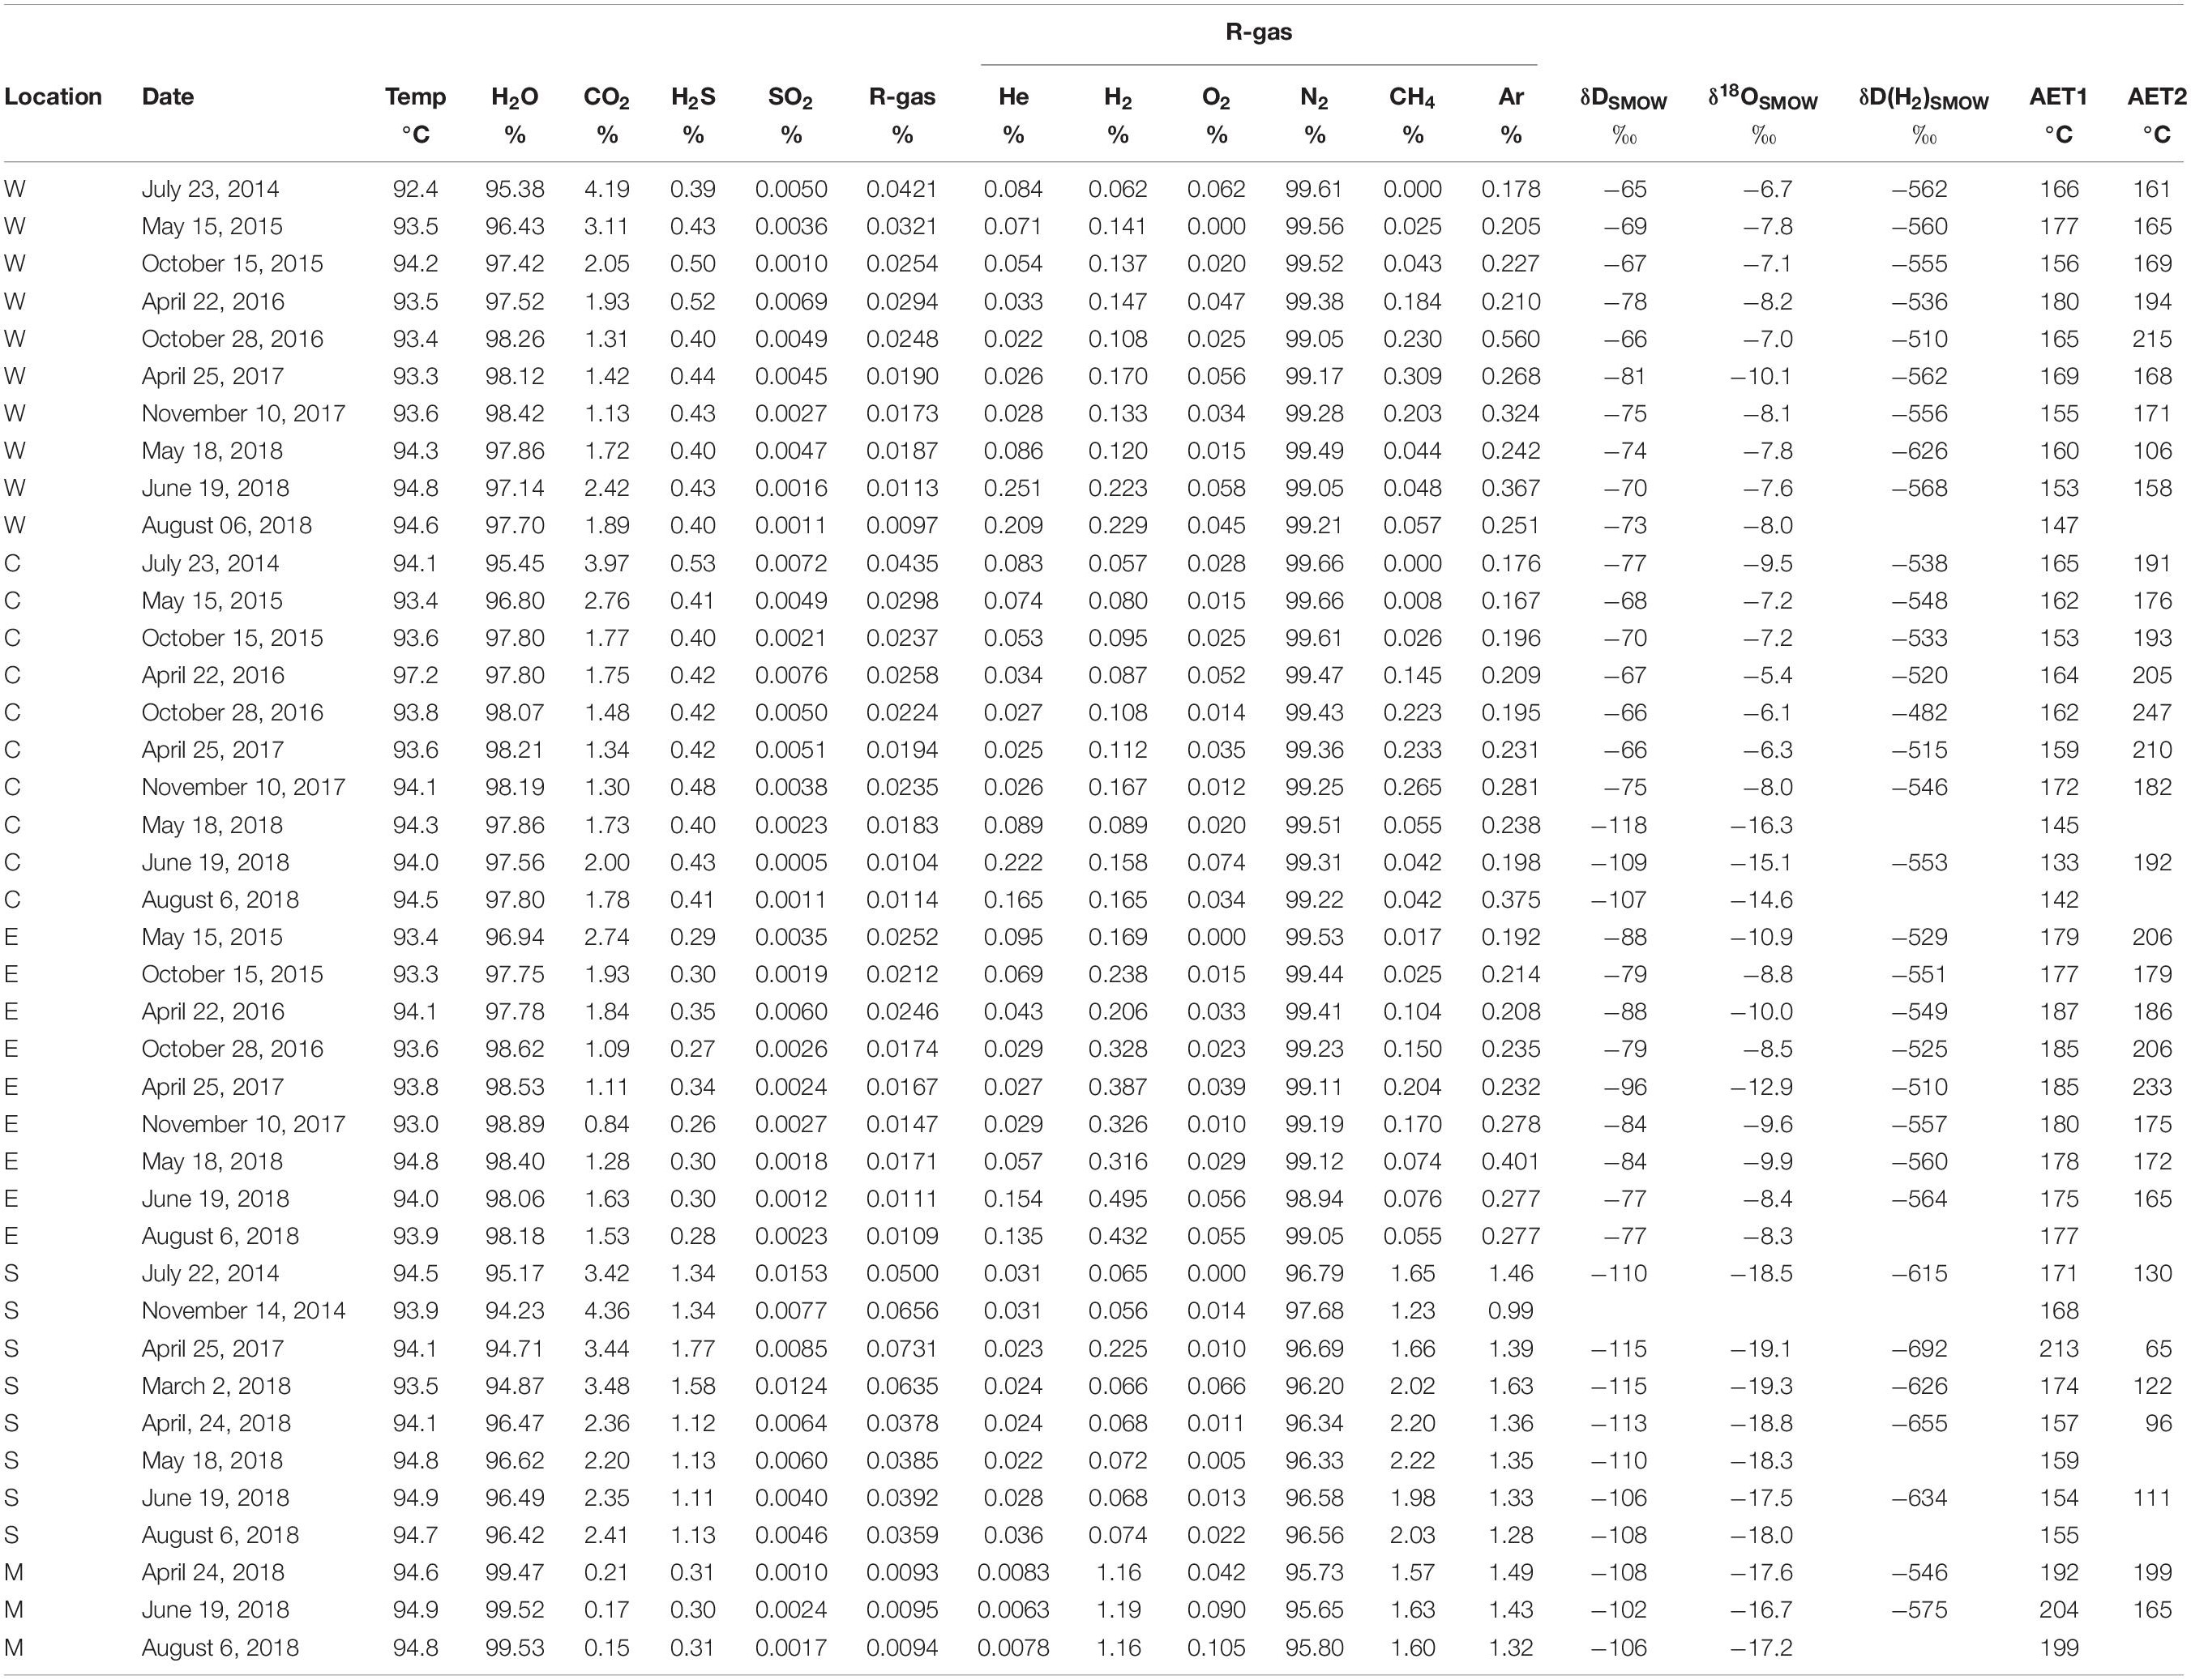
Table 2. Chemical and isotopic composition of fumarolic gasses with the apparent equilibrium temperatures.
The R-gas was analyzed using two different gas chromatographs with Ar and He as carrier gasses, hereafter GC-Ar and CG-He, respectively. The GC-Ar was used to determine the concentration of He, H2, O2, N2 and CH4. In the GC-Ar, a 6m-long MS5A packed column and a TCD detector were installed. The temperature of the column and detector was kept at 50 and 100°C, respectively. The flow rate of Ar carrier gas was 30 ml/min. In general, He in volcanic gas is difficult to be analyzed due to the overlap of H2 peaks if the amount of co-existing H2 is high. In this study, the He peak of 17ppm STP was separated from the H2 peak of 17% STP. All R-gas samples had a good separation between He and H2 peaks on the chart of GC-Ar. By using a GC-He, the relative concentrations of N2 and Ar were determined. In the GC-He a 6m-long Gaskuropack-54 column (GC Sciences Inc.) and a TCD detector were installed. The temperature of column and detector was kept at −70 and 50°C, respectively. With this condition, N2, O2 and Ar peaks in normal atmospheric air were separated. For all the R-gas samples a good separation among N2, O2 and Ar peaks was provided. The concentration of Ar in the R-gasses, XAr was calculated by,
where R indicates the concentration of Ar or N2 determined by GC-He. XN2 indicates the N2 concentration determined by GC-Ar. The concentration of components in the R-gasses was normalized, so that the sum of X for He, H2, O2, N2, CH4 and Ar was 100% (Table 2). For the determination of the H2O isotopic ratio, the fumarolic gas was cooled with a double tubes condenser made of Pyrex glass. The isotopic ratios of oxygen and hydrogen in the condensates were determined by an IR-laser cavity ring down analyzer (Picarro Inc., L2120-i). The isotopic ratio of the H2 in R-gasses was determined by a continuous flow system combined with a mass spectrometer (Thermo Fischer Scientific Delta V) (Tsunogai et al., 2011).
Results
The most abundant component in the fumarolic gasses was H2O, up to 93–95% (Table 2). The content of other species was expressed as the molar ratio to H2O in Figure 2. For the points W, C and E the CO2/H2O and He/H2O ratios show a similar time variation; namely, they monotonically decreased since July 2014 until November 2017 and then increased in May 2018. The CO2/H2O and He/H2O ratios of the point S were high in July 2014 until March 2018, and then dropped in April 2018 followed by an increase in He/H2O and slight increase in CO2/H2O. The CO2/H2O and He/H2O ratios of M were much lower than the values of other fumarolic gasses. The N2/H2O ratio of W, C and E slowly decreased since July 2014 until April 2017, followed by a stable period until May 2018 (Figure 2). After May 2018, the N2/H2O ratio of W, C and E declined together in June 2018. The N2/H2O ratio of S was high until March 2018, and then it dropped after April 2018. The H2S/H2O ratio of W, C and E had no monotonic increase or decrease through the period of this study (Figure 3A). The stable H2S/H2O ratio of S until March 2018 declined significantly in May 2018. A similar decrease can be found in the CH4/H2O ratio of S (Figure 3B). The CH4/H2O ratio of W, C and E show a noticeable feature; namely, they were not detected in July 2014 when the seismic activity was high. They significantly increased in April 2016 until November 2017, followed a quick drop in May 2018. The Ar/H2O ratio of S was almost higher than the ratios of W, E and C, except October 2016. The Ar/H2O ratio of M was high relative to the ratios of W, E and C (Figure 3C). The δD and δ18O of H2O in fumarolic gas (Figures 4A,B) were almost stable beside a drop of C after May 2018. The δD and δ18O of S were slightly increasing after April 2018. The δD(H2) in fumarolic gas (Figure 4C) of W, C, E was almost stable except the small rising in October 2016 and a drop of C in May 2018. The δD(H2) of S was lower than the δD(H2) of W, C, E over the whole period. The apparent equilibrium temperature (hereafter AET) was calculated assuming the equilibrium of the following reaction.
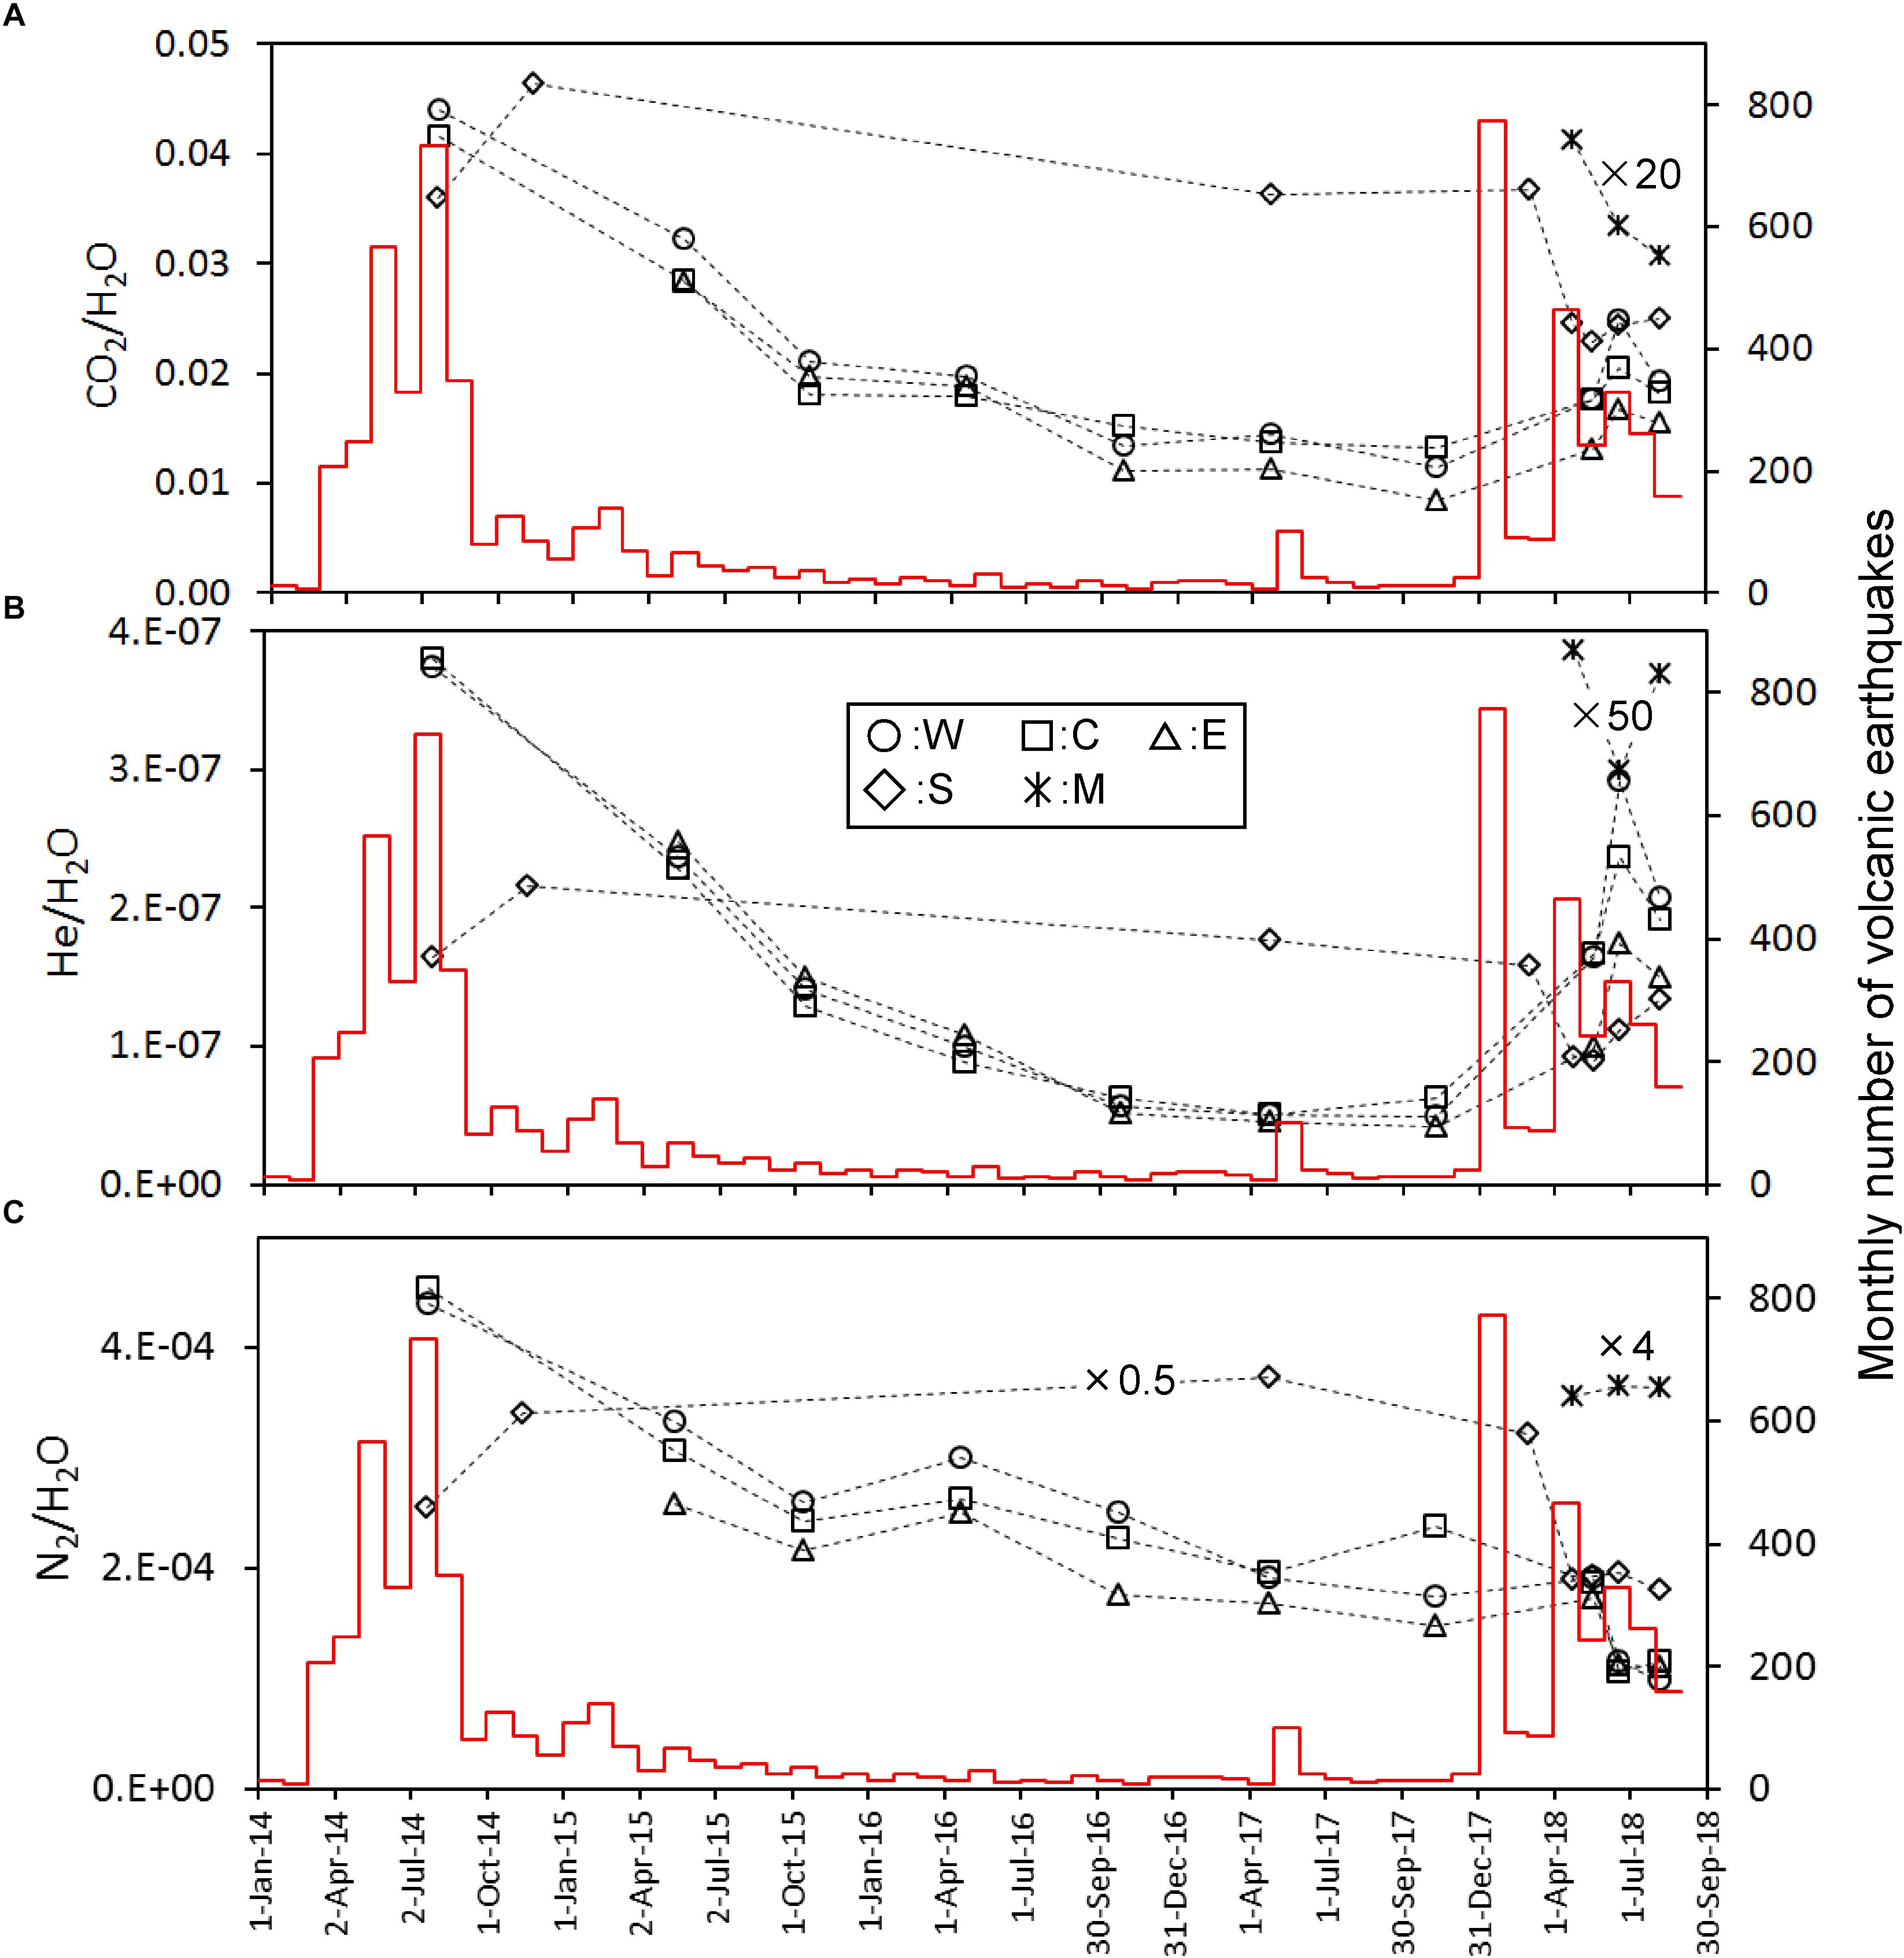
Figure 2. Time variation of CO2/H2O (A), He/H2O (B), and N2/H2O (C) molar ratios calibrated on the left y-axis. Some data were adjusted to the y-axis range by multiplying values indicated in figure. The red histogram calibrated on the right y-axis shows the monthly number of volcanic earthquakes observed by JMA.
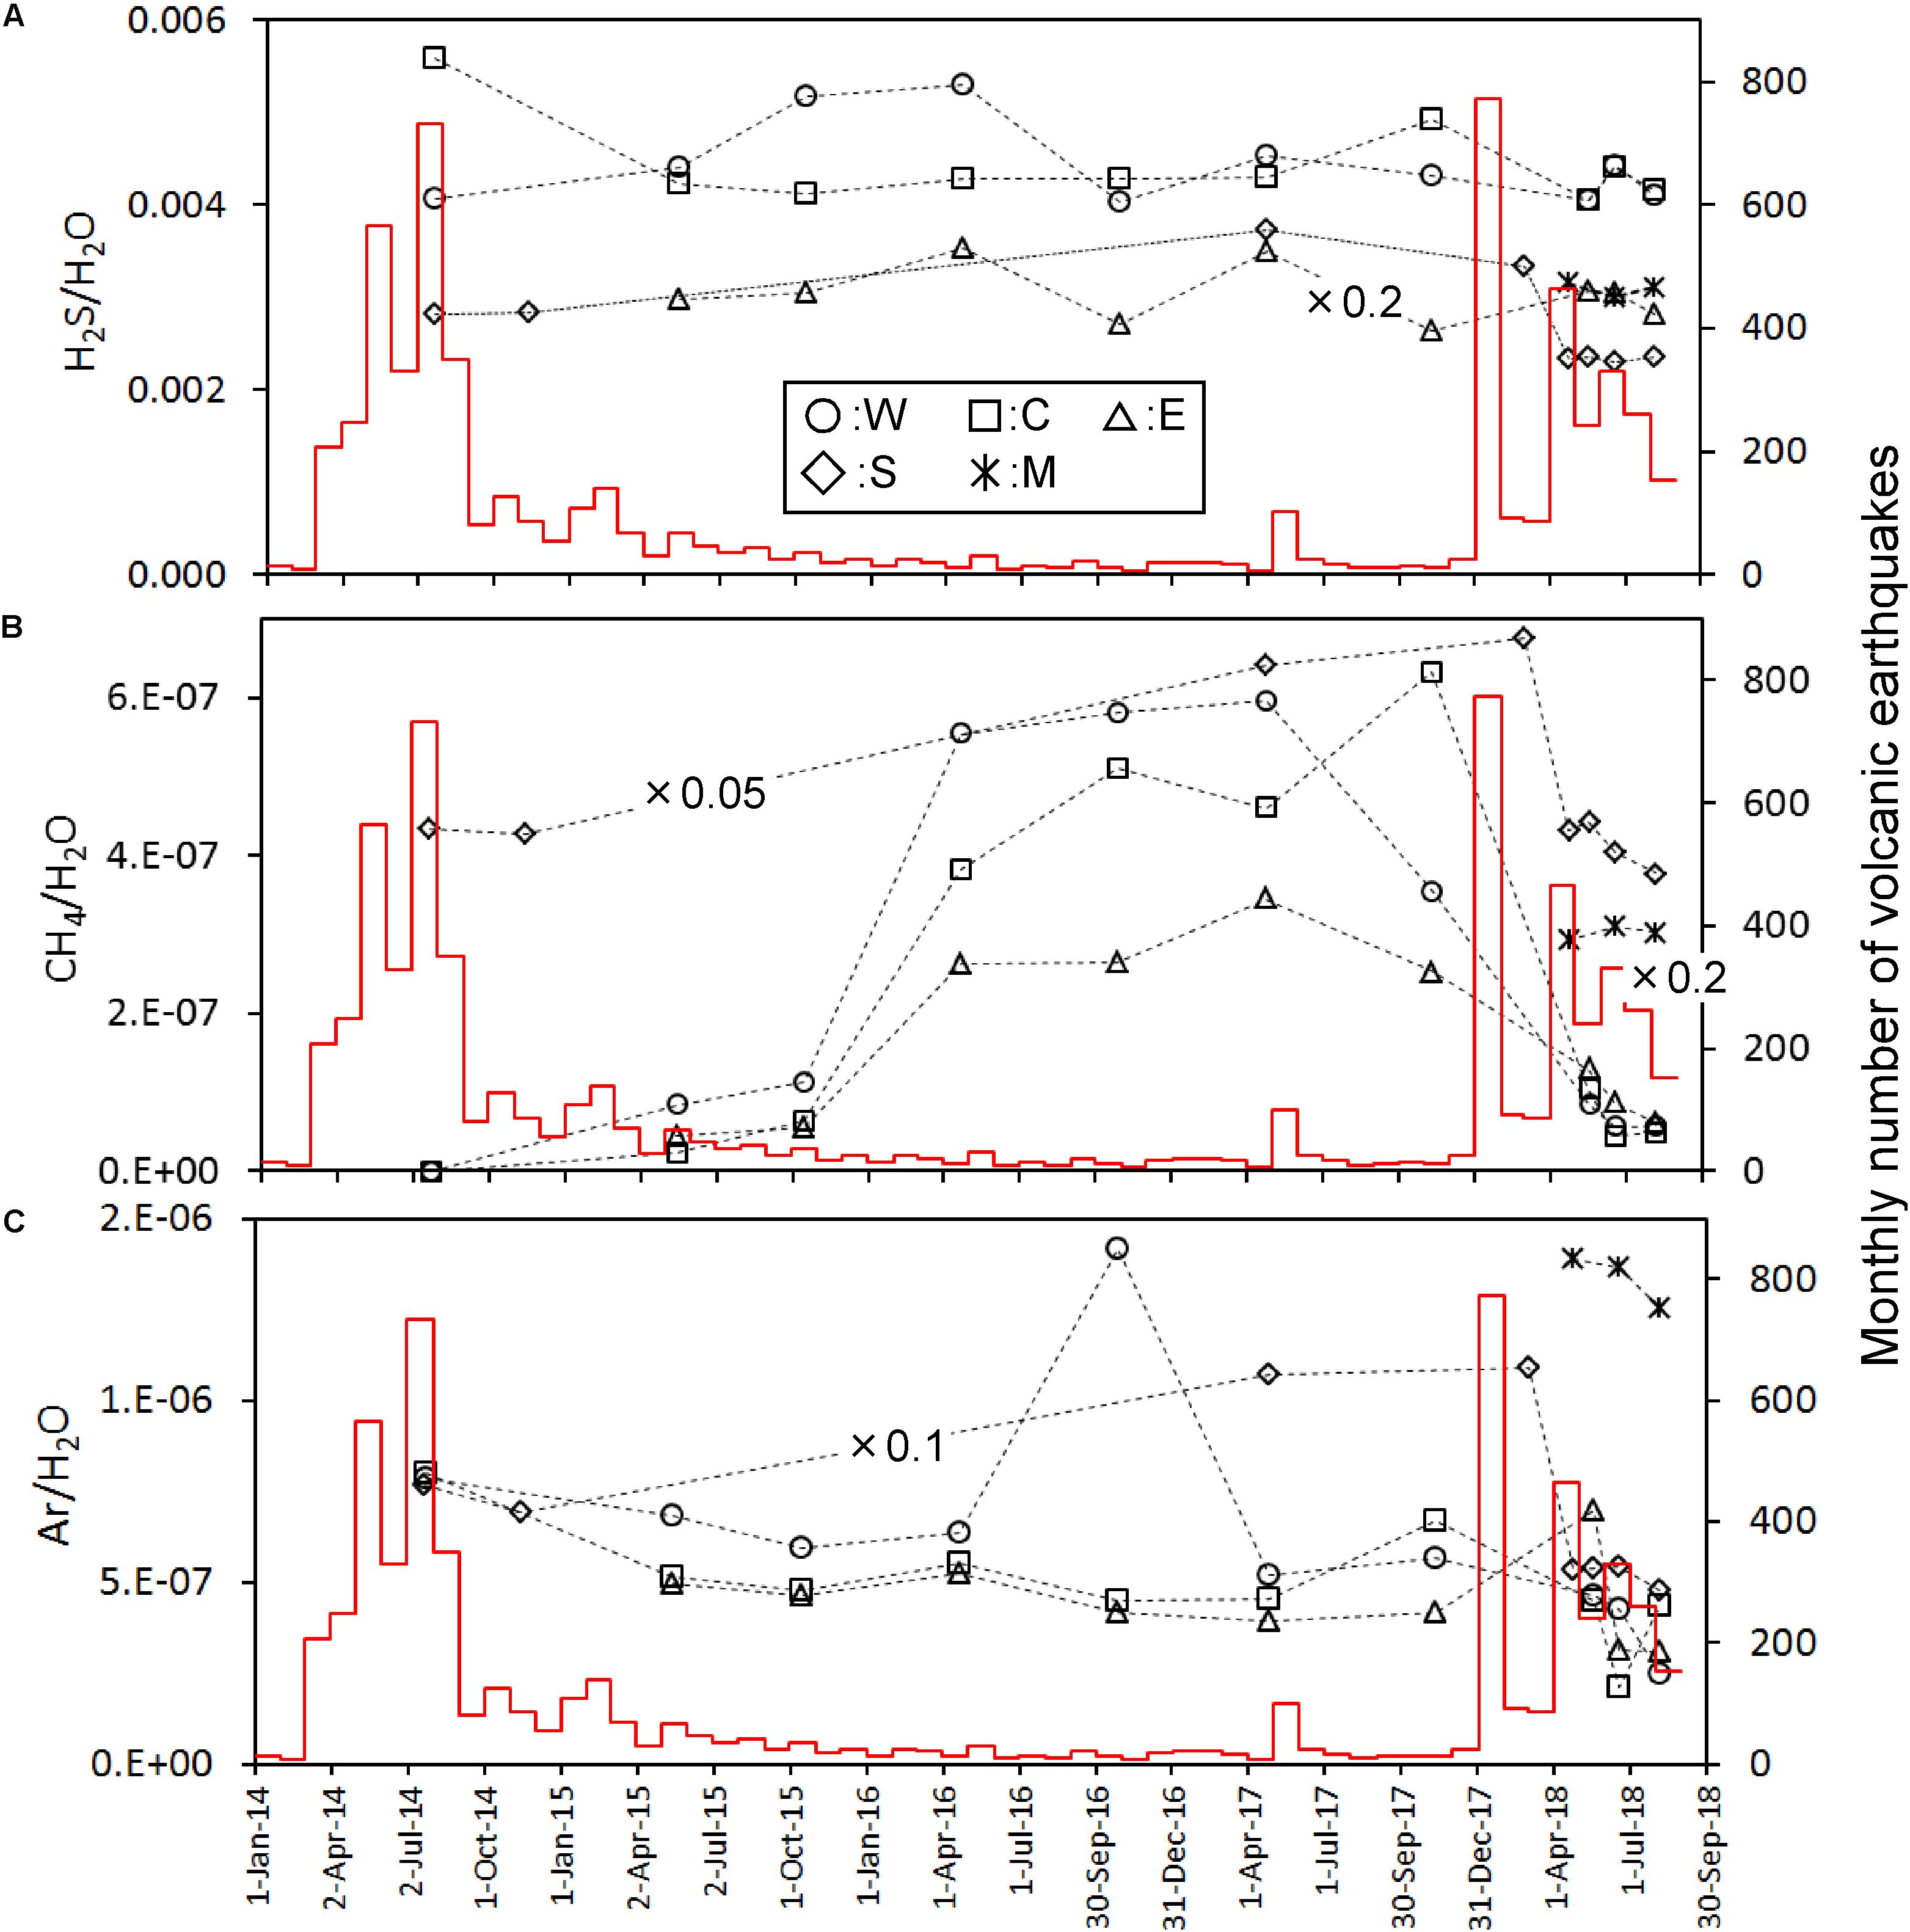
Figure 3. Time variation of H2S/H2O (A), CH4/H2O (B), and Ar/H2O (C) molar ratios calibrated on the left y-axis. Some data were adjusted to the y-axis range by multiplying values as indicated in figure. The red histogram calibrated on the right y-axis shows the monthly number of volcanic earthquakes observed by JMA.
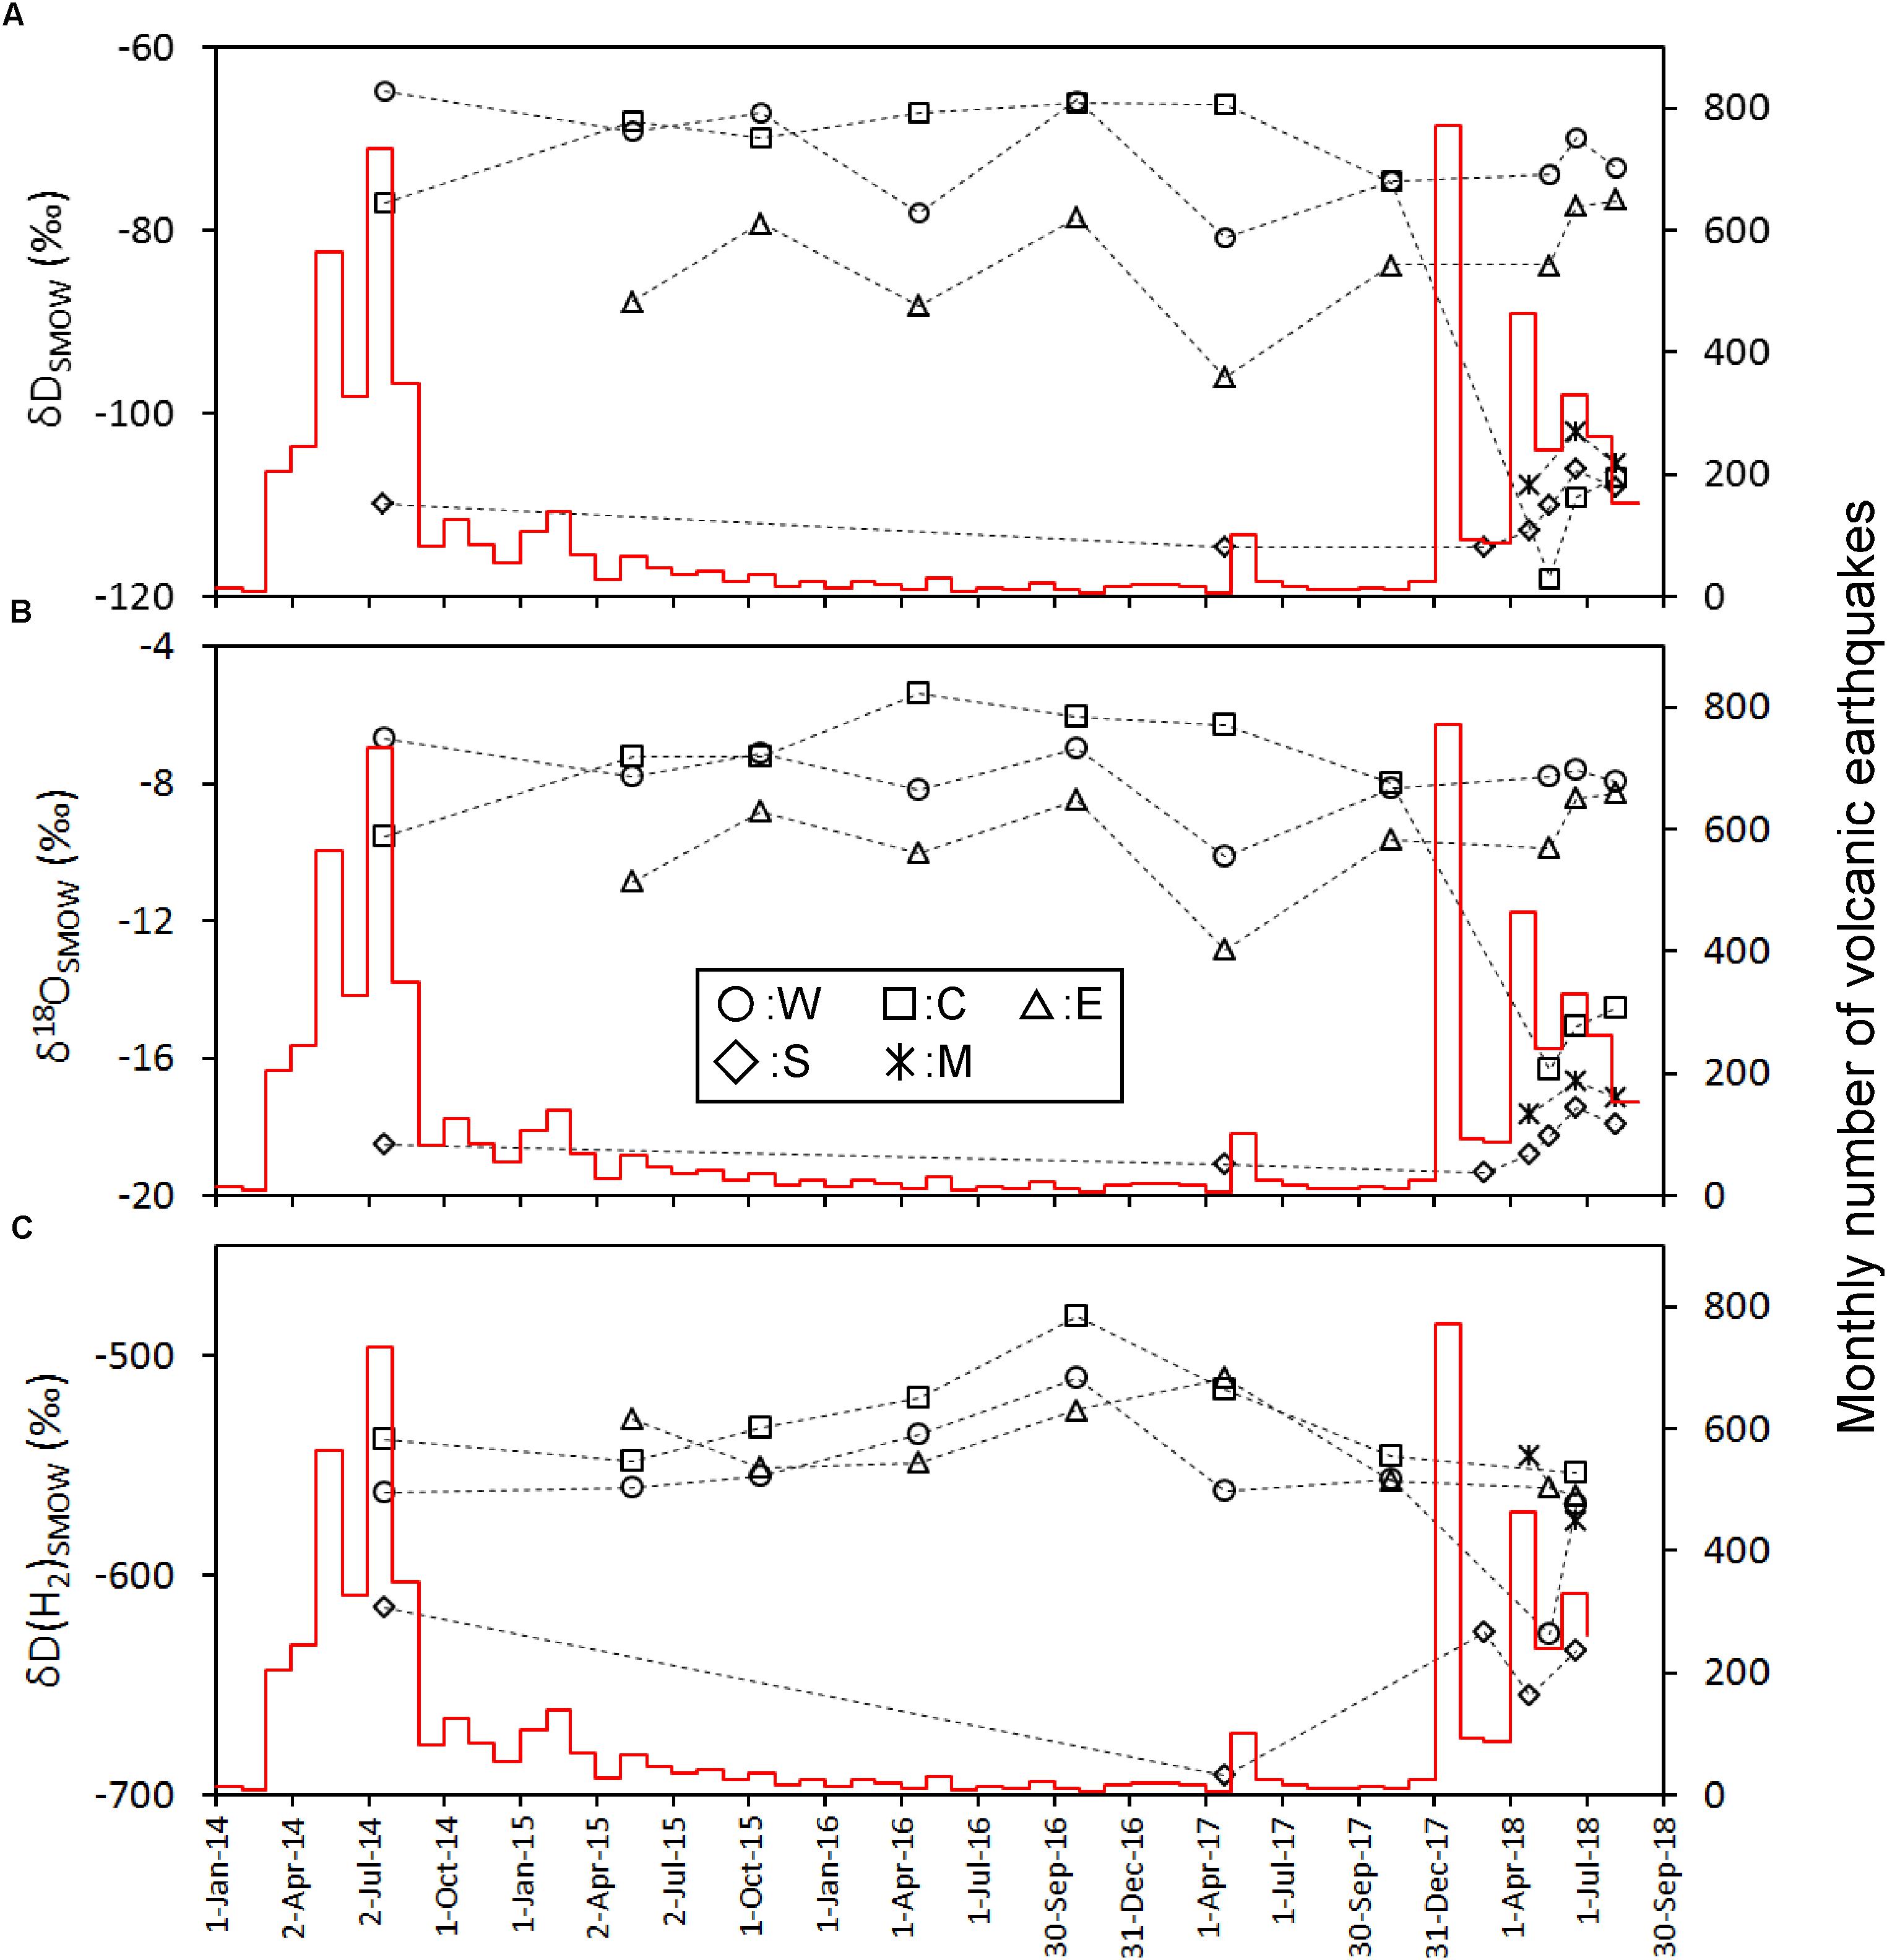
Figure 4. Time variation of δD(H2O) (A), δ18O(H2O) (B), and δD(H2) (C) calibrated on the left y-axis. The red histogram calibrated on the right y-axis shows the monthly number of volcanic earthquakes observed by JMA.
AET is worth due to a potential measure for the temperature of gas source. The equilibrium of the above reaction depends on the total pressure of gas. The total pressure of gas was assumed to be the saturation pressure of H2O at AET. For the calculation, the equation by Ohba et al. (2010) was used. The apparent equilibrium temperature (AET) was also calculated assuming the equilibrium of the following isotope exchange reaction.
For the calculation, the fractionation factor given by Richet et al. (1977) was used. Hereafter, the AETs for the reactions (2) and (3) are designated to be ATE1 and AET2, respectively. As shown in Figure 5, AET1 of W, C, E was stable over the entire period. AET2 of W, C, E showed almost similar values each other. A weak rise of AET2 for W, C, E occurred in 2016.
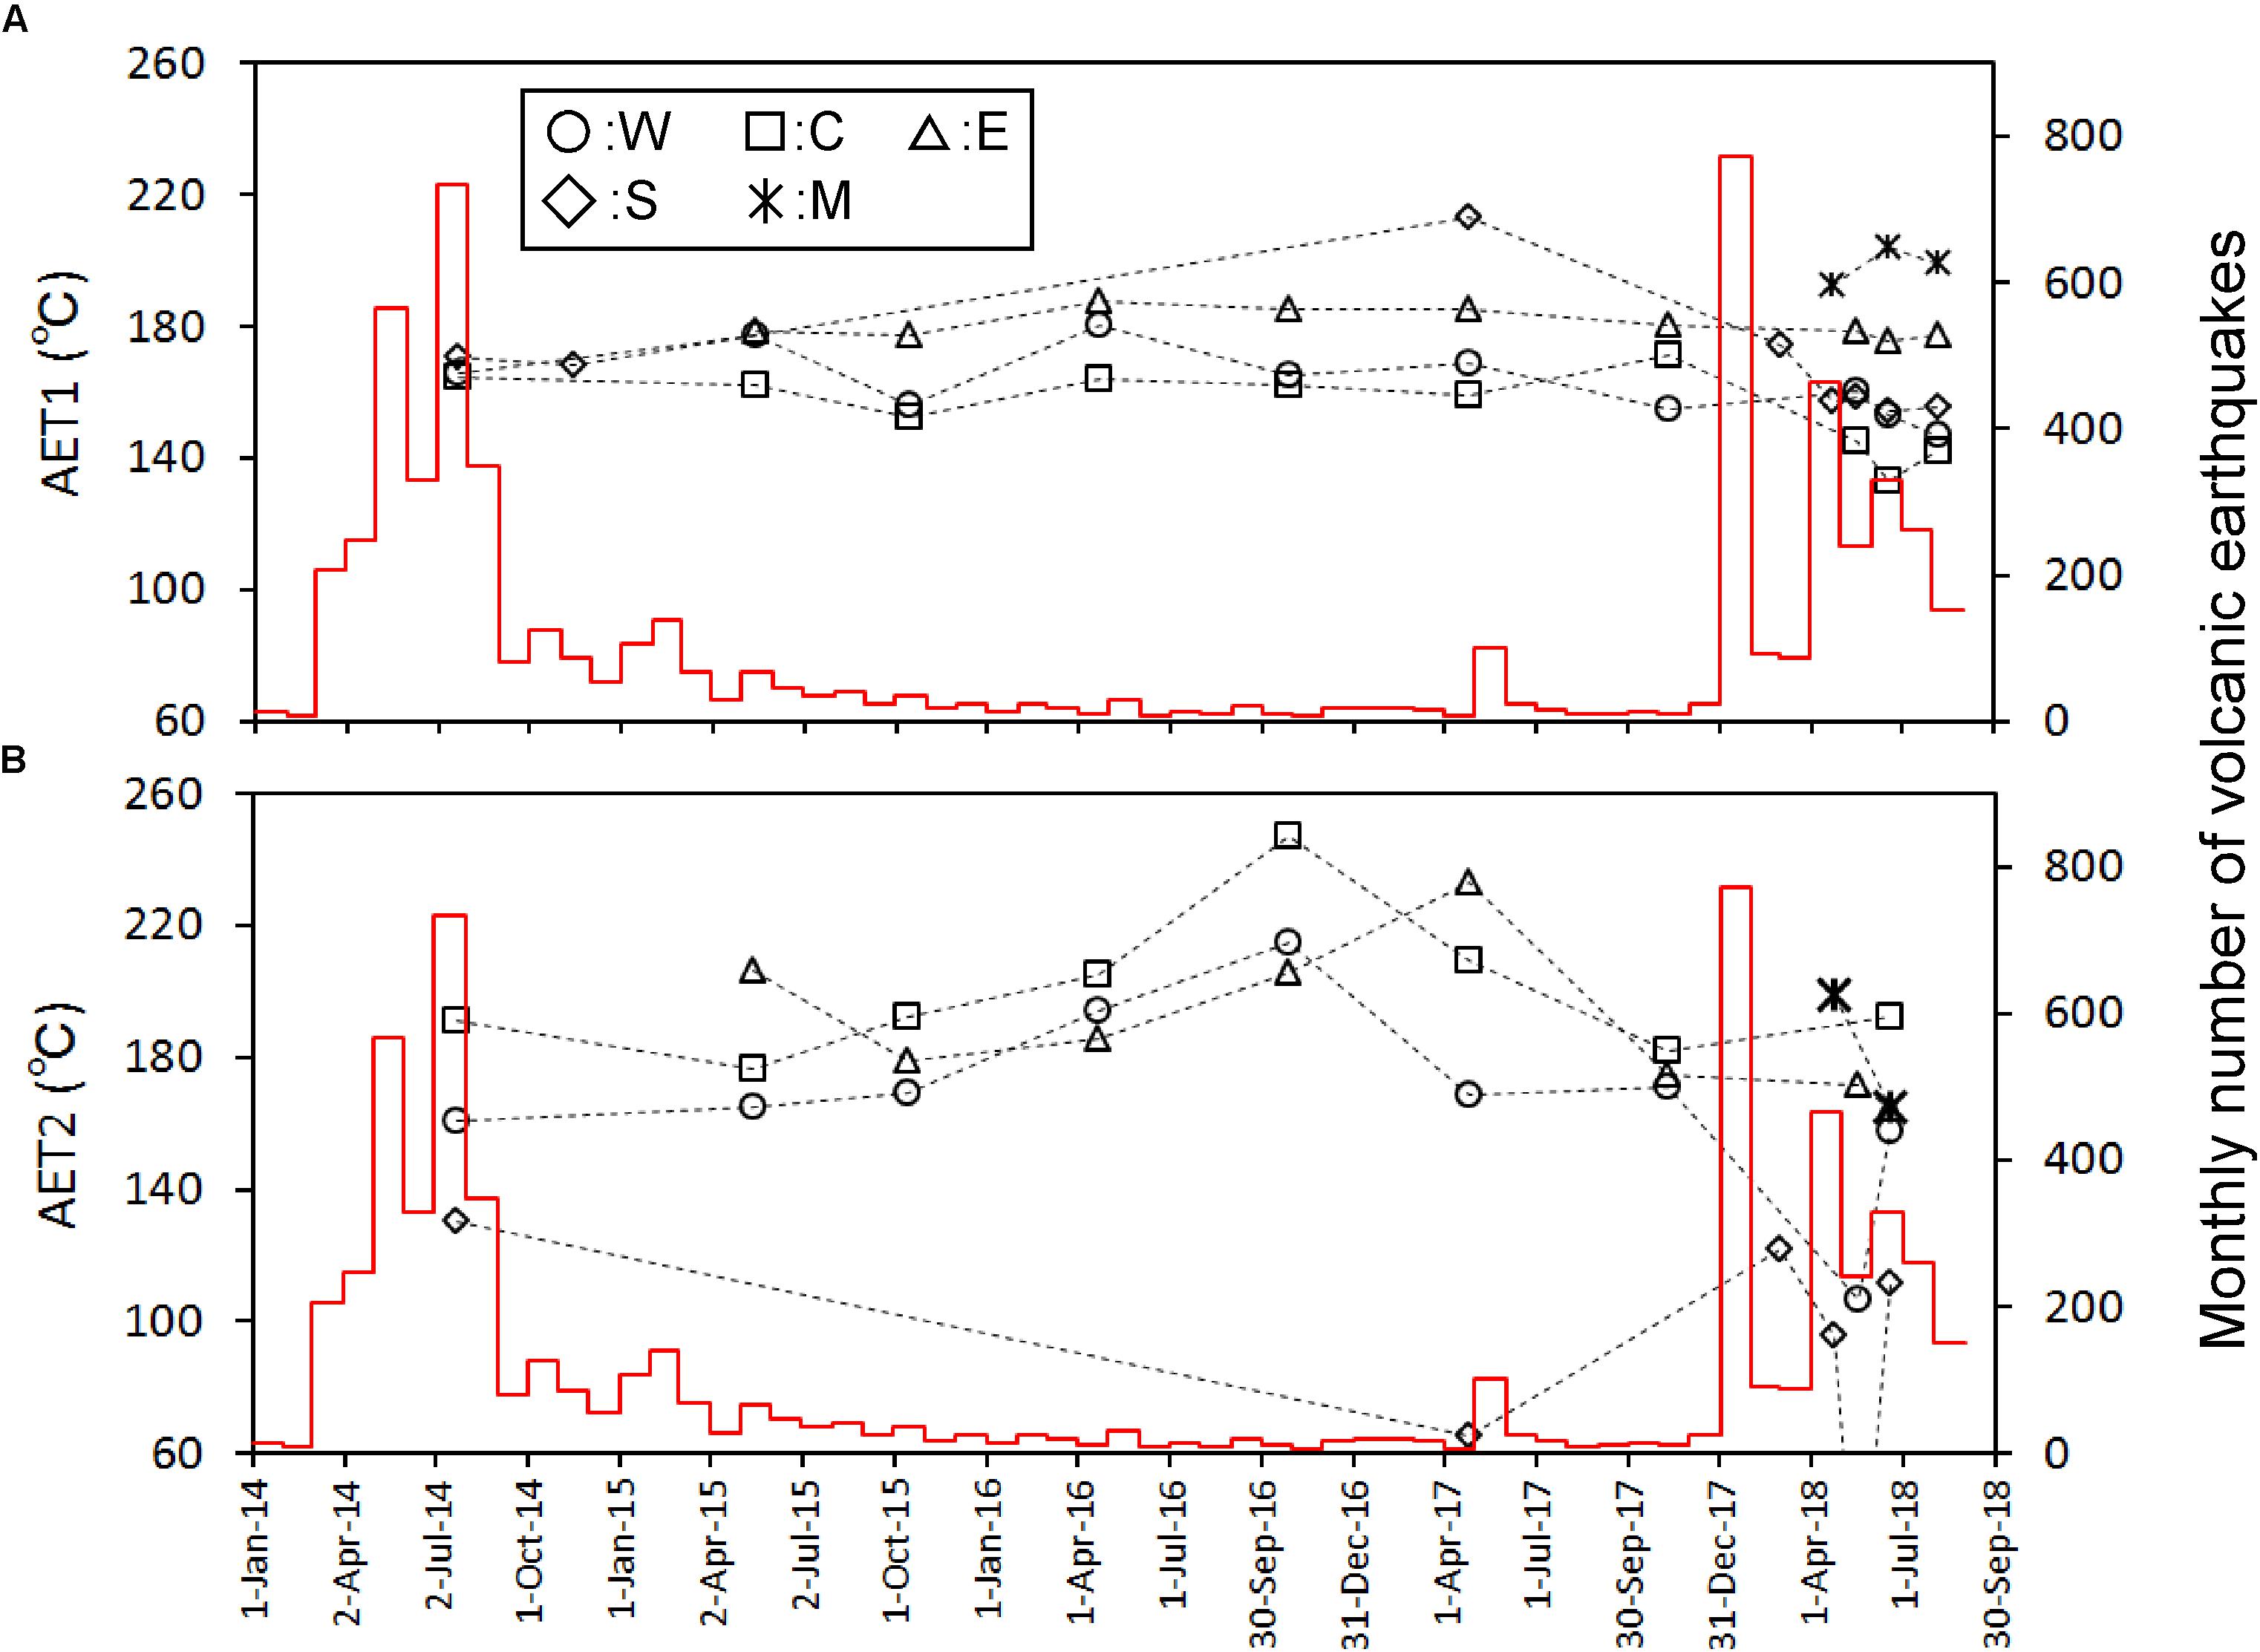
Figure 5. Time variation of apparent equilibrium temperature [AET1 (A) and 2 (B) defined in the text] calibrated on the left y-axis. The red histogram calibrated on the right y-axis shows the monthly number of volcanic earthquakes observed by JMA.
Discussion
Multiple Components With Different Origins in the Fumarolic Gasses
For the source of He in fumarolic gas, two candidates are possible. One is He derived from a degassing magma. The other one is the He derived from the radioactive U and Th decay chain. According to Sano et al. (1994), the 3He/4He ratio in the fumarolic gas at Kusatsu-Shirane volcano was high as 8Ratm, where Ratm is the atmospheric 3He/4He ratio, suggesting that the He in fumarolic gas originates in a degassing magma. Sano et al. (1994) recognized a negative correlation between 3He/4He ratio and δ13C of CO2 in fumarolic gas and bubble gas associated with hot spring discharges, suggesting an addition of CO2 with high δ13C, likely derived from a limestone contained in the basement rock situated beneath Kusatsu-Shirane volcano (Uto et al., 1983). As shown in Figure 2, the variation pattern of He/H2O, CO2/H2O and N2/H2O ratios resemble each other for W, C and E, namely, the ratios monotonically decreased since July 2014 until November 2017, suggesting that CO2 and N2 would also originate in a degassing magma. According to Figure 6, the CO2/He and the N2/He ratios of W, C and E are not constant throughout the study period, and cooperative fluctuations are observed. Namely, these ratios showed high values from April 2016 to November 2017. As a cause of this fluctuation, a) CO2/He ratio and N2/He ratio of magma component themselves fluctuated. Alternatively, b) CO2 and N2 other than magmatic component were contaminated during April 2016 to November 2017. At first we consider the possibility of a). As for the cause of the variation of the magmatic component, a change due to magma degassing is possible. Along with magma degassing, the He-N2-CO2 ternary composition will be governed by the solubility of each gas to magma. Namely, as degassing progresses, gasses with low solubility are selectively removed, and gas components with high solubility become gradually prominent. The solubilities of He, N2 and CO2 in magma are approximately 2.5 × 10⁻⁷ (mol g–1 bar–1) (Carroll and Webster, 1994), 1.3 × 10⁻⁹ (mol g–1 bar–1) (Humbert et al., 1998) and 1.3 × 10⁻⁸ (mol g–1 bar–1) (Giggenbach, 1996), respectively. As the degassing progresses, the magmatic component is relatively rich in He having the highest solubility and is relatively deficient in N2. Actually, as shown in Figure 7, from July 2014 (position-A) to November 2017 (position-B), N2 temporally enriched, contradicting the prediction in the case of a). Therefore, the possibility of a) is low. Next, we consider the possibility of b). CH4 is not a magmatic component, it is thought to be produced through the reduction of CO2 by Fe2+ contained in the rocks (Giggenbach, 1997). Here, the component generated in the hydrothermal system is defined as hydrothermal component (Hc). CH4 is a typical Hc. As other Hc, H2S is also mentioned. H2S can be generated by reduction of SO2. The CO2/He and N2/He fluctuation of W, C and E (Figure 6) are similar to the variation pattern of CH4/H2O ratio (Figure 3B). This similarity suggests that CO2 and N2 other than magmatic component may have been added to W, C and E during April 2016 to November 2017. The trajectory of He-N2-CH4 ternary component fluctuation has an interesting pattern (Figure 8). In Figure 8, the composition of W, C, E was in the position of A in July 2014. Hereafter, the composition at the position-A is defined to be Mc1. The composition of W, C and E gradually moved to the direction of CH4 corner and reached the position-B in November 2017. The trajectory from A to B depicts a convex upward curve. This indicates that at the beginning, the CH4/N2 ratio of the additional component to the composition of A was low and the CH4/N2 ratio of the additional component later increased. The composition in the position B changed toward another position C instead of returning to A. CH4 and N2 are likely to have different origins as components added in the process from A to B. Here, CO2, N2 derived from carbon and nitrogen contained in host rocks hosting hydrothermal reservoirs are defined as crustal component (Cc). As a source of N2 as the additional component, it is highly likely Cc. In Figure 7, it is considered that the change of A to B, the CO2/N2 ratio of the additional component was constant. Therefore, CO2 as an additional component is also regarded as crustal component (Cc). It is presumed that the CH4/N2 ratio of the additional component increased because the redox state of the hydrothermal reservoir became reduced. As a cause of the reduction, the decrease in the flow rate of magmatic gas enriched in SO2 is possible.
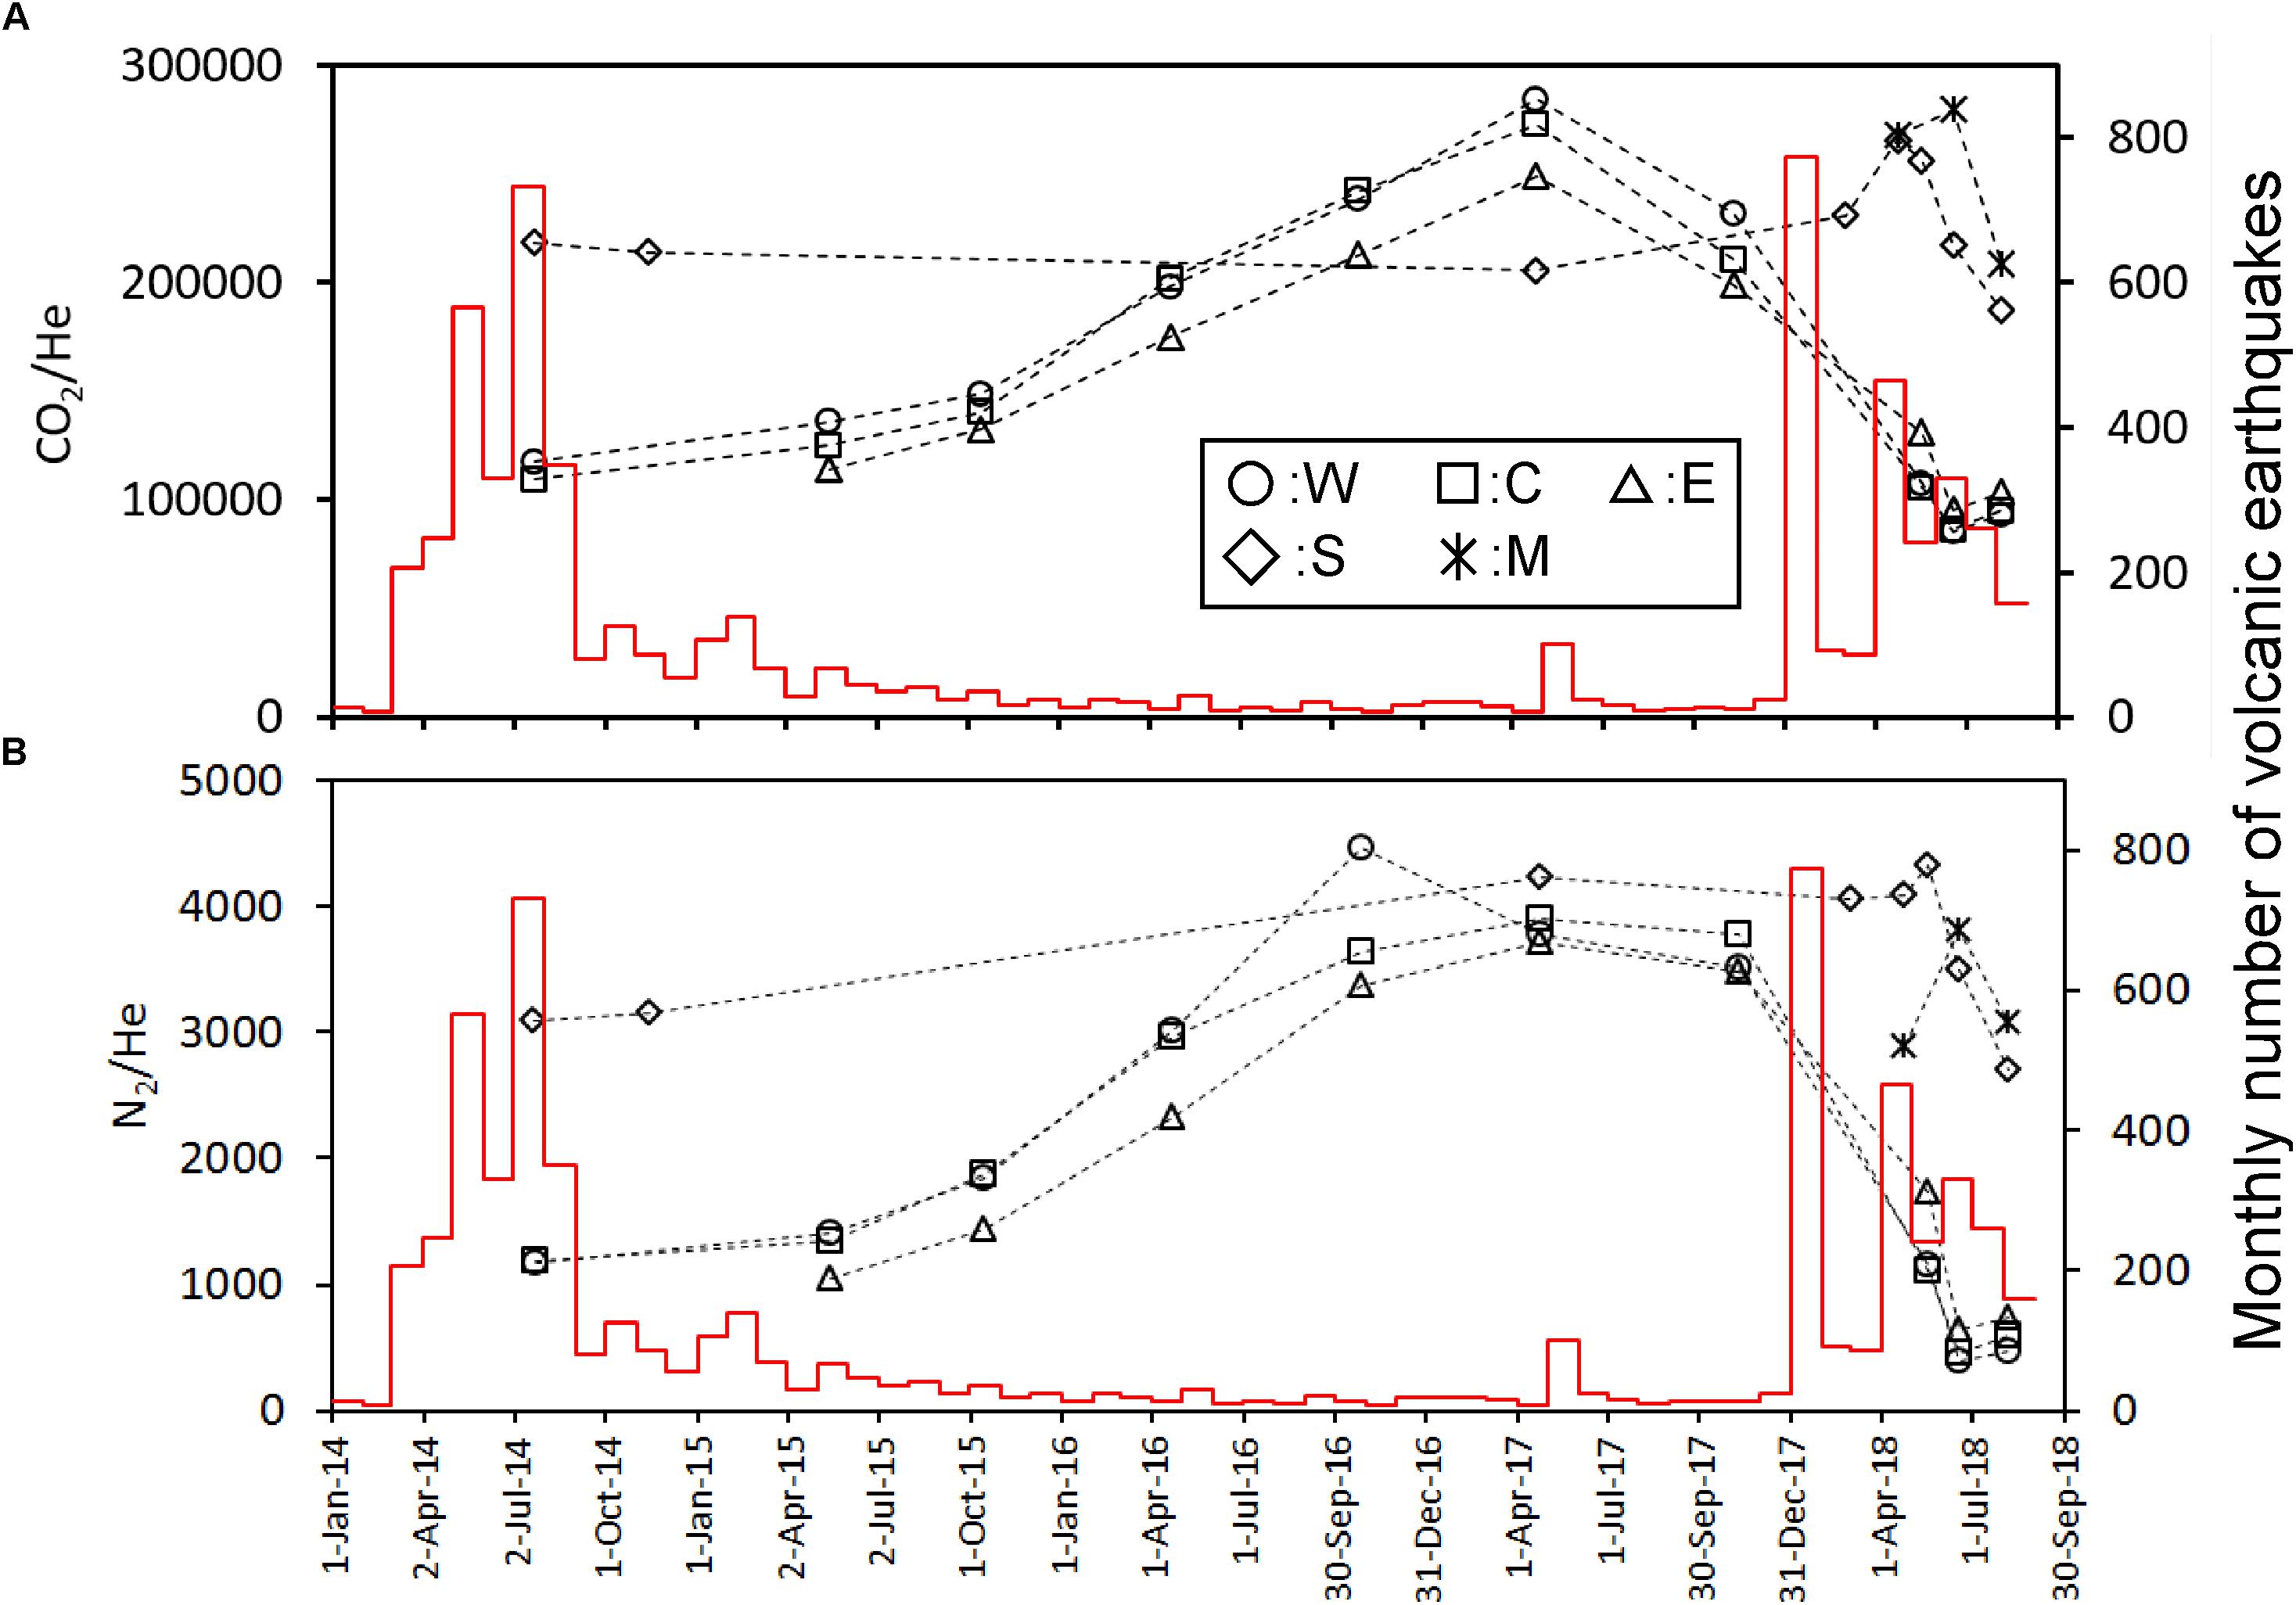
Figure 6. Time variation of CO2/He (A), N2/He (B) molar ratios calibrated on the left y-axis. The red histogram calibrated on the right y-axis shows the monthly number of volcanic earthquakes observed by JMA.
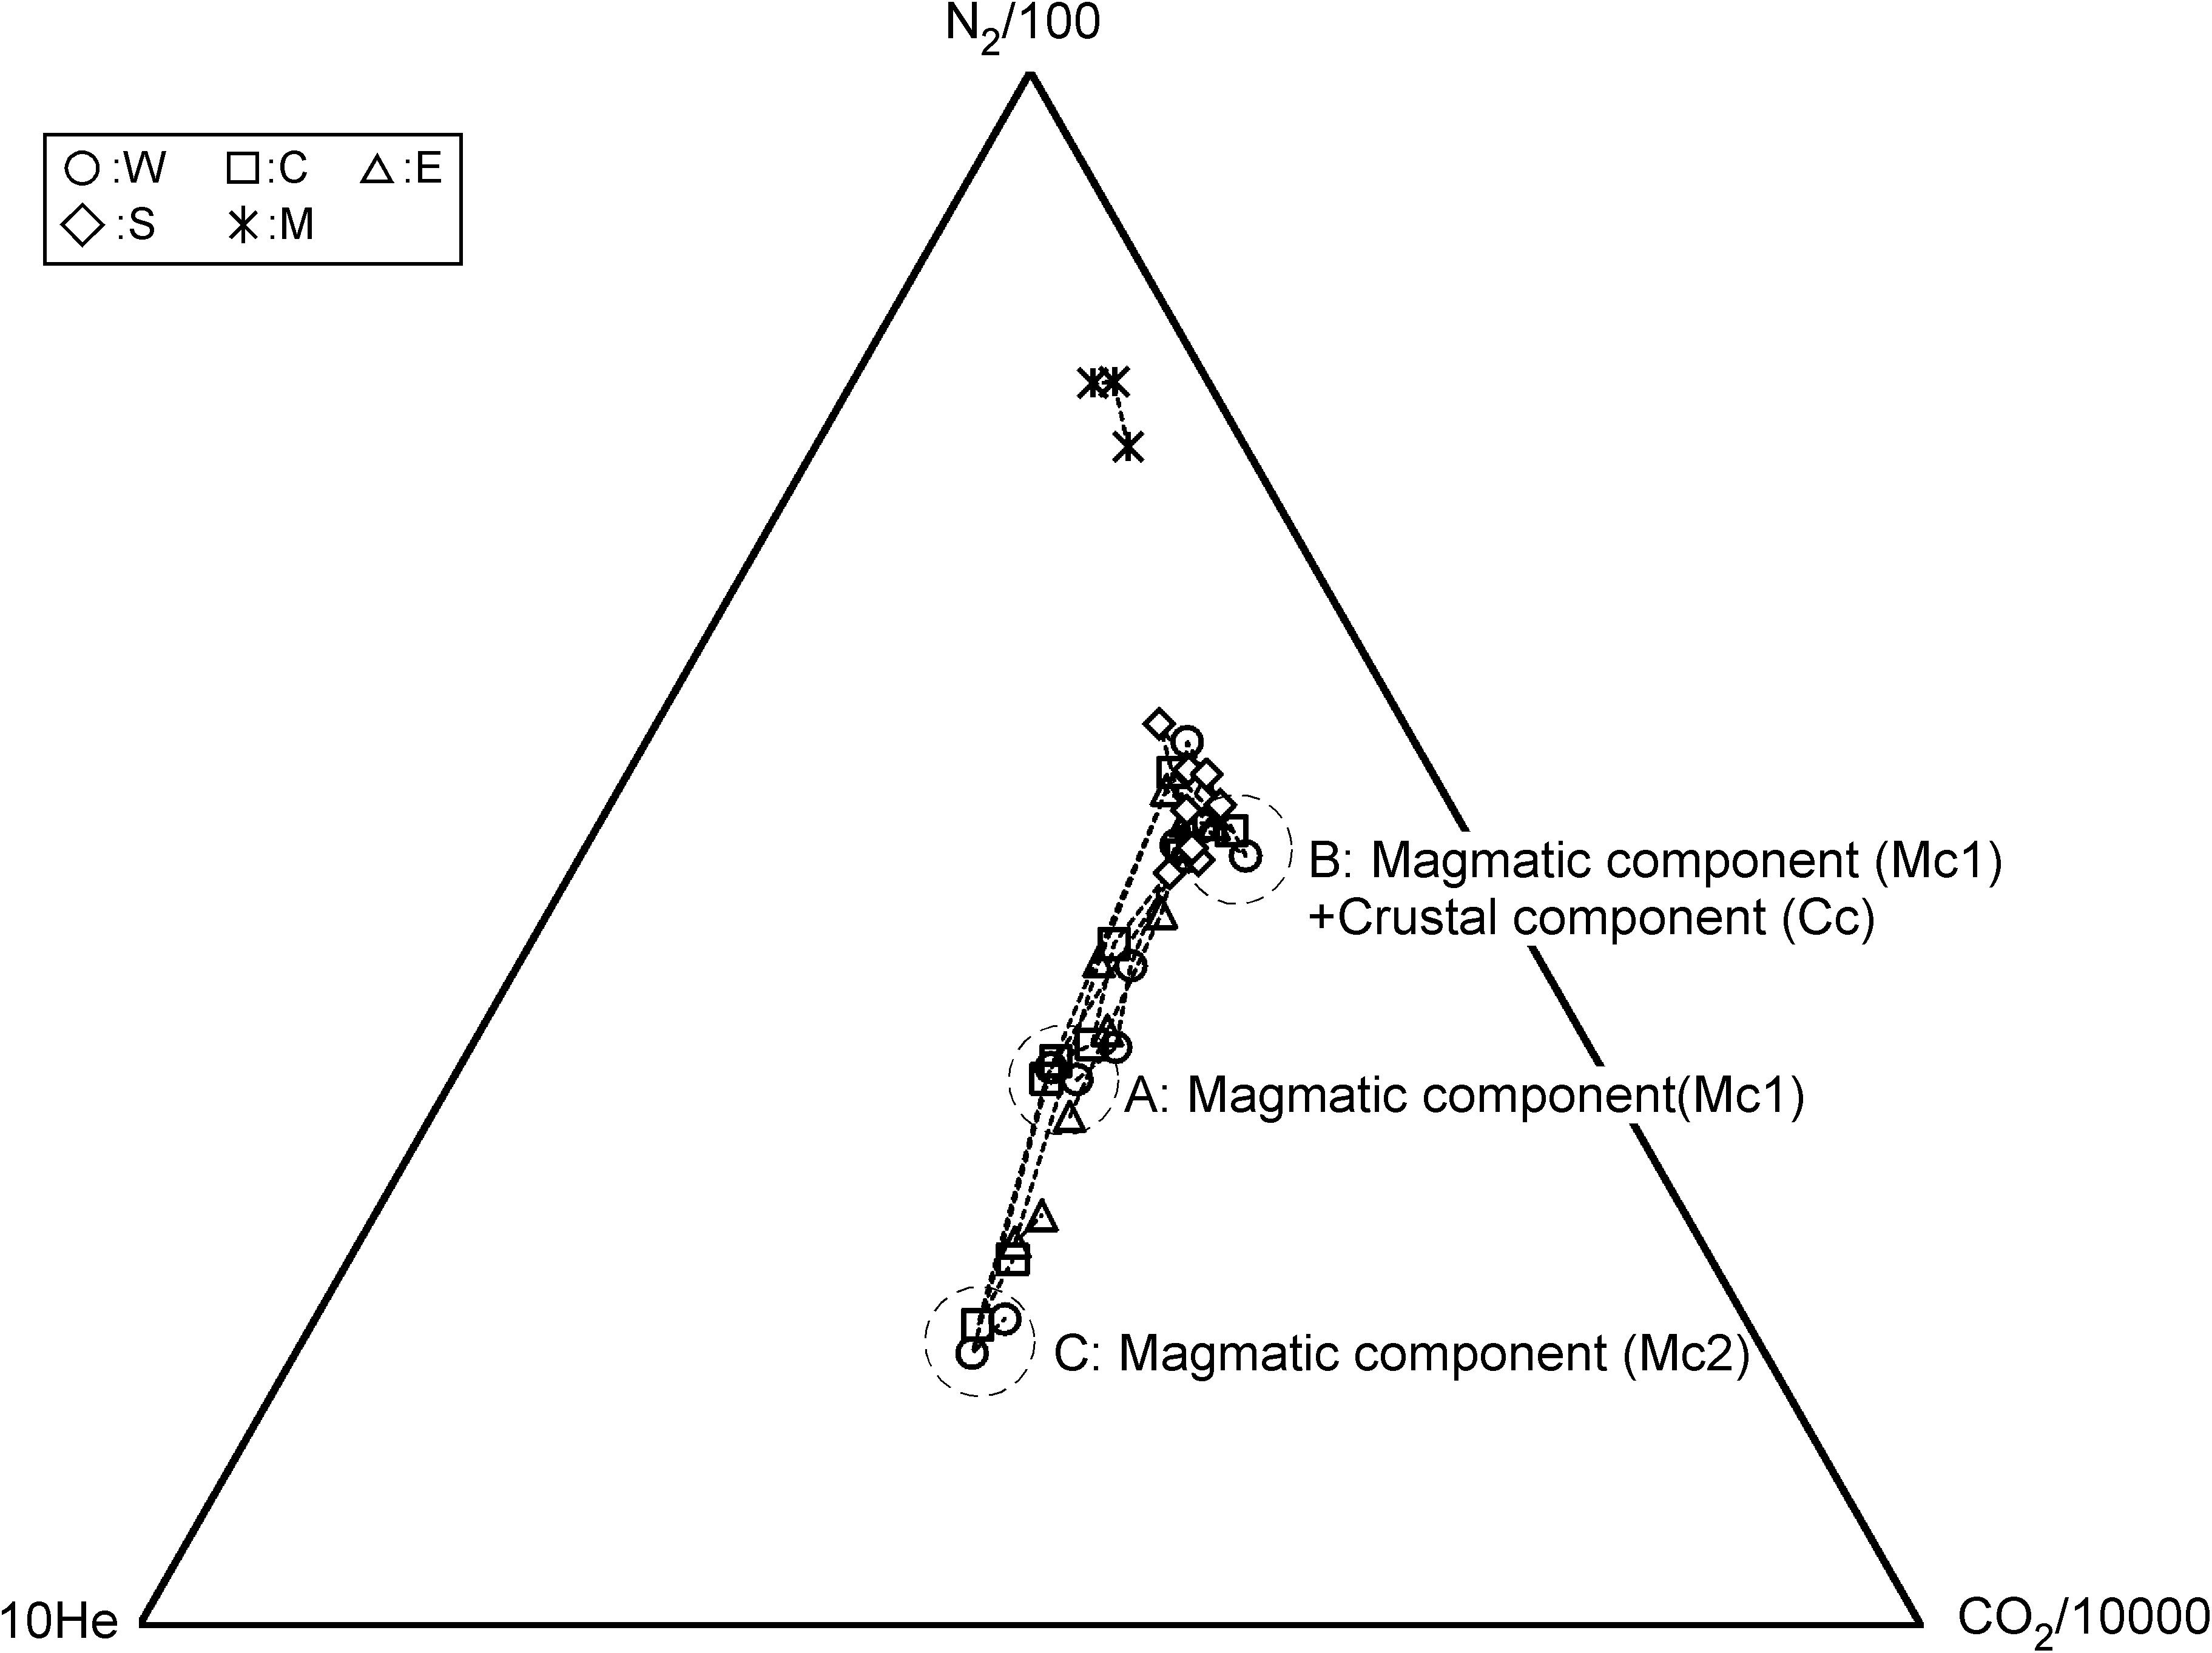
Figure 7. He-N2-CO2 ternary molar composition of fumarolic gas. The position of A, B, and C indicate the composition in July 2014, November 2017 and August 2018, respectively.
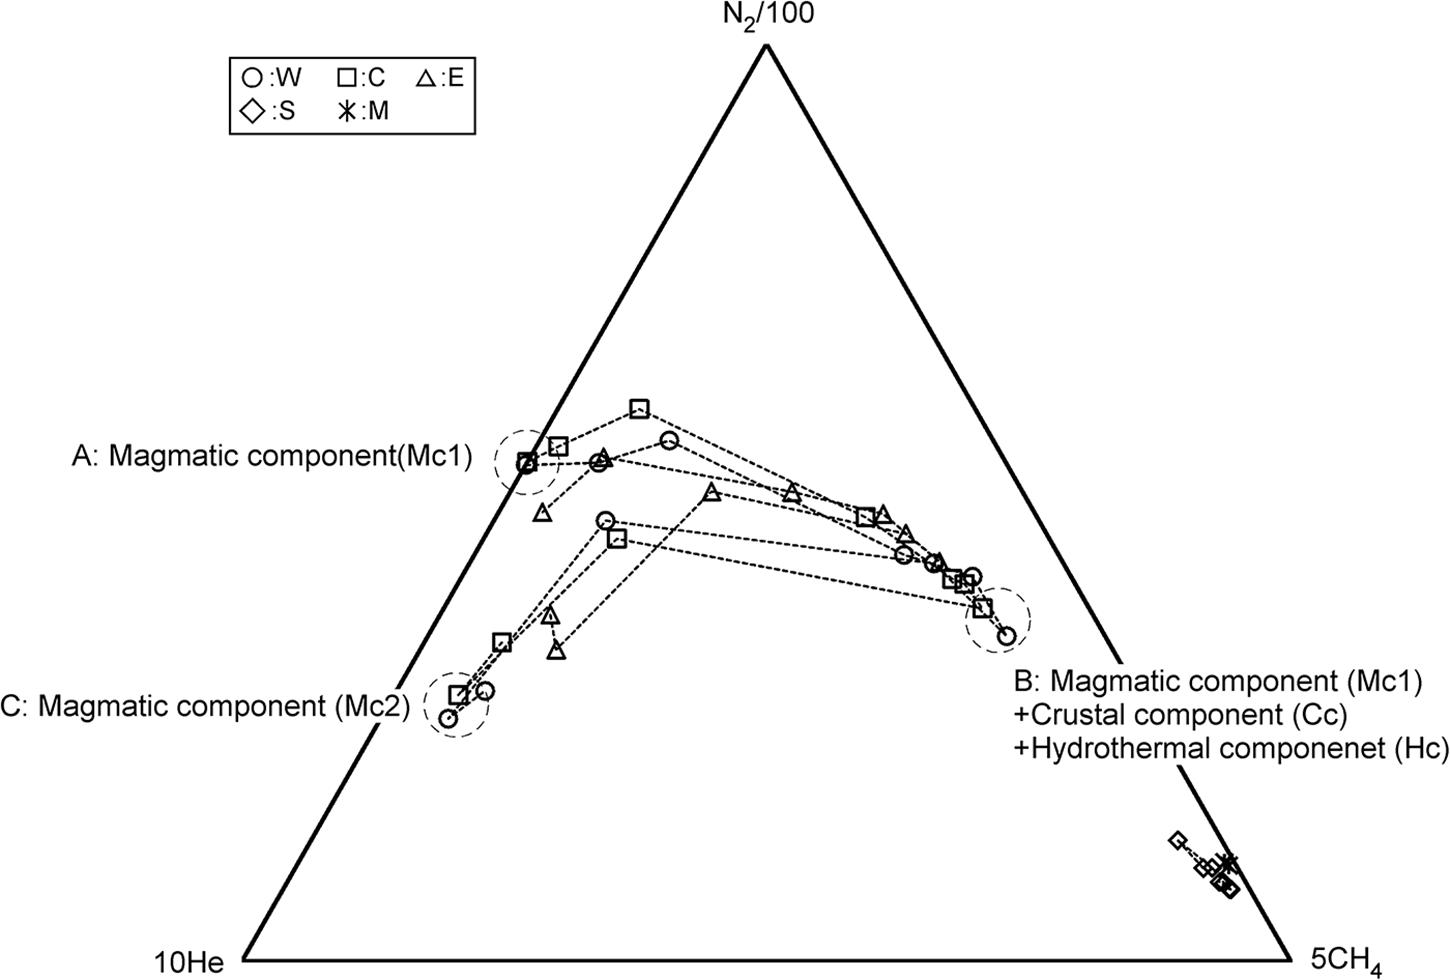
Figure 8. He-N2-CH4 ternary molar composition of fumarolic gas. The position of A, B, and C indicate the composition in July 2014, November 2017 and August 2018, respectively.
According to the conventional theory (Kita et al., 1993), the He-N2-Ar ternary composition of volcanic gasses is controlled by the tectonic environment where the target volcano is located. For example, in subduction zones volcanoes are strongly influenced by a subducting oceanic plate. Nitrogen supplied from the oceanic plate is taken into the magma and the N2/He ratio of the volcanic gas is high (Sano et al., 2001). On the other hand, the volcanoes located in the back arc and hot spots have low N2/He ratio because the influence of N supplied from the oceanic plate is small or negligible. Figure 9 plots the He-N2-Ar ternary composition of the fumarolic gas. Distribution of fumarolic gas on the figure is not consistent to the conventional theory. W, E and C were in the area specific to some Mediterranean volcanoes, such as Vulcano, Campli Flegrei and Milos (Giggenbach, 1997) around July 2014 (position-A), but moved to the position of Circum-Pacific Rim volcanoes by November 2017 (position-B). After that, again it moved to a region of the Mediterranean volcanoes (position-C), but with N2/He ratios lower than the position-A in July 2014. The shift from A to B can be explained by the addition of N2 as crustal component (Cc). Hereafter the component at C is defined as Mc2. The fumarolic gas at A and C contain little CH4. Therefore, Mc1 and Mc2 are thought to represent the magmatic component. Mc2 is poor in N2 relative to Mc1. This feature may have occurred with magma degassing, because N2 is less soluble than He and CO2. Based on the above discussion, the evolution of hydrothermal reservoir, which is the source of fumaroles W, C and E, is schematically shown in Figure 10. In Period I, magmatic gas is transported to hydrothermal reservoir passing through the sealing zone (Fournier, 1999). The composition of the magmatic gas was Mc1. The fluid pressure in the reservoir was high, and earthquakes occurred frequently. Kusatsu-Shirane volcano experienced a seismic crisis in 1990 and 1991. Based on the temporal changes of the lake water in Crater Yugama, Ohba et al. (2008) modeled the magma-hydrothermal system. In 1990 and 1991, the chloride concentration of lake water increased quickly accompanying the decrease in pH of lake water, suggesting an input of HCl enrich magmatic gas to the hydrothermal reservoir beneath Crater Yugama through the sealing zone surrounding the degassing magma. In 2014, a chloride increase and pH drop, similar to those in 1990, were observed in the lake water (in preparation for publication). Considering the similarity between the activity in 1990 and 2014, an input of magmatic gas through the sealing zone was assumed in the Period-I. In period II, due to the regrowth of sealing zone, the release of magmatic gas was reduced. The hydraulic pressure in the reservoir decreased and the occurrence of the earthquake was suppressed. During this period, the flow rate of SO2 supplied to the reservoir would decrease, the fluid in the reservoir gradually became reductive, and CH4 was generated by the reductive reaction of CO2. In addition, carbon and nitrogen contained in host rock of reservoir were extracted to the hydrothermal fluid as CO2 or N2. In Period III, magmatic gas whose composition is Mc2 again passed through the sealing zone. The fluid pressure in the reservoir again increased, causing frequent earthquakes. The N2/He ratio of Mc2 decreased relative to the N2/He ratio of Mc1, due to the progress of degassing.
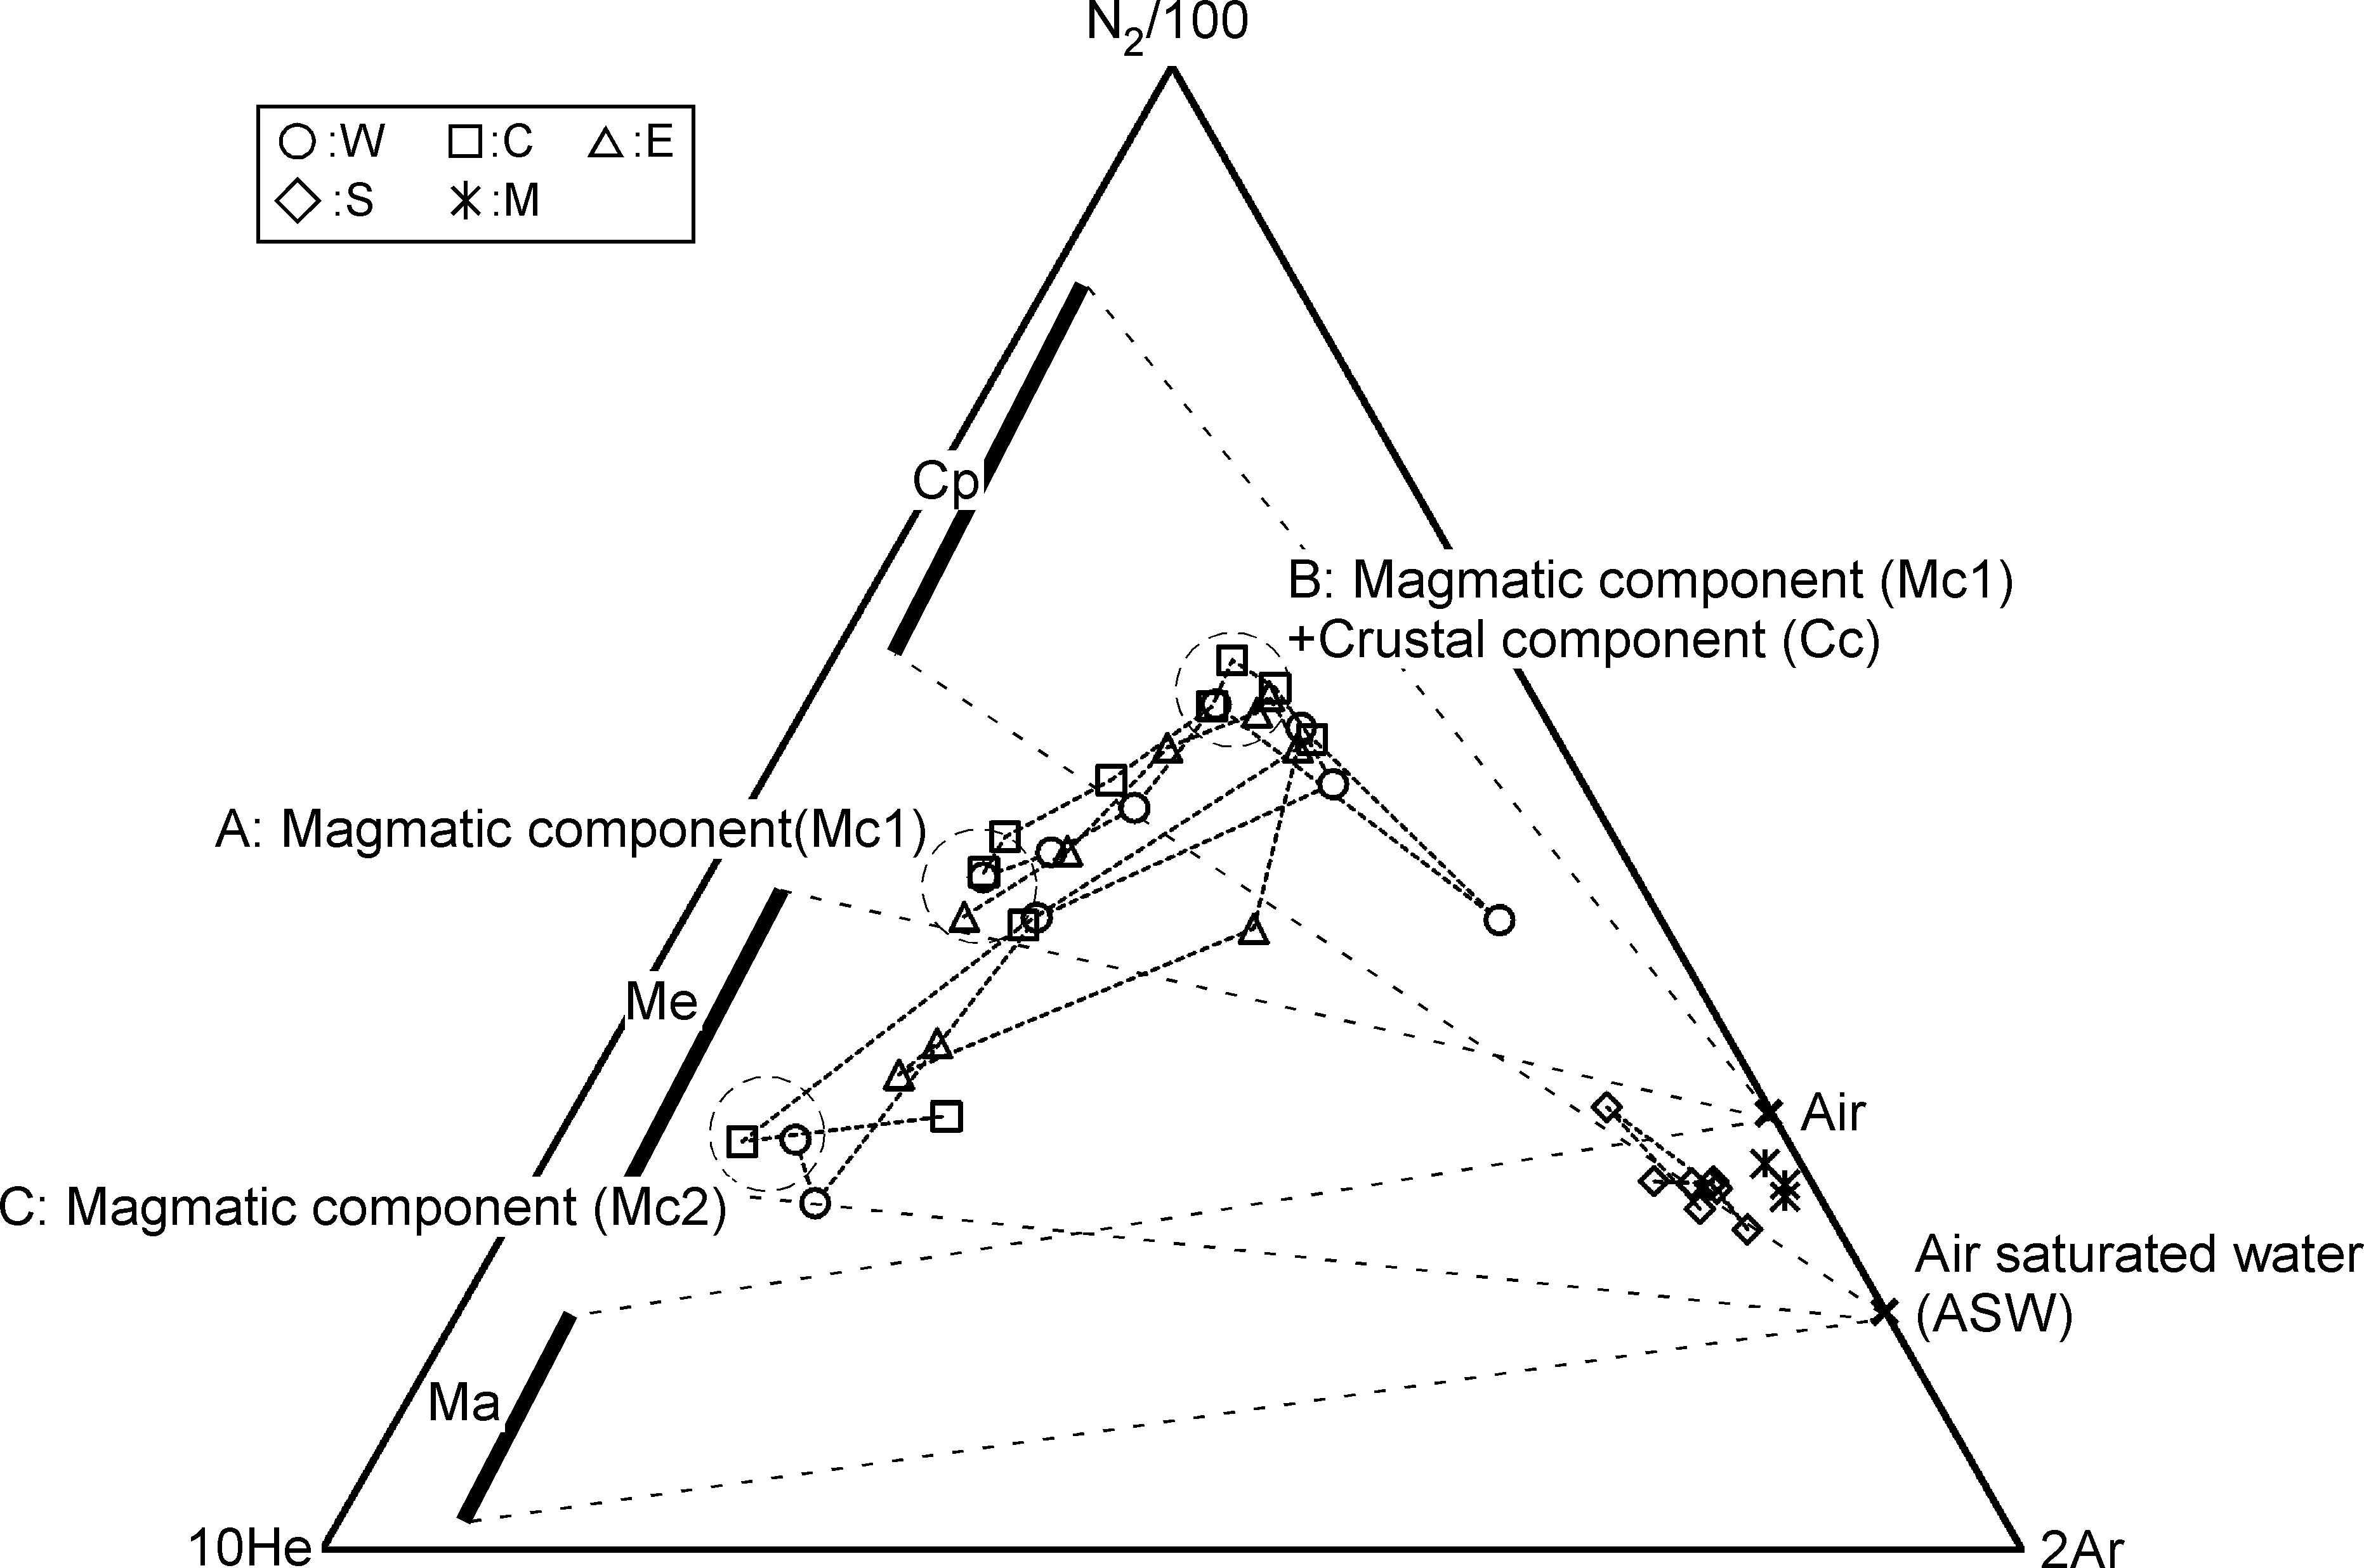
Figure 9. He-N2-Ar ternary molar composition of fumarolic gas. The position of A, B, and C indicate the composition in July 2014, November 2017 and August 2018, respectively. Cp, Me, Ma represent the typical endmember composition of gas from volcanoes on circum-Pacific volcanic belt, Mediterranean sea and hot spots with mantle origin, respectively (Giggenbach, 1997).
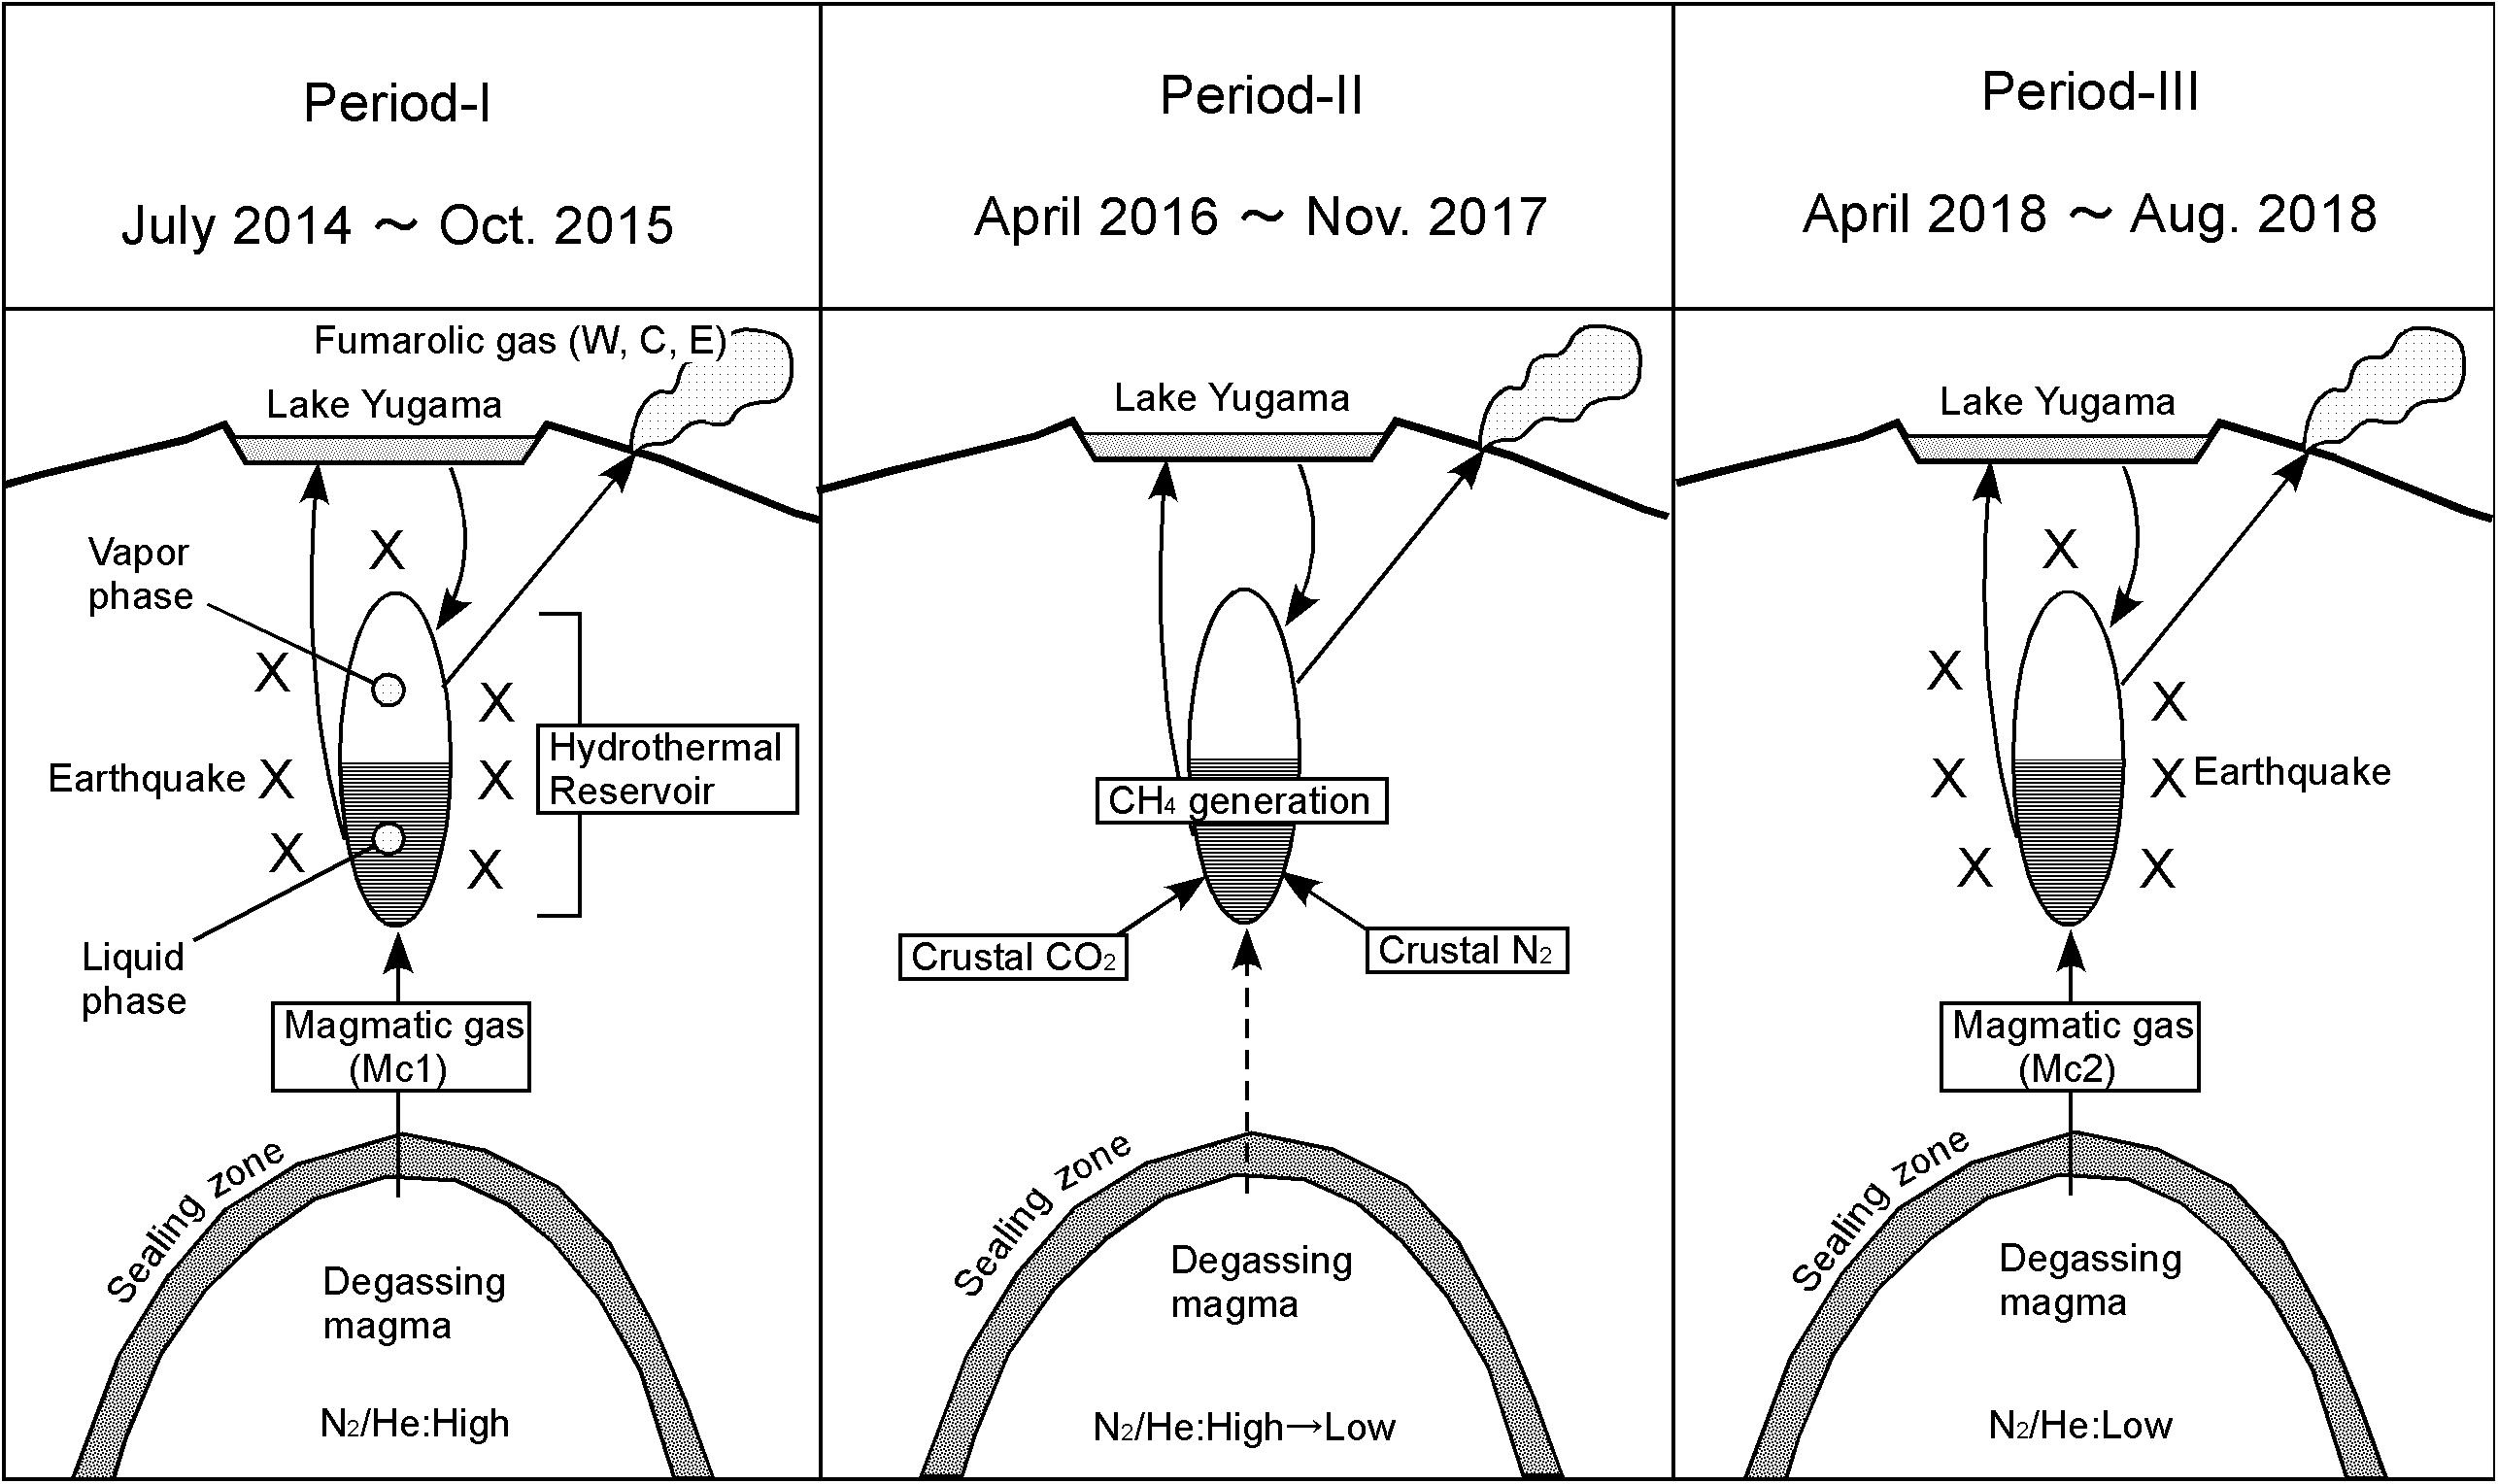
Figure 10. Conceptual model for the evolution of magma hydrothermal system beneath Crater lake Yugama.
Let us now examine the possibility that the compositional change of the fumarole occurred as a result of the earthquake. Such a situation can occur, for example, when a fluid is confined in a hydrothermal system, and the host rock is fractured by seismic activity and the fluid is released. The fluid should interact with the host rock. Generally, rocks are rich in Fe2+, which acts as a reducing agent and converts CO2 to CH4 (Giggenbach, 1997). Therefore, the fluid confined in the space should contain CH4. Moreover, CO2 and N2, which are crustal components contained in the host rock, will be extracted into the fluid. The fluid interacting with the host rock should be thus rich in hydrothermal components CH4 and crustal components CO2 and N2. If such fluids are released by seismic activity, the CH4/H2O, CO2/He, and N2/He ratios will increase just after the seismic event. Since such changes are opposite to the actual observations, the possibility that seismic activity is responsible for the compositional change of fumarole is denied. Therefore, we postulate that the magmatic gas was injected into the hydrothermal system, triggering the seismicity.
Formation Process of Fumarolic Gas
The distribution of fumarolic gasses (W, C, and E) on the δD vs. δ18O plane (Figure 11) coincides with the slope of the isotopic fractionation between water and steam at 100°C. A partial condensation of water vapor near the surface of the ground is presumed to produce the observed distribution. The isotope ratio of water vapor before condensation will be around the upper right of the distribution. As a model to generate water vapor for the explanation of isotopic ratios of W, C and E, we considered a mixing of high-temperature magmatic gas (Mv) and cold meteoric groundwater (Lw). Numerical values necessary for the model calculation are listed in Table 3. As a result of mixing of Mv and Lw, water vapor (Vp) and coexisting hot water (Lp) are generated. In the model calculation, the temperature of Vp and Lp is necessary.
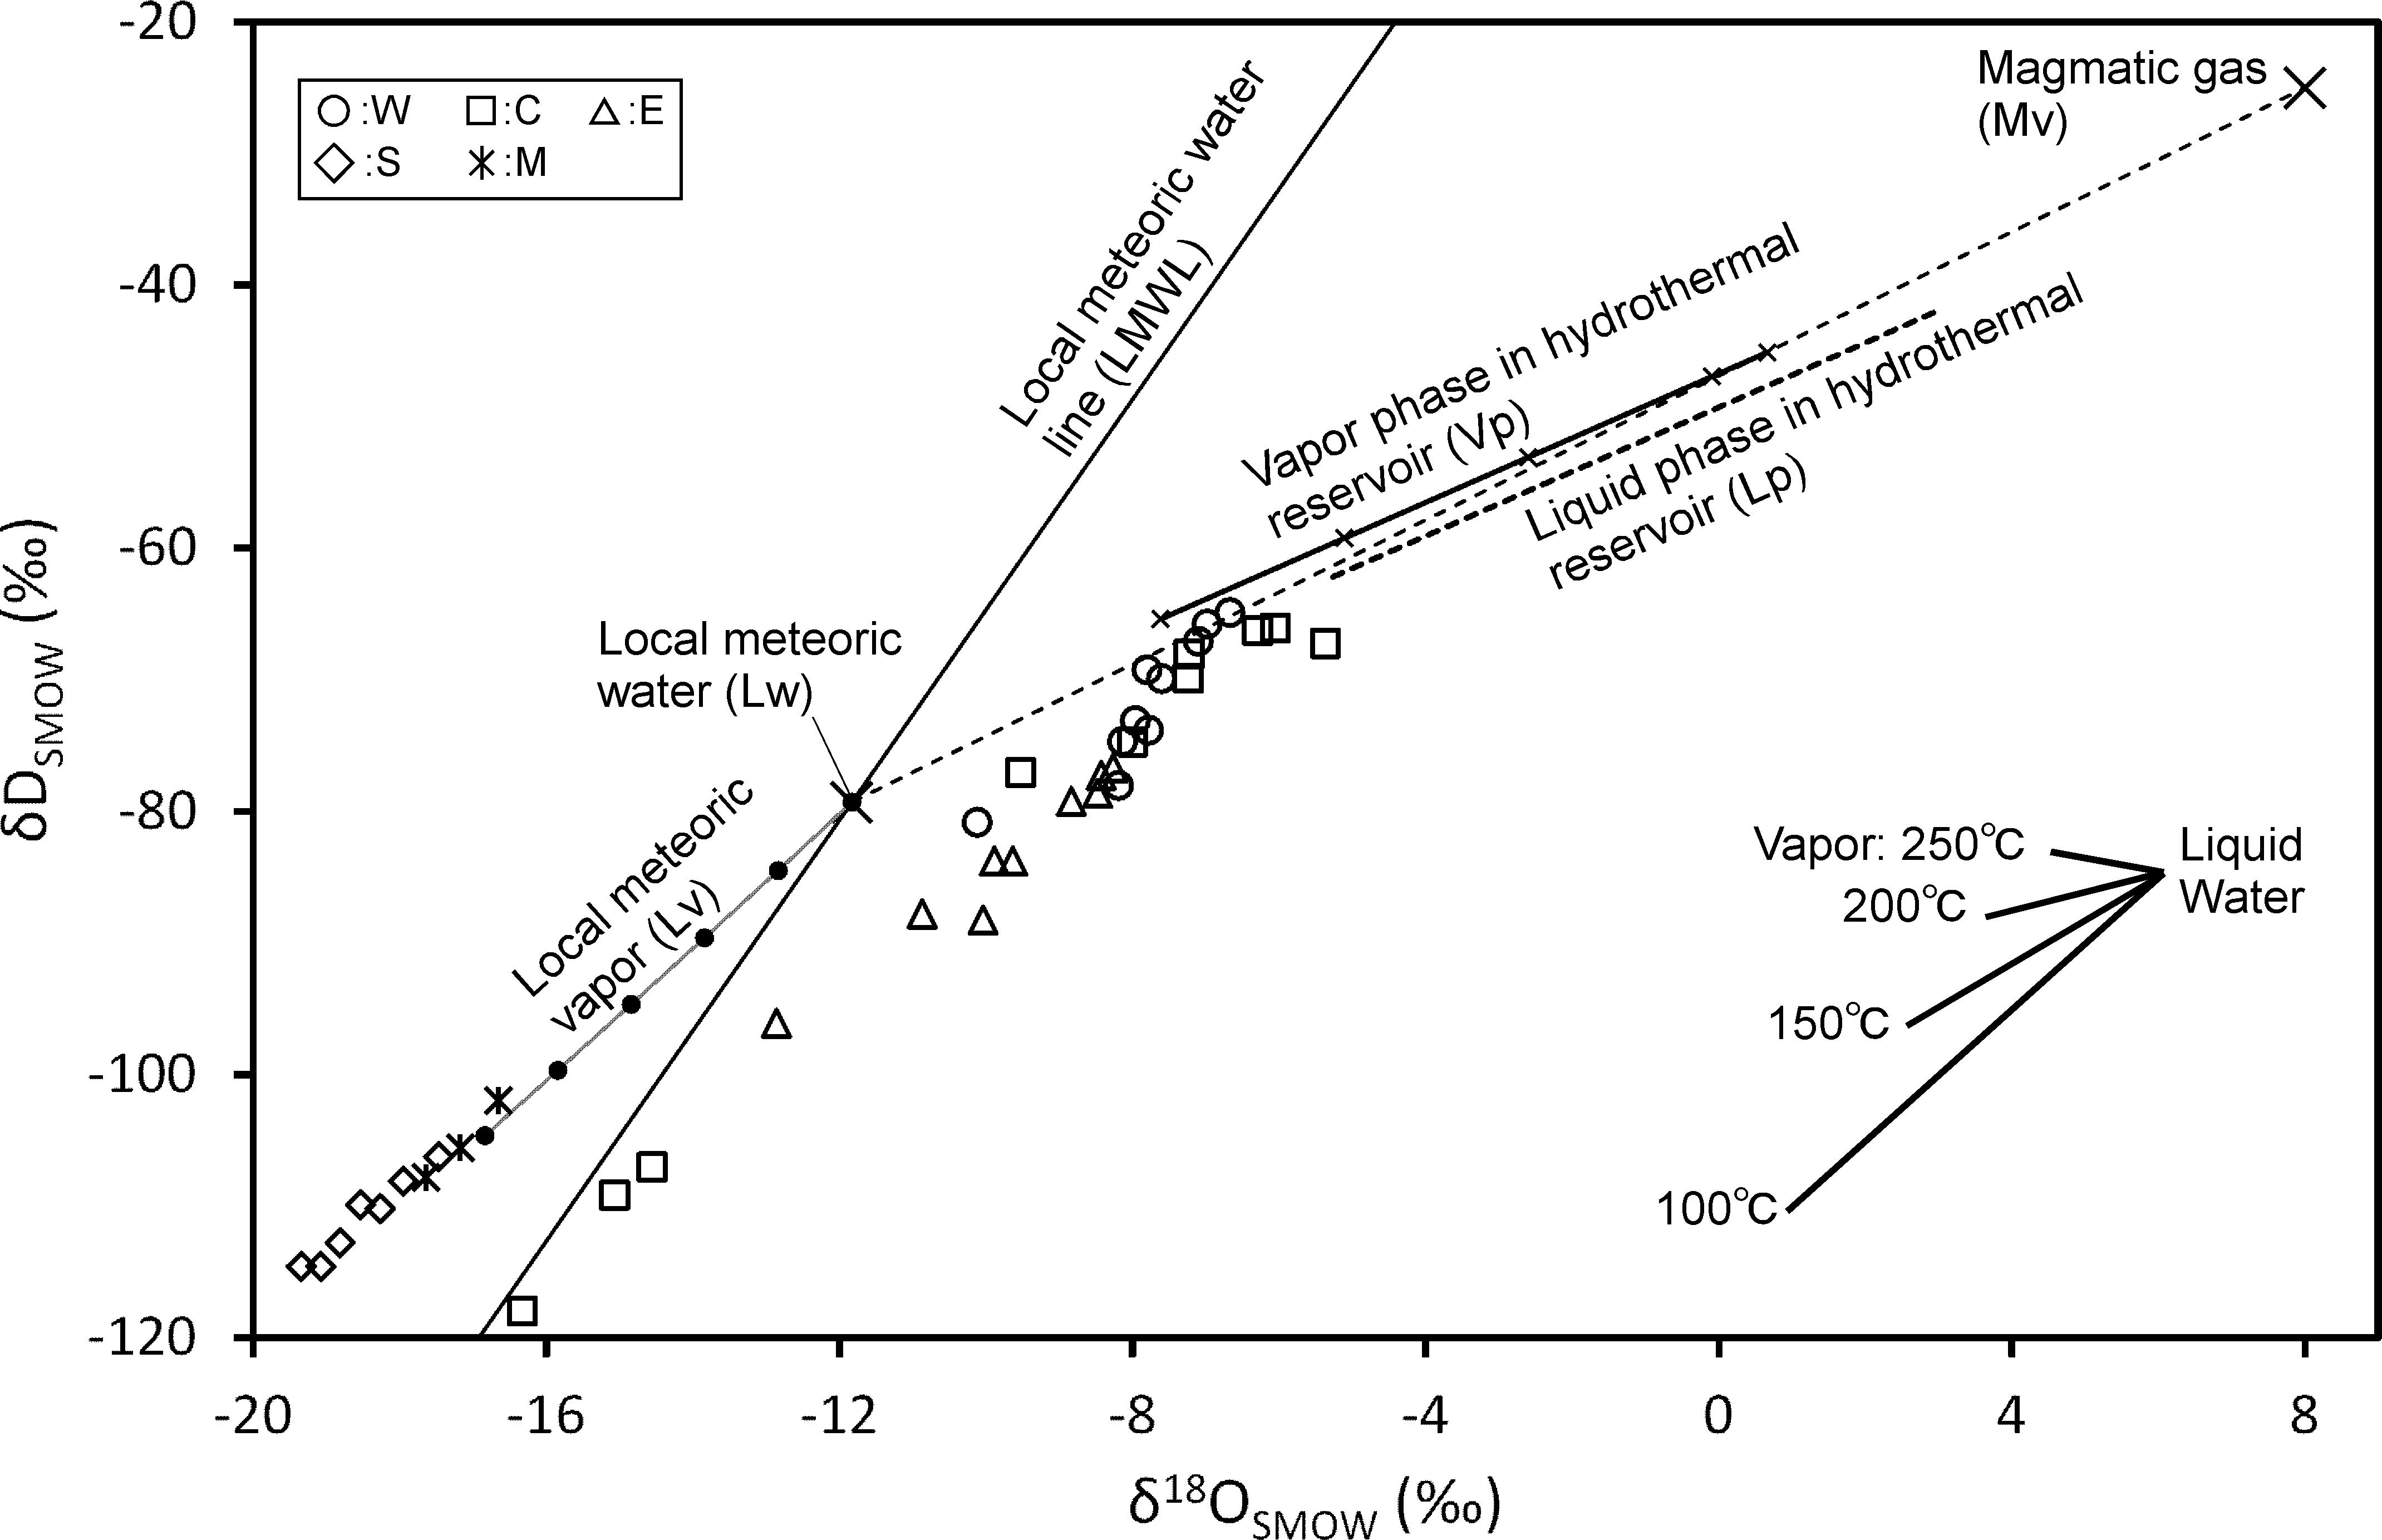
Figure 11. δD and δ18O of H2O in fumarolic gas with the modeled vapor phase in hydrothermal reservoir. The isotopic fractionation between water and vapor with various temperatures is inserted.
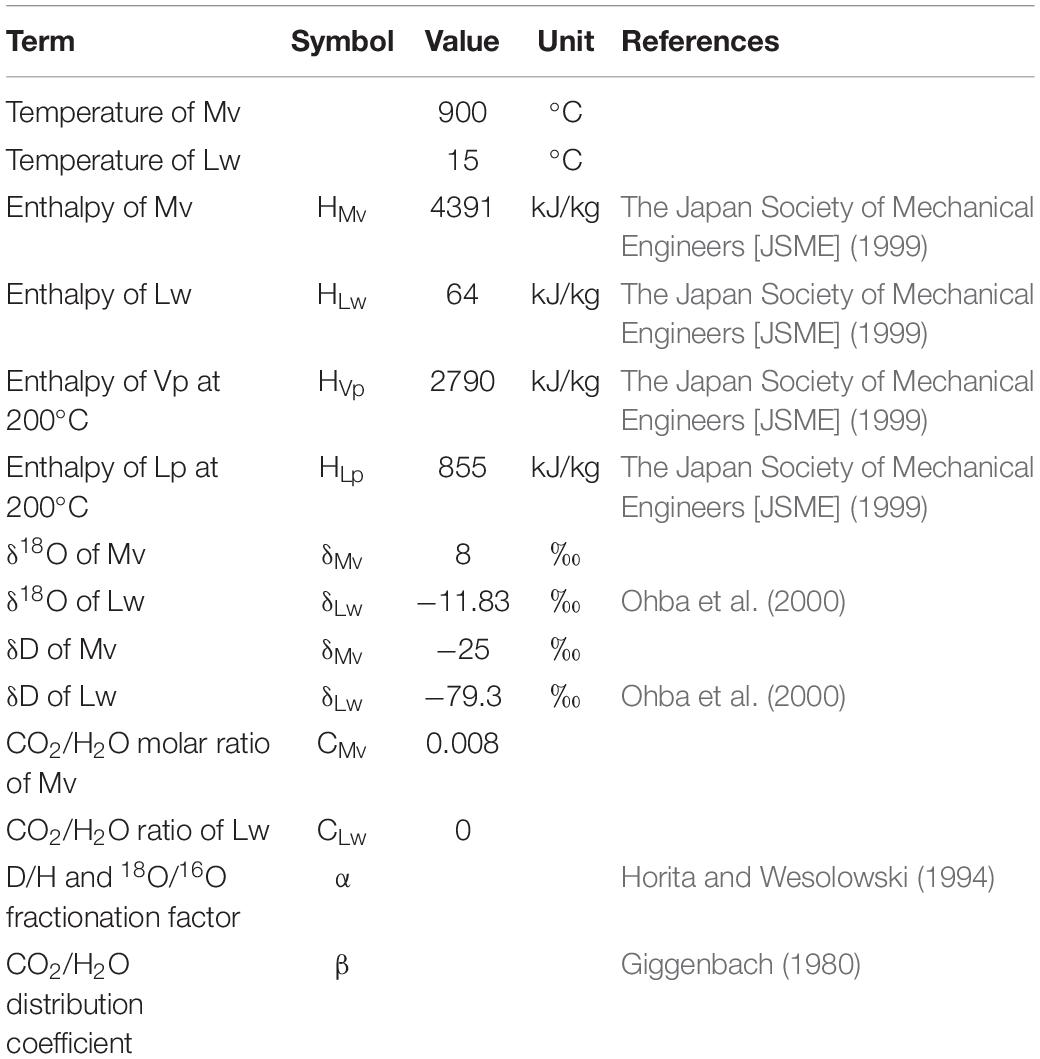
Table 3. Parameters used for the model calculation generating Vp.
Considering the AET1 and 2 of W, C and E, 200°C was adopted as an appropriate and delimitating value for the temperature of Vp and Lp. In this model, CO2/H2O and stable isotopic ratios of Mv should be input and CO2/H2O and stable isotope ratios of Vp and Lp can be outputted. Equations necessary for calculation are, as follows:
where H, δ, and C represent enthalpy, the δ-notated isotope ratio, and the CO2/H2O value, respectively. The phases are indicated by subscripts (Mv, Lw, Vp, and Lp). f and g denote the mixing fraction of Mv and the generating fraction of Vp, respectively. In general, g is not equal to f. The value of f and g is based on the amount of H2O. Alpha (α) is the isotopic fractionation factor between liquid and vapor phase in terms of D/H and 18O/16O ratios (Horita and Wesolowski, 1994). Beta (β) is the distribution coefficient between vapor and liquid phase in terms of CO2/H2O ratio (Giggenbach, 1980). Equations 4, 5, and 6 describe the conservation of enthalpy, isotopic ratio, and the amount of CO2, respectively. Equations 7 and 8 describe the equilibrium distribution of stable isotope and CO2, respectively, between Vp and Lp. Combing Eqs. 4 through 8, the isotopic ratio and CO2/H2O ratio for Vp can be calculated. As a result of the calculation, the isotopic ratio of Vp is represented by a line in Figure 11. Because the degree of freedom is left in the mixing ratio of Mv and Lw, Vp is expressed as the line. Comparing W, C, and E with the high isotopic ratios near the line of Vp, Vp that is the basis of W, C and E is considered to occur when the mixing ratio of Mv is 0.3–0.4. It seems that this mixing ratio was stable from 2014 to 2018.
The isotopic ratios of S and M are similar. The positions of S and M are clearly different from W, C and E. Although the similarity in isotopic ratios between S and M, they have quite different CO2/H2O ratios (Figure 12). By considering the CO2/H2O ratio in addition to the isotopic ratio, the formation mechanism of S and M is elucidated. In Figure 12, the scaled CO2 fraction is taken on the horizontal axis. The scaled CO2 fraction is defined by the following equation.
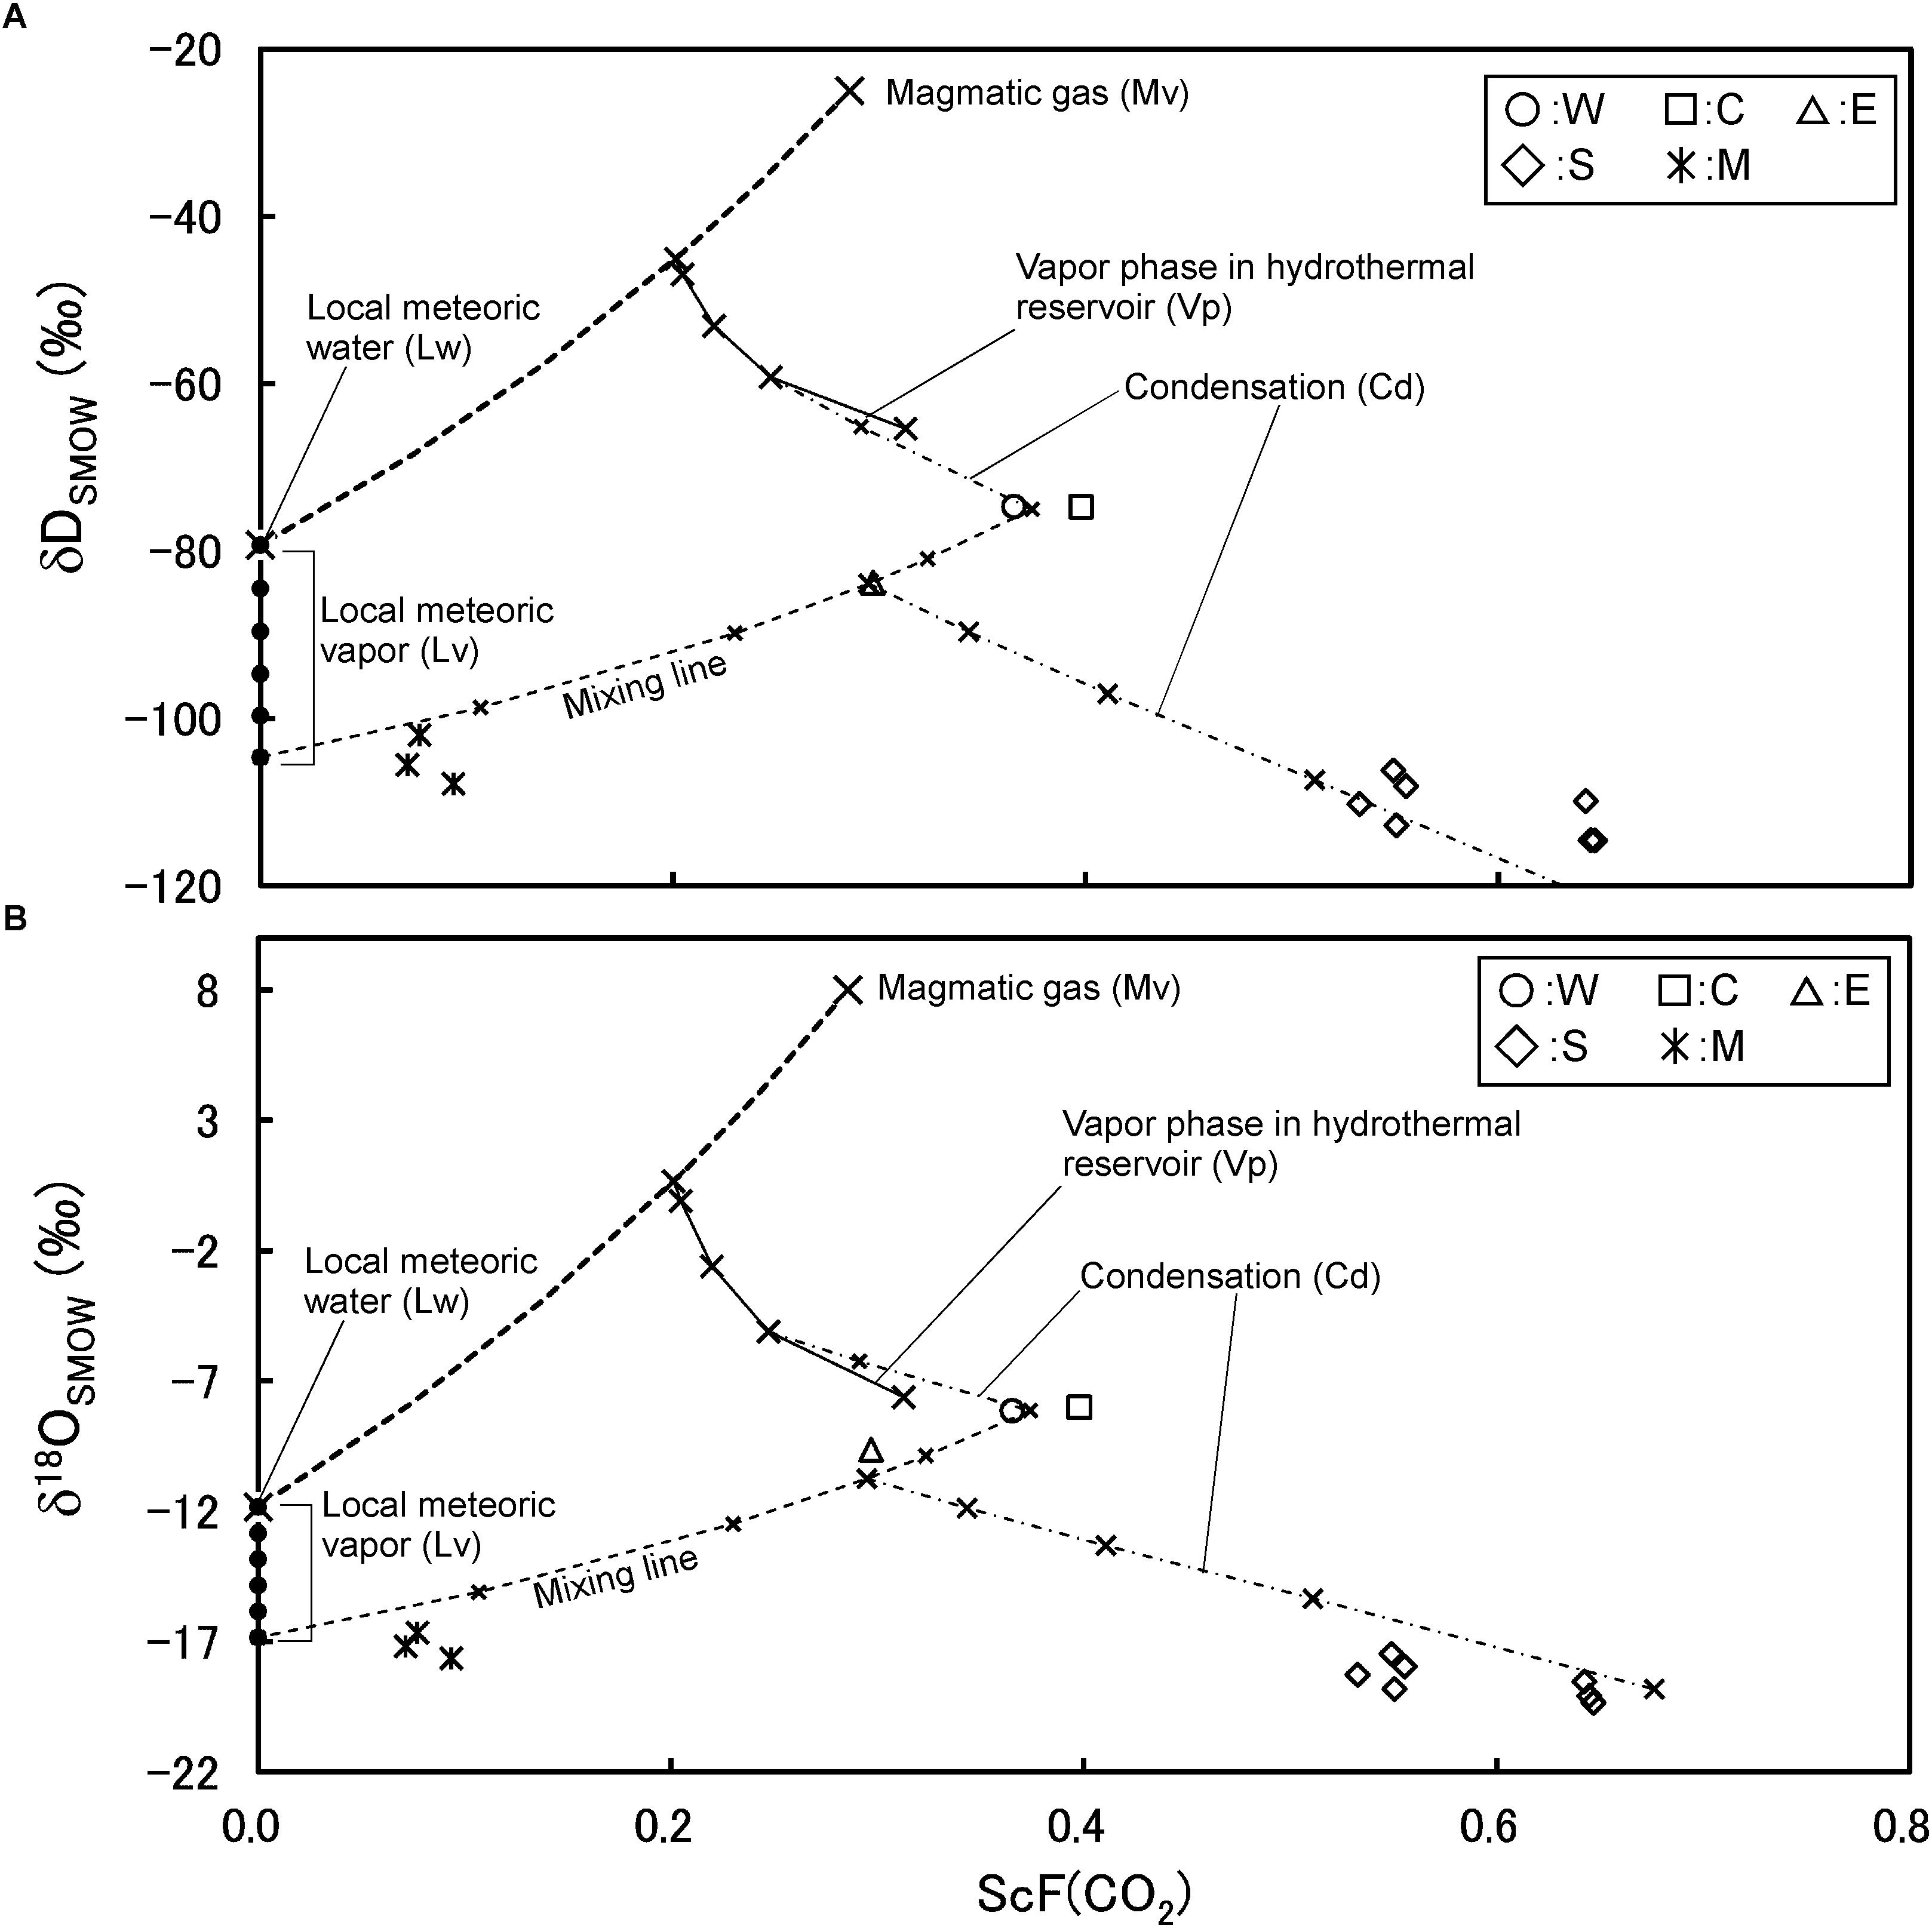
Figure 12. Correlation between isotopic ratios and CO2/H2O molar ratio for fumarolic gasses and modeled vapor phase. ScF(CO2) is the scaled CO2 fraction in H2O-CO2 binary system.
where C is the CO2/H2O molar ratio. In Figures 12A,B, the vertical axis shows δD and δ18O, respectively. First, the vapor (Vp) in reservoir condensed slightly, then mixed with a water vapor generated from the local meteoric water (Lv). A groundwater circulating in crust could be heated conductively. The groundwater gets enthalpy through the heating. The existence of Lv in Kusatsu Shirane volcano was demonstrated by Ohwada et al. (2003). The fumarolic gas S is considered to have formed from the mixture followed by a heavy condensation. The fumarolic gas M has the CO2 concentration much lower than that of S. The low CO2 concentration is due to the large mixing fraction of Lv. After the mixing little condensation took place. Some arbitrariness remains in the above model such as, the temperature of Vp and Lp, the exact isotopic ratio of Lv etc. However, this model successfully demonstrates the isotopic ratio and the CO2/H2O ratio of all the fumarolic gasses of Kusatsu Shirane volcano. In the model, a single magmatic gas (Mv) is required with the interaction of local meteoric water and the condensation of water vapor.
Magma Hydrothermal System Beneath Kusatsu Shirane Volcano
Figure 13 schematically shows the estimated magma hydrothermal system in Kusatsu-Shirane volcano. First, there is a single degassing magma emitting magmatic gasses (Mv) through the sealing zone. Mv mixes with the cold groundwater with meteoric origin (Lw), then vapor (Vp) and thermal water (Lp) are generated in hydrothermal reservoir. As shown in Figures 7, 9, the fumarolic gas at the point M is significantly affected by atmospheric components relative to the fumarolic gas at the point W, C, E and S. As shown in Figure 8, the fumarolic gasses at the points M and S are enriched in CH4 relative to the gasses at W, C and E. There is a compositional similarity among the gasses at W, C and E, suggesting the fumarolic gasses W, C and E are derived from a common hydrothermal reservoir. The compositional difference among the fumarolic gas at M, S and the group of W, C and E suggests the existence of individual hydrothermal reservoir for the gasses at S and M. In total, three reservoirs are necessary at Kusatsu-Shirane volcano. The vapor in hydrothermal reservoir beneath Crater Yugama discharges at surface as fumarolic gas after receiving a vapor condensation. The vapor in the reservoir beneath fumarole S is mixed with Lv and then appears on the ground surface after a heavy vapor condensation near the surface. The vapor in the reservoir beneath fumarole M undergoes mixing with a large fraction of Lv then appears on the surface as fumarolic gas. The fumarolic gas M is highly affected by the atmospheric N2 and Ar (Figures 7, 9), which were carried by the meteoric water vapor (Lv).
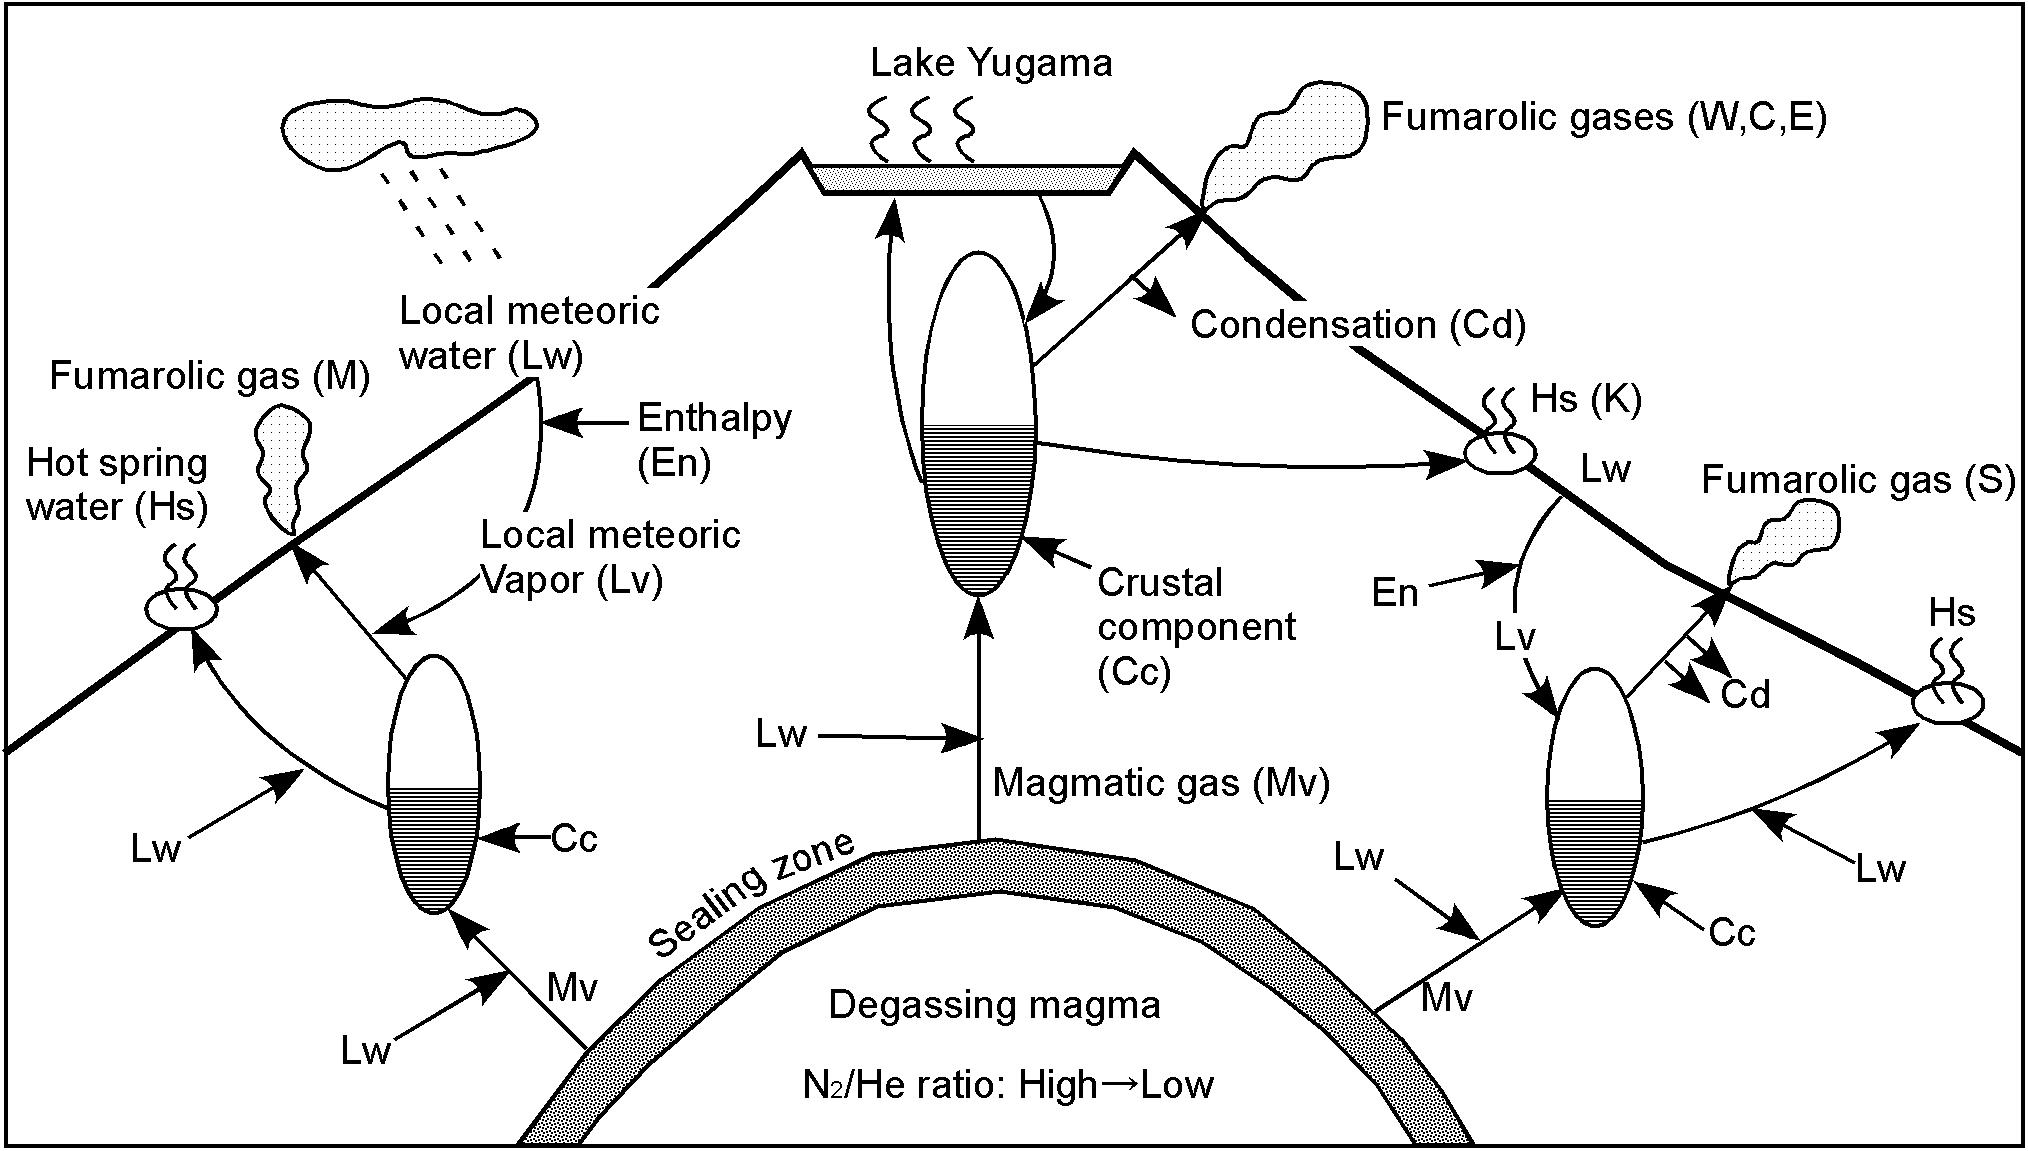
Figure 13. Conceptual model for the magma hydrothermal system at Kusatsu-Shirane volcano.
Conclusion
As a result of repeated collecting and analyzing fumarolic gas at Kusatsu Shirane volcano, a close relationship was found between the seismic activity and the chemical composition of fumarolic gas near the summit (W, C, and E). When seismic activity was active, He and CO2 increased, and when seismic activity fell, CH4 and N2 increased. These components increase and decrease in response to the injection of magmatic gas to the hydrothermal reservoir. The N2/He ratio of the fumarolic gas near the summit varies with two factors. When the crustal component is added to the hydrothermal reservoir, this ratio rises. As magma degassing progresses, this ratio decreases inversely. It is estimated that the fumarolic gasses of Kusatsu-Shirane volcano are generated by a single magmatic gas with the interaction of meteoric groundwater. The fumarolic gas (S) at the eastern slope has a relatively high CO2 concentration due to considerable vapor condensation. The fumarolic gas (M) on the western slope contains CO2 with low concentration due to the large contribution of water vapor generated from a meteoric groundwater, consistent to the high concentration of atmospheric N2 and Ar. These data suggest that at Kusatsu-Shirane volcano the activation of seismicity was synchronized with the increase of magmatic components in fumarolic gas. It is postulated that the injection of magmatic gas increased the fluid pressure in the reservoir, which triggered the seismicity. The injection would be triggered by a break of the sealing zone surrounding the degassing magma. The injection of magmatic gas can be detected by monitoring the composition of the fumarolic gas, thus giving the possibility to forecast any future seismicity.
Author Contributions
TO drafted the manuscript. TO, MY, KN, and NN sampled fumarolic gasses and analyzed them. UT, MI, and RS analyzed fumarolic gas samples. All authors read and approved the final manuscript.
Funding
This research was supported by the Japanese Ministry of Education, Culture, Sports, Science and Technology, under grant of the Integrated Program for Next Generation Volcano Research and Human Resource Development 2016 to 2018, also under its Earthquake and Volcano Hazards Observation and Research Program 2015 to 2018, the Japan Society for the Promotion of Science (JSPS) KAKENHI Grant Number 15K12485 in 2015 to 2017, the Earthquake Research Institute, The University of Tokyo Joint Usage/Research Program 2015 to 2018, and the General Research Institute of Tokai University 2016 to 2018.
Conflict of Interest
The authors declare that the research was conducted in the absence of any commercial or financial relationships that could be construed as a potential conflict of interest.
Acknowledgments
We sincerely thank the funders for their funding support for this research, the reviewers OV and DR for their efforts in reviewing and improving the quality of the manuscript, and the editor FT and Dr. Valerio Acocella for handling the editorial process.
References
Barberi, F., Bertangnini, A., Landi, P., and Principe, C. (1992). A review on phreatic eruptions and their precursors. J. Volcanol. Geotherm. Res. 52, 231–246. doi: 10.1016/0377-0273(92)90046-g
Carroll, M. R., and Webster, J. D. (1994). Solubilities of sulfur, noble gases, nitrogen, chlorine, and fluorine in magmas. Volatiles in magmas, Mineralogical society of America. Rev. Mineral. 30, 231–278.
Fournier, R. O. (1999). Hydrothermal processes related to movement of fluid from plastic into brittle rock in the magmatic-epithermal environment. Econ. Geol. 94, 1193–1212.
Giggenbach, W. F. (1975). A simple method for the collection and analysis of volcanic gas samples. Bull. Volcanol. 39, 132–145. doi: 10.1007/bf02596953
Giggenbach, W. F. (1980). Geothermal gas equilibria. Geochim. Cosmochim. Acta 44, 2021–2032. doi: 10.1016/0016-7037(80)90200-8
Giggenbach, W. F. (1996). “Chemical composition of volcanic gases,” in Monitoring and Mitigation of Volcano Hazards, eds R. Scarpa, and R. I. Tilling, (Berlin: Springer), 221–256. doi: 10.1007/978-3-642-80087-0_7
Giggenbach, W. F. (1997). “The origin and evolution of fluids in magmatic-hydrothermal systems,” in Geochemistry of Hydrothermal Ore Deposits, ed. H. L. Barnes, (Hoboken, NJ: John Wiley & Sons), 737–796.
Global Volcanism Program (2013). Smithonian Institution, National Museum of Natural History. Available at: https://volcano.si.edu/
Hayakawa, Y., and Yui, M. (1989). Eruption history of the Kusatsu Shirane Volcano. Quat. Res. 28, 1–17. doi: 10.4116/jaqua.28.1
Horita, J., and Wesolowski, D. J. (1994). Liquid-vapor fractionation of oxygen and hydrogen isotopes of water from the freezing to the critical temperature. Geochim. Cosmochim. Acta 58, 3425–3437. doi: 10.1016/0016-7037(94)90096-5
Humbert, F., Libourel, G., Marty, B., and France-Lanord, C. (1998). “Nitrogen solubility in silicate melts as a function of oxygen fugacity and melt composition,” in Proceeding of the Goldschmidt Conference Toulouse, Vandœuvre-lès-Nancy, 667–668. doi: 10.1180/minmag.1998.62a.2.18
Kaneko, T., Shimizu, S., and Itaya, T. (1991). K-Ar ages of the Quaternary volcanoes in the Shin-etsu highland area, central Japan, and their formation history. Bull. Earthq. Res. Inst. Univ. Tokyo 66, 299–332.
Kita, I., Nitta, K., Nagao, K., Taguchi, S., and Koga, A. (1993). Difference in N/Ar ratio of magmatic gases from northeast and southwest Japan: new evidence for different states of plate subduction. Geology 21, 391–394.
Minakami, T., Matsusita, K., and Utibori, S. (1942). Explosive activities of volcano Kusatsu-Shirane during 1938-1942. (Part-II). Bull. Earthq. Res. Inst. Univ. Tokyo 20, 505–526.
Ohba, T., Hirabayashi, J., and Nogami, K. (1994). Water, heat and chloride budgets of the crater lake, Yugama at Kusatsu-Shirane volcano, Japan. Geochem. J. 28, 217–231. doi: 10.2343/geochemj.28.217
Ohba, T., Hirabayashi, J., and Nogami, K. (2000). D/H and 18O/16O ratios of water in the crater lake at Kusatsu-Shirane volcano, Japan. J. Volcanol. Geotherm. Res. 97, 329–346. doi: 10.1016/s0377-0273(99)00169-9
Ohba, T., Hirabayashi, J., and Nogami, K. (2008). Temporal changes in the chemistry of lake water within Yugama crater, Kusatsu-Shirane volcano, Japan: implications for the evolution of the magmatic hydrothermal system. J. Volcanol. Geotherm. Res 178, 131–144. doi: 10.1016/j.jvolgeores.2008.06.015
Ohba, T., Sawa, T., Taira, N., Yang, T. F., Lee, H. F., Lan, T. F., et al. (2010). Magmatic fluids of Tatun volcanic group, Taiwan. Appl. Geochem. 25, 513–523. doi: 10.1016/j.apgeochem.2010.01.009
Ohwada, M., Ohba, T., Hirabayashi, J., Nogami, K., Nakamura, K., and Nagao, K. (2003). Interaction between magmatic fluid and meteoric water, inferred from 18O/16O and 36Ar/H2O ratios of fumarolic gases at the Kusatsu Shirane volcano, Japan. Earth Planets Space 55, 105–110. doi: 10.1186/bf03351737
Ossaka, J., Ossaka, T., Oi, T., Kikawada, K., Yamano, M., Hukuhara, H., et al. (1997). Volcanic activity of Kusatsu-Shirane volcano, Gunma, and secular change in water quality of crater lake, Yugama. Chikyukagaku 31, 119–128.
Ossaka, J., Ozawa, T., Nomura, T., Ossaka, T., Hirabayashi, J., Takaesu, A., et al. (1980). Variation of chemical compositions in volcanic gases and waters at Kusatsu-Shirane Volcano and its activity in 1976. Bull. Volcanol. 43, 207–216. doi: 10.1007/bf02597622
Ozawa, T. (1968). Chemical analysis of volcanic gases: I. Chemical analysis of volcanic gases containing water vapor, hydrogen chloride, sulfur dioxide, hydrogen sulfide, carbon dioxide, etc. Geochem. Int. 5, 939–947.
Richet, P., Bottinga, Y., and Javoy, M. (1977). A review of hydrogen, carbon, nitrogen, oxygen, sulphur, and chlorine stable isotope fractionation among gaseous molecules. Ann. Rev. Earth Planet. Sci. 5, 65–110. doi: 10.1146/annurev.ea.05.050177.000433
Sano, Y., Hirabayashi, J., Ohba, T., and Gamo, T. (1994). Carbon and helium isotopic ratios at Kusatsu Shirane Volcano, Japan. Appl. Geochem. 9, 371–377. doi: 10.1016/0883-2927(94)90059-0
Sano, Y., Takahata, N., Nishio, Y., Fischer, T. P., and Williams, S. N. (2001). Volcanic flux of nitrogen from the Earth. Chem. Geol. 171, 263–271. doi: 10.1016/s0009-2541(00)00252-7
Sugimura, A. (1960). Zonal arrangement of some geophysical and petrological features in Japan and its environs. J. Fac. Sci., Univ. Tokyo Sec. II 12, 133–153.
The Japan Society of Mechanical Engineers [JSME] (1999). Steam Table, Japan Society of Mechanical Engineers. Tokyo: JSME, 201.
Tsunogai, U., Kamimura, K., Anzai, S., Nakagawa, F., and Komatsu, D. (2011). Hydrogen isotopes in volcanic plumes: tracers for remote temperature sensing of fumaroles. Geochim. Cosmochim. Acta 75, 4531–4546. doi: 10.1016/j.gca.2011.05.023
Keywords: volcanic gas, seismic activity, hydrothermal system, magma, He
Citation: Ohba T, Yaguchi M, Nishino K, Numanami N, Tsunogai U, Ito M and Shingubara R (2019) Time Variation in the Chemical and Isotopic Composition of Fumarolic Gasses at Kusatsu-Shirane Volcano, Japan. Front. Earth Sci. 7:249. doi: 10.3389/feart.2019.00249
Received: 02 October 2018; Accepted: 05 September 2019;
Published: 24 September 2019.
Edited by:
Franco Tassi, University of Florence, ItalyReviewed by:
Dmitri Rouwet, National Institute of Geophysics and Volcanology (INGV), ItalyOrlando Vaselli, University of Florence, Italy
Copyright © 2019 Ohba, Yaguchi, Nishino, Numanami, Tsunogai, Ito and Shingubara. This is an open-access article distributed under the terms of the Creative Commons Attribution License (CC BY). The use, distribution or reproduction in other forums is permitted, provided the original author(s) and the copyright owner(s) are credited and that the original publication in this journal is cited, in accordance with accepted academic practice. No use, distribution or reproduction is permitted which does not comply with these terms.
*Correspondence: Takeshi Ohba, volcano.ohba@gmail.com; takeshi_ohba@tokai-u.jp