Evolution From Past to Future Conditions of Fast Ice Coverage in James Bay
 Wael Taha1
  Maryse Bonneau-Lefebvre
 Arian Cueto Bergner
 Alain Tremblay
- 1Lasalle | NHC Inc., LaSalle, QC, Canada
- 2Hydro-Québec, Montreal, QC, Canada
Fast ice is often used by coastal communities in the James Bay area for transportation in winter using snowmobiles. Therefore, the extent of fast ice along the James Bay coastline is important for land use and any changes to these extents may have significant impacts on the lifestyles of local communities. The eastern coastline has experienced changes in recent decades that might have affected the ice processes, namely hydrologic modifications due to hydroelectric development by Hydro-Québec along with climatic changes that have been observed worldwide. A statistical analysis in the form of summarized ice charts of the ice extents in the middle of winter have been compiled for the past four decades to highlight any recent changes in ice coverage using data from satellite imagery and ice charts produced by the Canadian Ice Service (CIS). A statistical analysis has also been carried out on the freeze-up and breakup dates using historical data. Moreover, a statistical analysis of hydrological data and climatic data has been carried out to determine the long-term and short-term trends in the parameters influencing the ice processes. After testing sensitivity of the past ice regime to climatic and hydrological parameters, the trends detected in the extents of fast ice, as well as freeze-up and breakup conditions, have been correlated with climatic parameters. Using the dominant parameters, a simplified model of the extents of fast ice has been developed, as well as criteria to determine freeze-up and breakup dates. Air temperature projections have also been obtained for two greenhouse gas emissions scenarios using global climate model results to establish future climatic conditions. Finally, projections of the fast ice regime around the year 2050 have been developed to determine a long-term trend covering both historical changes and future conditions. We expect around the year 2050 a recession of the landfast ice coverage of several kilometers, a delay of 1–3 weeks of the freeze-up dates and an advance of 2–10 days of the breakup dates in comparison to the period of 1998–2016 in the James Bay area.
Introduction
Fast ice is often used by coastal communities in the James Bay area for transportation in winter using snowmobiles, providing an alternative to permanent roads and allowing the access to hunting grounds otherwise unreachable. Therefore, the extent of fast ice along the James Bay coastline is important for land use and any changes to these extents may have significant impacts on the lifestyles of local communities. This issue is not only relevant to Cree and Inuit communities of James and Hudson Bays, but also to other communities living in arctic climate.
In addition to climatic changes that have been observed worldwide, hydroelectric development by Hydro-Québec have resulted in hydrologic modifications. Some or all of the above changes might have affected the ice processes along the eastern coastline of James Bay in the recent decades.
The James Bay Hydroelectric Project, one of the largest hydroelectric systems in the world, operated by Hydro-Québec, was built during three major phases over more than four decades by Hydro-Québec and its subsidiary Société d’énergie de la Baie James. Locations of the main generating stations are presented in Figure 1. The first phase, constructed between 1971 and 1985, first consisted of the construction of the access road to the James Bay territory and La Grande 2 generating station (called now Robert-Bourassa). Three generating stations (Robert-Bourassa, La Grande-3, and La Grande-4) were constructed for a combined installed capacity of 10,800 MW as well as five reservoirs of a total area of 11,300 km2 including diversion of the Eastmain River and its main tributaries: the Opinaca and Petite Opinaca rivers (1975–1980) and the Caniapiscau River toward the La Grande River waterway (1975–1983). During the second phase, five generating stations (La Grande-1, La Grande-2A, Laforge-1, Laforge-2, and Brisay) were built between 1988 and 1996, adding a total installed capacity of 5,200 MW along with three reservoirs of a total area of 1,600 km2. Finally, the third phase, constructed between 2002 and 2012, consisted of the partial diversion of the Rupert River into the Eastmain reservoir and subsequently into the La Grande watershed and the construction of more generating stations (Eastmain-1, Eastmain-1A, and Sarcelle) for an additional combined capacity of 1,370 MW. The Eastmain reservoir, also constructed during the third phase of the project, has an area of approximately 600 km2.
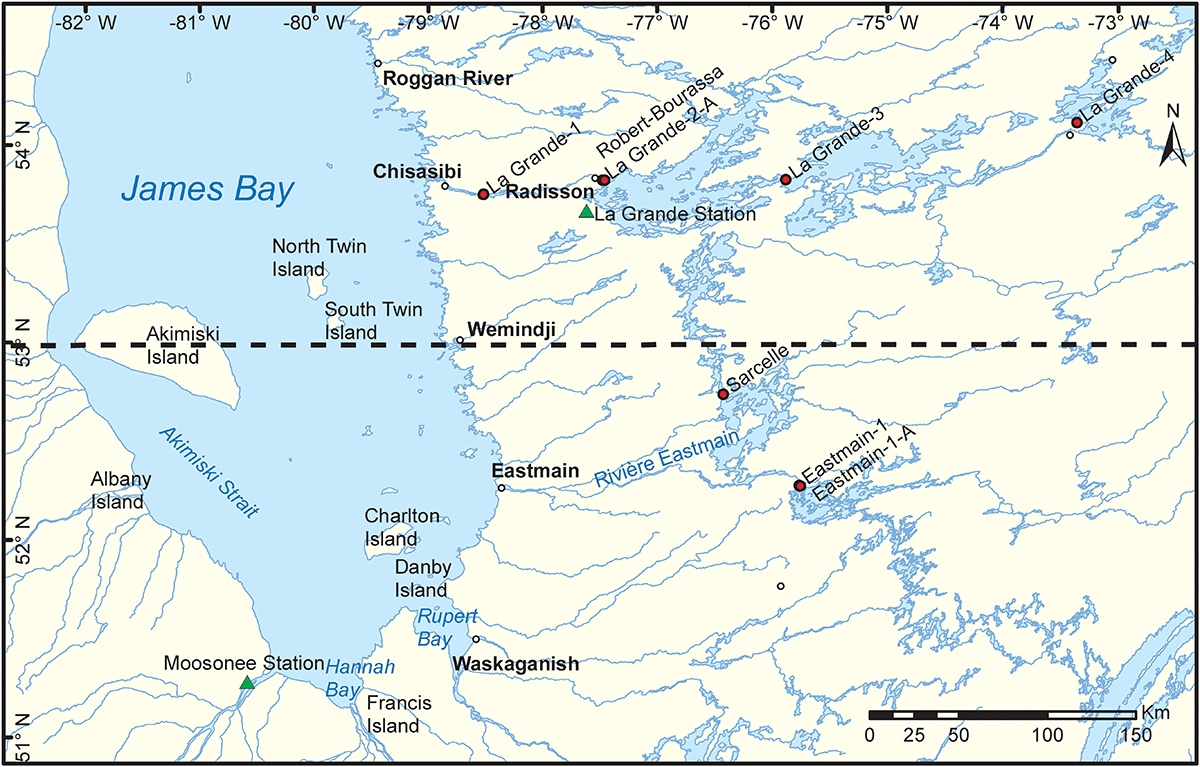
Figure 1. James Bay study area. The red dots locate the generating stations constructed during the James Bay hydroelectric Project between 1979 and 2012 (Laforge-1, Laforge-2, and Brisay stations are located further upstream on La Grande river and are outside the extent of the figure). The green triangles locate the meteorological stations. The black dashed line illustrates the boundary between the “north” and the “south” area of the study.
The objective of this study was, first and foremost, to highlight any changes to the extents of landfast ice along the James Bay coast, to understand the ice processes in James Bay and establish their long-term evolution over the period from 1970 to 2016 in order to determine whether changes to the extents of landfast ice are caused by climatic changes or manmade hydrologic impacts caused by hydroelectric production. A detailed account of this first phase was previously presented at the 19th CRIPE (Committee on River Ice Processes and the Environment) Workshop on the Hydraulics of Ice Covered Rivers in 2017 (Taha et al., 2017). Secondly, the study aimed at correlating quantitatively the ice regime to meteorological parameters based on historical data. Using these correlations, projections of glaciological winters by the year 2050 can be determined to provide a picture of the future fast ice regime.
The study area covers the entire James Bay area (Figure 1), bounded to the south by Hannah Bay and Rupert Bay, to the north by Cap Jones (on the eastern coast, in Québec) and Polar Bear Provincial Park (on the western coast, in Ontario).
The literature review performed allowed for a better understanding of ice dynamics in Rupert Bay, as well as the identification of certain elements related to ice dynamics in James Bay and the estuary of the La Grande River. No specific information was found on the ice dynamics surrounding the estuary of the Eastmain River.
Ice processes in James Bay have been studied as early as the 1970s by El Sabh and Koutitonsky (1974). However, most of the work has been focused on overall ice concentrations without much distinction between the extents of ice floes and landfast ice. Michel (1973) has also described the oceanographic and hydrologic characteristics of James Bay. The Coriolis force drives a circular oceanic current that brings salt water from the northwestern tip down to the southern part along the western shoreline and then back up along the eastern shoreline exiting the bay from the northeastern tip. The current gets supplied with fresh water passing through the river estuaries and exits the bay with water at a slightly lower salinity. Mixing between salt and fresh water is driven by the turbulence produced by the wind and waves which implies that fresh water plumes are more concentrated near the surface under the ice cover in winter. The tidal currents are also an important parameter, although tidal movements are damped by up to 65% during winter in the southern part of James Bay due to the presence of the coastal ice cover (Michel and Doyon, 1991).
The stages of fast-ice development can be summarized into freeze-up, mid-winter and breakup. These three stages are defined as follows:
• Freeze-up of fast ice: relatively short period of highly varying changes during which ice formation reaches roughly 50% of the maximum area of fast ice coverage during a particular winter;
• Mid-winter: the long period of relative stability during which the ice coverage changes very slowly and attains its maximum area near the end of this period; and
• Breakup of fast ice: relatively short period of highly varying changes when the ice melts, shrinking to roughly 50% of the maximum area recorded during a particular winter.
Michel (1973) also describes the ice regime in James Bay. James Bay freezes up in early December. The initial ice cover forms in coves and in river estuaries over fresh water where ice formation requires less heat loss. The coastal ice cover then forms by tiling of ice floes that are drifting under the action of wind and currents. Landfast ice is generally smooth with thicknesses that can reach values of around one meter at the end of winter, but rough ice ridges reaching up to several meters high can also form when the floes are pushed against the leading edge by winds and currents. In the middle of the bay, high concentrations of ice floes with a submetric thickness keep drifting with the wind and currents from January to May. In spring, the coastal landfast ice is dislocated from south to north by the action of wind and currents under warm conditions. It is not clear, however, which heat source contributing to those warm conditions (air temperature, warm fresh water, and solar radiation) is predominant during breakup.
The La Grande River estuary has been studied from the 1970s because of hydroelectric development. The La Grande River is the largest river on the east coast of James Bay and has experienced an increase in winter flows throughout the decades. The Société d’énergie de la Baie James (1994) presents a small description of the ice conditions at the La Grande estuary in natural conditions and compares them to the conditions after construction of the La Grande-2 (LG-2) and then La Grande-1 (LG-1) hydroelectric projects. Before 1979, the estuary had a stable ice cover 6 months per year that the local communities used for snowmobiling. After construction of LG-2, warm water from the LG-2 reservoir reduced that period to 3 months with frequent openings during warm spells. The ice cover over the river mouth was deemed unsafe and a bridge was built over the river to replace snowmobiling trails. After construction of LG-1 in 1991, the ice cover at the river mouth became less stable with an increase in flow rates and water temperatures. Messier et al. (Hydro-Québec and Genivar Groupe Conseil Inc., 2005) describes the extent of the coastal landfast ice and its relation to the fresh water plume and specifies that during breakup an opening of 5–8 km in radius forms at the river mouth while the coastal ice cover remains intact. The ice conditions were predicted after partial diversion of the Rupert River toward the La Grande River and showed that the winter flows were likely to increase and the leading edge in the river would be pushed further downstream toward the estuary.
In the southern limit of James Bay, the Rupert Bay is a perfect example of ice formation within a fresh and salt water mixing environment. Michel and Doyon (1991) give a thorough description of the natural ice dynamics in Rupert Bay. Freeze-up occurs from south to north over a period stretching typically from 40 to 950 freezing-degree-days. The first ice patches are formed in tidal flats and low depth areas and then the fresh water sector to the south of Stag Rock freezes over. The mixing middle area between Stag Rock and Stag Island freezes next and finally three open water channels remain open in the maritime northern part of the bay and freeze latter with high concentrations of ice floes that are transported by tidal currents and jam into the channels. Rupert Bay remains completely covered in ice throughout winter with a predominance of smooth ice in the southern part and hummocked ice in the northern part. During spring time, the creek and river mouths lose their ice covers first due to the supply of high flows of warm fresh water. Open water also appears in tidal flats and low depth areas while the northern channels in the maritime part open up. The southern part of the bay then opens up completely due to the high supply of warm fresh water. The remaining ice in the bay thaws completely by early June. The springtime processes seem to be less influenced by air temperatures as opposed to freeze-up but are more closely correlated to total heat budget ranging from 43 to 294 MJ/m2.
In James Bay, the main effects of climate change on ice conditions would be a delay in freeze-up and a 35–50% reduction in ice thicknesses (Senneville and St-Onge Drouin, 2013). However, these projections were made using a numerical ice concentration and volume model, which does not take into account the dynamics of fast ice formation. Empirical correlations based on fast ice observations have indicated that the ice-covered period would be reduced by roughly 30 days on average along the east coast of Hudson Bay by 2070 (Senneville and St-Onge Drouin, 2013).
Local bathymetry was also found to be an important parameter in the formation and stabilization of landfast ice in arctic regions (Mahoney et al., 2007; Selyuzhenok et al., 2015). Mahoney et al. (2007) identify that landfast ice along the coast of northern Alaska and northwestern Canada often extends to the location of isobaths around 20 m depth, showing evidence of the importance of grounded ridges in the stabilization of the landfast ice cover. However, no specific information was found about a correlation between local bathymetry and landfast ice extent in the Hudson Bay and James Bay area. This may be investigated in future research.
Materials and Methods
Methodology
Analysis of Historical Data
First and foremost, the present study consisted of consolidating all available data, both publicly available and from within Hydro Quebec archives, related to landfast ice coverage in the James Bay area since 1970. An exhaustive literature review was first performed, followed by the collection of geographic data portraying fast ice coverage during the 1979–2016 period. Geographic data for the period from 1970 to 1978 were unavailable, which was prior to Hydro-Québec’s hydroelectric development in the region and corresponded to the natural conditions of the rivers on the eastern coast of James Bay. For analysis purposes, the 1979–2016 operating phase was divided into two periods, 1979–1997 (referred to as the earlier period) and 1998–2016 (referred to as the recent period). The sources consulted consisted mainly of ice charts produced by the Canadian Ice Service (CIS) and Landsat and MODIS satellite images.
The CIS (Canadian Ice Service [CIS], 2016) produces regional charts showing ice conditions based on the analysis and integration of data from a variety of sources such as satellite images, weather and oceanographic data and ship- and aircraft-based visual observations. The charts describe ice concentrations in fractions ranging from 0/10 to 10/10 (with fast ice having a concentration of 10/10 and open water 0/10), and also show stages of development (new ice, old ice, fast ice, etc.) and ice forms (ice cakes, floes, fast ice, etc.). The regional charts for were consulted for a number of periods. It was produced monthly during the winters of 1979–1980 to 2005–2006 inclusively, then twice a month during the winters of 2006–2007 to 2010–2011 inclusively. Since the winter of 2011–2012, this chart has been produced weekly. It should be noted that the regional chart for Hudson Bay did not always include all of James Bay; before 1997, this map excluded the entire southern part of James Bay, including Rupert Bay and the mouth of the Eastmain River.
Since 1972, Landsat satellites have acquired medium-resolution images of the Earth’s surface. For this study, we consulted images from the Landsat 1 to Landsat 8 satellites, which can be easily obtained through the Earth Explorer interface of the U.S. Geological Survey (USGS, 2017). The images selected from Landsat 1 to 5 (1972–1996) have a 60-m resolution; the images from Landsat 4 and 5 (1987–2012), a 30-m resolution; and the images from Landsat 7 and 8 (2011–2016), a 15-m resolution. Since each Landsat image covers an area of roughly 40,000 km2 and cloud cover sometimes limits the availability of images, an overall picture of the ice cover on James Bay may require combining several images from close but different dates. These images are therefore particularly suited for covering specific areas of interest in the study area or for all of James Bay at times in the winter when changes in ice cover are minimal (February–April). In addition, NASA’s MODIS Terra and Aqua satellites are each equipped with a moderate resolution imaging spectroradiometer, which collect images with a 250-m resolution, covering all of the Earth’s surface every one or 2 days. These images, which are in the public domain, have been available since 2001 on NASA’s Rapid Response database (NASA, 2017a) and since May 2012 on the Worldview interface (NASA, 2017b). MODIS images, which have a lower resolution than Landsat images, were used to fill in the gaps when Landsat images were not available. Despite the large number of MODIS images available (on a nearly daily basis), they are not always usable due to the often-predominant cloud cover. When usable, these images were employed in this study to provide an overview of James Bay since the low resolution is not an issue in analyzing regional ice dynamics at the scale of James Bay.
Using data from satellite imagery and ice charts produced by the CIS, a statistical analysis in the form of summarized ice charts of the fixed ice cover extent observed during mid-winter was performed for the past four decades to highlight any recent changes in fast ice coverage.
A statistical analysis was also carried out on the freeze-up and breakup dates using historical data. Moreover, a statistical analysis of hydrological data and climatic data was performed to determine the long-term and short-term trends in the parameters influencing the ice dynamics such as flows of the main eastern coast rivers, air temperatures characterizing local freezing seasons, solar radiation and maritime storms.
Air temperatures were used to characterize the freezing season, the time of year when ice is present on lakes and rivers. Ice formation, growth (thickening) and breakup on water bodies are processes controlled by the intensity and length of the period when the air temperature is below the freezing point (0°C). For analysis purposes, the freezing season is defined by the number of cumulative freezing-degree-days since the beginning of winter. This calculation can be used to clearly define the dates when the freezing season begins and ends, and its severity, average temperature and duration, so that these characteristics can be compared with those of past freezing seasons.
To define the characteristics of a freezing season, the mean air temperatures between arbitrary dates (October 1–May 31) were added together. These cumulative values increase, reach a peak and then decline as air temperatures fall well below 0°C. The peak, which marks the beginning of the freezing season, is converted into freezing-degree-days by subtracting a constant. The cumulative values then decline as winter temperatures are added, until they reach a minimum value, which corresponds to the end of winter. The absolute value of this minimum allows the severity of the freezing season to be characterized and to be compared with historical trends. The average temperature of the freezing season is equal to the severity divided by the duration.
Given the extent of the study area, data measured at two meteorological stations were used to calculate the freezing indices and solar radiation, namely at La Grande station for the northern part of James Bay and at Moosonee station for the southern part of James Bay. The location of both meteorological stations as well as the boundary delimitating the “north” and the “south” areas of the study are also illustrated in Figure 1.
After testing sensitivity of the past ice regime with respect to climatic and hydrological parameters, the trends detected in the extents of fast ice, as well as freeze-up and breakup conditions, were correlated to meteorological parameters. Using the dominant parameters, a simplified model of the extents of fast ice was developed for the whole James Bay area.
Correlation of Fast Ice Extents to Meteorological Data
In order to estimate the position of the offshoreward fast ice edge over the extent of the study area, the James Bay and the islands coasts were discretized using transects positioned at an interval of approximately 10 km along the James Bay and Akimiski coastlines, 5 km along the North Twin, South Twin, Trodely and Charlton islands coastlines and 2 km along the Weston island coastline. A total of 189 transects perpendicular to the shorelines and covering the maximum extent of the fast ice observed between 1980 and 2016 were created and are detailed in section “Mid-Winter”.
The definition of transitional zones between the islands allowed fast ice to be represented in two different states. As available imagery shows, a fixed ice surface can either cover the entirety of a strait thus connecting two coastlines or two partial coastal ice covers with an open water channel between the shorelines can be formed.
The maximum annual position of the offshoreward fast ice edge observed during mid-winter between 1980 and 2016 was measured along each transect. For each year, the position of the offshoreward fast ice edge along each transect was then associated to the partial freezing index calculated up to the date of the available data source (satellite imagery or ice charts) corresponding to mid-winter of the year in question. As previously mentioned, mid-winter corresponds to the date when the fast ice observed on the available imagery (Landsat, Modis or CIS maps) is at its maximum annual extent.
The positions of the offshoreward fast ice edge at each transect were plotted with respect to the partial freezing index and a linear relationship was adjusted per transect. These relations were used to estimate the maximum fast ice coverage in mid-winter in future conditions.
It must be mentioned that as no bathymetric data was available for the James Bay area, this parameter was not correlated to the extent of landfast ice in the scope of the present study.
Development of Quantitative Criteria for Freeze-Up, Breakup, and Mid-Winter
Unlike historical data, the dates for freeze-up, mid-winter and breakup are not known for future conditions. To identify those dates for future glaciological winters, a set of criteria were established using a complete heat balance that considered solar radiation, wind and air temperature for each historical winter between 1980 and 2016. As no data pertaining to the water temperature of the currents in James Bay was available, the heat transport by global currents in the bay was not taken into account in the heat balance.
A negative heat flux for several consecutive days will result in an ice generation phase and therefore corresponds to the beginning of the freeze-up period (Svensson et al., 1989). Conversely, a positive heat flux for several consecutive days will result in an ice deterioration phase and therefore corresponds to the beginning of the breakup period.
The heat flux Φtotal in W/m2 can be calculated with the simplified formula below (Saucet, 1985, 1998).
where Tair is the average daily air temperature, Twater is the water temperature (estimated at 0°C) and Φsol is the solar radiation heat flux calculated using a model from the National Oceanic and Atmospheric Administration (based on the Bird and Hulstrom formulation, 1981) for the La Grande and Stag Rock stations (Rupert Bay) on an hourly basis and then averaged over a 24 h period. The two constants in the equation above are based on measurements made in Roberval in the Saint-Jean Lake area in Quebec (Saucet, 1985, 1998). These values vary little from one site to another and, because of the lack of values specific to the James Bay area, these same coefficients were used in this study.
The total heat flux (Φtotal) calculated for each glaciological winter was cumulated and set to zero on the day the maximum heat flux is reached in the fall. This calculation quantifies the energy loss (the heat flux integrated over time) required to reach freeze-up, which is the moment when the fast ice coverage reaches 50% of the maximum coverage during mid-winter. The minimum value from this calculation reached during the winter determines the maximum energy that was used to generate ice for a given winter. This cumulative factor can also be used to characterize the amount of energy required to reach the breakup moment, when the fast ice coverage is 50% of the maximum coverage previously reached during mid-winter.
The cumulative heat flux values associated to the freeze-up and breakup dates for each glaciological winter between 1980 and 2016 were analyzed to establish freeze-up and breakup criteria. A similar analysis was also performed to determine a criteria for mid-winter based on the moment of occurrence of the maximum annual cumulative heat loss.
Climate Projections
Projections for future glaciological winters were made using the air temperature variable from the General Circulation Model (GCM) simulations, derived from the Coupled Model Intercomparison Project Phase 5 (CMIP5). The average daily temperature was computed as the average between the maximum and minimum daily temperatures. These climate models are those used by the Intergovernmental Panel on Climate Change (IPCC, 2013). Two standard greenhouse gas emission scenarios were selected for this study:
(1) The RCP 4.5 scenario corresponds to atmospheric emissions moderately reduced by environmental policies and initiatives.
(2) The RCP 8.5 scenario corresponds to atmospheric emissions that continue to follow historical trends.
All climate model simulations have certain biases that need to be corrected (for example, a model that is too hot or too cold for the area of interest) in order to give a good first representation of the historical climate and then to obtain reliable future projection. The Pacific Climate Impacts Consortium (PCIC) provides access to a dozen GCMs for which such bias correction was already performed (PCIC, 2013). Thus, the average daily air temperature data at 2 m above the ground (near surface) for the period of 2040–2060 was obtained from the PCIC for the two scenarios (RCP4.5 and RCP8.5) of 12 GCMs at the La Grande and Moosonee stations. Three GCMs covering the variability of all 12 models were then selected. Such a selection provides a clear picture of likely future projections for glaciological winters at the study site. Based on the future period, the selected models are MRI-CGCM3 (the coldest model), MPI-ESM_LR (the average model), and HadGEM-ES (the warmest model).
Using the future daily average air temperatures and criteria beforehand developed, projections of the characteristics of the future glaciological winters (freeze-up and breakup dates on one hand, and partial and total freezing indices on the other) were computed. Then, projections of the fast ice regime around the year 2050 were finally estimated using the correlations between freezing indices and fast ice extents to establish a long-term trend covering both historical changes and future conditions, and this paper presents the results obtained.
Analysis of Driving Parameters
River Flows
Daily flows of the La Grande River were compiled and compared for the 1979–1997 and 1998–2016 periods. It is observed that the average flows have increased by 16% at the beginning of winter and by approximately 32% during mid-winter as well as the beginning of spring.
In Rupert Bay, a decrease of 18% of the fresh water flow into the bay was observed in comparison to natural conditions that followed the northerly diversion of the Rupert River in 2010. As for the flow of the Eastmain River, today’s average flows represent only 10% of its natural conditions since the partial diversion of the river toward the La Grande River watershed in 1979, but since then, the river has not been subject to any specific modifications (Saucet, 2002). This area is therefore of particular interest and serves as a control case. The flow reductions of both cases were analyzed only for the winter season, a period during which flows are relatively low for natural rivers.
For future conditions, we assumed that the river flows will remain the same as the flows recorded during the 1998–2016 period. Projections of natural runoff and hydroelectric production may be performed as part of a future phase to this work but is not covered by this paper.
Solar Radiation
In order to determine their effect on the evolution of fast ice coverage in James Bay, solar radiation levels measured at the mouth of the La Grande River were compared for the years between 1975 and 2016 (Bird and Hulstrom, 1981). Solar radiation intensity is at its minimum on December 21st at the winter solstice, increases rapidly from mid-January and reaches its maximum in mid-June. For a comparison, in the month of May, the solar radiation intensity is more than five times December’s value. It is also noted that the winter evolution in solar radiation is constant during the past four decades and therefore this parameter is not considered as a change factor.
Air Temperatures
An analysis of the average daily temperatures measured at La Grande on the eastern coast of James Bay and at Moosonee south of James Bay was performed for both the 1979–1997 and 1998–2016 periods (Environment Canada, 2017). An increase of approximately 1°C of the temperatures during winter was observed for both sites during the recent period. Results show shorter and less harsh winters in the 1998–2016 period for both meteorological stations (Figure 2). On average, in comparison with the previous period, the recent years freezing seasons began 9 days later at La Grande and 7 days later at Moosonee and ended a few days earlier for both stations. The variations in the beginning of the freezing seasons is more significant than the ending. This is likely due to the end of the freezing season being dependent on the intensity of solar radiation during spring, which remained constant throughout the decades.
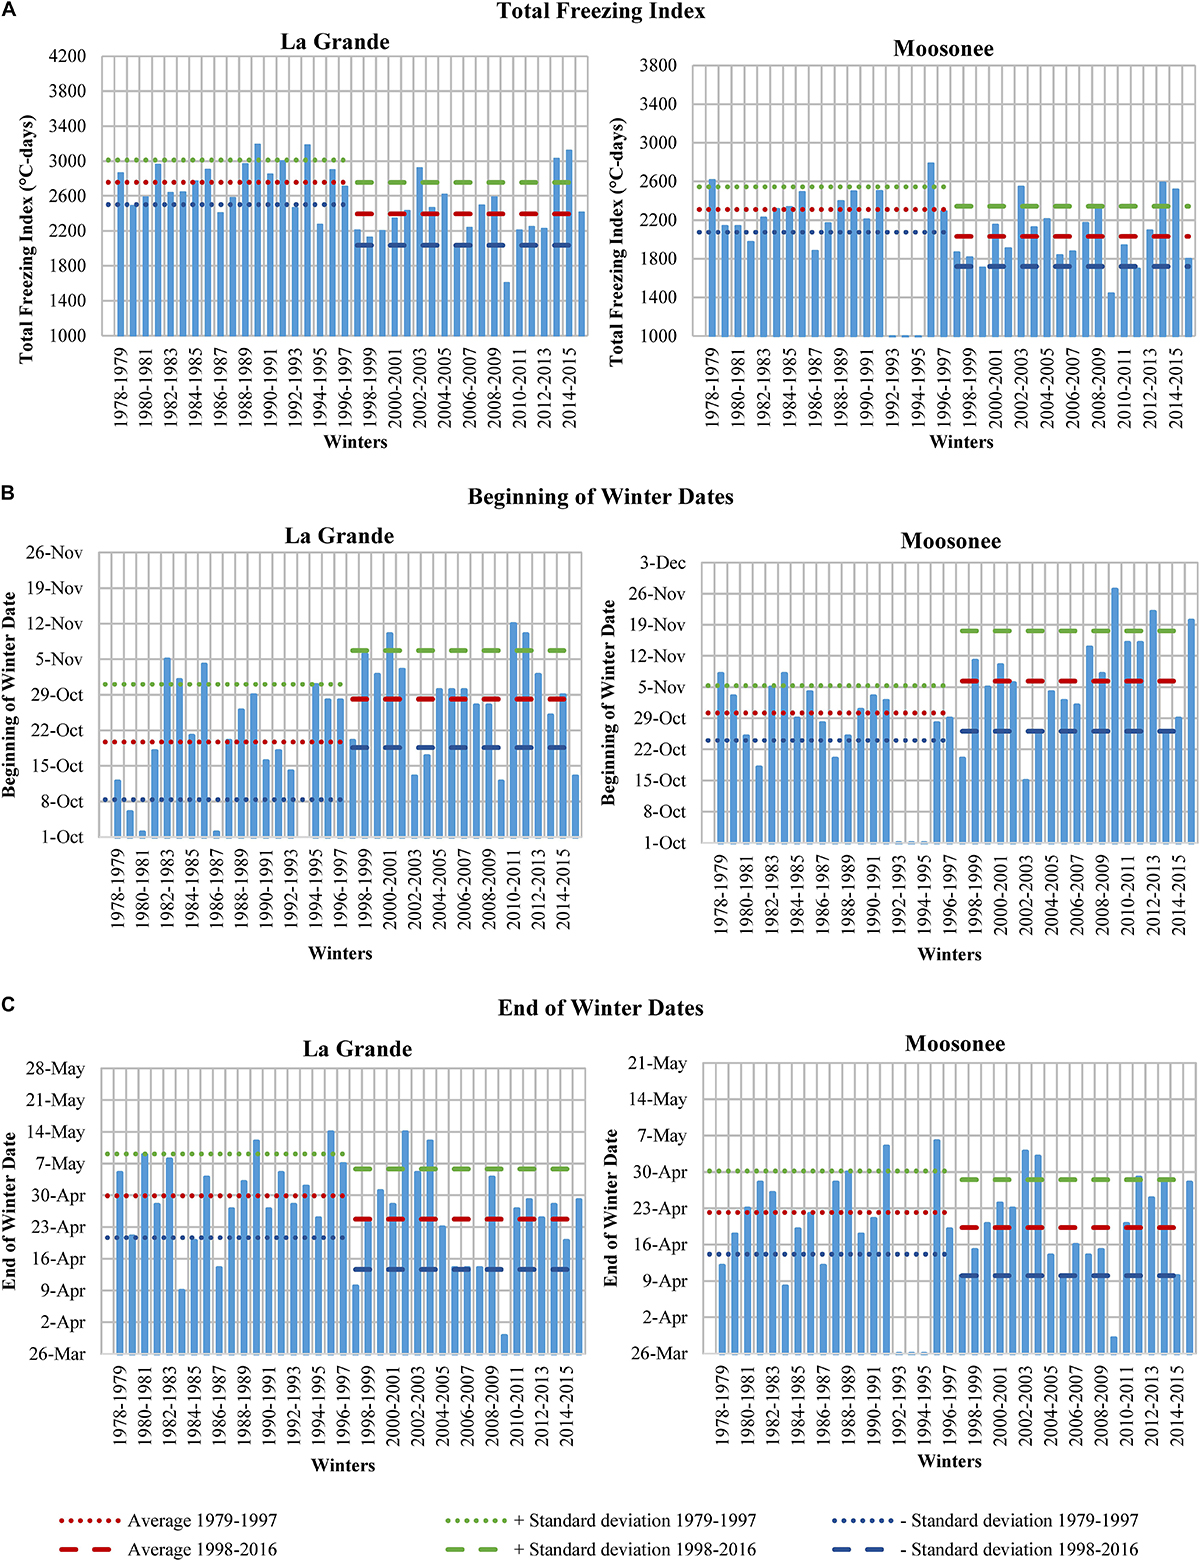
Figure 2. Characteristics of glaciological winters at La Grande (left) and Moosonee (right) from 1979 to 2016. Total freezing index (A), beginning of winter dates (B), and end of winter dates (C) adapted from Taha et al. (2017).
The characteristics of 20 glaciological winters around the year 2050 were calculated with the projections of the average daily temperatures at La Grande and Moosonee stations for the six variants of the future climate (two greenhouse gas emission scenarios and three climate models per scenario). Projections of freezing indices, beginning of winter dates and end of winter dates of the glaciological winters between the years 2040 and 2060 at both meteorological stations are presented in Figures 3, 4.
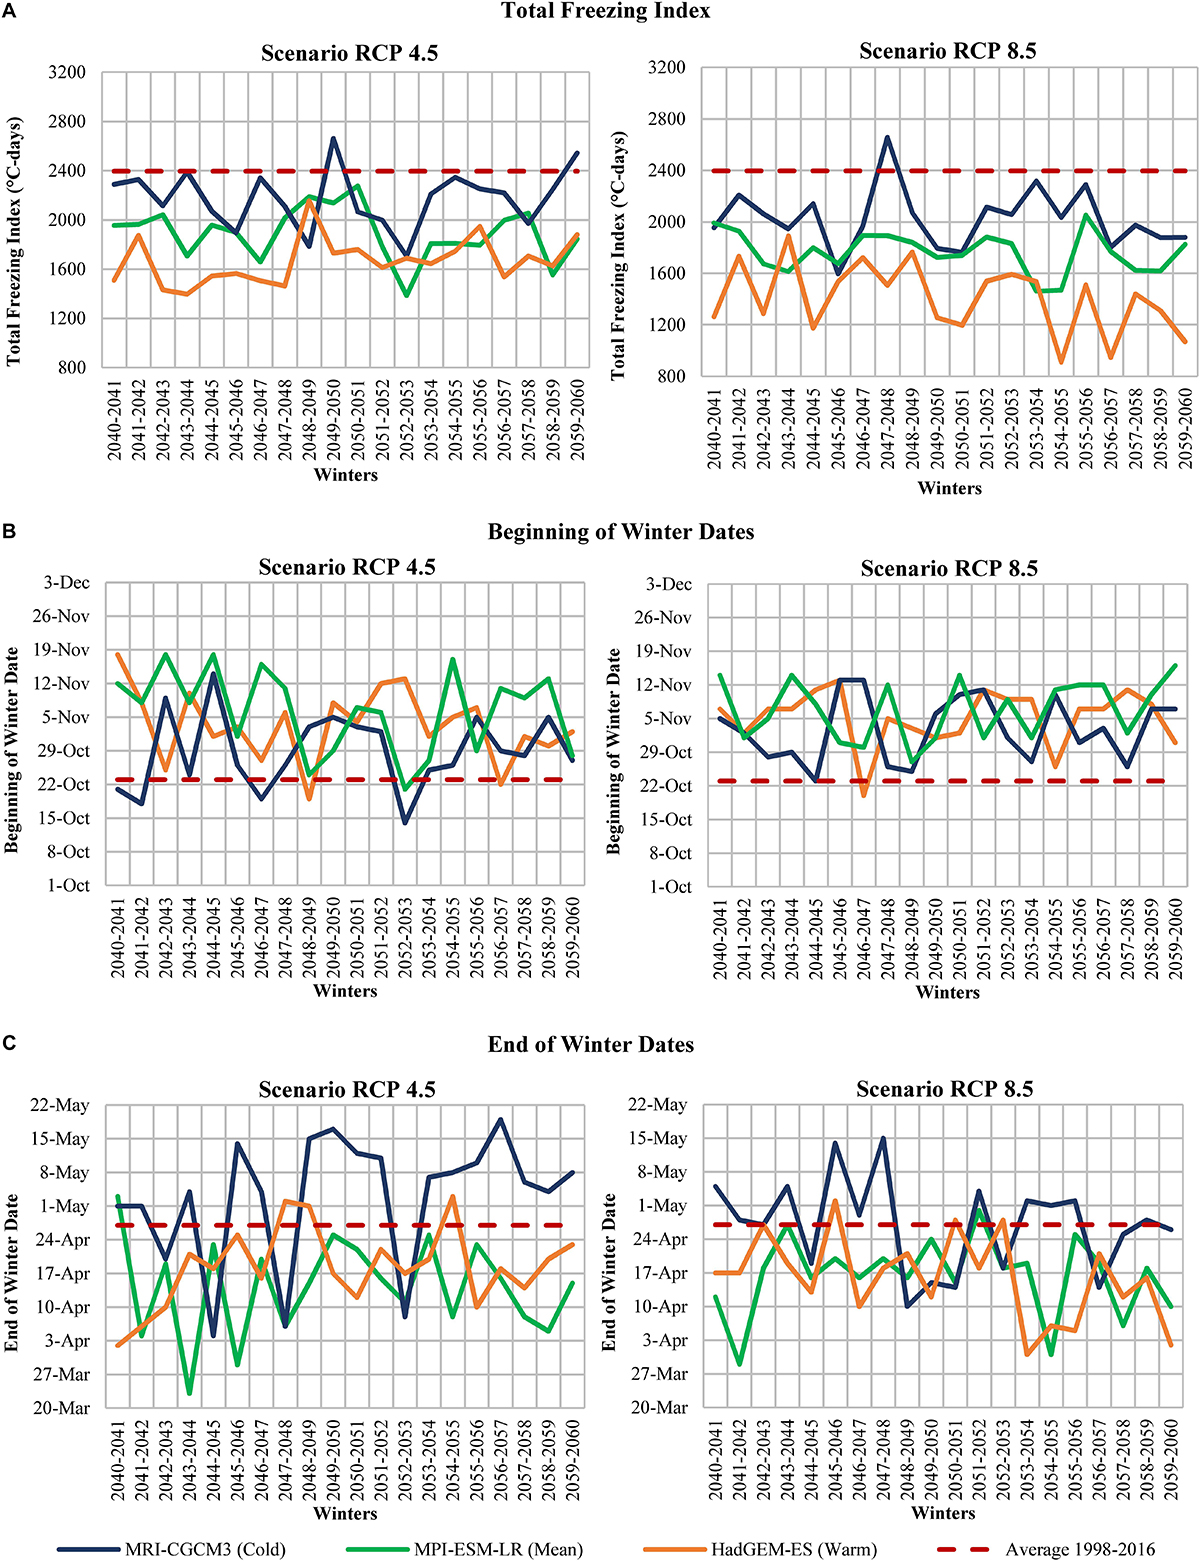
Figure 3. Characteristics of projected glaciological winters at La Grande station for the 2040–2060 period under climatic scenarios RCP4.5 (left) and RCP8.5 (right). Total freezing index (A), beginning of winter dates (B), and end of winter dates (C).
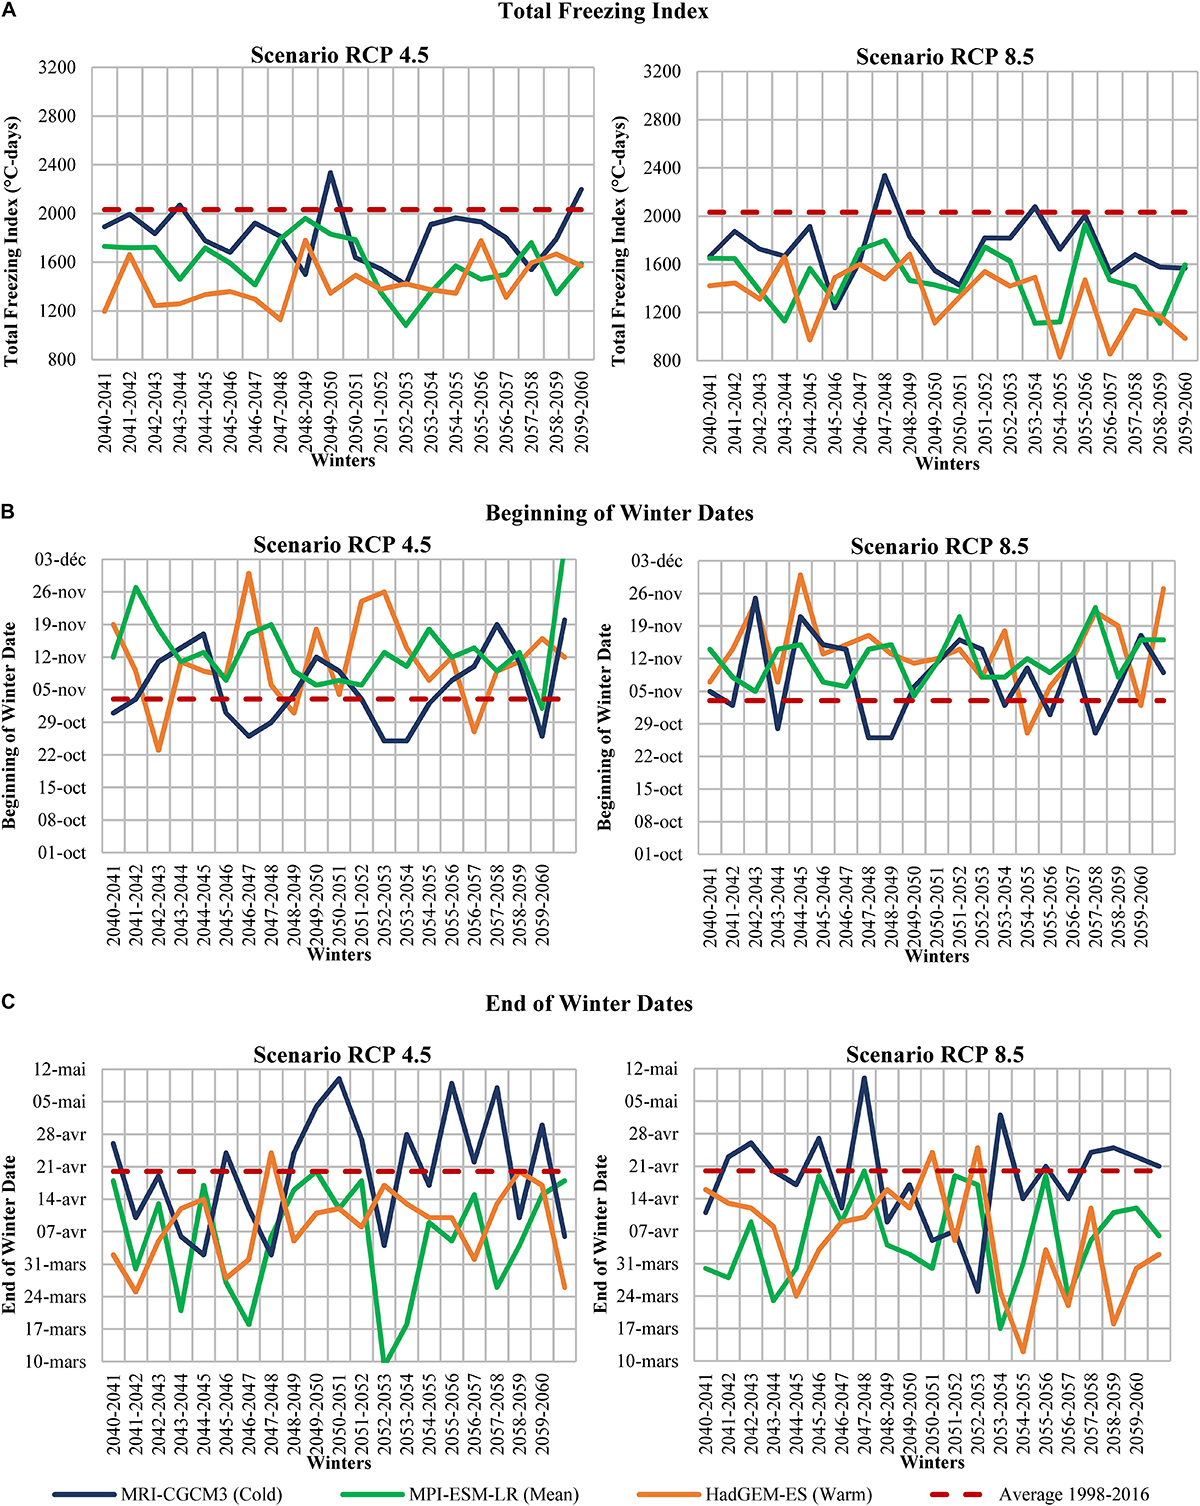
Figure 4. Characteristics of projected glaciological winters at Moosonee station for the 2040–2060 period under climatic scenarios RCP4.5 (left) and RCP8.5 (right). Total freezing index (A), beginning of winter dates (B), and end of winter dates (C).
As illustrated in Figures 3, 4, for most future climate variants, winters between 2040 and 2060 are less harsh and are shorter in comparison to 1998–2016 winters. It results in an expected increase of the temperatures during winter of approximately 2.2°C for the RCP4.5 scenario to 3.0°C for the RCP8.5 scenario at La Grande (compared to −13.4°C for the 1998–2016 period) and of approximately 1.8°C for the RCP4.5 scenario to 2.3°C for the RCP8.5 scenario at Moosonee (compared to −12.4°C for the 1998–2016 period). The future glaciological winters in the RCP8.5 scenario are less harsh and shorter than those in RCP4.5 scenario.
The same exercise was carried out for the winters centered on the year 2100. It was noted that the projected freezing indices calculated for this period deviated considerably from the historical values (1980–2016) used to establish the correlations at each transect. Deviating significantly from those values would reduce our confidence in ice regime projections. Consequently, the 2040–2060 period was chosen for the future ice regime analysis.
Wind Data
An analysis of available wind measurements at Rupert Bay from 2002 to 2016 (Hydro-Québec, 2017) has shown that dominant winds come mostly from the north-north-west and the north-west, as well as the south-south-east and south-east. A positive storm surge is formed from high winds approaching from the north-north-west and north-west while a negative storm surge is the result of high winds approaching from the south-south-east and south-east. Water levels modeled in Rupert Bay for the years 1980–2013 (Lasalle | NHC, 2016) has shown that the storm season for the 1998–2013 period was longer and more intense than for the 1980–1997 period. As illustrated in Figure 5, this variation is explained by the exceedance probability of both positive and negative storm surges. A later freeze-up in James Bay could be the result of different factors such as a storm season expanding beyond the month of October as well as the intensifications of storms coming from the north-north-west and north-west. No significant changes have been identified in terms of storm intensity between the 1980–1997 period and the 1998–2013 period during spring time.
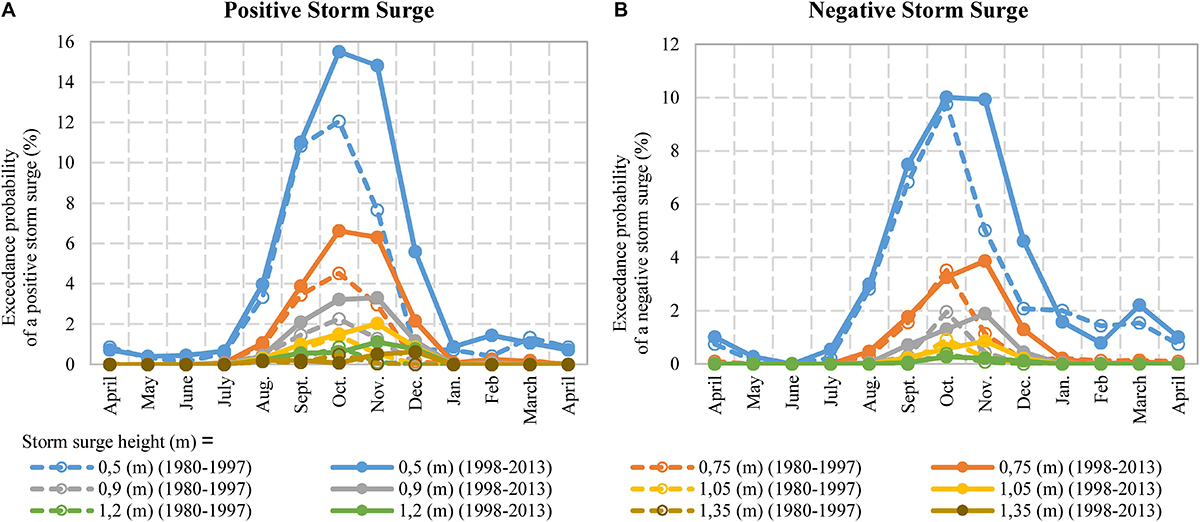
Figure 5. Comparison of exceedance probability of positive (A) and negative (B) storm surge in Rupert Bay for 1980–1997 and 1998–2013 periods adapted from Taha et al. (2017).
For future conditions, we assumed that the overall wind patterns will remain similar to historical conditions. In addition, storm surge conditions that have exhibited changes will only affect a small part of the freezing period, namely freeze-up conditions. Projections of wind conditions may be performed as part of a future phase of his work but is not covered by this paper.
Results and Discussion
Freeze-Up
Freeze-up in James Bay generally lasts approximately 50 days from late November up to early January. First, the formation of an initial ice cover between the western coast and Akimiski Island is followed by the formation of coastal landfast ice along the southern and western coastlines. Then, ice begins to form in the coves along the eastern coast and develops into a continuous coastal ice cover. Finally, the southeastern coastal landfast ice expands toward the islands located north of Charlton Island. The phenomenon of the formation of the southeastern coastal ice cover by tiling of drifting ice floes being pushed against the leading edge by the currents is illustrated in Figure 6.
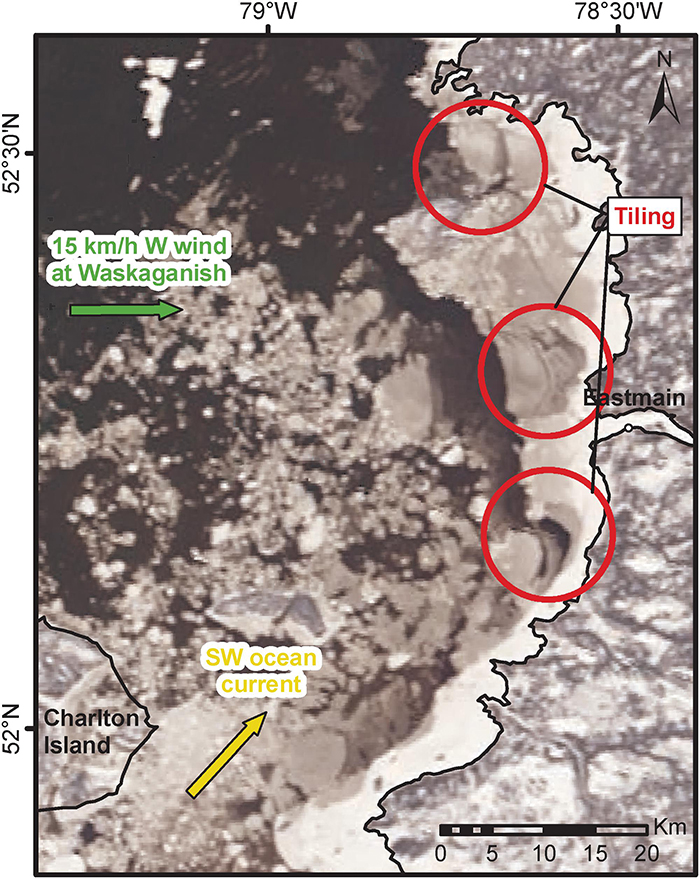
Figure 6. Modis image from December 3, 2013 showing the formation of the southeastern coastal ice cover by tiling adapted from Taha et al. (2017).
The freeze-up dates corresponding to 50% progress of ice coverage are presented in Figure 7 for the 1980–1997 and 1998–2016 periods. For both periods, freeze-up dates don’t seem affected by the recent later beginning of the freezing season (Figure 2B) and happen generally around early January. The fact that freeze-up occurs approximately 73 days after the beginning of the freezing season, so long after the former, may explain this observation. Additionally, freeze-up dates seem to occur around the winter solstice, which may indicate that the middle part of freeze-up may be synched with the minimum intensity of solar radiation. The consistency in freeze-up dates may therefore be explained by the absence of variation of the intensity of solar radiation over the decades.
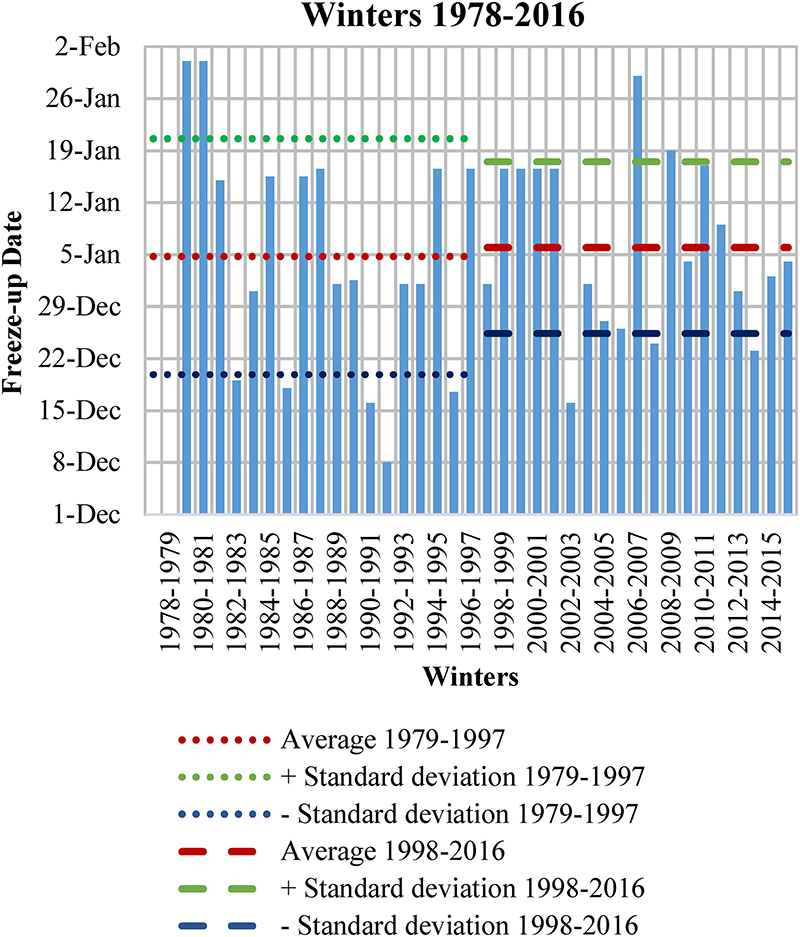
Figure 7. Comparison of freeze-up dates in James Bay for 1979–1997 and 1998–2016 periods adapted from Taha et al. (2017).
An analysis of the freeze-up dates was also performed for the river mouths of the La Grande and Eastmain rivers, as well as for Rupert Bay. As only a small sample of data was available for the 1980–1997 period, the comparison with the 1998–2016 period was inconclusive. Even so, for all three sectors, a trend for later freeze-up dates in recent years was observed in comparison to former years, indicating a possible effect of both late and mild freezing seasons and late and harsher storms on these estuarine environments which freeze-up earlier than James Bay as a whole.
The atmospheric heat flux was computed and cumulated for the 1980–2016 winters for three different areas of James Bay, namely the La Grande, the North West Coast, and the South areas. The South area includes the South West coast of James Bay, the Eastmain area, and the Rupert Bay area since the calculation was made with data from the same meteorological and solar radiation stations. Freeze-up dates for the historical winters were found to approximately coincide with the cumulative heat flux (CumΦ) values presented in Table 1. The mean cumulative heat flux values corresponding to historical freeze-up dates in each area are therefore used as a freeze-up criteria for future winters.
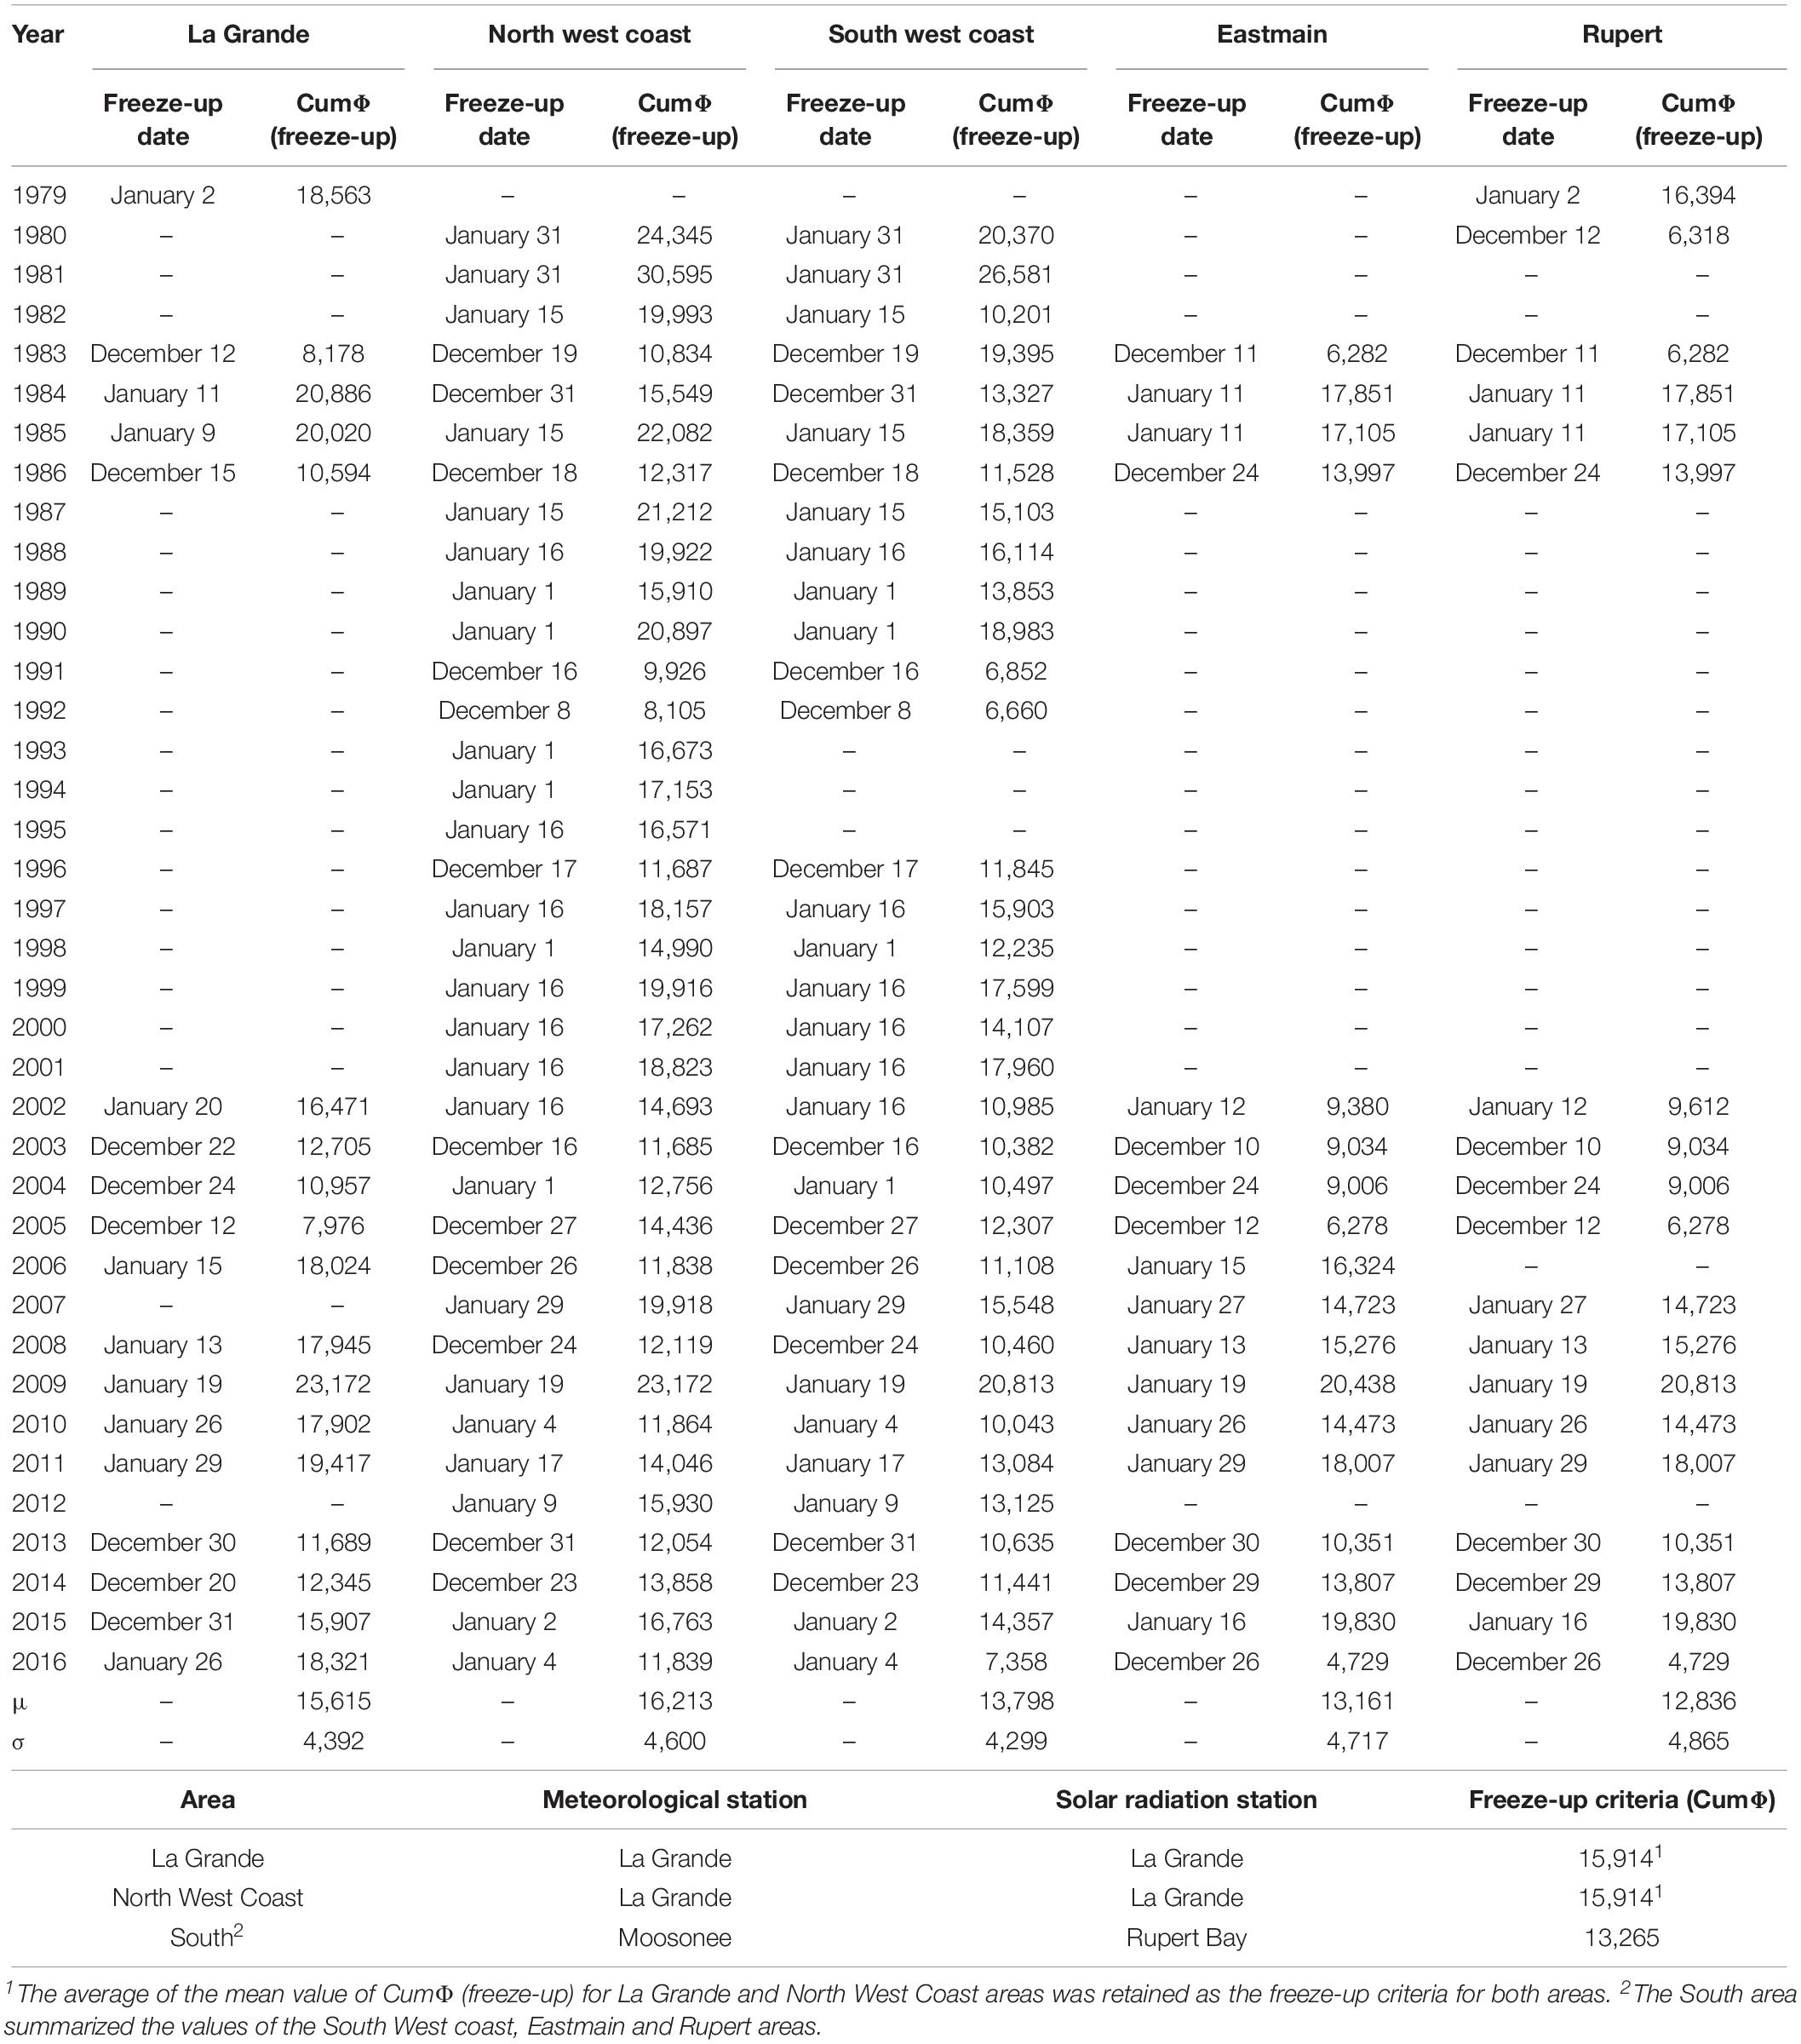
Table 1. Freeze-up criteria in James Bay.
Based on heat flux calculations for future winters and for both greenhouse gas emissions scenarios, projected freeze-up dates for the 2040–2060 winters were determined for the three areas using the criteria in Table 1. The estimated global freeze-up dates in James Bay for each climate model are presented in Figure 8 where they are compared to the average value of the 1998–2016 period.
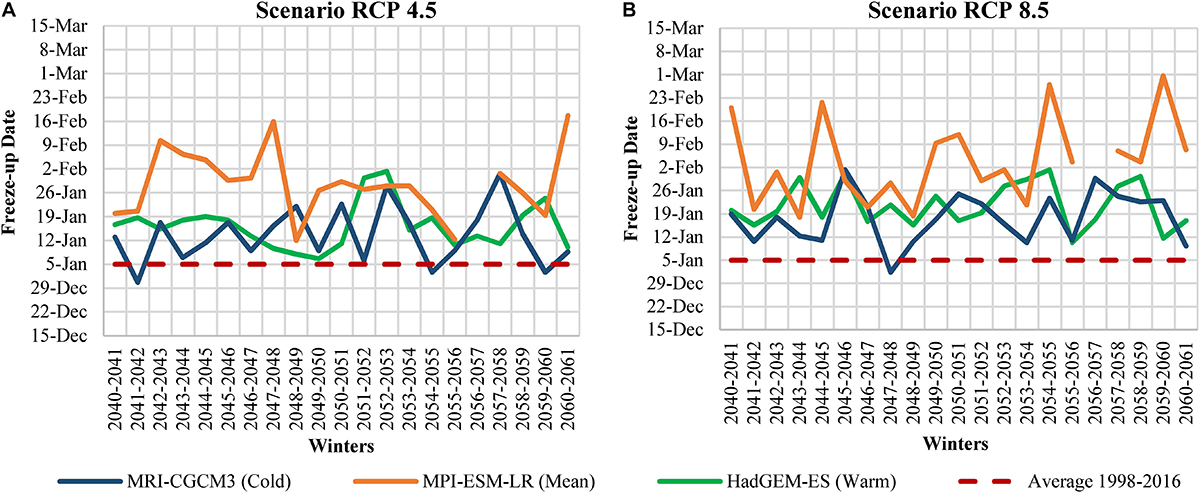
Figure 8. Comparison of freeze-up dates in James Bay for the 2040–2060 period under climatic scenarios RCP4.5 (A) and RCP8.5 (B).
Comparing to historical data, we expect that around the year 2050, freeze-up in the RCP4.5 scenario is likely to occur on average 1–3 weeks later than during the 1998–2016 period. In addition, freeze-up should occur a couple of days later in the RCP8.5 scenario than in the RCP4.5 scenario.
Mid-Winter
A comparison of the maximum landfast ice coverage during mid-winter (January–March) for the 1980–1997 and 1998–2016 periods is presented in Figure 9, where the green lines illustrate the minimum, mean and maximum fast ice coverage for the earlier period and the blue lines illustrate the minimum, mean and maximum fast ice coverage for the recent period. As illustrated in Figure 9, for both periods, the predominant north-north-west and north-west winds that keep pushing ice floes against the leading edge along the eastern coastal ice cover results in landfast ice coverage extending further out on the eastern coast in comparison to the western coast. Additionally, it is observed that fixed ice engulfs the islands in the eastern part of the bay as well as Akimiski Island on the west coast, which confirms the high dependency of the presence of leading edges for the ice floes to attach themselves in the landfast ice formation mechanism. Therefore, the areas with a higher concentration of islands, such as the southeastern corner of the bay, tend to develop a larger landfast ice coverage.
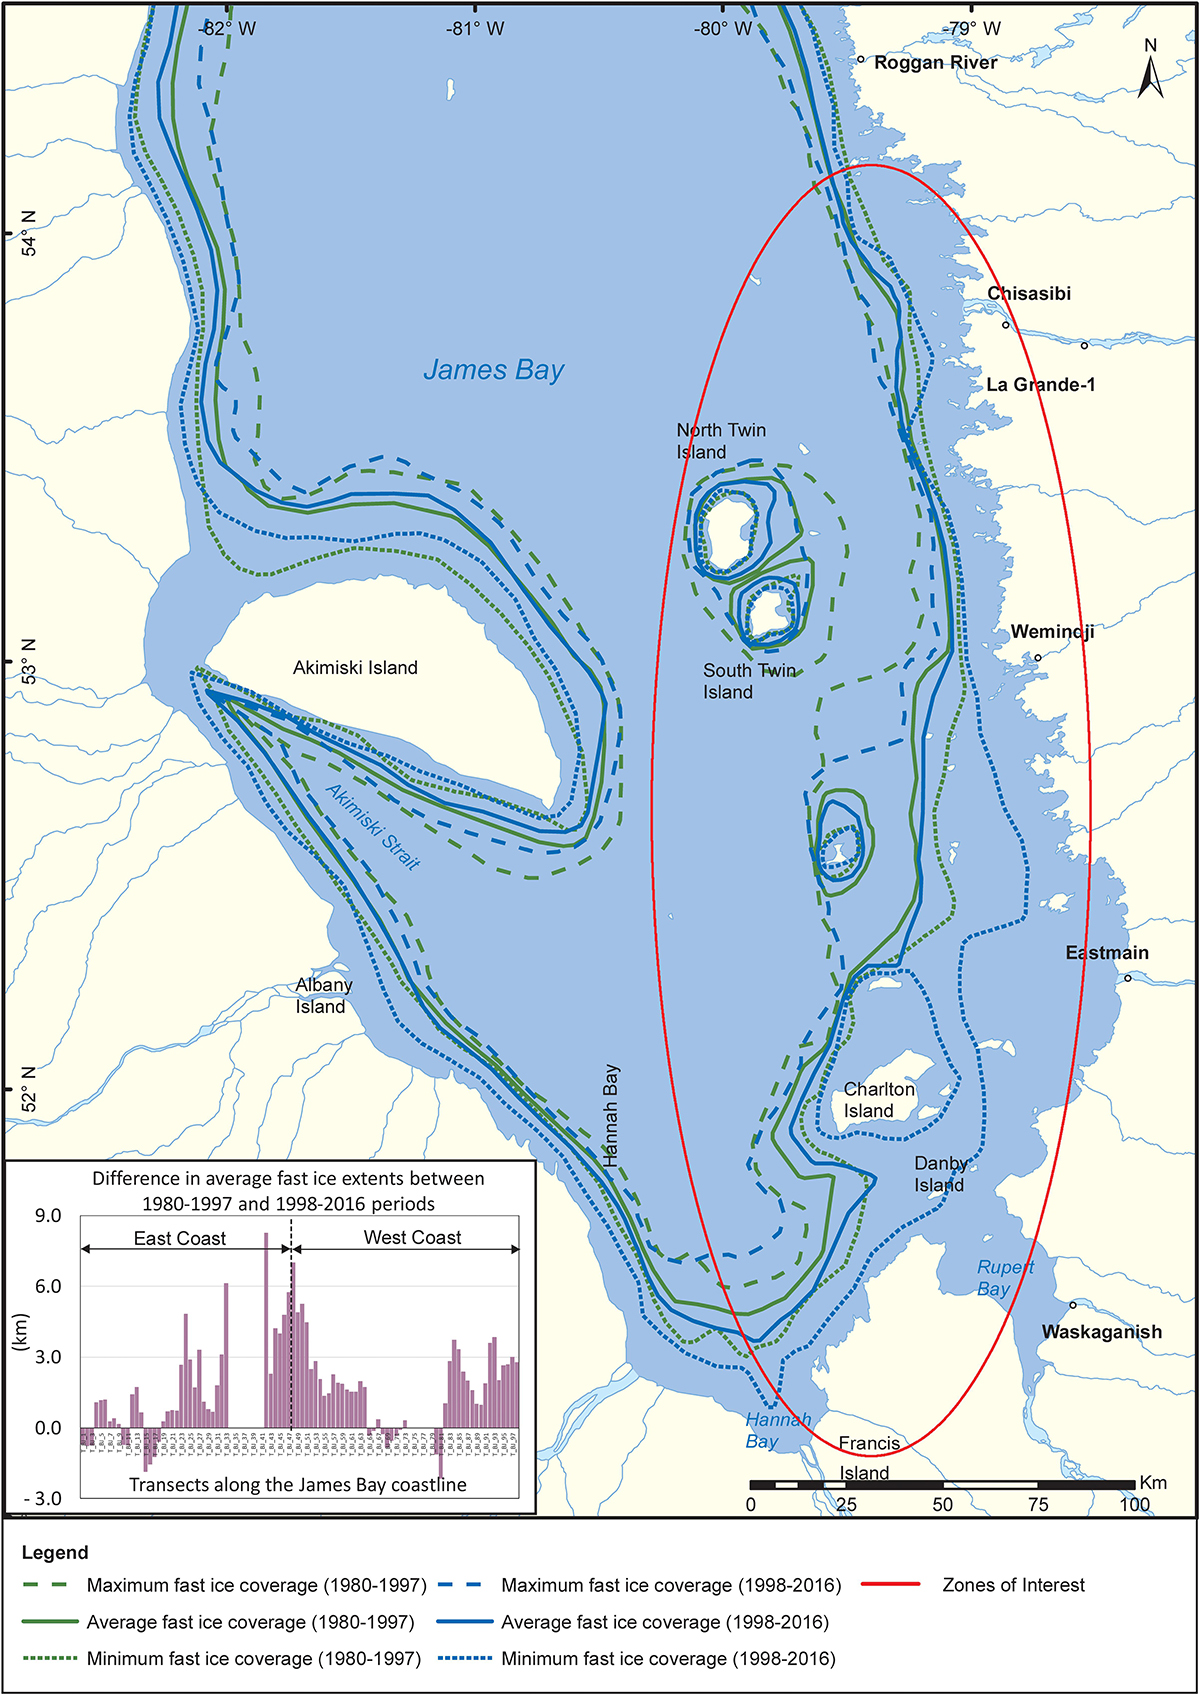
Figure 9. Comparison of the landfast ice extent in James Bay for 1980–1997 (green lines) and 1998–2016 (blue lines) periods adapted from Taha et al. (2017).
As observed in Figure 9, it can be noticed that the landfast ice coverage in the southeastern corner (see encircled areas) has decreased over the years for the 1998–2016 period. The areas where the landfast ice tends to form last and where the salinity is relatively high are also where the coastal ice cover is regressing. Because sea ice consolidation requires more heat loss than fresh water, the loss in ice coverage in that area is most likely due to the milder winter air temperatures as shown by the lower freezing indices at La Grande and Moosonee stations (Figure 2A).
At the La Grande river mouth, analysis of the evolution of the ice cover in this area has shown that the warm water coming out of the river causes the coastal landfast ice to form later than the ice cover just to the north and to the south of the La Grande river mouth. Once the water coming out of the river is cooled to freezing point, the ice cover starts to form. However, the delay at this specific location is carried over in mid-winter when the entire leading edge progresses at the same rate. The small notch observed in the coastal ice cover for the minimal extent in front of the La Grande river mouth is more significant for the 1998–2016 period than for the 1980–1997 period and can be explained by the late beginning of winter at La Grande (Figure 2B) and the milder winter temperatures that follow (Figure 2A). Consequently, these two meteorological effects delay the cooling of fresh warm water and results in a later coastal landfast ice formation, which is responsible for a more pronounced notch at the river mouth in recent years. However, the recession in the notch is not yet very obvious for the average extent.
Since, the water to ice heat flux, which resists ice formation, is the product of flow rate and water temperature (Holman, 1992), based on the fundamental principles of forced convection, the increase in winter flow rates from the river also contributes to the delay in coastal ice formation at the La Grande river mouth. It is, however, a secondary effect in comparison to air temperatures since the increase of flow rates would not delay ice formation significantly if the water was cooled down to freezing point at the same rate as the 1980–1997 period. The examination of the area immediately at the exit of the La Grande river mouth in Figure 9 demonstrates this affirmation as, in spite of the high flows in mid-winter, the area is always closed for all years of both periods. It should also be mentioned that fresh water remains concentrated in the top layers at river mouths and that, once the water temperatures reaches 0°C, the coastal ice cover at this location is mostly composed of fresh water ice. Thus, fresh water coming out of the river does not seem problematic in mid-winter once the water temperature remains at freezing point but affects the freeze-up period while the warm river discharge is still being cooled.
Changes to the landfast ice extent were clearly noticeable in the area of the Eastmain river mouth even if the flow rate remained unchanged through both periods. Besides, the northern part of Rupert Bay has experienced the same type of changes as the ones reported at the Eastmain river mouth even if a decrease in flow rate in the Bay was experienced due to the Rupert diversion. Thus, although changes to fresh water supply affect plume extents and depths, there seems to be no clear correlation between the supply of fresh water and the observed recession in the extents of landfast ice. Consequently, the flow rate variation of the rivers was not considered as a factor of change for the evolution of the landfast ice coverage in the future.
As observed in Figure 9, recession of the maximum landfast ice extents along the northwest coast of James Bay is also noticeable and reaches up to 13 km. On average, the recession of the mean fast ice coverage between the earlier and the recent period is of 2.1 km on the east coast and of 2.3 km on the west coast of James Bay.
Fast ice extents in mid-winter for winters from 1980 to 2016 were used to develop correlations between freezing indices and the offshoreward width of the coastal fast ice along each transect shown in Figure 10, where the quality of the correlations (the coefficient of determination R2) is also illustrated. A p-value null hypothesis test within a confidence interval of 95% was performed on all transects to establish the statistical significance of the correlations. Hence, five transects along the James Bay coast were excluded from the analysis based on their p-value (p > 0.05). It should be mentioned that correlations with a very low negative slope (m ≤ −0.0003) were considered to be zero slope relations (m = 0). For the calculation of the landfast ice coverage of future winters, only transects with a zero or positive slope relation (m ≥ 0) were retained since correlations with a negative slope (m < 0) were considered as unphysical outliers.
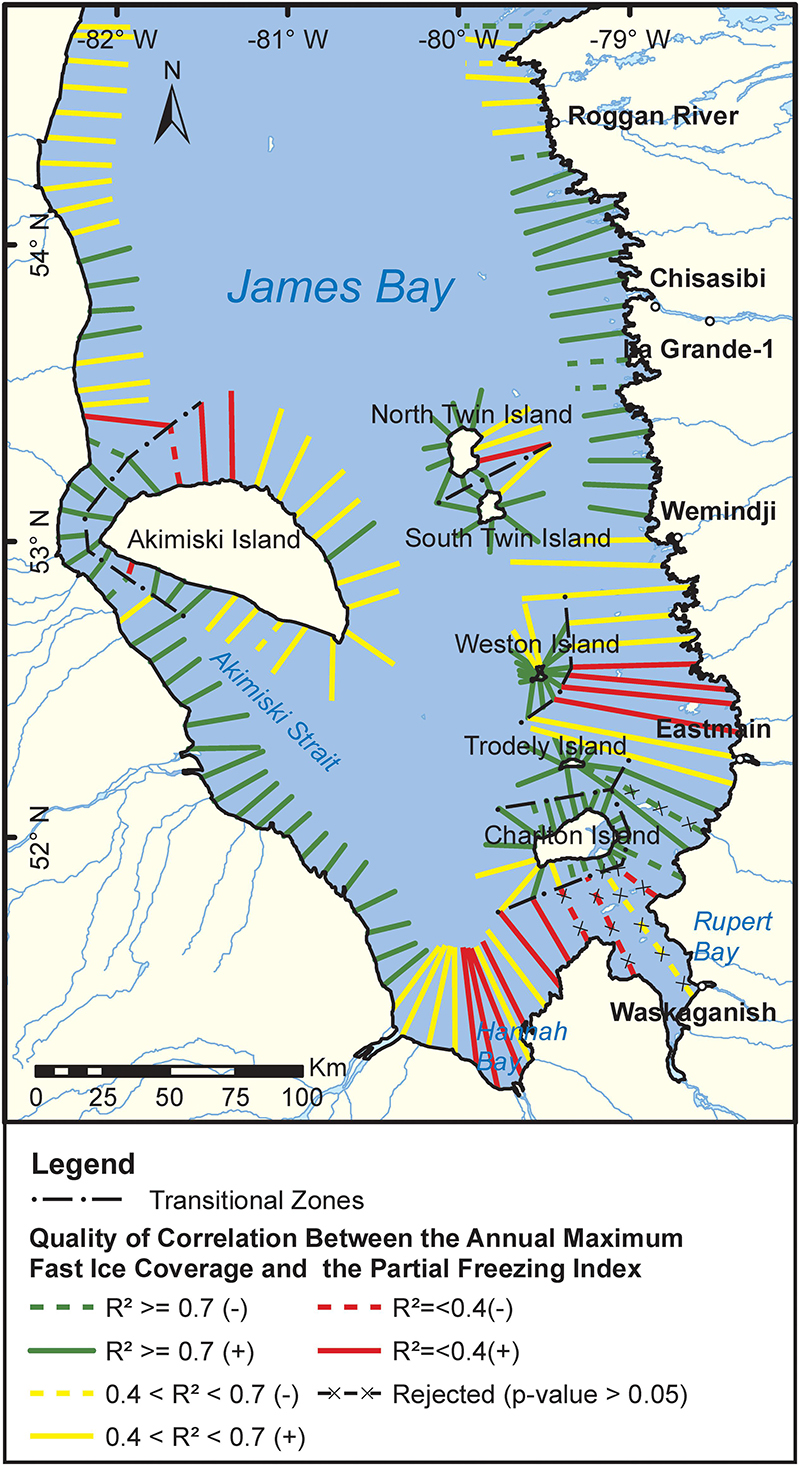
Figure 10. Quality of the correlations between the annual maximum landfast ice coverage and the partial freezing index at mid-winter.
According to the gradient (m) of the retained mathematical relations, it was noted that the extent of fast ice tends to vary greatly with respect to the freezing index in the areas between Wemindji and Eastmain, south of James Bay in Hannah Bay and along James Bay’s coastline northwest of Akimiski Island. Conversely, the fast ice coverage tends to vary very little along the coast in the La Grande area and southwest of Akimiski Island.
Transects intersecting in a transitional zone between coastlines, for example between the coasts of James Bay and Charlton Island, were subjected to further analysis. It was observed that during certain winters, fixed ice covered the entire distance between two coastlines, while during others, two partial ice covers with an open water channel between the coastlines were formed. At these locations, two correlations were established for a given transect. The first included data from the years when two partial ice covers with an open water channel occurred and the second included years when fast ice connected the coastlines. Between the coasts of James Bay and Charlton Island, only the first was used for future conditions using projected freezing indices as the historical trend showed a more frequent channel formation with warmer winters.
Similar adjustments and approximations were carried out for the zones between the northwest coast of James Bay and Akimiski Island as well as between the coasts of the Twin Islands. As no historical data has shown the presence of an open water channel between Charlton and Trodely Islands, it was assumed that fast ice would always connect the coastlines of the two islands. It should be mentioned that for five transects located between the coast of James Bay and Trodely Island and as well as in Akimiski Strait, an open channel was observed during only two winters, providing a sample of two data points for the computation of the correlation, hence obtaining a R2 = 1 (no p-value could be computed). In those cases, the correlations were still retained since they show the beginning of a trend in a phenomenon rarely observed in the past, but that is believed to be more frequent in the future warmer climate.
Atmospheric heat flux calculations similar to the one performed for freeze-up were carried out for mid-winter. For the winters between 1980 and 2016, it was noted that the dates at which the value of the cumulative heat flux reaches a minimum are very close to the dates of mid-winter obtained by observations. It is therefore considered that mid-winter can be determined by the minimum of the cumulative heat flux for future winters. Using this criteria and atmospheric heat flux calculations for future conditions for both greenhouse gas emissions scenarios and this criterion, projected dates for mid-winter were estimated for the 2040–2060 period.
In order to represent the natural variability of the climate over several decades, the maximum fast ice extent in mid-winter was plotted using data from the coldest year of the “cold” model, the average fast ice extent in mid-winter from the mean value of all the years of the “average” model and the minimum fast ice extent in mid-winter from the warmest year of the “warm” model.
The yearly maximum fast ice extent was calculated for both greenhouse gas emissions scenarios at each selected transect using the partial freezing index in mid-winter for the years between 2040 and 2060. The landfast ice extent in areas where transects had rejected correlations (on the base of their p-value or because of a negative slope) was interpolated between the values calculated at adjacent transects.
The minimal, average and maximal fast ice coverage in James Bay estimated for the 2040–2060 period for both greenhouse gas emissions scenarios are presented in Figure 11A (RCP4.5) and Figure 11B (RCP8.5) in superposition with historical fast ice coverage from the 1998 to 2016 period. The computed difference between the historical average and the projected average landfast ice coverage width along the James Bay coastline is presented in Figure 11C.
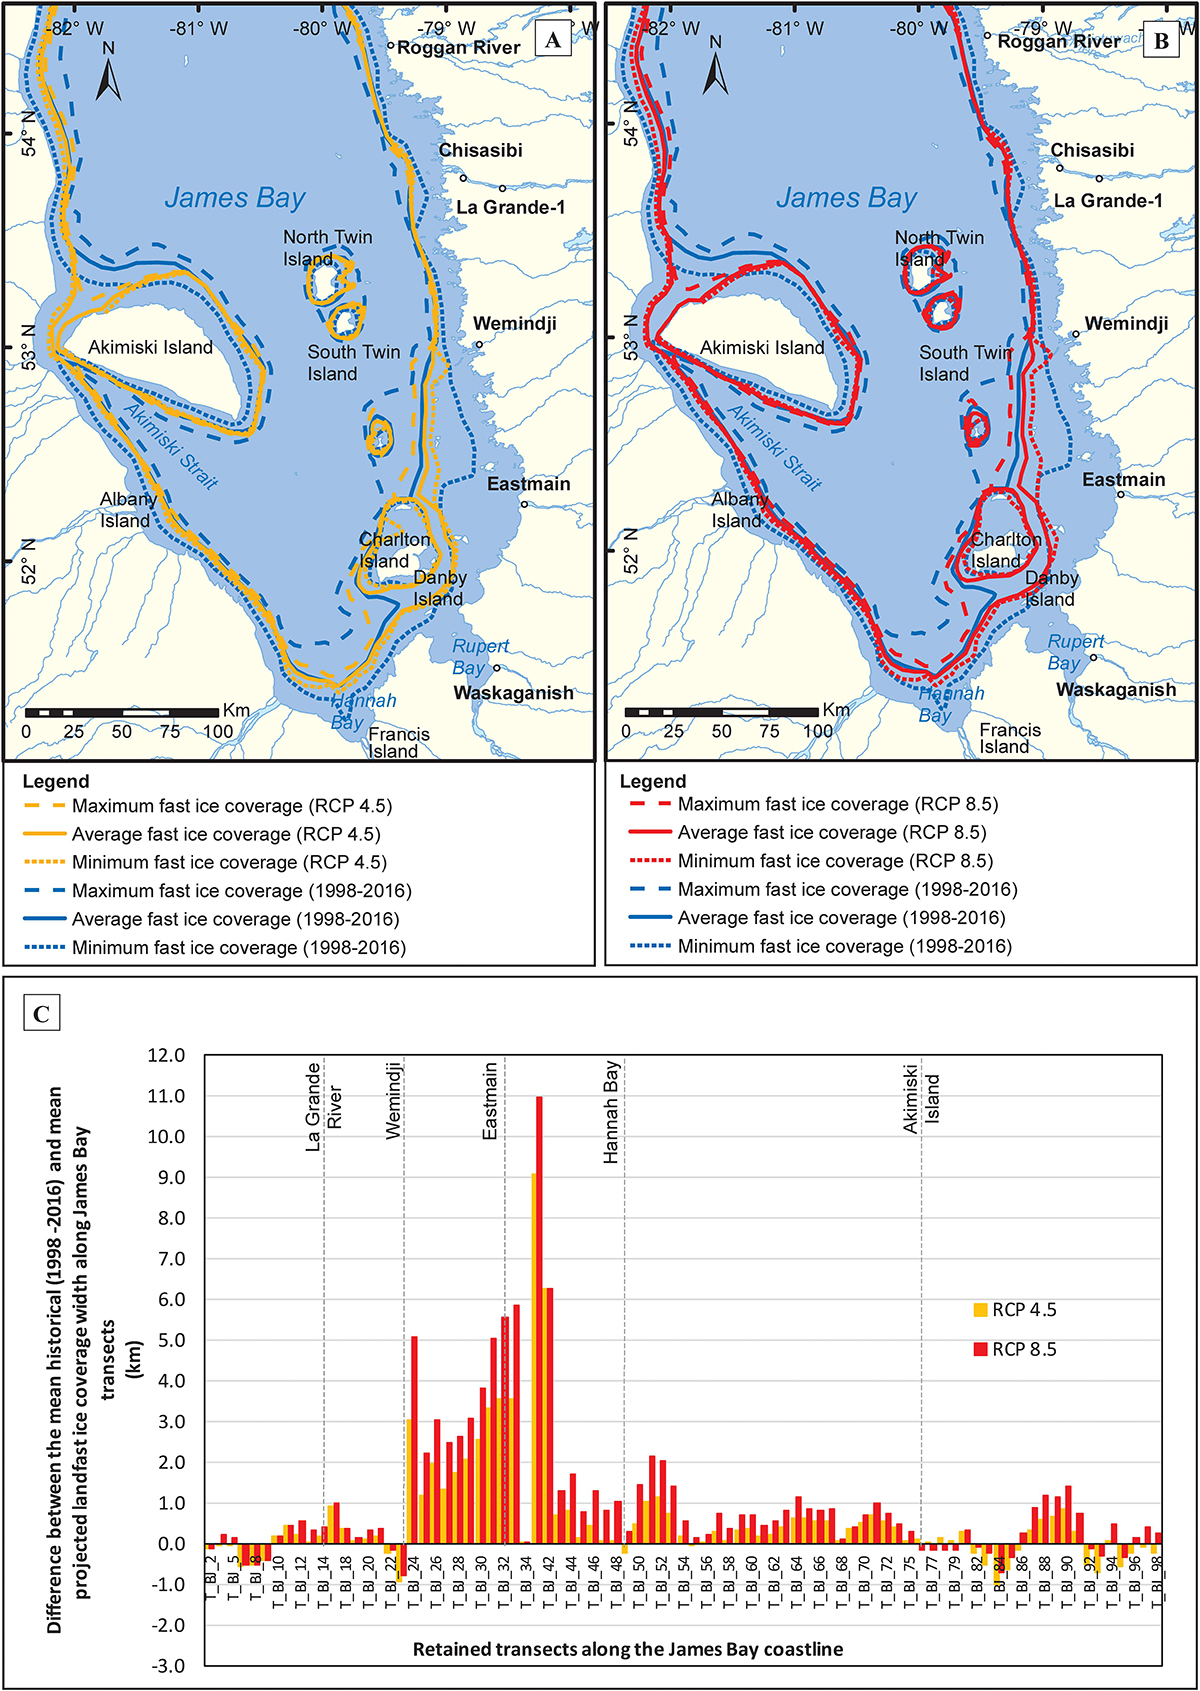
Figure 11. Comparison of the landfast ice extent in James Bay for the 2040–2060 period under climatic scenarios RCP4.5 (A) and RCP8.5 (B) with the extents of the 1998–2016 period. Computation of the difference between the mean historical (1998–2016) and mean projected landfast ice coverage width along James Bay transects (C).
As expected, fast ice coverage shows very little variations along the coast of the La Grande area and south of Akimiski Island where the gradients of the correlations are very low. Conversely, there is a significant variability between Wemindji and Eastmain, in Hannah Bay and northwest of Akimiski Island where the value of the gradient is higher. In those impacted areas, the projected RCP8.5 average curve shows a recession of about 0.5–11 km with respect to the historical average curve (solid lines), the projected maximum extent a recession of 3–25 km with respect to the historical maximum curve (dashed lines), but the projected minimum extent curve does not show any recession at all with respect to the historical minimum curve (dotted lines).
As illustrated in Figure 11A, landfast ice will most likely not connect the coastlines between James Bay and Charlton Island as well as between James Bay and Akimiski Island during the warm and average winters of the RCP4.5 scenario. This will affect the access to these territories by landfast ice for the communities living on the shores of James Bay. We expect that Twin Islands will also be separated at all times and Weston Island will be permanently isolated. As shown in Figure 11B, the findings are similar for the RCP8.5 scenario, however, landfast ice coverages are slightly lower than for the RCP4.5 scenario.
It should be mentioned that the developed correlations provide an average trend of the fast ice extent in relation to meteorological parameters and therefore reduce the natural variability around this average trend. The extreme extents calculated in relation with the extreme projected winters of each scenario take into account the variability of the future climate but do not consider the variability of the response of the landfast ice formation processes to climatology. This may explain the absence in recession of the minimum projected extent curves. In addition, the recession noted with the maximum projected curves with respect to the maximum historical curves may be overestimated because of this same reason.
Several sources of uncertainty affect these results in addition to the lack of natural variability built into our trending approach. First, assumptions were made about the formation of ice covers between coastlines separated by a short distance, for example between James Bay and Akimiski Island on one hand, and James Bay and Charlton Island on the other.
On another account, some transects were discarded because of negative slope correlations and the landfast ice extent between these transects were therefore interpolated from values calculated at neighboring transects that were retained. Furthermore, some correlations were developed from a small number of samples and may therefore have a smaller confidence interval.
In addition, only the freezing index in mid-winter was considered for establishing correlations. Other parameters such as local bathymetry, wind direction and intensity or hydrologic variations may also affect the formation of fast ice covers in the bay.
Finally, the comparison between historical observations and projections was made, on the one hand, between conditions of mid-winter observed on available geomatic data and, on the other, with future projections at dates estimated by heat flux calculations. The determination of mid-winter using the minimum cumulative heat flux value leads, for the historical data, to dates of mid-winter generally close to the dates determined with geomatics material. However, the superposition of historical data may lead to the superposition of some years that deviate significantly from mid-winter and projected conditions that were estimated by calculations.
Breakup
Breakup lasts roughly one month, from early May until early June. It begins with the thawing of the southwestern river estuaries, first Moose River and Albany River, followed by Attawapiskat River. During freshet, those three rivers release warm water in a shallow area of James Bay where the ice cover can easily be warmed up by solar radiation once the first open leads are formed. It then leads to a rapid thaw of the coastal landfast ice in the entire area. The La Grande river mouth opens up around mid-May due to warm water being released into James Bay. Simultaneously, the southeastern part of James Bay including Rupert Bay opens up and the breakup momentum steadily moves up north along the eastern coast. Ultimately, the western coast north of Akimiski Island opens up last.
Breakup dates, corresponding to a 50% loss of the maximum landfast ice coverage, are presented in Figure 12 for both 1980–1997 and 1998–2016 periods. Generally, breakup occurs around May 21st for the 1980–1997 period and occurs about 5 days earlier for the 1998–2016 period. This variation is similar to the recent 3–5 day shift observed in the end of the freezing season (Figure 2C). Unlike freeze-up, this relationship to air temperatures may be explained by the fact that breakup occurs on average only 22 days after the end of winter.
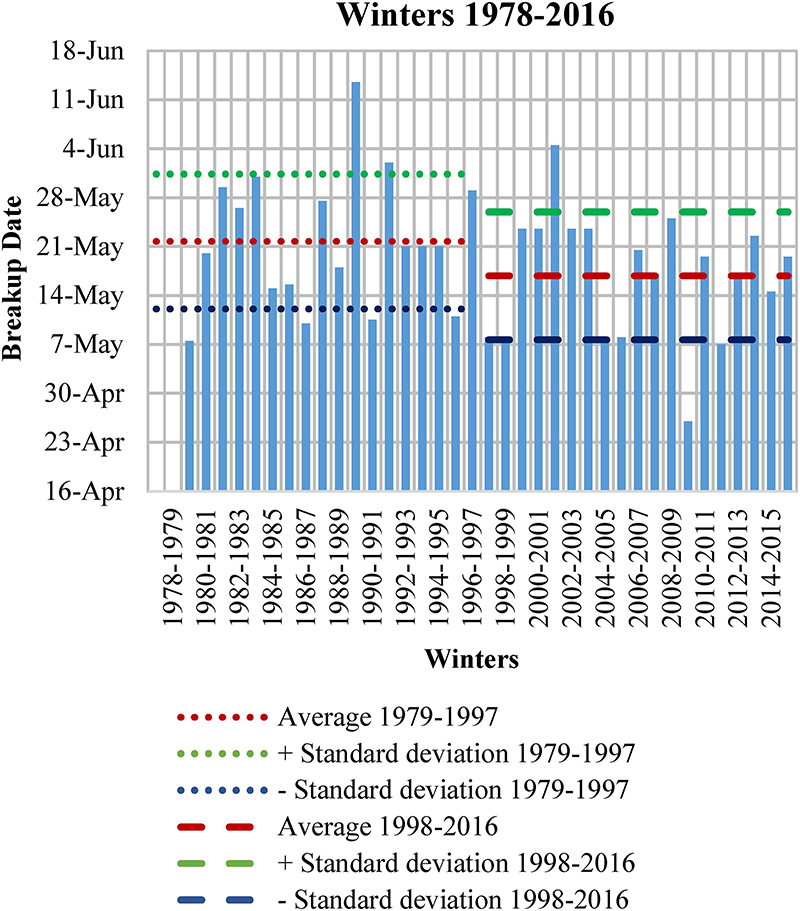
Figure 12. Comparison of breakup dates in James Bay for 1979–1997 and 1998–2016 periods adapted from Taha et al. (2017).
This dependency also suggests that breakup in James Bay is synched to spring freshet which is generated by the end of the freezing season for natural rivers, unlike highly regulated rivers which tend to store runoff in reservoirs during spring. A similar analysis of breakup dates at the Eastmain river mouth and at the La Grande river mouth was performed and demonstrated that the breakup dates remained unchanged for those two areas that include highly regulated rivers. In such areas, the driving parameter seems to be the solar radiation, which remained steady throughout the decades.
Atmospheric heat fluxes were computed similarly to freeze-up for the 1980–2016 winters for the same areas of James Bay. The historical breakup dates were found to approximately coincide with the cumulative heat flux (CumΦ) values presented in Table 2, where the data for La Grande and Eastmain areas are shown as an example of the heat flux analysis. The difference between the CumΦ at the breakup dates and the maximum CumΦ in mid-winter represent the amount of heat (ΦWarming) necessary to reach breakup. The mean values of the ΦWarming calculations corresponding to historical breakup dates in each area are therefore used as a breakup criteria for future winters.
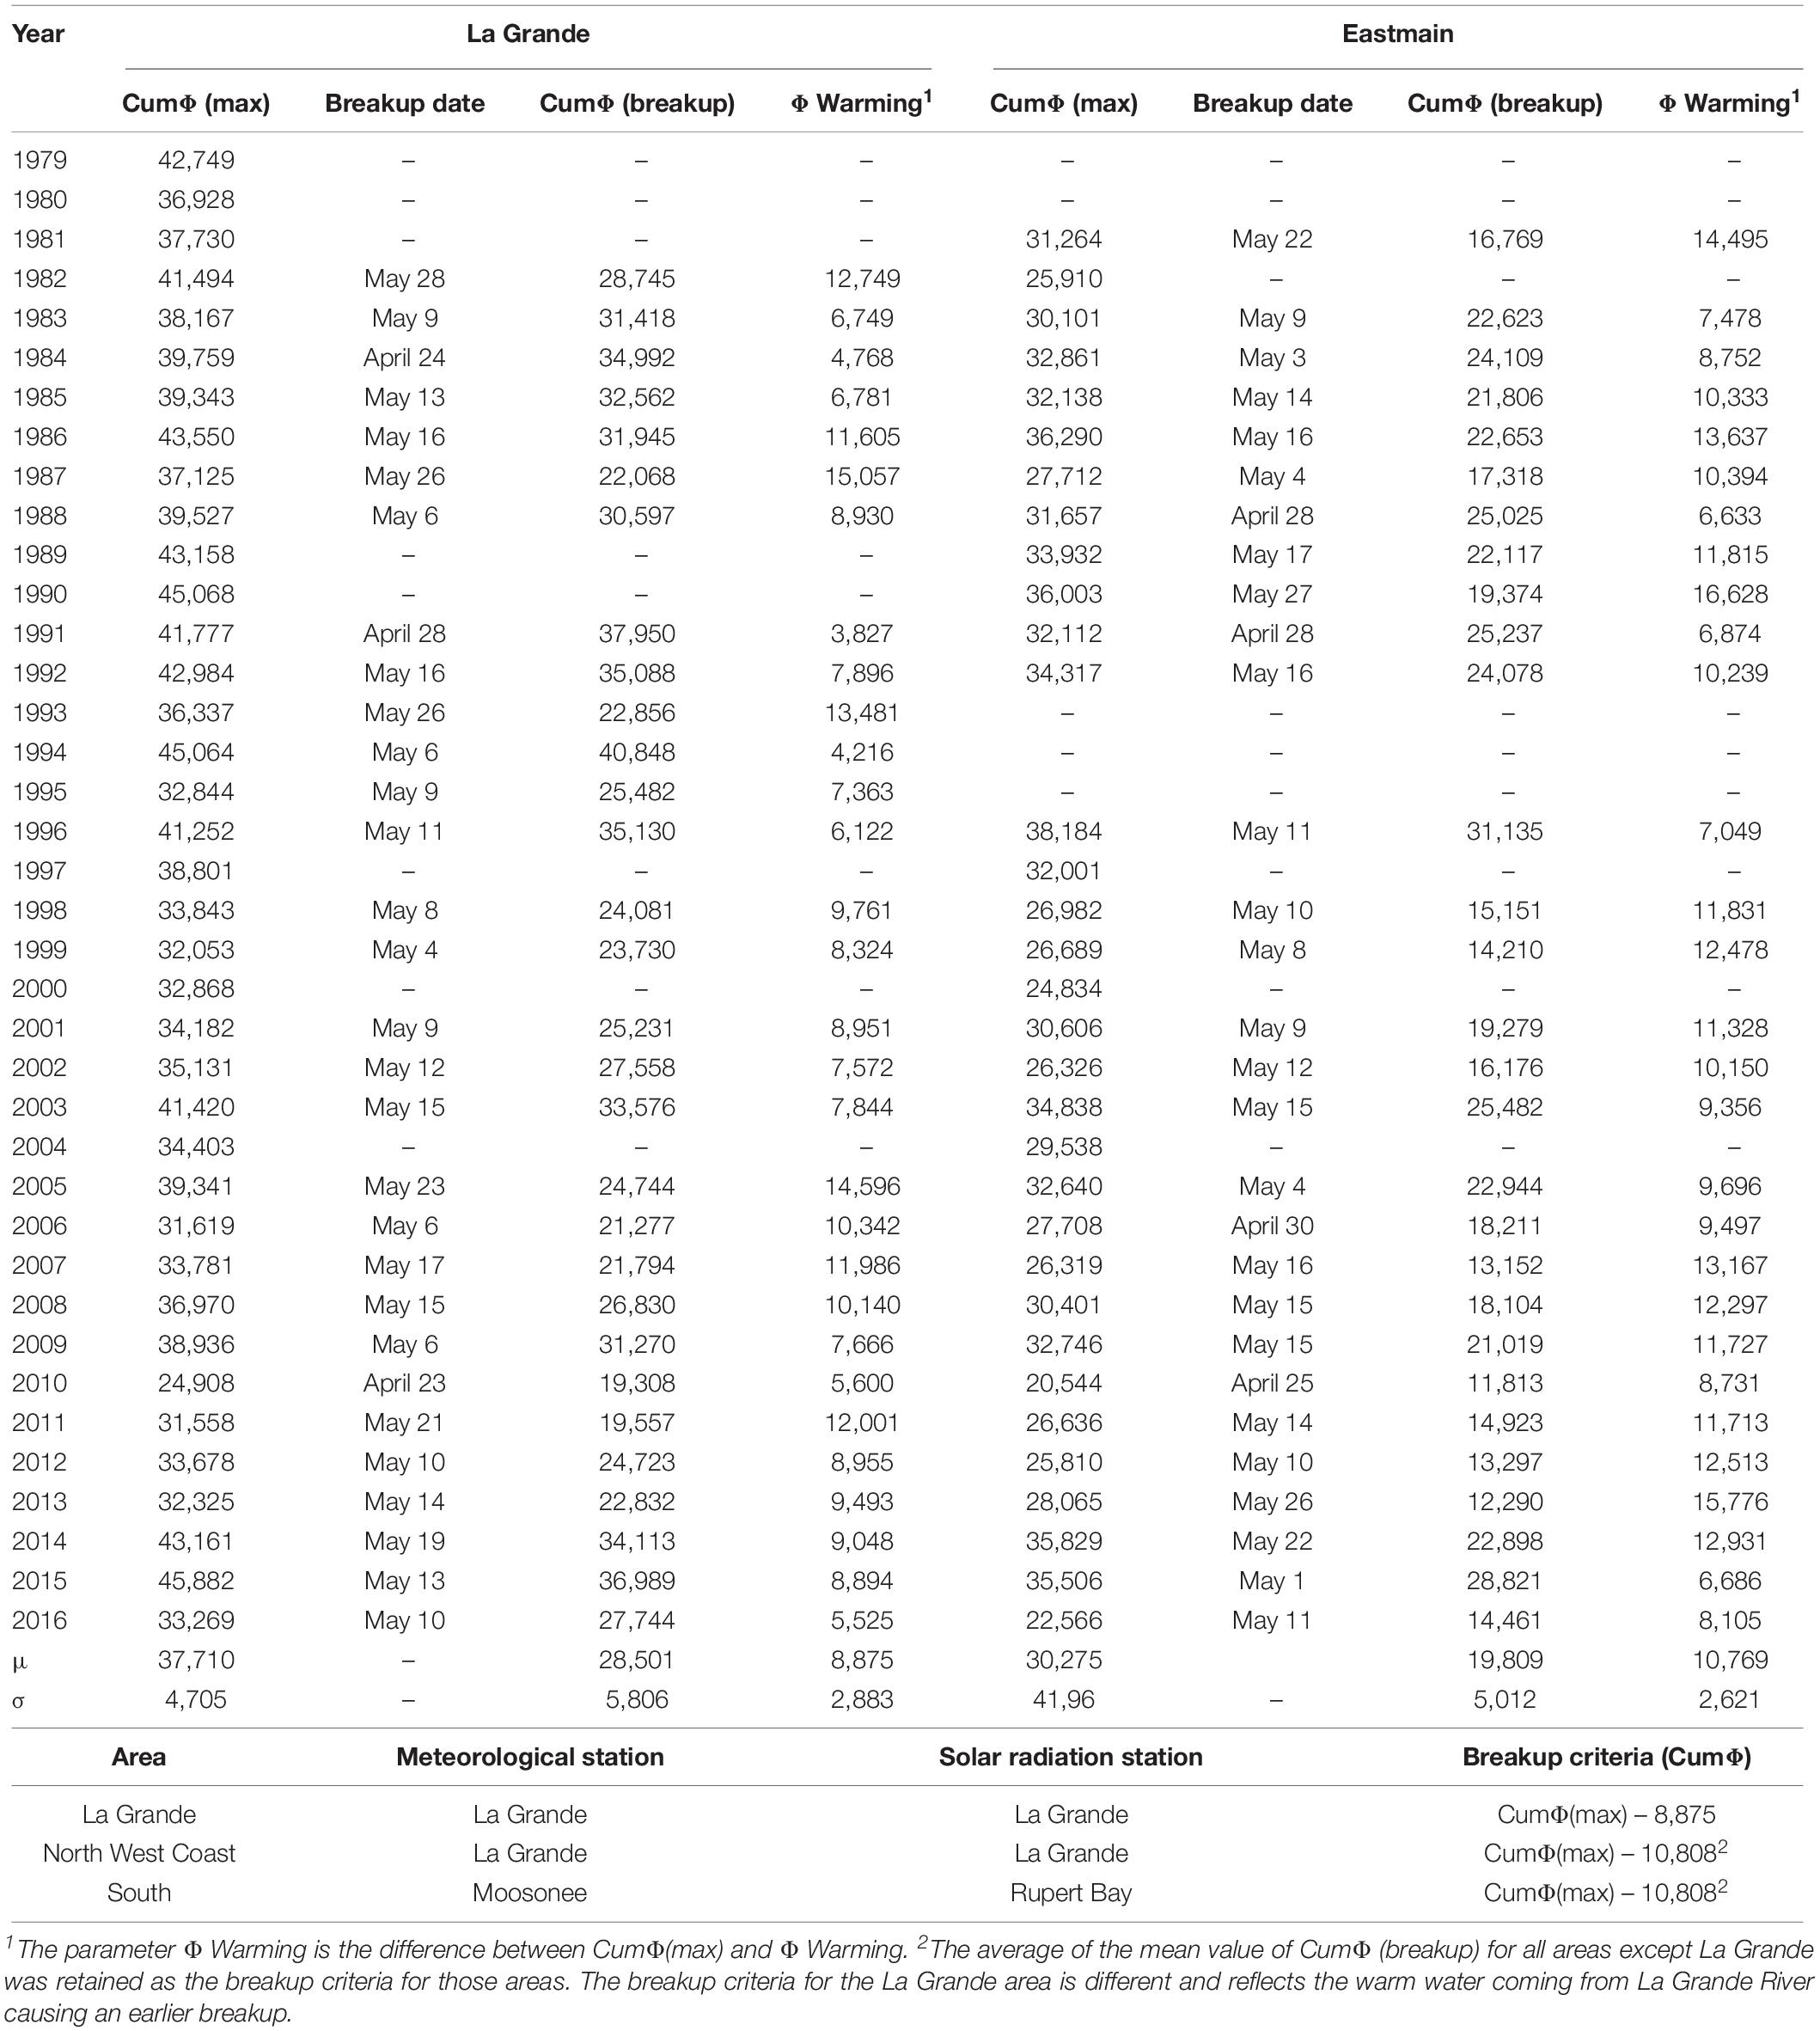
Table 2. Breakup criteria in James Bay.
It should be mentioned that the breakup criterion of the La Grande area is different from the others as it reflects the effect of warm water coming from the La Grande River causing breakup to occur earlier in this area than in the rest of the Bay.
Based on the heat flux calculations for future winters and for both greenhouse gas emissions scenarios, the projected breakup dates for the 2040–2060 winters were determined for the three areas using the above criterion. The estimated global breakup dates in James Bay for each climate model are presented in Figure 13 where they are compared to the average of the 1998–2016 period.
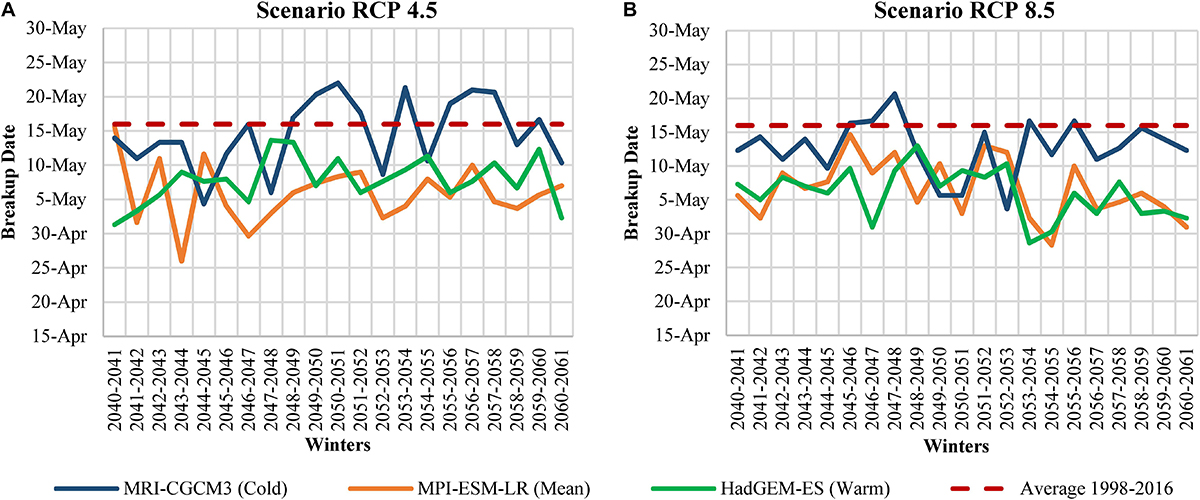
Figure 13. Comparison of breakup dates in James Bay for the 2040–2060 period under climatic scenario RCP4.5 (A) and RCP8.5 (B).
Comparing to historical data, we expect that around the year 2050, breakup in the RCP4.5 scenario is likely to occur on average 2–9 days earlier in the winter than during the 1998–2016 period. In addition, breakup will occur only 2 days earlier in the RCP8.5 scenario than in the RCP4.5 scenario. These differences in breakup dates between the 1998–2016 period and the 2040–2060 period are in line with the trend observed in the past four decades.
Conclusion
Ice regime in James Bay seem to be mainly driven by meteorological parameters such as air temperatures and solar radiation, although maritime storms may have also impacted the freeze-up dynamics in estuarine environments. The global trend toward warmer winter air temperatures have been confirmed in the James Bay area and have impacted the landfast ice coverage in certain areas along the coast. An analysis of the data from the past four decades and summarized into ice charts allowed the identification of receding coastal landfast ice on the southeastern coastline. In this area, the coastal ice cover usually forms late and in a completely saline environment where a relatively high heat loss is required, which becomes difficult to reach with warmer air temperatures. A more subtle impact was also noticed at the La Grande river mouth, primarily due to a delay in freeze-up at the river mouth caused by delayed and milder freezing seasons. As a result, unlike meteorological changes, hydrological changes due to hydroelectric development don’t seem to have had an appreciable effect on the landfast ice coverage.
Based on historical data from the last four decades, the landfast ice regime in James Bay was quantitatively correlated to the characteristics of the glaciological winter. As a result, projections of glaciological winters, using Global Climate Model results, allowed us to portray landfast ice coverage in the area of the study in the future. Projections of the landfast ice coverage were established for the year 2050 with projected air temperatures for two greenhouse gas emission scenarios, RCP4.5 and RCP8.5 and according to three climate models to represent climate variability (a “cold” model, an “average” model and a “warm” model). The maximum, average and minimum fast ice coverage for each scenario were mapped in superposition with the fast ice coverage of the 1998–2016 period.
The trends in the recession of the landfast ice coverage were also noted for future conditions but were not as pronounced as initially expected. In order to improve the accuracy of our projections, more physical parameters need to be included in addition to air temperatures and solar radiation in the modeling of fast ice extents in the James Bay. In addition, a Monte Carlo statistical approach may render better future fast ice extents than the ones computed using a trending approach with deterministic linear correlations. Finally, the inclusion of the bathymetric data, if accurate data was available for the James Bay area, as a driving parameter of the landfast ice formation and stabilization parameter during winter may be an interesting addition in a future phase of this study and may explain poor correlations obtained at certain transects.
For freeze-up, historical data showed almost no delay in dates of freeze-up for the period of 1998–2016 in comparison to the period of 1980–1997 because of a dominant effect of minimal solar radiation. However, we expect around the year 2050 a delay of 1–3 weeks as the winters become warmer and start later. As for breakup, the evolution seems to be more linear: historical data showed an advance of 5 days in dates of breakup for the period of 1998–2016 in comparison to the period of 1980–1997 and we expect around the year 2050 a further advance of 2–10 days.
Data Availability Statement
The datasets generated for this study are available on request to the corresponding author.
Author Contributions
WT, MB-L, and ACB compiled, processed, and interpreted the data, and wrote the first draft of the manuscript. MB-L and ACB prepared the figures. All authors participated in the conception of the study.
Funding
This study was supported by Hydro-Québec.
Conflict of Interest
WT, MB-L, and ACB are employed by Lasalle | NHC, which offers consulting services in the fields of hydraulics and applied fluid mechanics, including ice hydraulics and coastal engineering. AT is employed by Hydro-Québec, a public utility company that manages the generation, transmission and distribution of electricity in the Province of Quebec. Lasalle | NHC carried out the research presented in this paper using funding provided by Hydro-Québec.
Acknowledgments
We thank the Committee on River Ice Processes and the Environment (CRIPE) for publishing the first phase of this study in the 19th Workshop on the Hydraulics of Ice Covered Rivers proceedings and for allowing us to publish the results of the complete study in another publication. We also thank Mariza Costa-Cabral and Jean-Luc Martel for their help with climate projections and Geneviève Carier for her help with the data management and figures formatting.
References
Bird, R. E., and Hulstrom, R. L. (1981). Simplified Clear Sky Model for Direct and Diffuse Insolation on Horizontal Surfaces (No. SERI/TR-642-761). Golden, CO: Solar Energy Research Institute.
Canadian Ice Service [CIS], (2016). Ice and Iceberg Charts. Available at: https://www.canada.ca/en/environment-climate-change/services/ice-forecasts- observations/latest-conditions/products-guides/chart-descriptions.html (accssed June 11, 2019).
El Sabh, M. I., and Koutitonsky, V. G. (1974). Physiological Oceanographic Study in James Bay. Rimouski, QC: INRS-Océanologie, 176.
Environment Canada, (2017). Historical Data. Available at: http://climate.weather.gc.ca/historical_data/search_historic_data_e.html (accessed September 16, 2019).
Hydro-Québec, (2017). Vitesse du vent et Direction du vent à la Station RUPE0496. Montreal, QC: Hydro-Québec.
Hydro-Québec, and GENIVAR Groupe Conseil Inc., (2005). Environmental Monitoring at the La Grande Complex. Abridged Summary Report. Hydrology and Ice regime of the La Grande Rivière. Joint report by Hydro-Québec and GENIVAR Groupe Conseil inc. Montreal, QC: Hydro-Québec, 27.
IPCC. (2013). The physical science basis: Working Group I contribution to the Fifth assessment report of the Intergovernmental Panel on Climate Change. Cambridge: Cambridge University Press.
Lasalle | NHC (2016). Marée et ondes de tempête dans la baie d’hudson, la baie james, le détroit d’hudson et la baie d’ungava. Modélisation numérique des niveaux d’eau actuels et futurs dus aux Changements Climatiques. Report for Ouranos at the account of Natural Resources Canada. Lasalle, QC: Lasalle | NHC, 71.
Mahoney, A., Eicken, H., Gaylord, A. G., and Shapiro, L. (2007). Alaska landfast sea ice: links with bathymetry and atmospheric circulation. J. Geophys. Res. 112:C02001. doi: 10.1029/2006JC003559
Michel, B. (1973). Effets De L’aménagement Des Rivières De La Baie James Sur Les Conditions De Glace. Report for the Société d’énergie de la Baie James. Montreal, QC: Société d’énergie de la Baie James. 38.
Michel, B., and Doyon, B. (1991). Avant-projet N.B.R., baie de Rupert : Conditions Naturelles de Glace. Report prepared for Hydro-Québec, (Montreal, QC: Hydro-Québec), 66.
NASA, (2017a). Near Real Time (Orbit Swath) Images. Available at: https://lance.modaps.eosdis.nasa.gov/production/ (accessed September 17, 2019).
NASA, (2017b). Worldview. Available at: https://worldview.earthdata.nasa.gov/ (accessed September 17, 2019).
PCIC, (2013). Statistically Downscaled Climate Scenarios. Available at: https://www.pacificclimate.org/data/statistically-downscaled-climate-scenarios (accessed February, 2019).
Saucet, J. P. (1985). Modèle RHIVER – Conditions hivernales en rivière : températures, glaces de dérive, glaces de fond – Tome 1 – Analyse du modèle Hydro-Québec. Report prepared for Hydro-Québec. Montreal, QC: Hydro-Québec, 42.
Saucet, J. P. (1998). FRASIL, a Model of River Ice Generation And Accumulation. Internal report by Groupe-Conseil LaSalle. LaSalle, QC: Groupe-Conseil LaSalle, 65.
Saucet, J. P. (2002). Suivi Environnemental Des Projets La Grande-2A et La Grande-1 : Hydrologie et Régime Des Glaces. Report prepared for Hydro-Québec. Montreal, QC: Hydro-Québec, 50.
Selyuzhenok, V., Krumpen, T., Mahoney, A., Janout, M., and Gerdes, R. (2015). Seasonal and interannualvariability of fast ice extent in thesoutheastern Laptev Sea between1999 and 2013. J. Geophys. Res. Oceans 120, 7791–7806. doi: 10.1002/2015JC011135
Senneville, S., and St-Onge Drouin, S. (2013). Rapport final: Étude de la variation des glaces dans le système couplé océan — glace de mer de la baie d’Hudson. Report prepared for MTQ-Ouranos under the project Impacts des changements climatiques sur les infrastructures maritimes du Nunavik et solutions d’adaptation. Rimouski, QC: ISMER, 59.
Société d’énergie de la Baie James, (1994). Projet de la Grande-1 Conditions des glaces dans La Grande Rivière suite à l’aménagement de la Grande-1. Report 13. Montreal, QC: Société d’énergie de la Baie James.
Svensson, U., Billfalk, L., and Hammar, L. (1989). A mathematical model of border-ice formation in rivers. Cold Reg. Sci. Technol. 16, 179–189. doi: 10.1016/0165-232x(89)90019-0
Taha, W., Cueto Bergner, A., Levasseur, M., and Tremblay, A. (2017). Evolution of Landfast Ice Coverage in James Bay. Available at: http://www.cripe.ca/docs/proceedings/19/Taha-et-al-2017.pdf (accessed July 9–12, 2017).
USGS, (2017). Earth Explorer. Avilable at: https://earthexplorer.usgs.gov/ (accessed January 9, 2017).
Keywords: fast ice coverage, climatic change, ice dynamics, freeze-up, mid-winter, breakup
Citation: Taha W, Bonneau-Lefebvre M, Cueto Bergner A and Tremblay A (2019) Evolution From Past to Future Conditions of Fast Ice Coverage in James Bay. Front. Earth Sci. 7:254. doi: 10.3389/feart.2019.00254
Received: 16 April 2019; Accepted: 13 September 2019;
Published: 01 October 2019.
Edited by:
Tomas Halenka, Charles University, CzechiaReviewed by:
Zoe Courville, Cold Regions Research and Engineering Laboratory, United StatesAlexander Fraser, University of Tasmania, Australia
Copyright © 2019 Taha, Bonneau-Lefebvre, Cueto Bergner and Tremblay. This is an open-access article distributed under the terms of the Creative Commons Attribution License (CC BY). The use, distribution or reproduction in other forums is permitted, provided the original author(s) and the copyright owner(s) are credited and that the original publication in this journal is cited, in accordance with accepted academic practice. No use, distribution or reproduction is permitted which does not comply with these terms.
*Correspondence: Maryse Bonneau-Lefebvre, mbonneaulefebvre@lasallenhc.com