GLAM Bio-Lith RT: A Tool for Remote Sensing Reflectance Simulation and Water Components Concentration Retrieval in Glacial Lakes
- 1Department of Systems and Industrial Engineering, The University of Arizona, Tucson, AZ, United States
- 2Department of Systems and Industrial Engineering, Department of Aerospace and Mechanical Engineering, The University of Arizona, Tucson, AZ, United States
- 3Planetary Science Institute, Tucson, AZ, United States
- 4Department of Hydrology and Atmospheric Science, The University of Arizona, Tucson, AZ, United States
- 5Water, Sediment, Hazards, and Earth-surface Dynamics (waterSHED) Lab, Department of Geoscience and Environmental Science Program, University of Calgary, Calgary, AB, Canada
- 6Department of Geology, University of Dayton, Dayton, OH, United States
A new open–source software tool, called GLAM BioLith–RT (Glacier Lakes Assisted Melting Biological Lithological Radiative Transfer), has been developed for modeling of Radiative Transfer (RT) in water bodies containing suspended lithic particles, phytoplankton, dissolved salts, and colored dissolved organic matter. Although our objective is an application to glacial lakes of High Mountain Asia, the model has potential application for the study of seawater, organic-rich lakes, rivers, etc. The tool is built on a solid foundation of an existing published open-source code called WASI, which has been reviewed and augmented with new capabilities, notably the addition of a suspended lithic particle grain size parameterization. GLAM BioLith-RT operates in both a forward modeling and inverse modeling mode. The forward mode is specifically designed to compute the reflectance spectra of glacier lakes from inherent optical water properties. Conversely, in the inverse mode, measured spectral reflectance is employed with other inputs to derive best fitting water component properties (e.g., suspended particles concentration). The inverse modeling includes Bayesian inversion of the output which is a significant advance over the existing software. We have tested the code for sensitivity to noise, and uncertainties in input parameters. The model succeeds in nearly reproducing the hyperspectral reflectance of some glacial lakes in Nepal as observed by the EO-1 Hyperion hyperspectral imager. The inverse modeling approach, when supported up by validated forward modeling, offers a means for remote sensing characterization of suspended sediment load in glacial lakes and rivers and hence, use of suspended sediment as a proxy for glacial activity; and many other potential applications in other thematic areas.
1. Introduction
Satellite multispectral imaging offers much-used capabilities for efficient mapping of lakes and rivers (Chikita et al., 1999; Wessels et al., 2002; Giardino et al., 2010; Watson et al., 2017). Less developed are approaches to the characterization of lakes and rivers for their water quality and other properties by multispectral and hyperspectral imaging (Wessels et al., 2002; Ritchie and Everitt, 2003; Dornhofer and Oppelt, 2016). Relevant to the application motivating this work, we observe that glacial lakes have wide-ranging visible colors in the visible (Figure 1) and differing Near Infrared (VNIR) and Short-wave Infrared (SWIR) reflectances (Giardino et al., 2010). These “colors” are caused by suspended sediment. Clearly, there is quantifiable information about the suspended sediment contained in lakes (any lakes, not just glacial) in the multispectral and hyperspectral VNIR and SWIR reflectance spectrum (Giardino et al., 2010). From a first principle standpoint, the observable (measured) photon flux collected by space-based remote platforms hit the detector after a long journey that includes interaction with both water bodies in glacier lakes and atmosphere and undergo a variety of physical processes including scattering and absorption with the participation medium. Thus, there is a physical link between the observed photon flux (radiance) and the optical properties of the components comprising the makeup of glacier lakes. The latter can be accounted by adequately describing the absorption coefficient, backscattering coefficient, beam attenuation coefficient, and single backscattering albedo which are Inherent Optical Properties (IOP) of a water body. Conversely, remote sensing reflectance (Rrs) is among the Apparent Optical Properties (AOPs) of a water system (what a satellite sensor observes). The water physical components such as phytoplankton, detritus, colored dissolved organic matter, dissolved salts, and inorganic particles influence the IOPs. The IOPs along with the incoming light geometric distribution and the atmospheric conditions affect the AOPs. The physical link between water components concentrations, IOPs, incoming light geometric distribution, atmospheric conditions, and AOPs are usually described by the Radiative Transfer (RT) equation which accounts for the balance of photons (scattered, absorbed) to model and compute the spectral reflectance collected by the remote sensor [e.g., Bio-Lithological Optical/Radiative Transfer (RT) models (Giardino et al., 2012)].
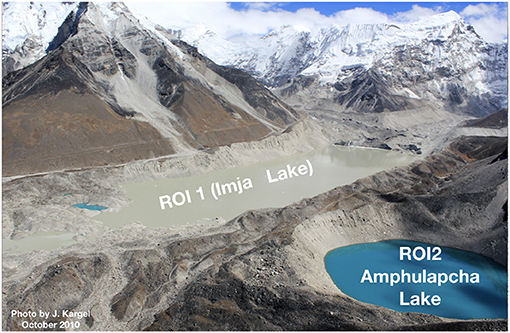
Figure 1. Low altitude oblique air–photo of Everest–area lakes and our regions of interest, ROI 1 (Imja Lake) and ROI 2 (Amphulapcha Lake). These lakes contain, respectively, large amounts of coarse silt and smaller amounts of fine silt, resulting in pronounced color differences. Both lakes are optically thick, except very near their shores.
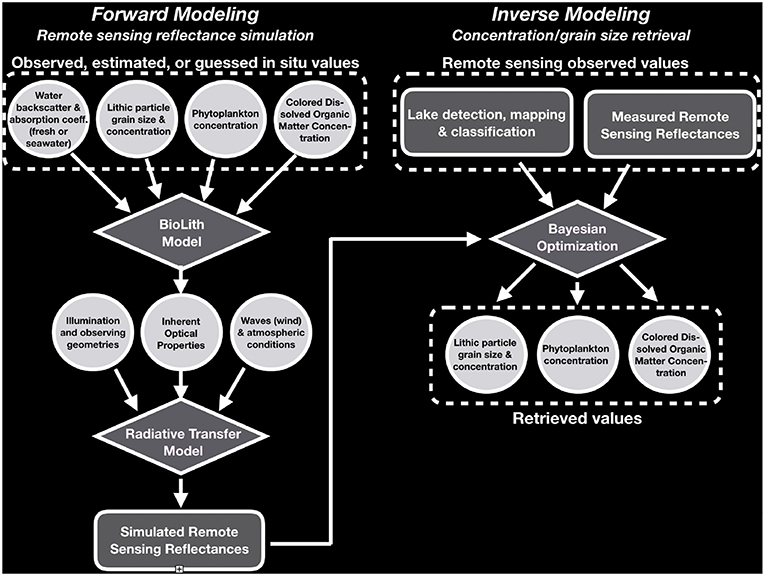
In this paper, we developed and tested, on synthetic and real data, a new open-source software tool named GLAM BioLith-RT that can be used for remote sensing reflectance simulation (forward modeling) and water components concentration retrieval (inverse modeling) in surface water of a lake, river, or sea. The software tool development is intended to allow both forward and inverse modeling of the radiative transfer influences, hence reflected spectrum, of water containing suspended lithic and phytoplankton particles, dissolved organic matter, and dissolved salts. GLAM BioLith-RT is built on Bio-Lithological Optical/RT Semi-Analytical models that are analytical parameterization of the commercial software Hydrolight (Lee et al., 1998, 1999; Albert and Mobley, 2003; Gege, 2015). The software is optimized for use with hyperspectral reflectance data, such as derivable from EOS-1 Hyperion imagery. It works in the following way:
• Forward modeling. Simulation of the spectral remote sensing reflectance given the input: model parameters and the control variable (wavelength in the visible range). This calculates the color that an eye would see, or the spectrum of a lake as a satellite might see, based on measured or arbitrary lake water and suspended sediment properties.
• Inverse modeling. Water component concentrations retrieval via optimization techniques given simulated and observed remote sensing reflectance. This modeling approach starts with what a satellite might see and determines something about the lake sediment properties (concentration, grain size, etc.).
Figure 2 shows the flowchart of the approach used in the software.
Recently, a few open–source software programs have been developed for remote sensing reflectance simulation and water physical components abundance retrieval. The two primary examples of such software that have been reported in the literature are (1) Bio-Optical Model-Based tool for Estimating water quality and bottom properties from Remote sensing images (BOMBER, Giardino et al., 2012) and (2) Water Color Simulator WASI (Gege, 2015) which have been validated and employed for the characterization of Lake Trasimeno (Italy) and Lake Constance (Austria, Germany, and Switzerland). These are two very different lakes. Lake Constance is a deep glacial meltwater fed lake having fine-grained suspended lithic rock “flour” as well as phytoplankton. Lake Trasimeno is a shallow endorheic lake with a muddy bottom and abundant coarse-grained suspended silt, phytoplankton, and dissolved organic matter. These lakes provided the authors of WASI and BOMBER with a wide range of lake water properties. Our applications are for glacial rock-flour-dominated lakes, but GLAM BioLith RT can be used for marine waters or almost any type of inland water (Ludovisi and Gaino, 2010; Marchegiano et al., 2019).
The existing software use standard constrained optimization techniques for the particle concentrations retrieval. These standard optimization techniques attempt to solve an inverse retrieval problem using a deterministic approach where a set of parameters that minimizes the square difference between modeled and observed reflectance is found. However, inverse problems are known to be ill-posed in the sense of Jacques Hardamand (Kimes et al., 2000) and thus it becomes very hard to quantify the uncertainty in the retrieved quantities mainly due to the noise in the observed data and the uncertainty in the untuned input parameter real values. GLAM BioLith–RT overcomes the issue using more recently developed Bayesian inversion techniques. In the Bayesian inversion framework, the estimated parameters are assumed to be random variables. Hence the output of the inverse modeling will be the probability distribution for each of those quantities. With this approach, the degree of uncertainty of the water component concentrations actual values is included in their probability distributions (Schiassi et al., 2016). Importantly, GLAM BioLith-RT code is developed and deployed in a modular source format. Thus, the user has access and can modify all the scripts and the functions provided according to his/her tasks (where GLAM BioLith-RT can accomplish those). Moreover, new modules and functions can be added according to the user's needs.
The paper is organized as follows. In section 2, the biological lithological and radiative transfer models used for the forward modeling are presented, along with the methodology used for the inverse modeling. Examples of Rrs simulations and particle concentrations retrieval, with syntethic and real data, are shown in section 3. In Appendix B, GLAM BioLith-RT's main features are presented, for the convenience of the user.
2. GLAM BioLith–RT: Theoretical Foundation and Modeling Approach
2.1. Forward Modeling
For both case–1 (open sea and oceans) and case–2 water (coastal zones, lakes, estuaries, etc.) GLAM BioLith-RT performs remote sensing reflectance simulations given the water component concentrations, the wavelength, the geometry of the light field, and the atmospheric conditions. The BioLith-RT model used in GLAM BioLith-RT is based mainly on the models presented in Gege (2014, 2015) and Albert and Mobley (2003). As shown in the flowchart, the BioLith model computes the IOPs, given the water component concentrations and the wavelength. The RT model uses the computed IOPs, the given geometry of the light field, and the given weather conditions to simulate the spectral remote sensing reflectance.
2.1.1. BioLith Model
The biological lithological model for the IOPs computation is based on the models presented in Gege (2015) and Albert and Mobley (2003). Those models are validated using mainly in–situ measurements from Lake Constance (Gege, 2015) and Lake Trasimeno (Giardino et al., 2015). Thus, this model is expected to work with high accuracy for these kind of lakes. The user has to be careful when using the same biological lithological model for different kind of lakes as it can lead to less accurate results if the lake biological–mineralogical compositions are significantly different from Lake Constance and Lake Trasimeno type lakes.
In this model, three types of water components are considered: phytoplankton ph, Color Dissolved Organic Matter CDOM, and Suspended Particle Matter SPM 1. At this stage, since we are dealing with case–2 water types, according to Gege (2015) and Albert and Mobley (2003) we are neglecting the presence of phytoplankton among the SPM. Therefore, SPM is made only by lithic particles. The IOPs calculated with the BioLith model are: absorption coefficient, backscattering coefficient, beam attenuation coefficient (sum of the previous two), and single backscattering albedo (ratio of backscattering over beam attenuation).
2.1.1.1. Absorption coefficient
The total absorption coefficient is the sum of the water absorption coefficient and the absorption coefficients of the components listed above. That is:
The pure water absorption coefficient is the water absorption coefficient at a reference temperature of T0 = 293.15 K [imported from database available with the software, which is combined from different sources (Gege, 2015)].
The phytoplankton absorption coefficient is modeled as the sum of chlorophyll-a and phaeophytin-a:
where , with Cph is the phytoplankton concentration in mgm−3.
The CDOM absorption coefficient is modeled as Babin et al. (2003):
where aCDOM(λ0) is the CDOM absorption coefficient at λ0 = 440 nm, linked to the CDOM concentration, and is the specific absorption coefficient normalized to 1:
The SPM absorption coefficient is modeled as Babin et al. (2003):
where aX(λ0) is the SPM absorption coefficient at λ0 = 440 nm, linked to the SPM concentration, and is the specific absorption coefficient normalized to 1:
2.1.1.2. Backscattering coefficient
According to Gege (2015), in the BioLith model used in our software only SPM and the water contribute to the backscattering. That is:
The pure water backscattering coefficient is modeled as in Gege (2015) following the empirical relation of Morel (1974):
where b1 = 0.00111 m−1 for fresh water (case-2 water) or b1 = 0.00114 m−1 for water with 3.5−3.8 % salinity (case-1 water), and λ1 = 500 nm (Gege, 2015).
The SPM backscattering coefficient is modeled as follows:
where CX in gm−3 is the SPM concentration and is the specific backscattering coefficient which is considered wavelength independent, in the visible range, for many type of waters (Albert and Mobley, 2003). Often, this parameter is not a constant, but it is function of both the grain size and the single back scattering albedo ωb,X. In WASI, m2kg−1, which corresponds to spherical perfect scattering particles with grain size of r = 33.57 × 10⁻⁶ m, as we back-calculate next. As first approximation for the back-calculation, we consider the lithic particles as perfectly reflecting spherical scatterers. If there was one particle of mass 1 kg, its volume would be m3, considering a density of 2600 kg m−3. Thus, 1 kg particle's radius is m. The subtended area for that single 1 kg particle (the area that a beam of photons would intersect) is then equal to πR2 = 0.0064 m2. However, the 1 kg of particles giving that backscatter coefficient value is disseminated in many small particles having a larger total surface area than the one just calculated. The ratio area over the volume of a sphere is proportional to . For perfectly scattering particles giving the above-stated backscatter coefficient, the total area of grains giving WASI's specific backscattering coefficient 0.0086 m2g−1 is 8.6 m2. That is, the summed areas of the subtended circles of the relevant small grain diameter divided by the circular cross-sectional area of the single 1 kg grain is then . Hence, it follows that the small particles have a radius of factor 1,343.75 smaller than the single 1 kg particle, namely m = 33.57μm, which is the back calculated grain size that gives the WASI's value of the specific backscattering coefficient. This is the size of very fine sand. This calculation is for perfect scatterers. If we drop the perfect scatterers assumption, the particles will have a single backscattering albedos ωb,X lower than 1 (ωb,X = 1 for perfect scatterers). Thus, the total area of particles must be increased and the particle radius decreased by a factor . From this it follows that the backscatter coefficient is a function of both the grain size (radius) and the single backscattering albedo (which is wavelength dependent). That is:
where r is the SPM grain size.
2.1.2. Radiative Transfer (RT) Model
As mentioned above, the RT model used to compute the spectral remote sensing reflectance Rrs(λ) is an analytical parametrization of the commercial software Hydrolight, based mainly on Gege (2015), Lee et al. (1998), Lee et al. (1999), and Albert and Mobley (2003). Rrs(λ) is defined as the ratio of the upwelling radiance to the downwelling irradiance (the former is the radiation field directed in the upward hemisphere and the latter is directed in the downward hemisphere). This subsection describes how Rrs(λ) is computed in GLAM BioLith-RT. As Rrs(λ) is calculated as in Gege (2015) and Albert and Mobley (2003), for the sake of clarity the same notation used in Gege (2015) and Albert and Mobley (2003) will be adopted here. Gege (2015) and Albert and Mobley (2003) compute Rrs(λ) taking in consideration the radiative influence of the water column and the air above the water surface. Below the water surface (water column contribution), the remote sensing reflectance is computed both for deep water and shallow water (in the former the bottom contribution to the remote sensing reflectance is trivial). The user can select whether to use case–1 or case–2 water, and deep or shallow water.
For case–2 deep water the remote sensing reflectance below the surface is modeled as follows:
The factor Q measures the light field anisotropy into the water. Q is wavelength dependent, but as no convenient parameterization is known it is considered constant. In Gege (2015), Q = 5 steradians (sr) by default, and so it is here. The irradiance reflectance R(λ) is computed by using the following parameterization:
where the factor f considers the dependency of R(λ) on the light field properties. As previously mentioned ωb is the single backscattering albedo and is defined as the ratio of the backscattering coefficient to the beam attenuation coefficient:
An alternative form to Equation (11), which is used in WASI and in our software, is given by:
The factor frs(λ) sr−1 is modeled as follows:
where is the solar zenith angle viewed within the water after refraction and is the viewing angle viewed within the water after refraction (both in radians). Notice that:
For case-1 deep water, the remote sensing reflectance is modeled as in 14, where frs(λ) = 0.095 sr−1 (Albert and Mobley, 2003).
The remote sensing reflectance below the surface for shallow water is modeled as follows:
On the right-hand side, we sum the remote sensing reflectance of a water slab with thickness zB and the remote sensing reflectance of the lakes's bottom seen at the lake surface within the water column. All the terms in Equation (17) are the same as in WASI (Gege, 2015), and for the convenience of the reader they are described and computed in details in the Appendix.
2.2. Inverse Modeling: Parameters Retrieval Methodology
By default, the decision variables for the inverse modeling are the water component concentrations Cph, CCDOM, and CX. All the other parameters described in the previous sections are considered fixed and will not be fit in the optimization problem. The inversion of the model can be done with standard constrained optimization, Bayesian inversion, or a combination of the two.
2.2.1. Bayesian Inversion vs. Standard Constrained Optimization
In our software, the inverse modeling is a typical example of inverse problem to parameters' estimation, where the goal is to characterize a physical system, water systems in our specific case. As stated in Kolehmainen (2013), inverse problems to parameters' retrieval are in general ill-posed for two main reasons; (1) the problem is non-unique as most of the times we deal with more unknowns than data/measurements, and (2) the stability of the solution, to modeling errors and noise in the data, is not guaranteed. Inverse problems are usually solved via standard constrained optimization, which uses a deterministic approach to solve the problem. That is, standard optimization techniques consider the adjustable values to be deterministic. This causes the inverse problems' outputs to be fixed quantities. However, these quantities are affected by uncertainties that need to be computed. Unfortunate, uncertainty estimations (usually done via regularization techniques, e.g., Tikhonov regularization) are not trivial to perform; and they can lead to poor results, especially when the problem is ill-posed, which is the case for most of the inverse problems of interest. Moreover, inverse problems when they are nonlinear or non-convex, or both, have more local minimum solutions. Therefore more than one acceptable solutions can be found, and it becomes challenging to select the best one via the classical optimization framework (Aster et al., 2013). In the Bayesian framework, the parameters to retrieve are considered themselves as random variables. Thus, the solution of the Bayesian inversion is the probability distribution of each one of those quantities. This distribution is the combination of the prior distribution for the model parameters with the collected data. The main advantage of using the Bayesian framework to solving inverse problems is that, as the outputs are probability distributions, we automatically get more information about the parameters we want to estimate. That is, at last our goal is to retrieve a specific value for the quantity we want to estimate; and this value can be, for instance, the mean of the posterior distribution (which will be the same value that we would get via solving the problem via regularized least square method, when the posterior is normal). However, as we deal with probability distributions, along with the mean, we will have the estimate of the variance which is a valuable piece of extra information to evaluate our trust in the retrieved estimations (Theodoridis, 2015). Moreover, as stated in Schiassi et al. (2016) and Kolehmainen (2013), another advantage of the Bayesian approach is that ill-posedness are removed by using prior information about the solutions. Since all variables are considered random, the randomness reflects the uncertainty about their true values; and the degree of uncertainty is intrinsically coded in the probability distribution of these variables.
2.2.2. Standard Constrained Optimization
In the classical constrained optimization the water characterization is done by solving the following optimization problem:
• Data: remote sensing reflectance measured by satellite at different wavelengths , where the index i = 1, …, N refers to the wavelengths, and all the parameters that will not be tuned and hence are fixed.
• Decision Variables: water component concentrations Cj, where the index j refers to the jth water component
• Objective Function:
• Constrains:
- Rrs,i = BioLith_RT(λi|Fixed2, C), i = 1, …, N. Where Rrs,i is the remote sensing reflectance simulated by our software at different wavelengths
- C = [Cph, CCDOM, CX] ≥ 0
• Optimization Problem: The overall optimization problem is defined as a non-linear quadratic minimization problem, i.e.:
2.2.3. Bayesian Inversion
As previously stated, with the classical constrained optimization framework, the parameters we seek to retrieve are considered as deterministic quantities. By explicitly adding random noise to the model we can estimate the uncertainty about their true values. But this strategy is not trivial and can lead to the introduction of strong model assumptions and model bias, especially when the problems are ill-posed. In the Bayesian approach, the parameters to estimate are considered themselves as random variables. The solution of a Bayesian optimization is the probability density distribution of each parameter to fit. According to Kolehmainen (2013) the degree of uncertainty is embedded in these densities and the random nature of these variables reflects the uncertainty on their true values. This distribution is called posterior and is the combination of the prior distribution, for the quantities to estimate, with the observed data via the Bayes' rule (Rogers and Girolami, 2003; Schiassi et al., 2016):
where, in accordance with the notations in Schiassi et al. (2016), m are the observed data, x are the parameters to retrieve, Γ(m|x) is the likelihood function (i.e., the probability distribution for the observed data given the parameters to retrieve), πpr(x) is the prior distribution for the parameters to fit, and π(m) is the marginal likelihood (normalization constant). The posterior distribution is then used to compute expectation in the form:
In the cases of interest quantities such as 19 are impossible to evaluate analytically. Thus either approximation or sampling techniques must be used. Especially when n is large the sampling techniques are the best choice as they allow to sample directly from the true posterior. To sample directly from the posterior Markov Chain Monte Carlo (MCMC) methods are used. There are many algorithms to perform MCMC sampling. The most common one is the Metropolis-Hastings (MH). Haario et al. (2006) presents other widely used algorithms such as the Adaptive Metropolis-Hastings (AM), Delayed rejection (DR), or their combination called DRAM, which will be used for our parameters retrieval.
In our software, by default, we consider uninformative priors, i.e., πpr(Cj) = N(0, ∞) for each j, and the following likelihood:
where are random variables defined as follows:
Assuming that εi are i.i.d. ~ N(0, σ2), it follows that:
with C = [Cph, CCDOM, CX] ≥ 0
2.2.4. Combination of Classical and Bayesian Inversion
The combination of classical and Bayesian frameworks in solving inverse problems works in two the sequential steps, (1) classical constrained optimization is performed to compute the water component concentration values to be used as a first guess for the MCMC sampling process, and (2) Bayesian inversion as described above. The motivation in combining the two frameworks is to speed up the convergence of the Bayesian inversion. When the problem is heavily ill-posed, or we do not have prior knowledge so that we have to use uninformative priors, the convergence of the Bayesian inversion can be slower if we poorly chose the first guess to initiate the MCMC sampling.
3. Results and Discussions
In this section, results from both forward modeling mode and inverse modeling mode are presented and discussed. All the inputs and outputs are listed in details in the Appendix B.For the forward modeling mode the following examples are considered, (1) water with different CDOM concentrations, (2) water with different SPM concentrations and fixed grain size, (3) water with different SPM grain size, and fixed concentration, and (4) a model with parameters selected to match Hyperion hyperspectral data for two glacier lakes in Nepal. In the examples 2 and 3, SPM is idealized as pefect scatterers.For inverse modeling mode the following examples are showed, (1) concentrations retrieval using synthetic remote sensing reflectance data (for sensitivity analysis) for lakes containing both organic components (phytoplankton and CDOM) and minerals (SPM), and (2) concentrations retrieval using Hyperion hyperspectral data for Imja lake (Nepal).
3.1. Forward Modeling Mode: Simulations
For the first three sets of simulations the following fixed parameters are considered: case–2 water, view and sun zenith angle 0 and 40 degrees respectively, shallow water, 4 m bottom depth, only sediment in the bottom composition, Angstrom exponent= 1.317, atmospheric pressure= 1013.25 mbar, relative humidity=0.60, scale height for ozone= 0.300 cm, scale height of the precipitable water in the atmosphere= 2.500 cm. For the last simulation, we consider: case–2 water, view and sun zenith angle 0.98 and 51.2 degrees respectively (angles with which the image was taken), deep water, Angstrom exponent= 1.317, atmospheric pressure= 1013.25 mbar, relative humidity=0.60, scale height for ozone= 0.300 cm, scale height of the precipitable water in the atmosphere= 2.500 cm.
3.1.1. CDOM Concentration Variation
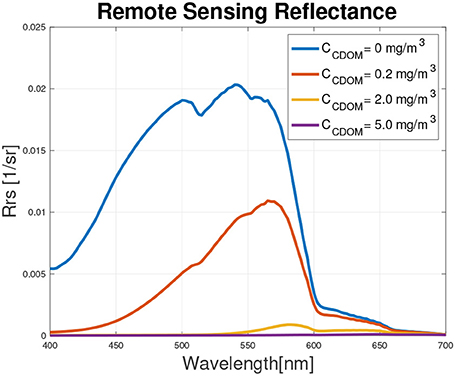
For this example, the water system is assumed to be made of fresh water and CDOM, i.e., Cph = CSPM = 0. Figure 3 shows Rrs(λ) for the four different scenarios reported in Table 1.
Figure 3 shows, as expected, that via increasing the CDOM concentration the peak of the spectrum shifts toward higher wavelengths and the water becomes darker, as CDOM is an absorber. The inflection points are discrete absorptions due to the water component.
3.1.2. SPM Concentration Variation, Fixed Grain Size
For this example, the water system is assumed to be made of fresh water and SPM with fixed grain size, i.e., Cph = CCDOM = 0. Figure 5 show Rrs(λ) for their four different scenarios reported in Table 2.
Figure 4, as expected, shows that via increasing the SPM concentration, with fixed SPM grain size, the water becomes brighter, since for this example the variable amount of SPM is approximated as idealized perfect scatterers. The inflection points are discrete absorptions due to the water component.
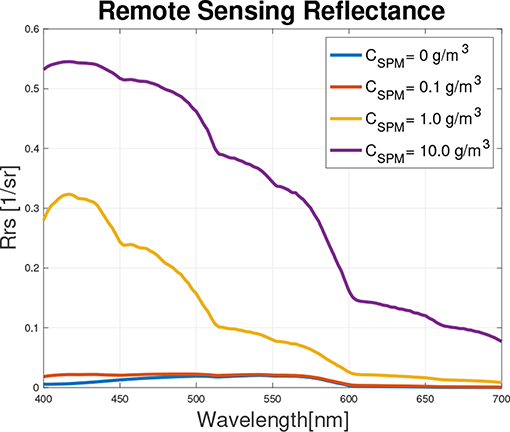
Figure 4. Spectral remote sensing reflectance vs. wavelengths and SPM concentration, fixed grain size.
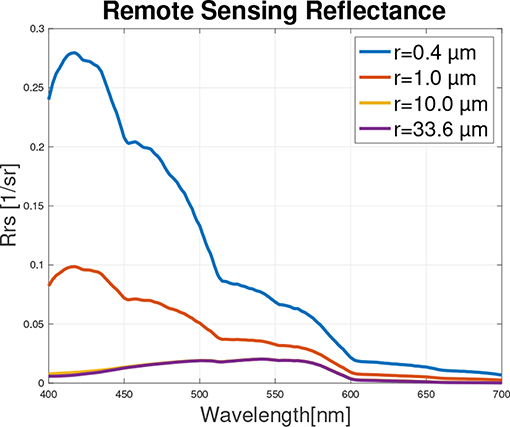
Figure 5. Spectral remote sensing reflectance vs. wavelengths and SPM grain size, fixed concentration.
3.1.3. SPM Grain Size Variation, Fixed Concentration
For this example, the water system is assumed to be made of fresh water and SPM with different grain size and fixed concentration, i.e., Cph = CCDOM = 0. Figure 6 shows Rrs(λ) for the four different scenarios reported in Table 3.
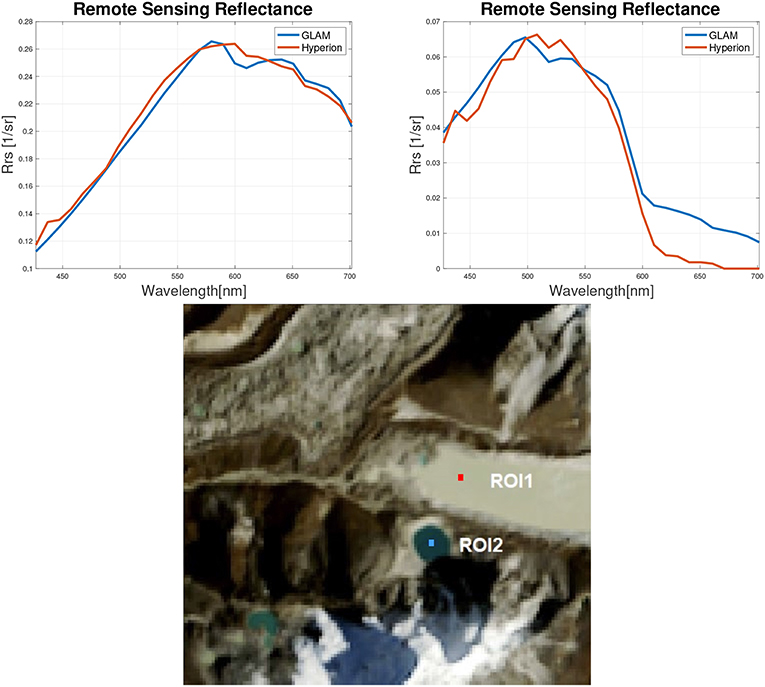
Figure 6. Hyperion reflectances vs. GLAM BioLith–RT simulated reflectances: Imja–ROI 1 (top–left), Amphulapcha–ROI 2 (top–right), Hyperion RGB image (bottom).
Figure 5 shows, as expected, that via decreasing the SPM grain size, with fixed SPM concentration, the peak shifts toward shorter wavelengths and the water becomes brighter, since for this example the constant amount of SPM is approximated as idealized perfect scatterers. The inflection points are discrete absorptions due to the water component.
3.1.4. GLAMBioLith RT Applicability to Glacial Lake Hyperspectral Data
We have exercised GLAMBioLith RT to match a set of hyperspectral observations covering the two main glacial lakes shown in Figure 1, Imja Lake (the big rectangular gray-brown lake) and Amphulapcha Lake (the small, round, blue lake). These lakes receive suspended sediment of almost the same lithologies derived from glacial erosion of leucogranite and black gneiss–the dominant minerals being quartz, feldspar, and muscovite. However, Imja Lake is far more active in terms of meltwater and debris–laden iceberg input and contains abundant medium and coarse–grained silt. Amphulapcha Lake is not in direct contact with a glacier, is less active, and the coarse sediment has a chance to settle, leaving a suspended sediment load of fine silt. The result is a water of strikingly different coloration, as also seen in the Hyperion spectra (Figure 7). For the simulations shown in Figure 7, we have taken the Hyperion image metadata for observing and illumination geometries and the atmospheric conditions relevant for this area. As for the water components concentrations and the grain size we used the values reported in Table 4. For both the lakes, the values of CX is set equal to the values measured by Giardino et al. (2010). SPM grain size and CDOM concentration were manually adjusted until a good fit was reached with the spectra of the two lakes. The residuals are in the order of 10−4 for Imja and 10−2 for Amphulapcha. This suggests, as previously mentioned, that the BioLith model is accurate for Imja type lakes, but can be improved for Amphulapcha lakes.
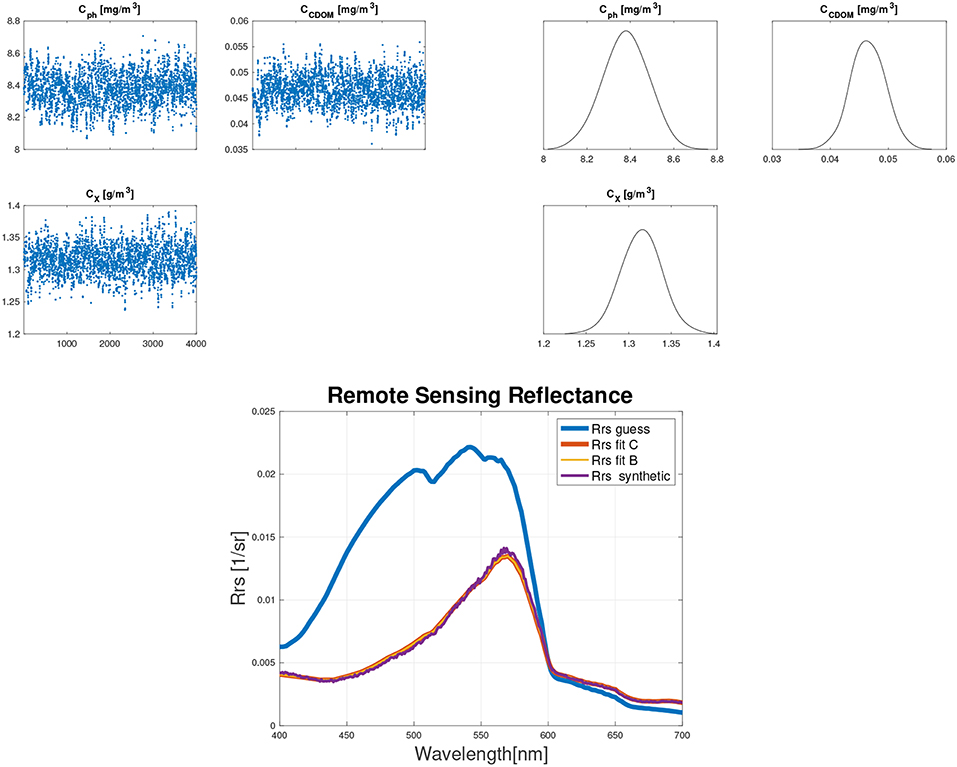
Figure 7. Results for example 1: sampled concentrations, where in the x–axis the number of MCMC samples are reported (top–left), posterior distributions (top–right), and real remote sensing reflectance vs. simulated ones (bottom).
3.2. Inverse Modeling Mode
3.2.1. Lakes Containing Both Organic Components and Minerals
The following examples show the sensitivity of the retrieved concentrations with respect to different choices of the fixed parameters. It is showed that when the value of any fixed parameter differs from the real one, the accuracy in the fit parameters decreases, as expected. We produced synthetic data to use as observed remote sensing reflectance to perform the inverse modeling (RrsObsSyn1.txt) To produce the synthetic data we used the fixed parameters values used for the forward modeling mode examples, changing only the sun zenith inclination (set equal to 35 degrees here), the water components concentrations, and the grain size reported in Table 5.
To retrieve the water components concentrations we combined classical and Bayesian approaches in the following fashion: with the constrained optimization we computed the fit quantity to use as the first guess for the MCMC sampling in the Bayesian inversion. Uninformative prior distributions are considered and 4, 000 samples are drawn with the MCMC sampling process.
In all the examples we considered pure water, i.e., Cph = CCDOM = CSPM = 0, as the first estimate for the water system composition and the following fixed parameter values:
• Example 1: same as the synthetic data
• Example 2: same as the synthetic data but changing the sun inclination to 40 degrees, the bottom composition to sand only, and the bottom depth to 16 m.
Mean and standard deviation, and the relative percent mean errors of sampled posteriors for example, 1 are reported in Table 6.
Mean and standard deviation, and the relative percent mean errors of sampled posteriors, for example 2 are reported in Table 7.
The relative percent mean error for the ith component is computed as follows:
where the estimated value is the mean of the posterior distribution.
Figures 7, 8 show that the MCMC sampling converges in all the scenarios considered. Moreover, the results show that, as expected, the relative errors and the uncertainties in the retrieved quantities increases as the errors in selecting the fixed parameters values increase. That is, the higher the knowledge we have about the water system to characterize the higher will be the accuracy in the retrieved quantities. In the remote sensing reflectance plot, the blue line (Rrs guess) is the simulated remote sensing reflectance using the guessed parameters, the purple line (Rrs synthetic) is the synthetic remote sensing reflectance, the red line (Rrs fit C) is the simulated remote sensing reflectance using the parameters retrieved via standard constrained optimization, and the yellow line (Rrs fit B) is the simulated remote sensing reflectance using the mean values of the parameter probability distributions retrieved via Bayesian inversion. The red and the yellow lines overlap as the constrained optimization outputs are almost the same as the means of the Bayesian inversion outputs. That is, for this case the posterior distributions are Gaussian (Figures 7, 8), and thus, as previously mentioned, the means are the same as the outputs of the classical constrained optimization.
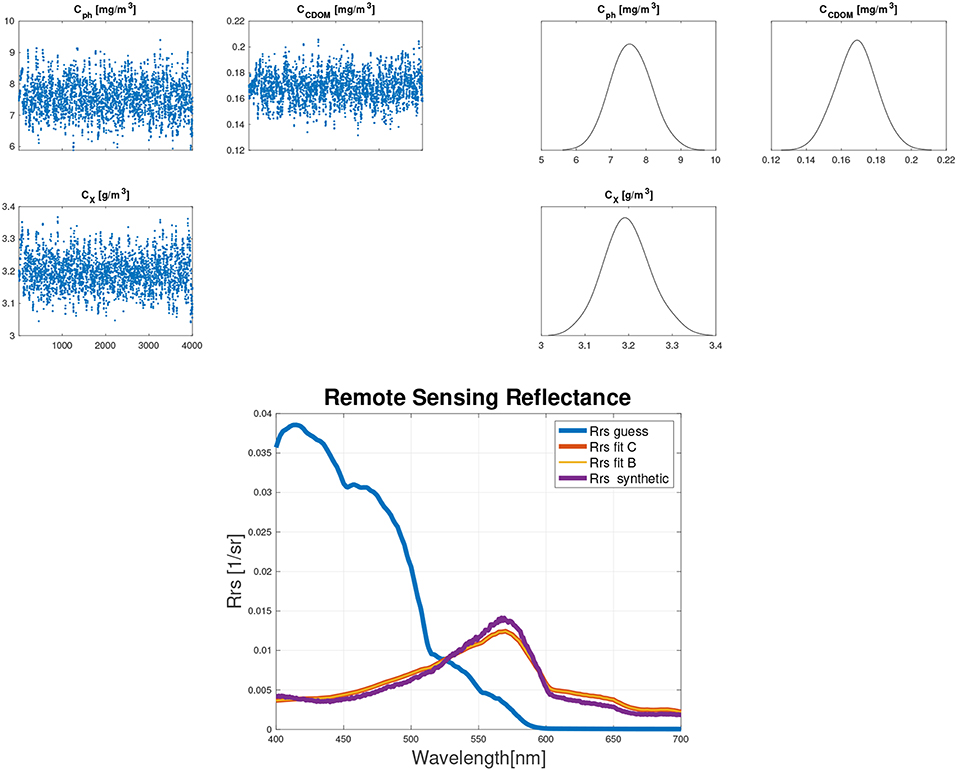
Figure 8. Results for example 2: sampled concentrations, where in the x–axis the number of MCMC samples are reported (top–left), posterior distributions (top–right), and real remote sensing reflectance vs. simulated ones (bottom).
3.2.2. Inverse Modeling on Hyperspectral Data for Imja Lake
The previous examples have proved the reliability of our software in solving inverse problems for water components concentrations retrieval from satellite data, where we created synthetic satellite data to test our tool. In particular the sensitivity of GLAM Biolith RT to noise and uncertainty in the data has been tested. In this example, we test the software in retrieving concentrations and SPM grain size using hyperspectral remote sensing reflectance from a particular spot (red dot in Figure 6) of Imja lake. Again, for the retrieval we combined standard and Bayesian approaches to solve the inverse problem. CDOM and SPM concentration along with the SPM grain size are the tuned parameters. We assumed no presence of phytoplankton, hence Cph is set equal to zero and it is a fixed parameter. The other fixed parameters are the same used in the last example for the forward modeling, where we reproduced the Hyperion reflectances.From Figure 9 can be seen that MCMC sampling converges. Mean, and standard deviation of the sampled posterior distributions are reported in Table 8. Our results are in accordance with Giardino et al. (2010), that collected a set of in–situ measurements on several lakes of the Himalayas, finding that for gray lakes both CDOM and SPM contribute to the photons absorption. Moreover, in the same area of Imja lake, Giardino et. al. measured SPM concentration around 50 gm−3 (Giardino et al., 2010) which is in accordance with the posterior distribution that we retrieved with our tool.In this case, the convergence of the Bayesian inversion is slower then the previous examples (10, 000 iterations vs. 4, 000), as it can be seen in the top–left plot of Figure 9. This is due to the fact the values used as initial guess to start the MCMC sampling were far from the measured ones. The initial guess was computed with the classical constrained optimization, giving the following values: CCDOM = 1.407 mgm−3, CX = 10.538 gm−3, r = 0.631μm. This example shows that the standard optimization, due to the ill-posedness of the problem, failed in the retrieval. However, the Bayesian inversion managed in reaching the convergence toward the values close to the measured ones.
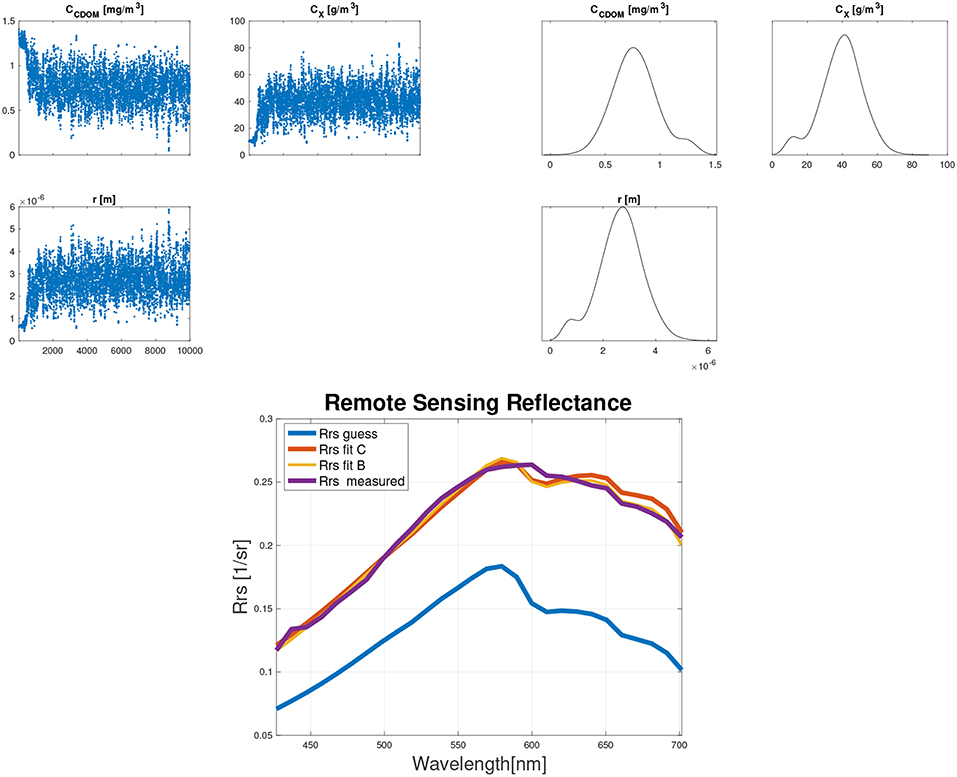
Figure 9. Results for Imja Lake: sampled concentrations, where in the x–axis the number of MCMC samples are reported (top–left), posterior distributions (top–right), and real remote sensing reflectance vs. simulated ones (bottom).
4. Conclusions and Outlooks
The primary goal of this paper is to present GLAM BioLith-RT, a new open–source software tool for modeling RT in water bodies. The software has been developed primarily for educational and research uses, and what it does is the following:
• Remote sensing reflectance simulation via the Bio-Optical-RT models presented in Gege (2015) and Albert and Mobley (2003) (forward modeling)
• Water component concentrations retrieval via constrained optimization framework, Bayesian inversion framework, and combination of the two (inverse modeling)
As previously stated, the Bayesian inversion framework is an advancement over the existing software programs as it automatically includes the uncertainty in the fit parameters, and removes the ill-posedness by using prior information about the solutions.
In this paper along with presenting the main features of our software, we proved its reliability both in the forward and inverse modeling modes. In particular we showed its sensitivity to the noise and uncertainty in the data in retrieving the water components concentrations. Moreover we tested it, both in forward and inverse mode, with hyperspectral data for two Himalayas lakes; finding our results in accordance with the in–situ measurements collected by Giardino et al. (2010).
Our next task is to adapt and validate GLAM BioLith-RT to the characterization of glacial and non-glacial lake waters in Nepal and the United States for which we will use detailed lab measurements of the suspended sediment load's composition, grain size, and concentration, and have knowledge of the water body's bathymetry, bottom sediment lithology, colored dissolved organic material concentration, and plankton abundance. We also look forward to applying the inverse mode to the study of lakes in High Mountain Asia. To achieve this goal the BioLith model should be modified and adapted to the composition of glacier lake of interest, based on in–situ measurements and lab analysis. Among our intended next advances, besides rigorous validation, is the incorporation of a more detailed model for the lithogical components' absorption, and to investigate the extension of the software in wavelength through the NIR and possibly parts of the SWIR range.
Data Availability Statement
The datasets generated for this study are available on request to the corresponding author.
Author Contributions
ES: coder and operator of GLAM BioLith-RT. RF: broad design of the code and advisor of the lead author, and edited the manuscript. JK: contributed to the writing and provided broad guidance on glacial lakes, and edited the manuscript. CW: provided Hyperion data and edited the manuscript. DS and UH: edited the manuscript.
Funding
We thank NASA for funding (NNX16AQ62G and 80NSSC19K0653).
Conflict of Interest
The authors declare that the research was conducted in the absence of any commercial or financial relationships that could be construed as a potential conflict of interest.
Supplementary Material
The Supplementary Material for this article can be found online at: https://www.frontiersin.org/articles/10.3389/feart.2019.00267/full#supplementary-material
Footnotes
1. ^According to Gege (2015) and Albert and Mobley (2003) a subscripted X is also used to refer to the SPM.
2. ^Fixed is a structure containing the values of all the fixed parameters that will not be tuned in the optimization problem.
References
Albert, A., and Mobley, C. D. (2003). An analytical model for subsurface irradiance and remote sensing reflectance in deep and shallow case-2 waters. Optics Express 11, 2873–2890. doi: 10.1364/OE.11.002873
Aster, R. C., Borchers, B., and Thurber, C. H. (2013). Parameter Estimation and Inverse Problems, 2nd Edn. London: Elsevier Inc. doi: 10.1016/B978-0-12-385048-5.00011-2
Babin, M., Stramski, D., Ferrari, G. M., Claustre, H., Bricaud, A., Obolensky, G., et al. (2003). Variations in the light absorption coefficients of phytoplankton, nonalgal particles, and dissolved organic matter in coastal waters around Europe. J. Geophys. Res. 108:3211. doi: 10.1029/2001JC000882
Chikita, K., Jha, J., and Yamada, T. (1999). Hydrodynamics of a supraglacial lake and its effect on the basin expansion: Tsho Rolpa, Rolwaling Valley, Nepal Himalaya. Arctic Antarctic Alpine Res. 31, 58–70. doi: 10.1080/15230430.1999.12003281
Dornhofer, K., and Oppelt, N. (2016). Remote sensing for lake research and monitoring a Recent advances. Ecol. Indic. 64, 105–122. doi: 10.1016/j.ecolind.2015.12.009
Gege, P. (2014). WASI-2D: a software tool for regionally optimized analysis of imaging spectrometer data from deep and shallow waters. Comput. Geosci. 62:208215. doi: 10.1016/j.cageo.2013.07.022
Gege, P. (2015). The Water Color Simulator WASI, User manual for WASI Version 4.1. Available online at: http://www.ioccg.org/data/software.html
Giardino, C., Bresciani, M., Valentini, E., Gasperini, L., Bolpagni, R., and Brando, V. E. (2015). Airborne hyperspectral data to assess suspended particulate matter and aquatic vegetation in a shallow and turbid lake. Remote Sens. Environ 157, 48–57. doi: 10.1016/j.rse.2014.04.034
Giardino, C., Candiani, G., Bresciani, M., Lee, Z., Gagliano, S., and Pepe, M. (2012). BOMBER: A tool for estimating water quality and bottom properties from remote sensing images. Comput. Geosci. 45, 313–318. doi: 10.1016/j.cageo.2011.11.022
Giardino, C., Oggioni, A., Bresciani, M., and Yan, H. (2010). Remote sensing of suspended particulate matter in Himalayan Lakes. Mount. Res. Dev. 30, 157–168. doi: 10.1659/MRD-JOURNAL-D-09-00042.1
Haario, H., Laine, M., Mira, A., and Saksman, E. (2006). DRAM: efficient adaptive MCMC. Stat. Comput. 16, 339–354. doi: 10.1007/s11222-006-9438-0
Kimes, D. S., Knyazikhin, Y. P., Privette, J. L., Abuelgasim, A. A., and Gao, F. (2000). Inversion methods for physically-based models. Remote Sens. Rev. 18, 381–439. doi: 10.1080/02757250009532396
Kolehmainen, V. (2013). Introduction to Bayesian Methods in Inverse Problems. Department of Applied Physics, University of Eastern Finland, Kuopio; Manchester, UK.
Lee, Z., Carder, K. L., Mobley, C. D., Steward, R. G., and Patch, J. S. (1998). Hyperspectral remote sensing for shallow waters. 1. A semianalytical model. Appl. Optics 37, 6329–6338. doi: 10.1364/AO.37.006329
Lee, Z., Carder, K. L., Mobley, C. D., Steward, R. G., and Patch, J. S. (1999), Hyperspectral remote sensing for shallow waters: 2. Deriving bottom depths water properties by optimization. Appl. Optics 38, 3831–3843. doi: 10.1364/AO.38.003831
Ludovisi, A., and Gaino, E. (2010). Meteorological and water quality changes in Lake Trasimeno (Umbria, Italy) during the last fifty years. J. Limnol. 69, 174–188. doi: 10.3274/JL10-69-1-16
Marchegiano, M., Francke, A., Gliozzi, E., Wagner, B., and Ariztegui, D. (2019). High-resolution palaeohydrological reconstruction of central Italy during the Holocene. Holocene 29, 481–492. doi: 10.1177/0959683618816465
Morel, A. (1974). “Optical properties of pure water and pure sea water,” in Optical Aspects of Oceanography, eds N. G. Jerlov and N. E. Steemann (London: Academic Press), 1–24.
Ritchie, J. C., Zimba, P. V., and Everitt, J. H. (2003). Remote sensing techniques to assess water quality. Photogram. Eng. Remote Sens. 69, 695–704. doi: 10.14358/PERS.69.6.695
Rogers, S., and Girolami, M. (2003). A First Course in Machine Learning, 2nd Edn. London: Chapman and Hall/CRC.
Schiassi, E., Furfaro, R., and Mostacci, D. (2016). Bayesian inversion of coupled radiative and heat transfer models for asteroid regoliths and lakes. Radiat. Effects Defects Solids 171, 736–745. doi: 10.1080/10420150.2016.1253091
Theodoridis, S. (2015). Machine Learning, A Bayesian and Optimization Perspective, 1st Edn. London: Academic Press.
Watson, C. S., Quincey, D. J., Carrivick, J. L., Smith, M. W., Rowan, A. V., and Richardson, R. (2017). Heterogeneous water storage and thermal regime of supraglacial ponds on debris-covered glaciers. Earth Surface Process. Landforms. 43, 229–241. doi: 10.1002/esp.4236
Keywords: remote sensing, Bayesian inversion, glacial lakes, hyperspectral/multispectral reflectance, suspended sediment, Inverse mode problem, forward mode, radiative transfer
Citation: Schiassi E, Furfaro R, Kargel JS, Watson CS, Shugar DH and Haritashya UK (2019) GLAM Bio-Lith RT: A Tool for Remote Sensing Reflectance Simulation and Water Components Concentration Retrieval in Glacial Lakes. Front. Earth Sci. 7:267. doi: 10.3389/feart.2019.00267
Received: 01 May 2019; Accepted: 27 September 2019;
Published: 15 October 2019.
Edited by:
Sujay V. Kumar, Goddard Space Flight Center, National Aeronautics and Space Administration, United StatesReviewed by:
Qian Yu, University of Massachusetts Amherst, United StatesNinglian Wang, Chinese Academy of Sciences, China
Copyright © 2019 Schiassi, Furfaro, Kargel, Watson, Shugar and Haritashya. This is an open-access article distributed under the terms of the Creative Commons Attribution License (CC BY). The use, distribution or reproduction in other forums is permitted, provided the original author(s) and the copyright owner(s) are credited and that the original publication in this journal is cited, in accordance with accepted academic practice. No use, distribution or reproduction is permitted which does not comply with these terms.
*Correspondence: Roberto Furfaro, robertof@email.arizona.edu
 Enrico Schiassi
 Roberto Furfaro
 Jeffrey S. Kargel3
  Cameron Scott Watson
 Dan H. Shugar
 Umesh K. Haritashya