Weathering Dynamics Under Contrasting Greenland Ice Sheet Catchments
 Alejandra Urra1,2*
  Jemma Wadham1
  Jon R. Hawkings1,3,4
  Jon Telling5
  Jade E. Hatton6
  Jacob C. Yde7
  Bent Hasholt8
  Dirk van As9 Maya P. Bhatia10
  Peter Nienow11
- 1Bristol Glaciology Centre, School of Geographical Sciences, University of Bristol, Bristol, United Kingdom
- 2Centro de Estudios Cientificos, Valdivia, Chile
- 3National High Magnetic Field Lab, Earth, Ocean and Atmospheric Sciences, Florida State University, Tallahassee, FL, United States
- 4German Research Centre for Geosciences GFZ, Potsdam, Germany
- 5School of Natural and Environmental Sciences, Newcastle University, Newcastle upon Tyne, United Kingdom
- 6School of Earth Sciences, University of Bristol, Bristol, United Kingdom
- 7Department of Environmental Sciences, Western Norway University of Applied Sciences, Sogndal, Norway
- 8Department of Geosciences and Natural Resource Management, University of Copenhagen, Copenhagen, Denmark
- 9Geological Survey of Denmark and Greenland, Copenhagen, Denmark
- 10Department of Microbiology and Immunology, University of British Columbia, Vancouver, BC, Canada
- 11School of Geosciences, University of Edinburgh, Edinburgh, United Kingdom
Chemical weathering dynamics in Greenland Ice Sheet (GrIS) catchments are largely unknown, due to a scarcity of field data. This paper presents the most comprehensive study to date of chemical weathering rates from four GrIS catchments of contrasting size. Cationic denudation rates varied greatly between catchments studied (2.6–37.6 tons km–2 a–1, world mean = 11.9 tons km–2 a–1), but were of the same order of magnitude to the world non-glacial riverine mean, and are greater than those documented in some major temperate rivers catchments (e.g., Mississippi (1.3 tons km–2 a–1) and Nile (0.4 tons km–2 a–1) rivers). These high chemical denudation rates indicate that the GrIS is a potential source of solute to downstream environments. Dissolved silica yields, indicative of silicate weathering rates, also varied by an order of magnitude, with upper values similar to the world mean (0.2–3.8 tons km–2 a–1, world mean = 3.53 tons km–2 a–1). Elevated chemical weathering rates in GrIS catchments are strongly influenced by the specific discharge, which drives flushing of the subglacial environment and physical erosion of the ice sheet bed. The direct relationship between specific discharge and chemical denudation rates supports the hypothesis that GrIS chemical weathering rates and solute fluxes are likely to increase with enhanced melt rates in a warming climate.
Introduction
Rock-water chemical interactions control the solute concentration and composition of streams and rivers and play an important role in global biogeochemical cycles (Chillrud et al., 1994; Lasaga et al., 1994; Wadham et al., 2010b). Glaciers were thought to be unimportant in global biogeochemical cycles until the 1990s, with proposed negligible chemical weathering rates due to cold temperatures, limited liquid water availability and suppressed microbial activity (Gibbs and Kump, 1994; Kump and Alley, 1994). Glacierised catchments are sites of high physical erosion, where rock comminution produces an abundant supply of fresh, reactive rock flour, facilitating rapid hydrolytic dissolution of carbonate and silicate minerals (Sharp M. et al., 1995; Brown et al., 1996; Tranter et al., 2002b). Biogeochemical weathering in glacial environments may have an important feedback to the global carbon cycle through the consumption of atmospheric CO2 during silicate mineral weathering (Berner, 1992) and through the liberation of bio-essential nutrients from parental bedrock (i.e., iron, silicon, and phosphorus; Sharp M.J. et al., 1995; Hodson et al., 2004; Föllmi et al., 2009; Hawkings et al., 2015; Arrigo et al., 2017; Torres et al., 2017).
Research from alpine valley glaciers suggests that chemical weathering rates in glacierised catchments are similar to, or exceed the global mean (Sharp M. et al., 1995; Anderson et al., 1997). Carbonate dissolution in alpine glacial systems exceeds silicate dissolution in a ratio of 5:1 (Tranter et al., 2002c), compared to the global mean of 1.3:1 (Holland, 1978). This is because comminution of bedrock by physical erosion exposes trace carbonates, which display rapid dissolution kinetics (Anderson et al., 1997). Glaciated regions are, therefore, expected to display carbonate weathering to silicate weathering ratios greater than the global average (Sharp M. et al., 1995; Jacobson et al., 2003), with correspondingly high Ca2+ and Mg2+ concentrations derived from weathering of trace carbonates minerals (Skidmore et al., 2004). Despite the predominance of carbonate weathering in glacial systems, it is also possible that silicate mineral weathering is enhanced under certain hydrological conditions, such as within long residence time distributed subglacial drainage systems (Brown, 2002; Tranter et al., 2002c; Wadham et al., 2010b; Hawkings et al., 2017, 2018). This may influence the capacity for glacial systems to act as a source of crustal nutrients commonly associated with bedrock weathering such as Fe, Si, and P (Calvaruso et al., 2006; Hawkings et al., 2015).
While chemical weathering in valley glaciers may be enhanced relative to the global mean (Sharp M. et al., 1995; Anderson et al., 1997), there are very limited data from large ice sheet catchments with multi-year coverage. This is critical since world glacier cover is dominated (>99%) by the Greenland and Antarctic Ice Sheets (Knight, 1999). It is, therefore, important to document chemical weathering rates for larger glacial systems given the postulated relationship between glacier size and the relative importance of silicate versus carbonate mineral dissolution, where silicate mineral weathering is enhanced in large ice sheet catchments due to prolonged meltwater residence times (Wadham et al., 2010b; Hawkings et al., 2016).
The Greenland Ice Sheet (GrIS) is the largest ice mass in the northern hemisphere and has undergone increasing mass loss over the last decade (Hanna et al., 2008; Fettweis et al., 2013). The resultant increase in runoff fluxes have been hypothesized to drive elevated dissolved solute export in high melt years (Hawkings et al., 2015). Here we present cationic and dissolved silica denudation rates from four GrIS catchments of contrasting size. We also calculated the amorphous silica denudation rates from three GrIS catchments of contrasting size.
We aim to elucidate the importance of GrIS chemical weathering within a global context and estimate solute fluxes to downstream ecosystems. We present data from one small (∼5 km2), one medium (∼36 km2) and one large (∼600 km2) glacial catchment, and from a proglacial river draining several glacier catchments alongside proglacial terrain (∼2800 km2; of which the 600 km2 glacial catchment is a sub-catchment). The bedrock underlying these catchments is composed of intrusive and metamorphosed Precambrian rocks, representative of >75% of the bedrock underlying the GrIS (Henriksen et al., 2009). These chemical denudation rates are compared with published solute fluxes from Alpine glaciers (Hodson et al., 2000; Wadham et al., 2000; Anderson, 2007), non-glacial catchments (Huh and Edmond, 1999) and major world rivers (Meybeck and Ragu, 2012), to elucidate the potential importance of ice sheet catchments in global chemical weathering.
Materials and Methods
Data Sources and Chemical Weathering Rates
We employed seasonal chemical data sets from three land terminating glaciers draining the western margin of the GrIS (Figure 1 and Table 1). These are: “N” Glacier (∼5 km2) (Bhatia et al., 2013a), Leverett Glacier (∼600 km2) (Cowton et al., 2012) and Watson River (∼2800 km2) (Lindbäck et al., 2015; Figure 1 and Table 1). Additionally, we present a riverine catchment receiving meltwaters from several glaciers (Watson River; WR), one of which, Leverett Glacier (LG), is a sub catchment. Watson River is composed of two tributaries: Akuliarusiarsuup Kuua (which comprises runoff from Russell Glacier and Leverett Glacier) and Qinnguata Kuussua (receiving runoff from Orkendalen Glacier) (Yde et al., 2014). The bedrock geology of Leverett Glacier and Watson River comprises Archean gneisses and granitoids (van Gool et al., 2002; Henriksen et al., 2009). The “N” Glacier bedrock geology is composed mainly by gabbroanorthosite (Bhatia et al., 2013a). We additionally use data from the glacier Kiattuut Sermiat (∼36 km2) (Hawkings et al., 2016) in Southern Greenland. The underlying geology here is composed of granite with complexes of diorite and pyroxene biotite monozonite with basalt intrusions (Henriksen et al., 2009).
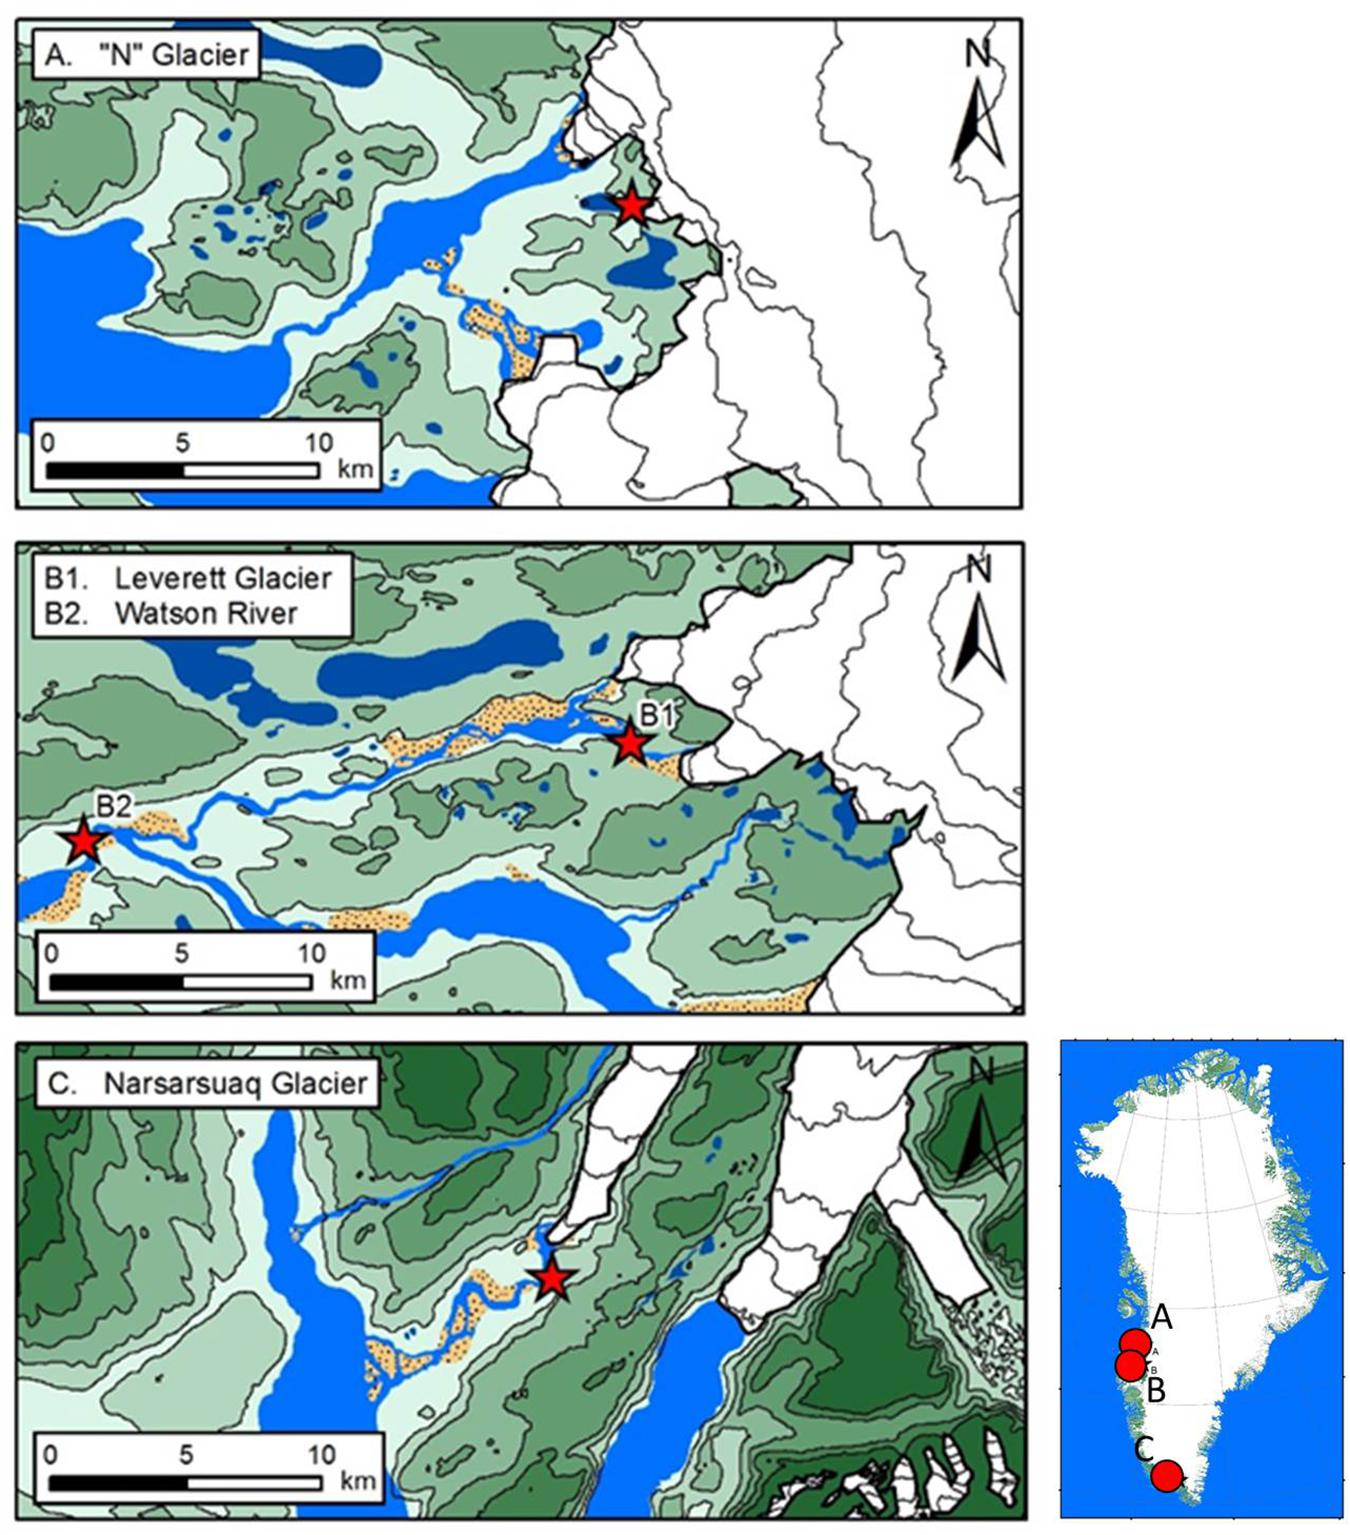
Figure 1. Bulk meltwater samples were collected from: (A) “N” glacier, with catchment boundaries from Bhatia et al. (2013a), (B1) location of Leverett glacier with sampling sites from Hawkings et al. (2014; 2015; 2016), (B2) location of Watson River with sampling site, and (C) Kiattuut Sermiat glacier with monitoring site from Hawkings et al. (2016).
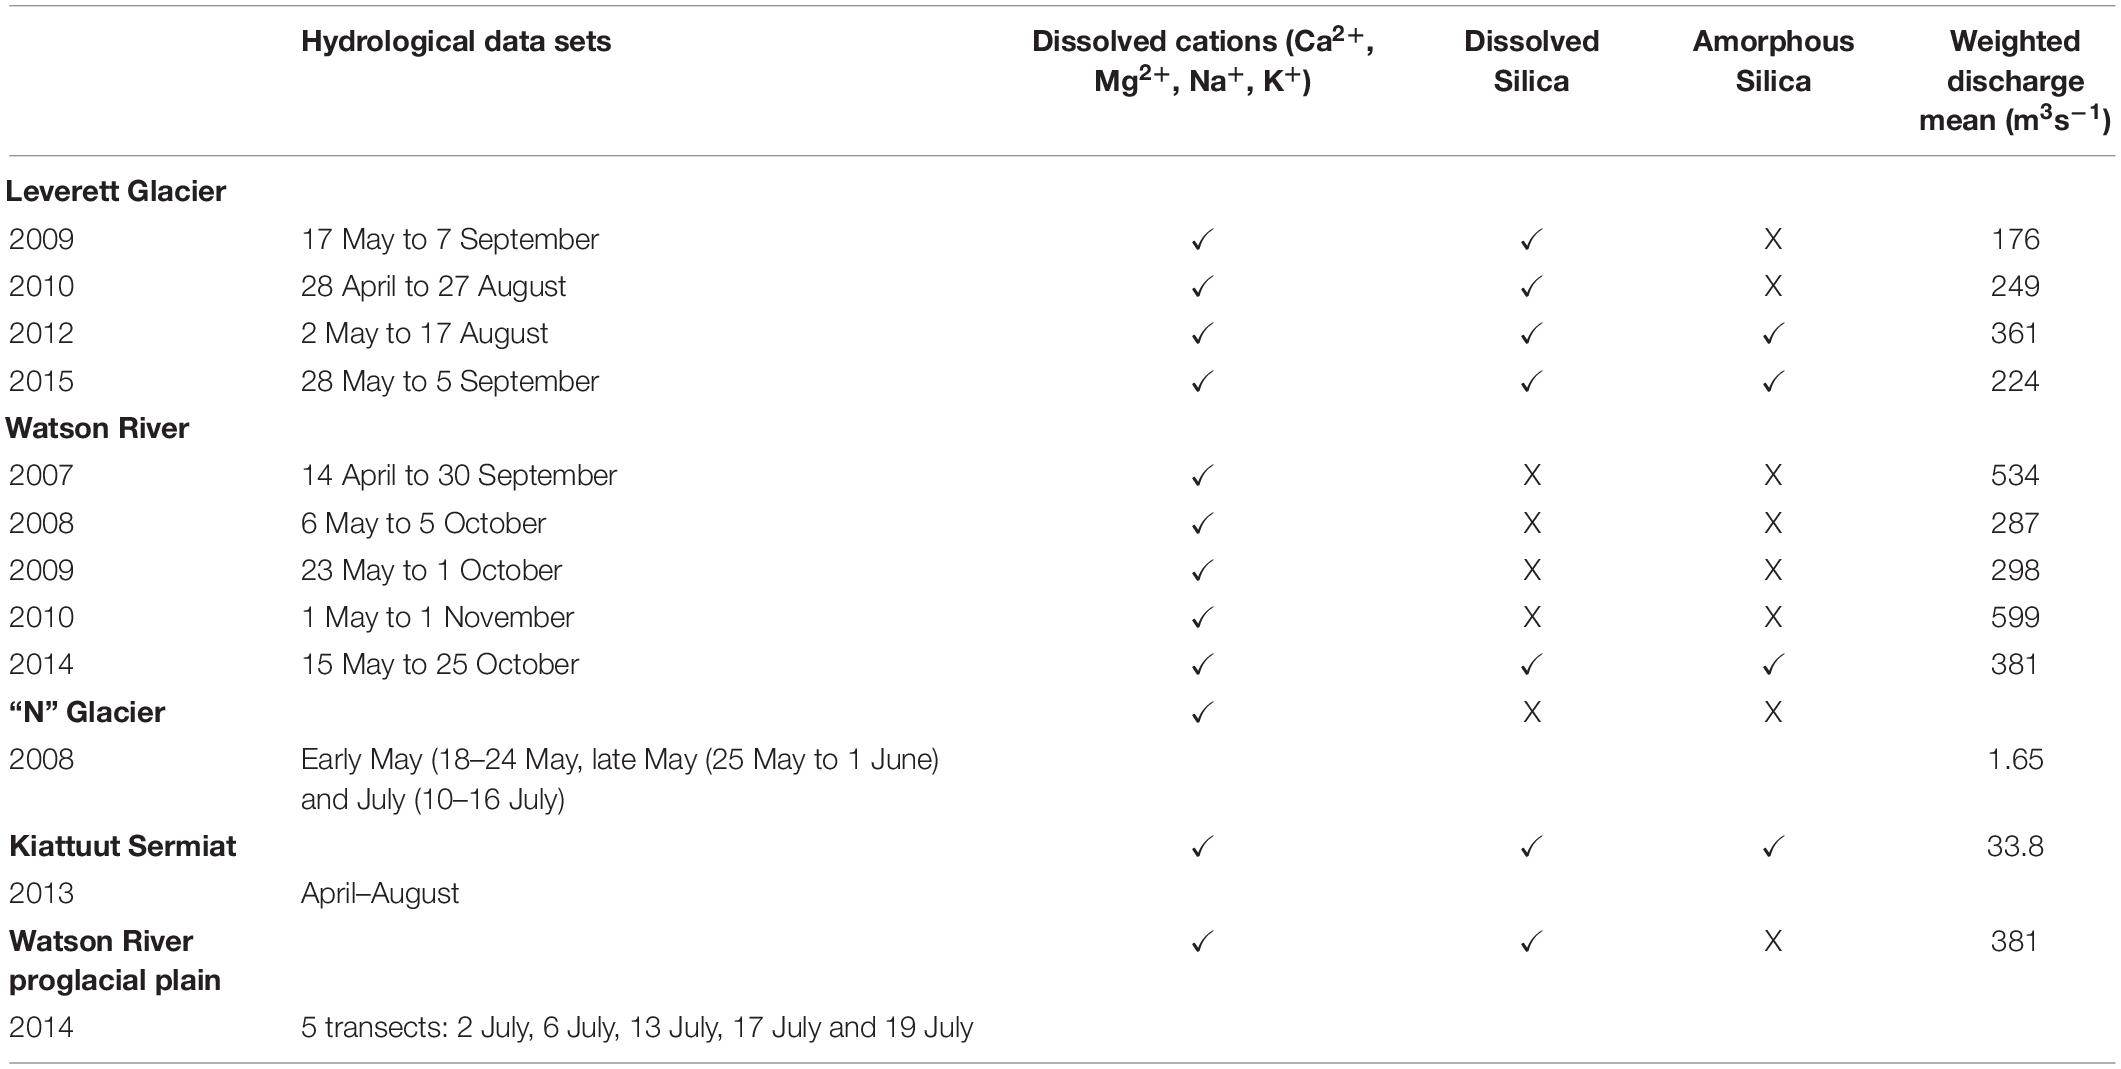
Table 1. Geochemical samples summary collected in each ablation season from GrIS catchments.
Bulk meltwater sample analysis was performed within 6 months of sampling (Bhatia et al., 2013a; Hawkings et al., 2014, 2015, 2016; Yde et al., 2014). The major ion datasets presented here have not been sea salt corrected, since chloride (used for sea salt correction) can also be derived from bedrock weathering and fluid inclusions (Tranter et al., 2002b). Depositional input on GrIS catchments accounts for <5% of the total solute export (Hawkings et al., 2015) and the effects of sea-salt correction on the chemical weathering yields estimation are minimal.
Discharge was measured employing very similar methodologies. Generally, measurements of water stage converted to discharge by gauging the flow, where errors in each study were broadly comparable (Bhatia et al., 2013a; Hasholt et al., 2013; Tedstone et al., 2013; Yde et al., 2014; van As et al., 2018).
The estimation of accurate chemical weathering yields on large glacierised catchments is problematic due to measurement and catchment area uncertainties. To address this issue, a propagated error has been calculated for GrIS chemical weathering yields presented on this study. Error estimates for chemical weathering yield calculations include analytical and discharge errors. Major ion determinations have a precision of <±5% for Leverett Glacier, Kiattuut Sermiat and Watson River and of <±10% for the “N” Glacier. Dissolved silica concentrations have a precision of ±0.4%. Leverett Glacier and Kiattut Sermiat discharge (Q) data have an associated error of ±15% (Cowton et al., 2012). Watson River Q data also have an error estimation of ±15% (van As et al., 2018). Error bars are the propagated values for these uncertainties from each measurement (Figure 2). Error propagation is calculated using the following equation:
Equation 1: Propagation error:
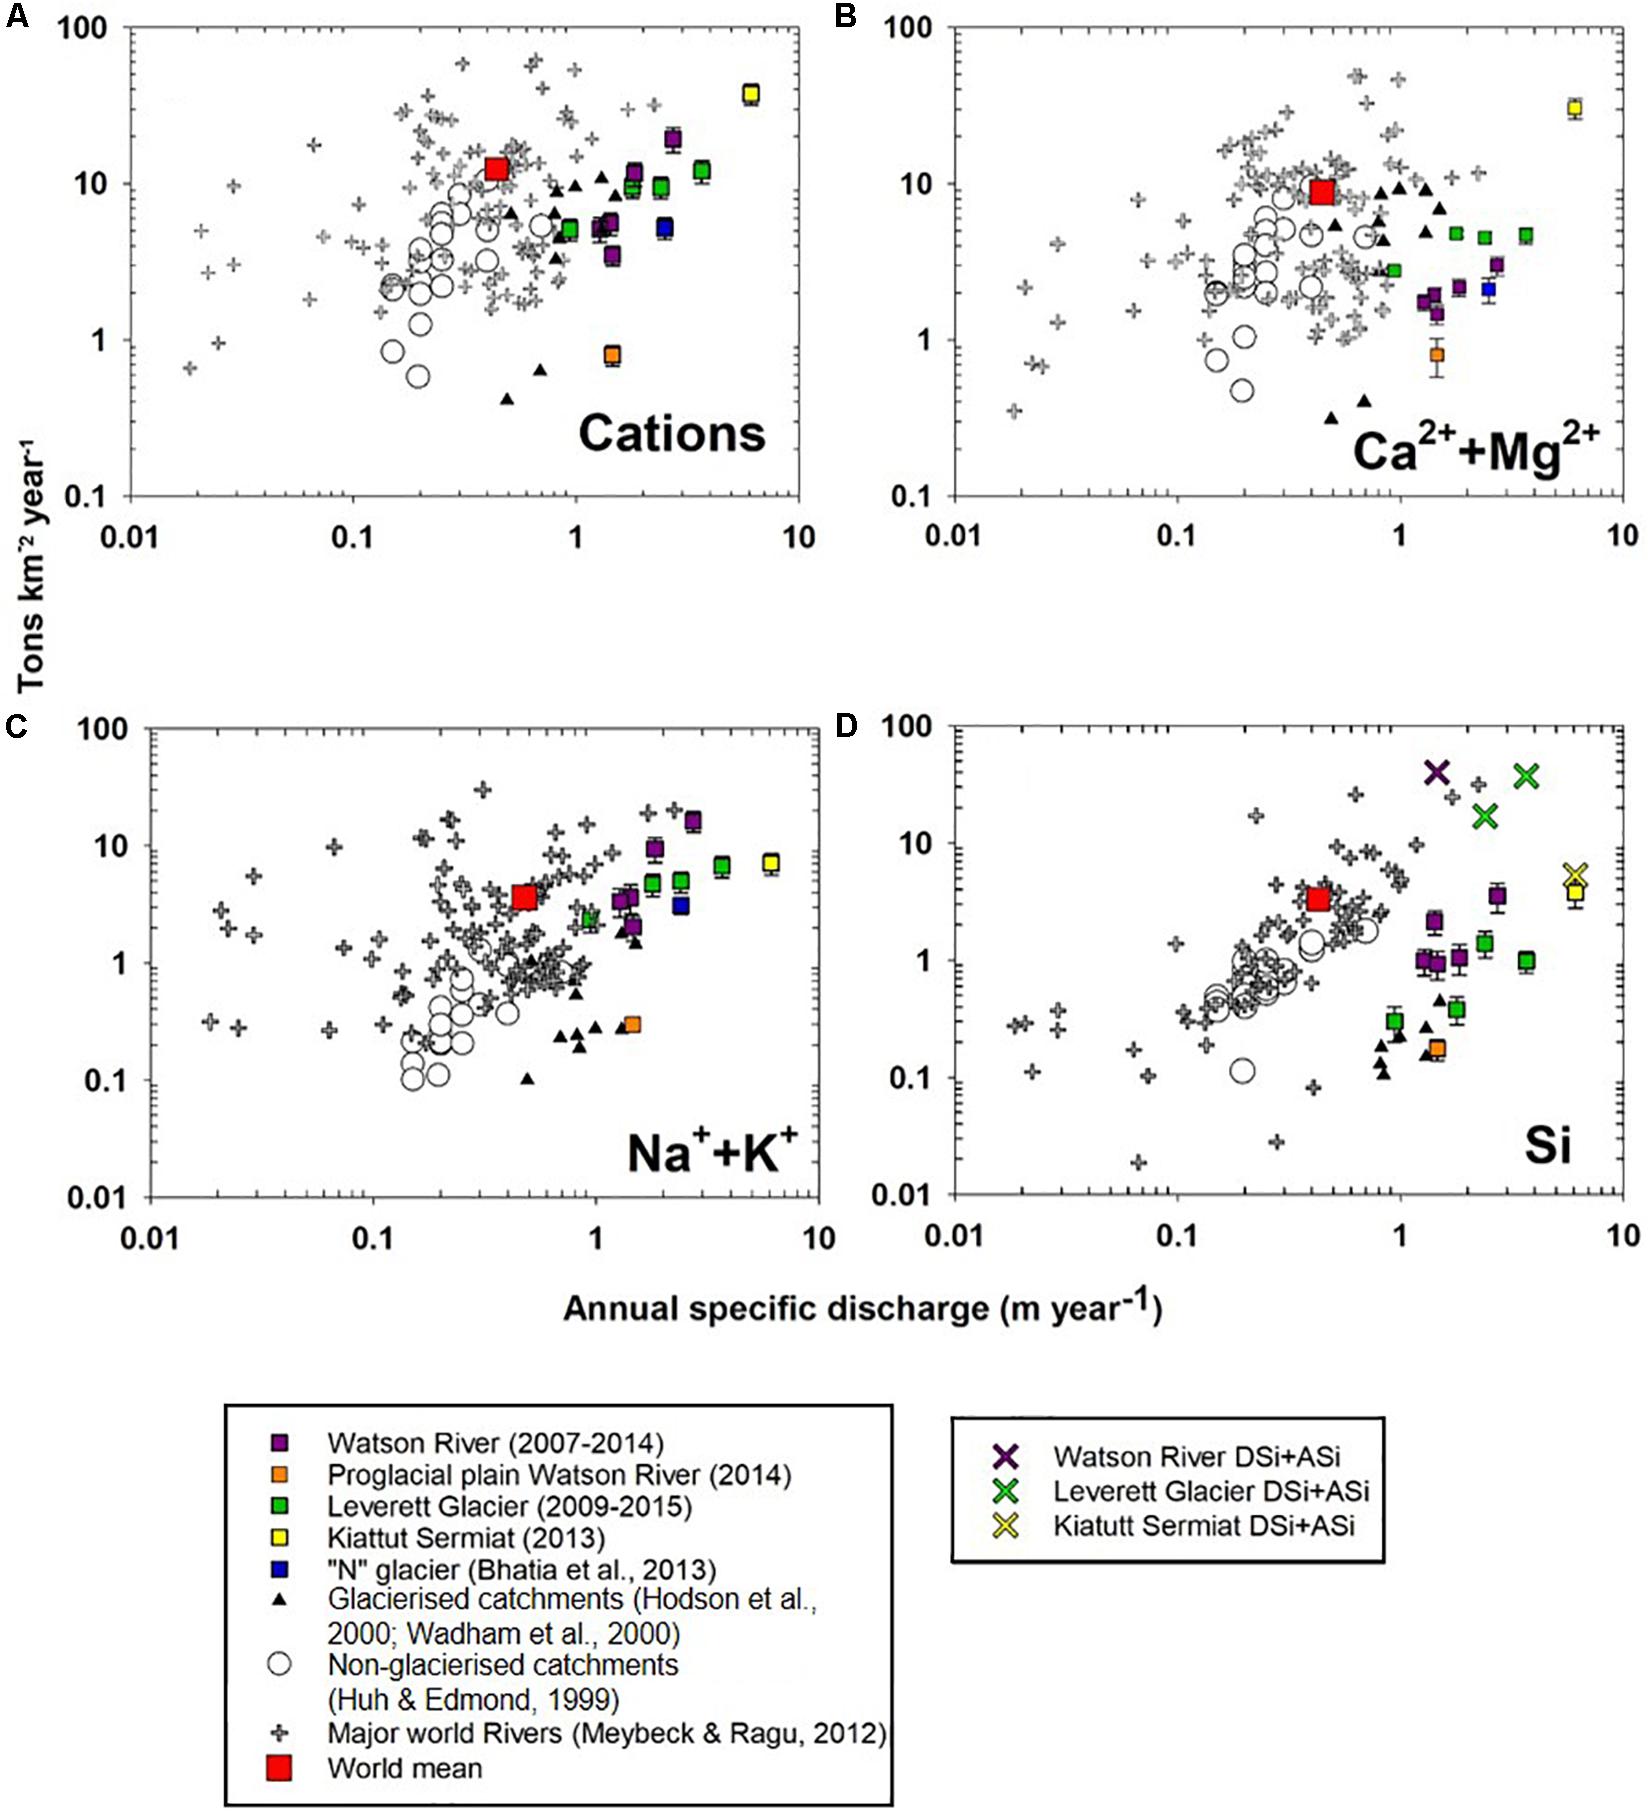
Figure 2. Flux of dissolved: (A) cations, (B) Calcium + Magnesium (Ca2++Mg2+), (C) Sodium + Potassium (Na++K+) against annual specific discharge for glaciated and non-glaciated catchments, (D) dissolved silica versus annual specific discharge. For Leverett, Kiattuut Sermiat glaciers, and Watson River we plotted total silica (dissolved silica + amorphous silica).
Leverett Glacier
The most complete chemical and hydrological data sets are from Leverett Glacier (67°05′45′′N, 50°17′00′′W) covering 2009–2012 (excluding year 2011) and 2015 (Lawson et al., 2014; Hawkings et al., 2015, 2016; Hatton et al., 2019). These data span 4 months of continuously monitored bulk meltwater discharge (approximately the start of May to late August), which comprised the majority of the annual water flux (>75%), and daily samples for bulk meltwater ion chemistry over periods exceeding 2 months. We estimated the annual solute fluxes from the product of the discharge weighted mean concentrations of major cations (Ca2+, Mg2+, Na+, K+) and Si, and the total meltwater discharge flux over the monitoring period. To calculate the annual cation and silica denudation rates/yields, the total flux of the relevant species were divided by the hydrologically active catchment area (∼600 km2). This method generates conservative estimates of solute fluxes and yields because it places more weight on lower solute concentrations which typically occur at higher discharge (Anderson et al., 1997; Tranter et al., 2002a; Anderson, 2007; Yde et al., 2014).
“N” Glacier
The “N” Glacier (68°02′34′′N, 50°16′08′′W) chemical record comprises two separate month long periods of daily sampling in 2008. Bulk meltwater samples were collected on 8th to 24th May, 25th May to 1st June, and July (10th to 16th July) (Bhatia et al., 2013a). Meltwater discharge was measured continuously from 31st May until 16th July 2008, accounting for approximately 64% of the annual discharge based upon the discharge measurements from Leverett Glacier measured in 2009 and 2010 (Cowton et al., 2012). To account for the missing discharge and solute data (c. 37%), we increased the total solute fluxes derived from chemical sampling in June and early July by 37%. Since runoff from GrIS catchments also extends until late September we also needed to adjust these fluxes to account for the late summer and autumn flux period. Our continuous annual discharge data from Leverett Glacier (located 108 km from Glacier “N”) indicate that 61–79% of the bulk meltwater discharge occurs between 16th July and the beginning of October (: 70%). We therefore inflated the May – mid July flux data for “N” Glacier by 70% to account for this. We calculated the Leverett Glacier monthly discharge percentage during the melt seasons of 2009 and 2010 based upon the amount of bulk meltwater per month. We employed these monthly percentage and “N” Glacier discharge data for 2008 sampling periods to predict the discharge for “N” Glacier during the missing periods. Annual cation yields were calculated using the product of the discharge weighted mean concentration of each solute species and the total discharge flux from “N” Glacier. This value was then divided by catchment area to obtain weathering rates and yields. There are no dissolved silica concentration data available from this site.
Watson River
The Watson River is one of the largest and most accessible rivers draining the GrIS, hence, its hydrological regime is well documented (Mernild et al., 2008; Mernild and Hasholt, 2009; van As et al., 2012). Seasonal bulk meltwater discharge datasets were available for 2007–2014. However, chemical datasets are only available for 7 days in 2007 (13th to 21st of July), 27 days in 2008 (31st of July until 26th of August), 9 days in 2009 (21st of July until 30th of July) (Yde et al., 2014) and 21 days in 2014 (29th of June until 21st of July). For the periods where chemical data from Watson River were missing, we used the relationship between discharge and ion concentrations during the closest time period in order to predict cation (Ca2+, Mg2+, K+, Na+) and dissolved silica concentrations (Yde et al., 2014). The regression best fit between cation concentration and discharge during time slices adjacent to the missing periods was a polynomial function with R2 values of 0.90 (Ca2+), 0.87 (Mg2+), 0.80 (K+), 0.85 (Na+), and 0.89 (Si) (all with a p < 0.05).
Defining the glaciated catchment area of the Watson River is complicated due to the difficulty in accurately estimating the size of the hydrological catchment from which meltwater is derived. Studies have produced varying estimates ranging from: 800 km2 (Wimpenny et al., 2010), 3560 km2 (Weidick et al., 1992), 6120 km2 (McGrath et al., 2010), 6279 km2 (Mernild and Hasholt, 2009), and 12,574 km2 (van As et al., 2012).
We use the catchment delineation provided by Lindbäck et al. (2015), which suggests a catchment area of 2800 km2, extending to 1750 m.a.s.l, to calculate chemical denudation rates. This area was preferred because it best represents the hydrologically active catchment area.
Watson River proglacial plain
We used chemical data sets (for Ca2+, Mg2+, Na+, K+, and Si) derived from five upstream-downstream sample sets (∼25 km apart) in July 2014, to estimate chemical denudation rates for the Watson River proglacial zone. We subtracted the major ions and dissolved Si meltwater concentration of the upper sampling location (5 km downstream from the Leverett Glacier portal) from the downstream sampling location (25 km downstream form the Leverett Glacier portal), to estimate a proglacial chemical weathering flux. The bulk meltwater discharge did not change over this distance, since there are no major river confluences. The solute flux was calculated as a product of the increase in solute concentration from the upstream to the downstream sampling point and the Watson River discharge. The Watson River discharge does include the discharge from another glacier complex to the south, but we assume that the chemical weathering processes here (and hence, solute enhancement in the proglacial zone) were similar to those measured along our transect since the two proglacial zones are of similar length. Chemical weathering rates and major cation yields were then calculated by dividing the solute flux by the proglacial catchment area of 600 km2 previously estimated by Cowton et al. (2012).
Kiattuut Sermiat
Kiattuut Sermiat daily bulk meltwater chemistry and continuous bulk meltwater discharge data were available from 21st April until 11th August of 2013 (Hawkings et al., 2016). We used discharge weighted mean concentrations multiplied by the total water flux, divided by the glacier catchment area (36 km2; Hawkings et al., 2016) to calculate major cation and dissolved silica denudation rates.
Sampling Collection and Data Analysis
Water Sampling
Bulk meltwaters from Leverett, Kiattuut Sermiat and Watson River (in 2014) were sampled using 2L high density polyethylene (HDPE) bottles at least once a day (Hawkings et al., 2016). Samples were immediately filtered through a 47 mm 0.45 μm cellulose nitrate filter (Whatman), mounted on a PES filtration stack (NalgeneTM), that had been rinsed 3 times with the sample for the case of Leverett Glacier (2009, 2010, 2012) (Hawkings et al., 2015) or a 0.45 μm Whatman GD/XP PES syringe filter using a PP/PE syringe at Kiattuut Sermiat (2013) (Hawkings et al., 2016). In the case of Leverett Glacier (2015) and Watson River (2014), samples were filtered through a 0.45 μm WhatmanTM GD/XP PES syringe filters using a PP/PE syringe. Meltwater samples were stored in clean 30 mL NalgeneTM HPDE bottles. Procedural blanks were taken in the field using Milli-Q deionized water (18.2 MΩ cm–1 Millipore) following the same methods, to monitor any methodological and storage contamination. These procedural blank concentrations were then subtracted from the sample concentration. Samples were stored refrigerated in the dark at <5°C.
Bulk meltwater samples from Watson River (2007–2010) were filtered through a 0.45 μm cellulose nitrate membrane, using an electric pump. Filtered samples were immediately refrigerated (Yde et al., 2014).
Bulk meltwater samples from the “N” Glacier (2008), were sampled using a 500 mL high density polyethylene (HDPE) widemouth bottle (Nalgene). Samples were filtered through a 0.22 μm cellulose acetate membrane (GE) with a polypropylene vacuum filtration apparatus (Nalgene). The filtrate was collected with a minimal headspace in 20 mL HDPE scintillation vials (Nalgene). Samples were kept as cold as possible in the field and frozen upon return to the laboratory (Bhatia et al., 2013a).
Major Cations
Cation concentrations (Mg2+, Ca2+, K+, and Na+) in bulk meltwater were analyzed using ion chromatography on a Thermofisher DIONEX ICS-5000 at the LoW Temperature EXperimental facility (LOWTEX) (University of Bristol, United Kingdom), for Leverett Glacier (2009–2015), Kiattuut Sermiat Glacier (2013) and Watson River (2014). Samples were analyzed using an IonPacTM CS16 capillary column with an eluent concentration of 30 μM L–1 methanosulfonic acid solution at 35°C (Dubnick et al., 2017). The limit of detection were less than 0.6 μM for Na+, 0.4 μM for K+, 0.63 μM for Mg2+ and 0.4 μM for Ca2+ with a precision of less than ±5% and an accuracy of less than 6.6%.
For Watson River (2007–2010), bulk meltwater samples were analyzed using a Perkin-Elmer 5100 PC atomic absorption spectrophotometer with a precision of ±5% for Na+ and Mg2+ and ±10% for K+ and Ca2+(Yde et al., 2014).
For the “N” Glacier (2008), major cations were measured by ion chromatography at the Queenś University facility for Biogeochemical research on Environmental Change and the Cryosphere (Kingston, ON, Canada). Cations were determined using a Dionex ICS 3000 following the methods of Lafreniére and Lamoureux (2008). The limit of detection were less than 0.11 μM for Na+, 0.01 μM for K+, 0.1 μM for Mg2+, and 0.24 μM for Ca2+ with a precision of less than ±10% (Bhatia et al., 2013a).
Major Anions
Anion concentrations (Cl– and SO42–) in bulk meltwater were analyzed using ion chromatography on a Thermofisher DIONEX ICS-5000 at the LoW Temperature EXperimental facility (LOWTEX) (University of Bristol, United Kingdom), for Leverett Glacier (2009–2015), Kiattut Sermiat (2013) and Watson River (2014). Samples were analyzed using an IonPacTM AS11-HC-4 μm anion-exchange column with an eluent concentration of 32.3 μM L–1 potassium hydroxide solution at 35°C. The limit of detection was less than 0.5 μm for Cl– and 0.6 μm for SO42– with a precision of less than ±5%.
In Watson River (2007–2009) anion concentrations were analyzed using a Perkin-Elmer ion chromatograph. Analytical precision was ±5% SO42– and higher than ±5% for Cl– (Yde et al., 2014).
For the “N” Glacier (2008), major anions were analyzed using a Dionex ICS 3000. The limit of detection were less than 0.5 μm for Cl– and 0.12 μm for SO42– with an analytical precision of less than 10% (Bhatia et al., 2013a). HCO3– concentrations were estimated by charge balance in all catchments.
Dissolved Silica (DSi)
Dissolved silica concentrations were determined using a Lachat QuickChem 8500 Series 2 flow injection analyzer (QuikChem method 31-114-27-1-D) for Leverett Glacier (2012, 2015), Kiattuut Sermiat Glacier (2013) and Watson River (2014) samples. The methodological limit of detection was 0.3 μM, with a precision of ±0.5% and an accuracy of −0.4%.
Amorphous Silica (ASi)
Amorphous silica concentrations associated with suspended sediment in bulk meltwaters were determined using a weak alkaline digestion (DeMaster, 1981) for Leverett Glacier in 2012 and 2015 and for the Watson River in 2014. This method is commonly used to determine biogenic silica in marine waters (DeMaster, 1981; Cornelis et al., 2011) and more recently, ASi glacial meltwaters (Hawkings et al., 2017, 2018). Most ASi is rapidly dissolved during the first hour of incubation with less reactive clay minerals dissolving at a relatively constant rate over the following 4 h (DeMaster, 1981; Conley, 1998). Briefly, ∼30 mg of sediment were weighted and placed into prewashed 60 mL HDPE NalgeneTM bottle, 50 mL of 0.096 M Na2CO3 was added and the bottles were placed in a hot water bath maintained at 85°C for a period of 5 h. Aliquots of 1 mL were extracted at 2, 3, and 5 h and stored in a 2 mL centrifuge tube at 4°C. Before analysis, a 0.5 mL aliquot was taken, placed in a new, clean 10 mL polypropylene tube and neutralized with 4.5 mL of 0.021 M HCl. The samples were analyzed on a Lachat quickchem 8500 series 2 flow injection analyzer (QuickChem method 31-114-27-1-D), as above (2.2.2). ASi was calculated using the intercept of a linear regression from concentrations of the aliquots collected.
Results
Annual yields of individual cations and Si (tons km–2 a–1) and total cationic denudation rates (Σcations km–2 a–1) from this study are plotted alongside previously published values from valley glaciers (Hodson et al., 2000; Wadham et al., 2000; Anderson, 2007), rivers draining non-glacierised catchments (Huh and Edmond, 1999) and major world rivers (Meybeck and Ragu, 2012) in a log-log scatter plot (Figure 2). We also include a comparison of the chemical ratio abundances among the Greenlandic catchments from this study, samples from subglacial lake Whillians (Michaud et al., 2016), Greenlandic boreholes (Graly et al., 2014) and borehole water from an Alpine glacier (Haut Glacier d’ Arolla; Tranter et al., 2002b; Figure 3).
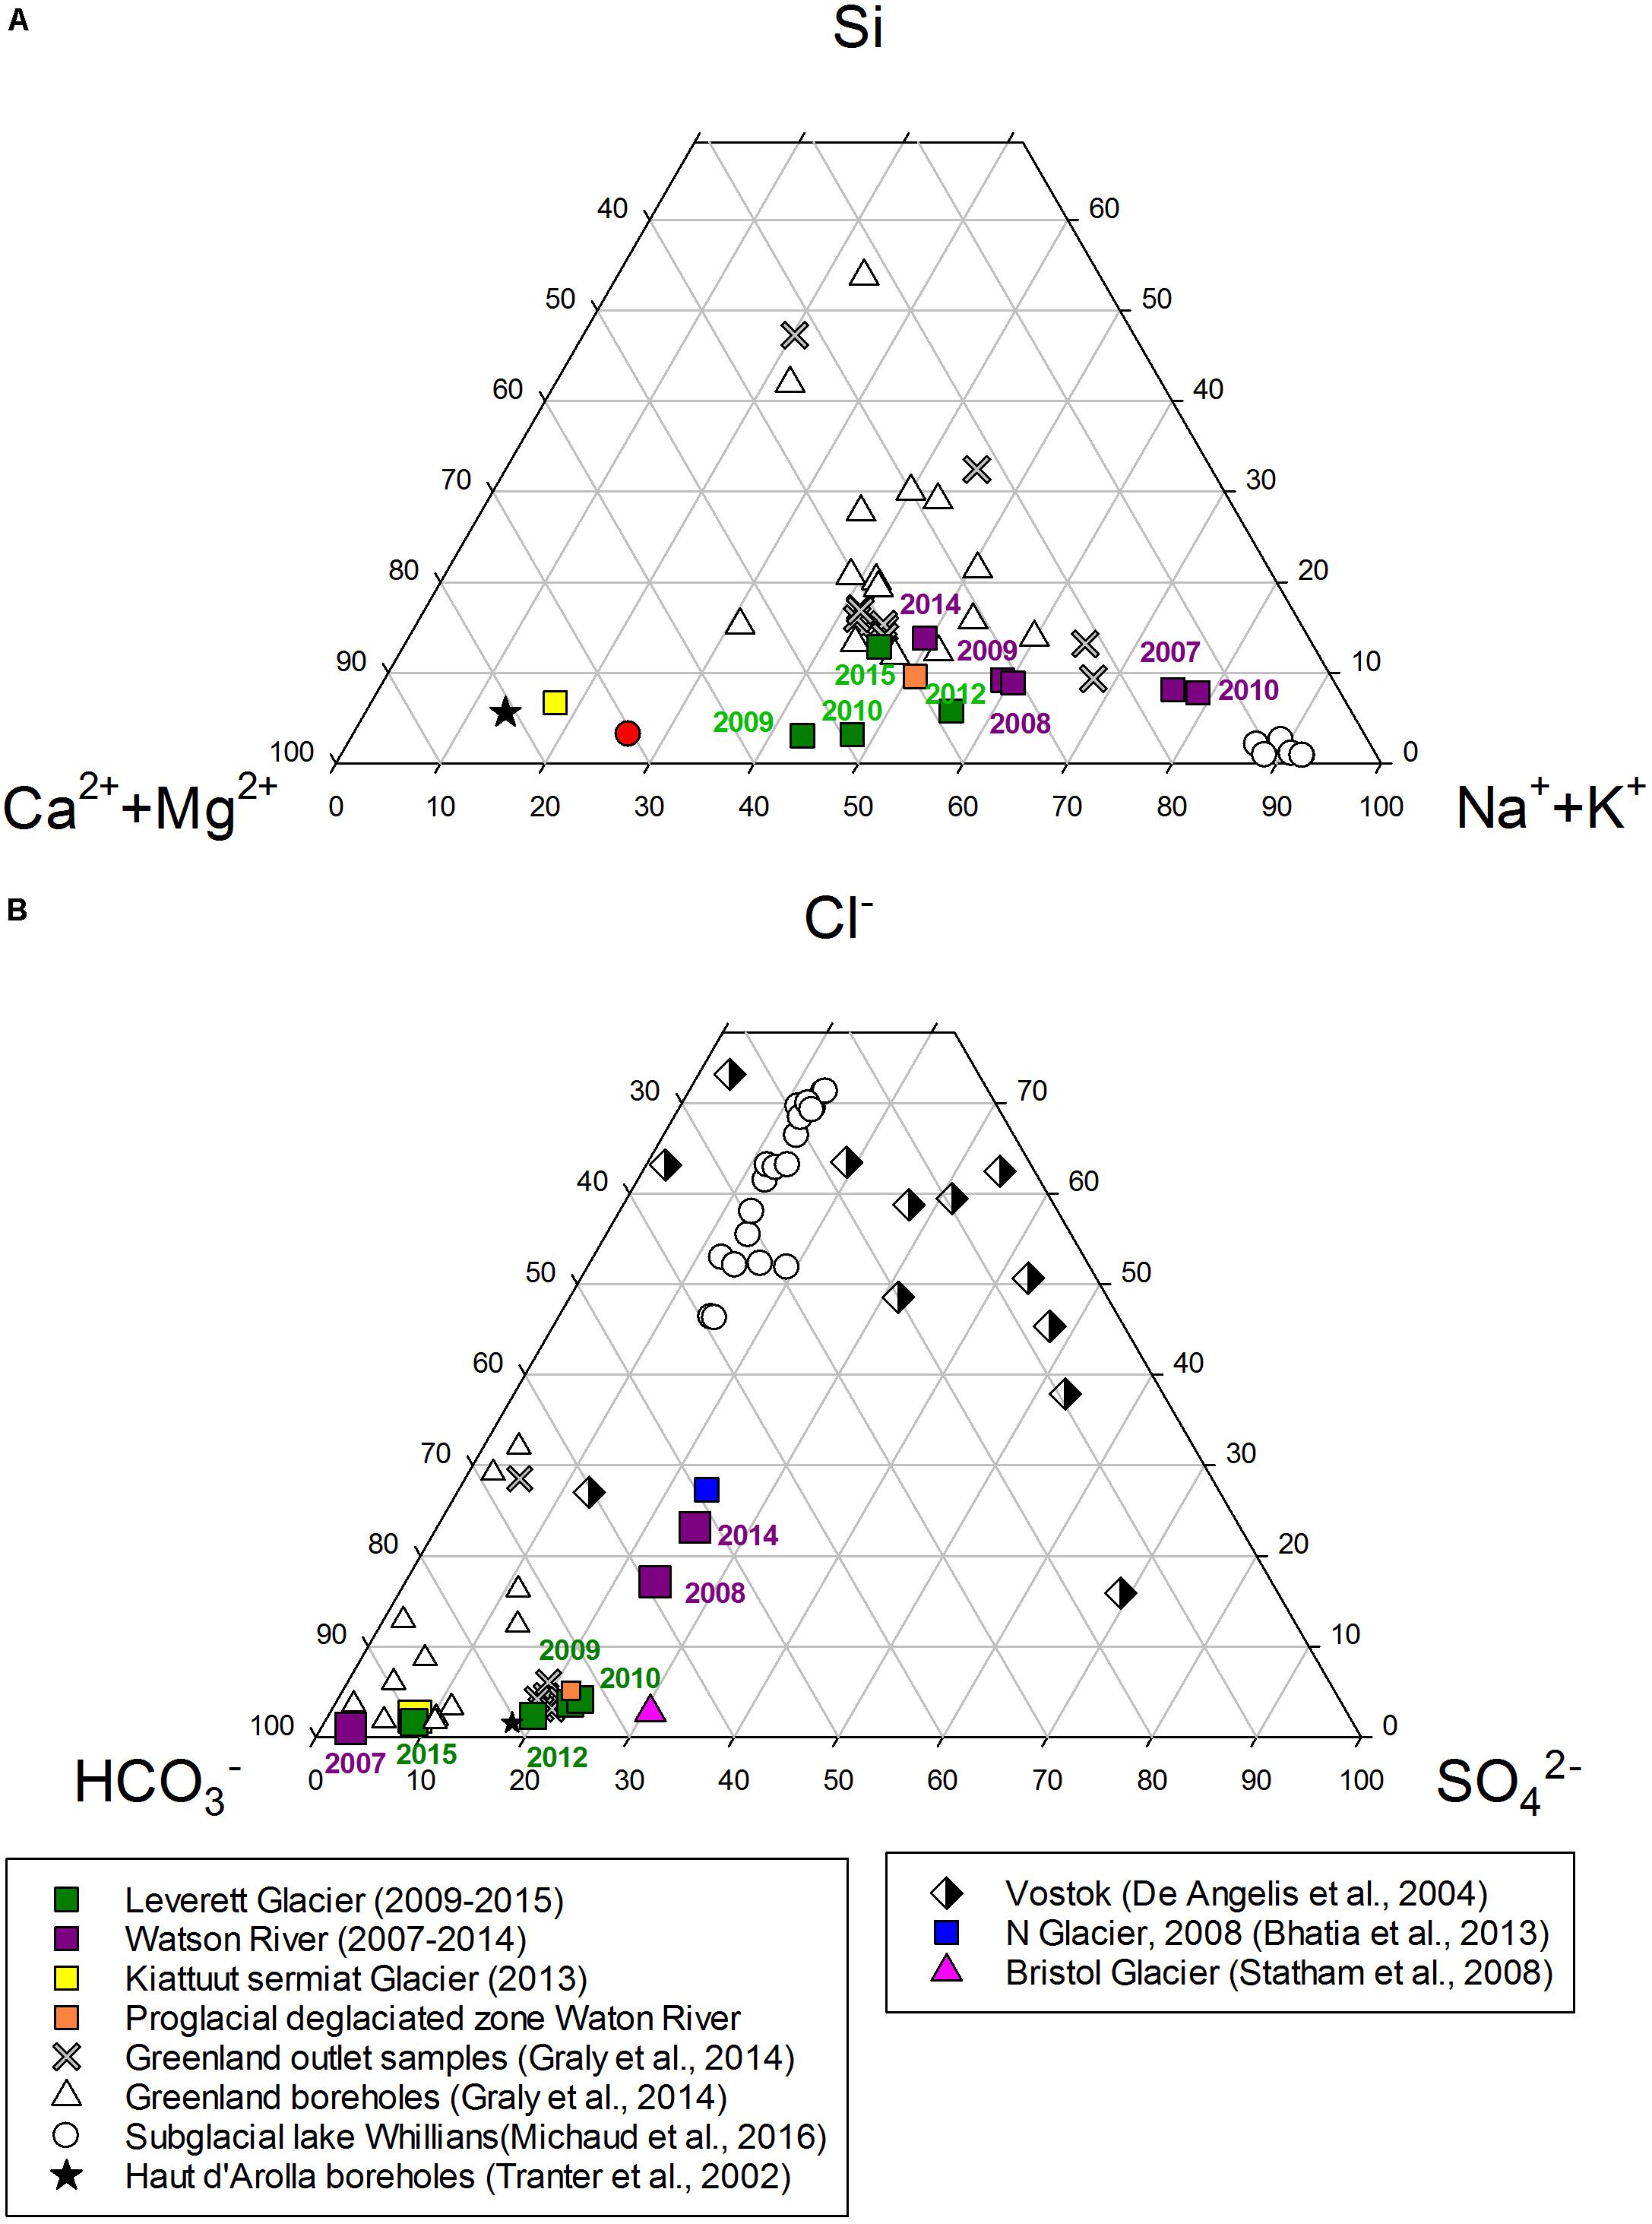
Figure 3. (A) Relative molar abundances of cations and dissolved silica in GrIS catchments from this study, Subglacial lake Whillians, Greenlandic glaciated catchments (Boreholes and outlet samples from Issunguata Sermiat) and Haut d’ Arolla boreholes samples. (B) Relative molar abundances of anion in GrIS catchments from this study, boreholes and outlet samples from Issuanguata Sermiat, Subglacial lake Whillians and Subglacial lake Vostok.
Chemical Weathering Rates
Annual cationic denudation rates in Greenlandic glacial catchments (2.6–37 tons km–2 a–1, Table 2) generally fall within the rage of values reported for other glaciated catchments and non-glaciated catchments (e.g., Siberian Rivers, Huh and Edmond, 1999). Their mean value (9.4 tons km–2 a–1) is slightly lower than the global mean (11.9 tons km–2a–1, Meybeck and Ragu, 2012). However, Kiattuut Sermiat cationic rates (37 tons km–2 a –1) exceed those from valley glaciers (Figure 2A) with similar specific discharge. The cationic chemical weathering yields in the Watson River proglacial plain (2.6 tons km–2 a –1) are 60% lower than the yields at the glacier terminus (Leverett and “N” glaciers, : 8.3 and 5.2 tons km–2 a–1 respectively) but are higher than those for valley glaciers (1.2 tons km–2 a–1). Cation weathering yields in GrIS catchments display a significant linear relationship with the annual specific discharge (R2 = 0.72, p < 0.05).
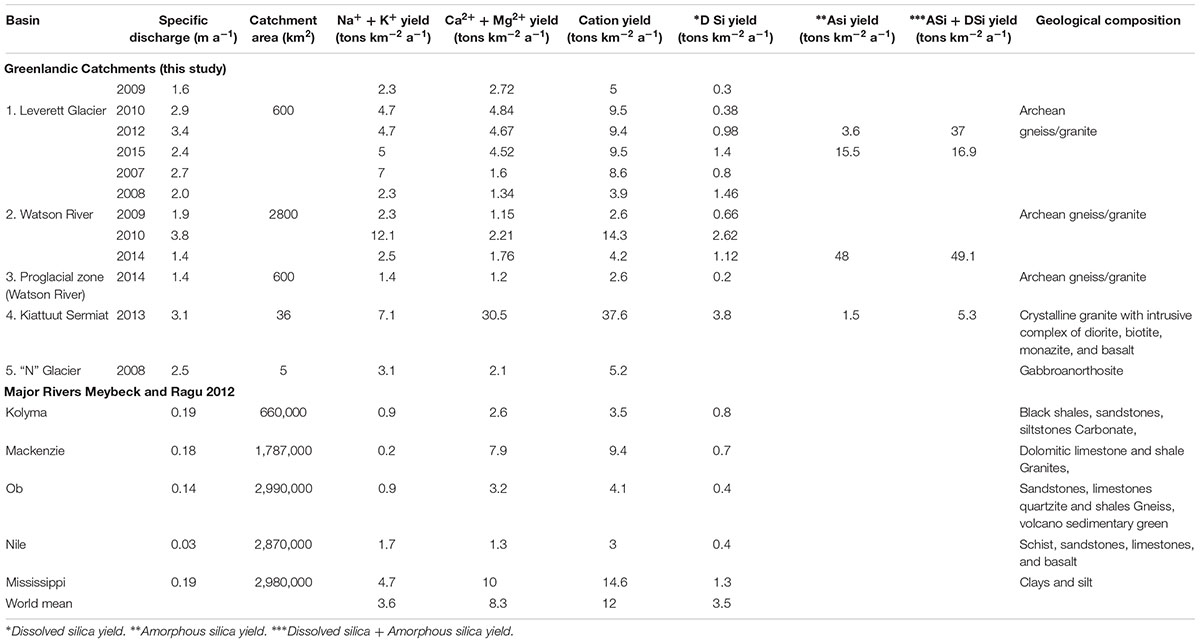
Table 2. Chemical weathering fluxes summary from Greenland catchments and major rivers.
Divalent ions yields (Ca2+ + Mg2+) from GrIS catchments (typically associated with products of carbonate dissolution; Wadham et al., 2010b; Equation 2) were 1.2–30 tons km–2 a–1 (Figure 2B and Table 2). These values are comparable to or exceed rates reported previously for valley glacier catchments for a similar specific discharge (from 1.2 to 4.8 tons km–2 a–1 (Hodson et al., 2000; Wadham et al., 2000). All GrIS catchments, apart from Kiattuut Sermiat, display combined Ca2+ + Mg2+ yields which fall below the global riverine mean (8.3 tons km–2 a–1, Meybeck and Ragu, 2012). Conversely, Kiattuut Sermiat Ca2+ + Mg2+ yields exceed the global mean by a factor of four (30 tons km–2 a–1). Unlike total annual cation yields, there is no linear relationship between the divalent ion denudation rates and annual specific discharge in GrIS catchments (R2 = 0.3).
Equation 2 Sulfide oxidation coupled to carbonate dissolution:
Monovalent cation yields (Na+ + K+, Figure 2C and Table 2) from GrIS catchments, commonly assumed to derive from silicate mineral weathering (Equation 3, Wadham et al., 2010b), often exceed rates observed in other glaciated and non-glaciated catchments. For example, monovalent cation yields exceed the global world river mean (3.6 tons km–2 a–1, Meybeck and Ragu, 2012) for Leverett Glacier (4.7–5 km–2 a–1), Watson River (2.2–12.1 tons km–2 a–1), and Kiattuut Sermiat (7.1 tons km–2 a–1). Monovalent cationic yields for all Greenlandic catchments displayed a significant linear relationship with annual specific discharge (R2 = 0.87, p < 0.05).
Equation 3 Sulfide oxidation coupled to silicate dissolution:
Annual dissolved Si yields from GrIS catchments (0.2–3.8 tons km–2 a–1, : 1.4 tons km–2 a–1, Table 2) often exceed those reported from smaller valley glaciers ( = 0.2 tons km–2 a–1; Hodson et al., 2000; Wadham et al., 2000; Figure 2D) by at least an order of magnitude, but fall along the same direct relationship (R2 = 0.8, p < 0.05) with specific Q. An exception to this is the proglacial plain of Watson River, which displays lower Si yields (Figure 2D). GrIS dissolved silica yields (0.2–3.8 tons km–2 a–1) are similar or slightly lower than the global mean for World Rivers (3.3 tons km–2 a–1; Meybeck and Ragu, 2012), and fall along a distinct relationship with specific discharge. The highest dissolved Si yields are reported from large GrIS catchments with a high specific discharge.
If the particulate bound amorphous silica (ASi) flux is calculated as a way of expressing Si yields from GrIS catchments, total silica yields exceed those typically observed for the world rivers mean, with values of up to 48 tons km–2 a–1 in case of Watson River and an average of 30 tons km–2 a–1 for Leverett Glacier (Figure 2D). These higher yields are seen most dramatically for the largest GrIS catchments (Leverett Glacier and Watson River), which have very high suspended sediment loads with a corresponding high extractable ASi fraction (Hawkings et al., 2017). Silica weathering yields at the smaller Kiattuut Sermiat do not increase significantly when amorphous silica fluxes are added to the dissolved silica flux (from 3.8 to 5.3 tons km–2 a–1), due in part to the lower suspended sediment concentrations and extractable ASi fraction.
Bulk Chemistry
Chemical weathering characteristics and their relationship to rock type can be analyzed by plotting the relative molar abundances of major cations, anions and dissolved silica (Singh et al., 2012). We compared the chemical composition of meltwaters from GrIS catchments in this study with previously published GrIS water samples (boreholes waters and runoff samples from Isunnguata Sermia glacier; Graly et al., 2014) and long residence time meltwaters in Antarctic Subglacial Lake Whillians (Michaud et al., 2016) and Subglacial Lake Vostok (De Angelis et al., 2004; Figure 3). Our data is also compared to Alpine glacier borehole waters from Haut Glacier d’ Arolla boreholes (Tranter et al., 2002c). These Alpine glacier borehole waters are from long residence time systems and drain from a schistose granite bedrock. By comparing these data sets we are able to postulate whether the chemical composition of bulk meltwater from the larger catchments (e.g., Leverett Glacier and Watson River) displays similar features to those in other long residence subglacial systems (Figure 3).
The comparison of major cation (Ca2+ + Mg2+, Na+ + K+) and Si abundance rests on the assumption that the dissolution of calcite minerals releases mostly Ca2+ and Mg2+ into solution (Equation 3) and silicate mineral weathering (or ion exchange) releases Na+, K+ and Si to solution (Equation 2; Blum and Stillings, 1995; Tranter et al., 2002c; Wadham et al., 2010b; Graly et al., 2014). Na+ + K+ dominates the dissolved cation load of the largest GrIS catchments from this study; Watson River data from years 2007 and 2010 (∼78% of cation flux) clusters close to samples from Subglacial Lake Whillians. The water composition from Leverett Glacier exhibits an evolution from an equal dissolved load of Ca2+ + Mg2+: Na+ + K+ ratios (∼50/50%) in “normal” melt years (i.e., 2009, 2010, 2015) to a relative increase in Na+ + K+ molar abundances in “extreme” melt years (i.e., in 2012, Na+ + K+ = 63% of total load, the highest discharge melt season in Leverett Glacier) (Figure 3A). The proglacial plain in Watson River exhibits a similar pattern to Leverett Glacier, with equal mono/divalent cation molar ratio in meltwaters. Kiattuut Sermiat is the only GrIS catchment from this study that is dominated by Ca2+ + Mg2+ (75%), similar to data from the Haut d’Arolla boreholes. All GrIS catchments in this study exhibit relatively low silica abundance (∼3%) in comparison to borehole samples from Isunnguata Sermiat (10–55%) (Figure 3A).
We also compare the abundance of the major anions in meltwaters. Bicarbonate (HCO3–) derives from the dissociation of carbonic acid in water, and via carbonate and silicate hydrolysis/carbonation (Meybeck, 1987; Tranter et al., 2002c; Graly et al., 2014). The dominant source for SO42– is sulfide oxidation, unless gypsum and other sulfate-containing minerals are present (Wadham et al., 2010a; Bhatia et al., 2013b). Cl– is commonly assumed to derive from atmospheric deposition (Steffensen, 1988), but also can derive from rock weathering via release of fluid inclusions (Konnerup-Madsen, 2001; Tranter et al., 2002c). The most abundant anions in all meltwaters here are HCO3– and SO42–, followed by Cl–. Generally, HCO3– dominates dissolved anionic loads from all GrIS catchments (Figure 3B). Watson River (58–96%), Leverett (73–89%) and Kiattuut Sermiat (89%) and the proglacial plain in Watson River (73%) display high HCO3– molar ratios (relative to other anions). Smaller Greenland glaciated catchments such as “N” Glacier, have a smaller proportion of their anion load comprised of HCO3– and display a stronger SO42– influence.
Discussion
Chemical Weathering Processes Beneath the Greenland Ice Sheet Inferred From Major Ion Composition and Chemical Fluxes
The chemical composition of bulk meltwaters can reveal the mechanisms for chemical weathering as well as the potential sources of meltwater (Wadham et al., 2010b). In particular, the ratios of major cations in runoff from glacierised and non-glacierised catchments provide important information for analysis of chemical weathering processes and weathering intensity. Previous hydrochemical studies have demonstrated that sodium-normalized ratios for divalent cations (Mg2+, Ca2+) are a useful tool for estimating the proportion of silicate and carbonate mineral weathering (Gaillardet et al., 1999). For example, a catchment with high Mg/Na and Ca/Na ratios suggests a high carbonate mineral weathering influence. Conversely, low Mg/Na and Ca/Na ratios indicate a strong silicate mineral weathering influence. All GrIS catchments, apart from Kiattuut Sermiat, clustered close to the silicate weathering end member in Mg/Na and Ca/Na plots (Figure 4), together with Greenlandic borehole samples from a previous study (Graly et al., 2014). This observation is consistent with the low concentrations of carbonate minerals found in most Greenland parental bedrock (Wimpenny et al., 2011) and indicates a strong silicate mineral weathering influence upon bulk meltwater composition (Figure 4). Conversely, Kiattuut Sermiat bulk meltwater samples plotted toward the carbonate end member, along with Haut d’ Arolla borehole waters, where the influence of trace carbonates on the chemical composition of meltwaters has previously been reported (Tranter et al., 2002c). This may be reflective of basaltic intrusions underlying the Kiattuut Sermiat catchment (Hawkings et al., 2016). Studies on older basalts have shown that the mobility of Ca2+, Mg2+, and Si increases over time due to the stabilization of igneous plagioclase and pyroxene and the formation of alternation minerals such as Ca and Mg- smectites (Gislason et al., 2009). The formation of these minerals may explain why older basaltic rocks, such as those that underlay Kiattuut Sermiat, are relatively rich in divalent cations compared to monovalent ions (Gislason and Eugster, 1987).
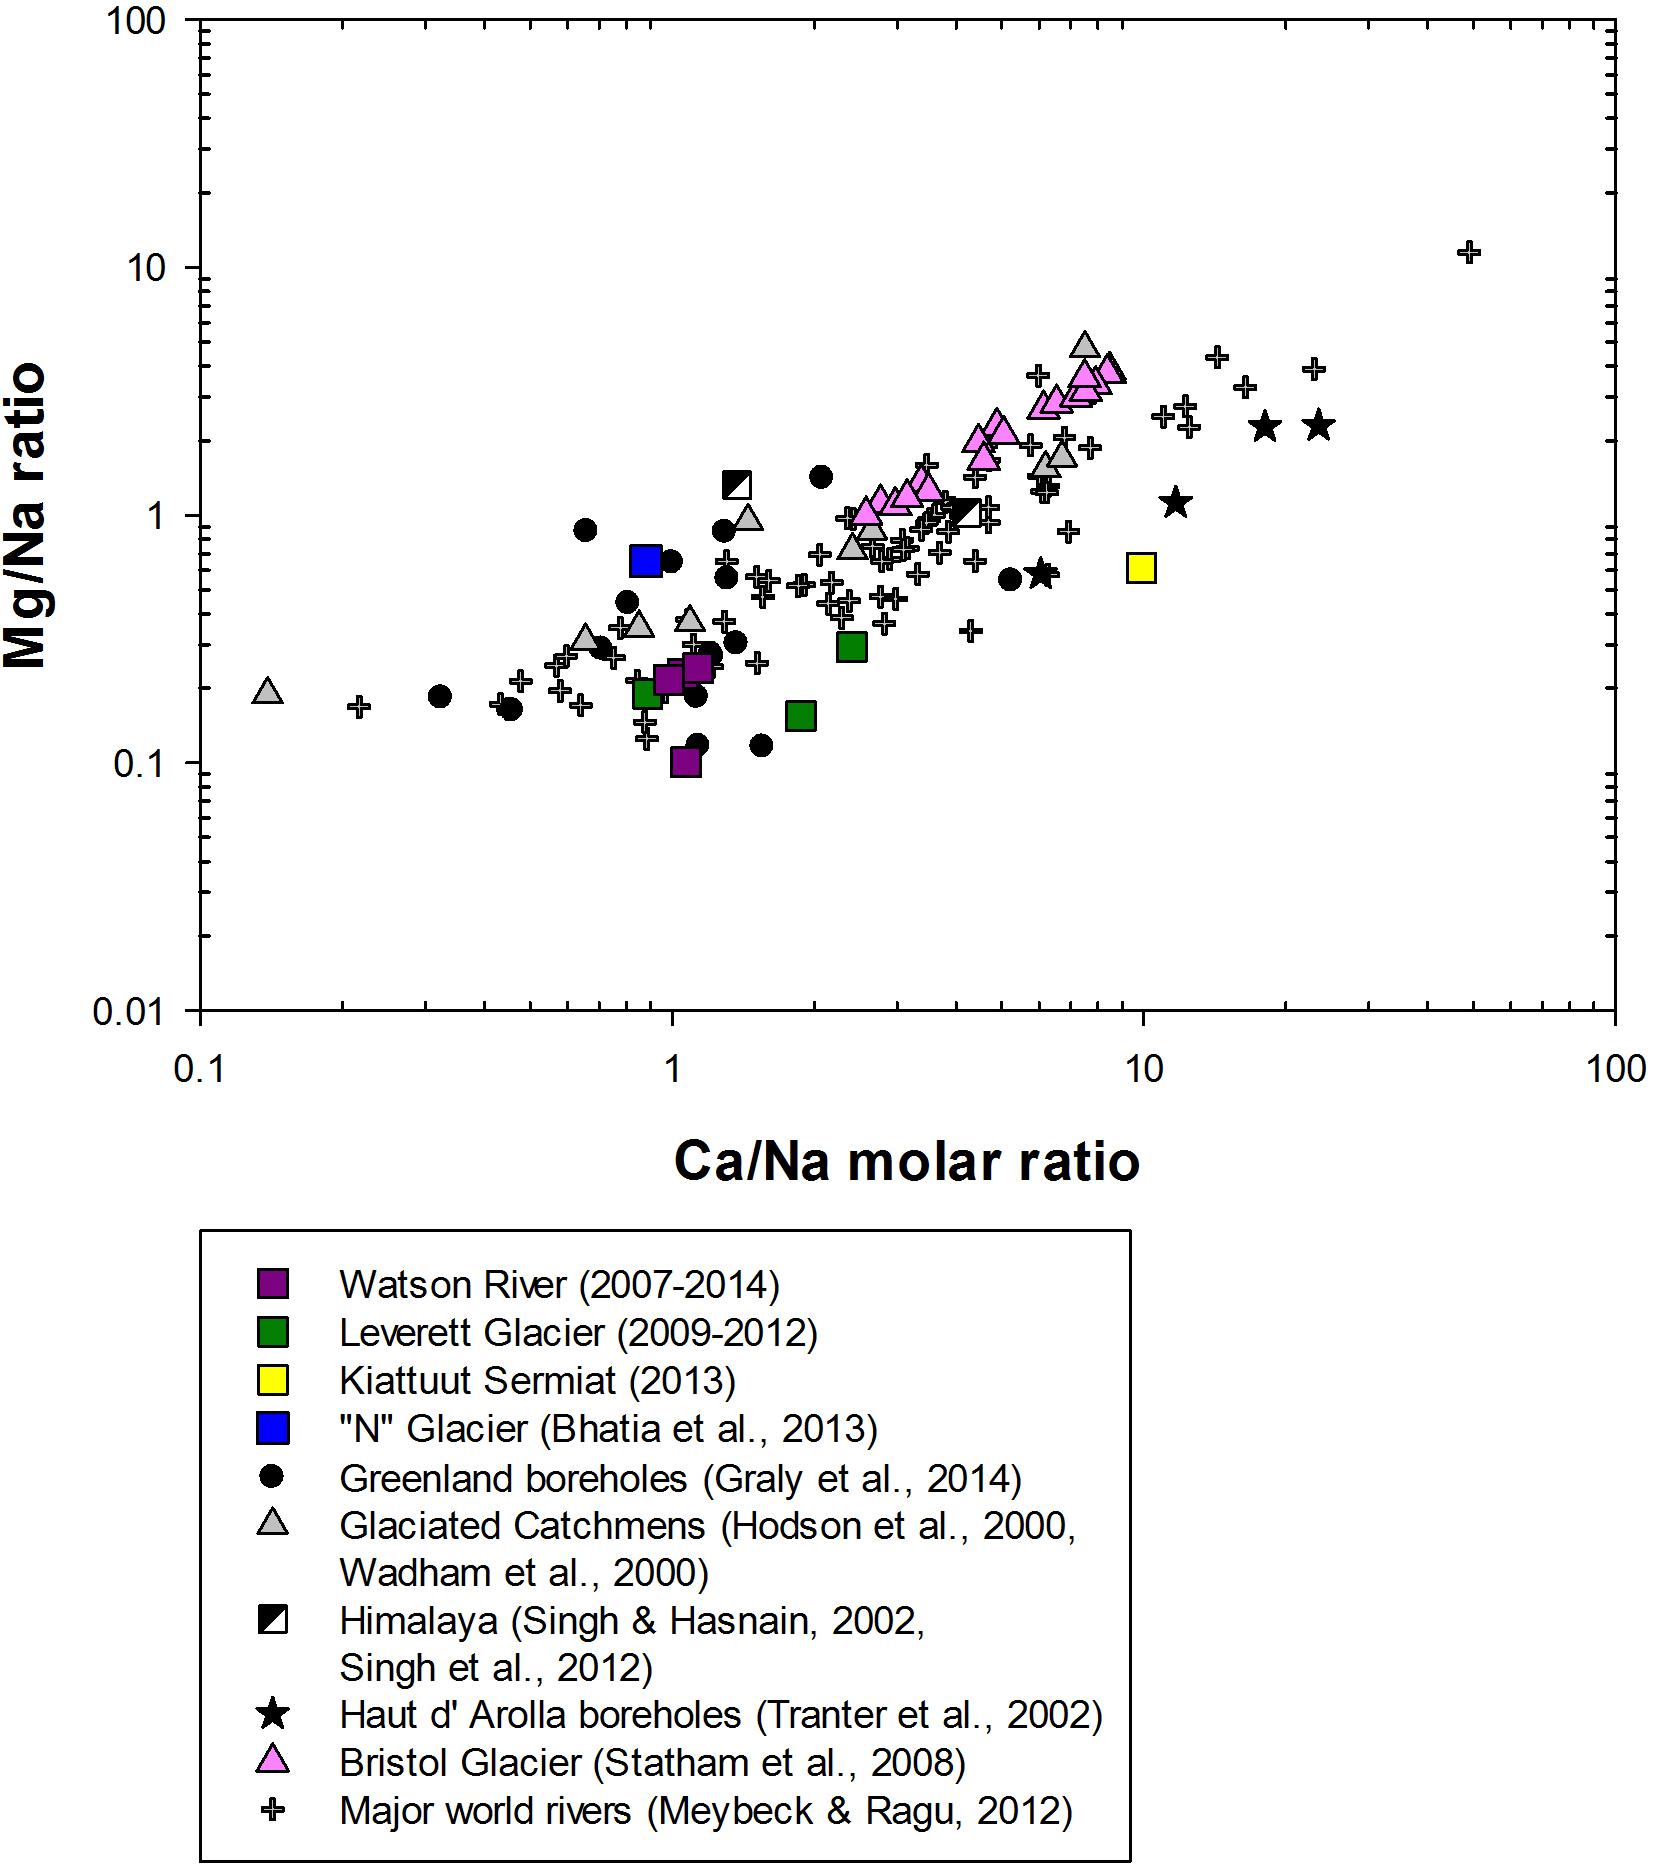
Figure 4. Mixing diagram using dissolved Na-normalized molar ratios in dissolved in meltwaters from glaciated catchments and major world rivers.
The observed contrast in ion ratios are also reflected in chemical weathering rates from the different GrIS catchments. Annual Ca2+ + Mg2+ weathering fluxes from GrIS catchments were generally lower than those typically observed in small valley glaciers (such as Finsterwalderbreen, Svalbard (Wadham et al., 2010a), which are reported to contain higher concentration of trace reactive carbonates (Figure 2B). These carbonate minerals become exposed during rock crushing, and have much faster dissolution kinetics in comparison to silicate mineral dissolution rates at low temperatures (Anderson et al., 2000). Thus, even in low concentrations, carbonate minerals can leave a significant imprint upon meltwater chemistry, and tend to dominate the overall ionic load of most small valley glaciers (Wadham et al., 2010b). By contrast, GrIS shield bedrock has very low concentrations of carbonates, which is reflected in low overall Ca2+ + Mg2+ weathering yields.
Na+ + K+ yields from GrIS catchments, which exceed those from valley glaciers (Figure 2C), are consistent with elevated rates of silicate mineral dissolution, such as: mica, biotite (K+) and plagioclase (Na+) dissolution from GrIS parental bedrock. In smaller glaciated catchments, chemical weathering rates are controlled by availability of more easily weathered accessory carbonate and sulfide minerals from bedrock (Wadham et al., 1997; Tranter et al., 2002c). The incongruent release of monovalent cations relative to Si during silicate mineral weathering provides one explanation for the low dissolved Si yields compared with Na+ + K+ yields, and relative to non-glacial world rivers (Figure 2D; Anderson, 2007). This is particularly the case for K+, which may be released preferentially from biotite during glacial grinding (Anderson, 2007) and dominates the monovalent cation load in GrIS catchments studied here. GrIS catchments with a high specific discharge display Na+ + K+ yields of up to 7.1 km–2 a–1 (e.g., Kiattuut Sermiat), which are a factor of three greater than those from major world rivers, such as the Kolyma, Mackenzie, Ob and Nile rivers (∼ 0.4 tons km–2 a–1). Indeed, Watson River total dissolved silica yields (2.62 tons km–2 a–1) in extreme melt years (2010) are a factor of two greater than the Mississippi River (1.3 tons km–2 a–1) (Meybeck and Ragu, 2012).
The importance of ice sheet catchments in silicate mineral weathering becomes even more pronounced if the amorphous silica fraction is included in calculations of silica yields for GrIS catchments. This increases silica yields by at least an order of magnitude (Figure 2D). Leverett Glacier (25 tons km–2 a–1 ASi) and Watson River (48 tons km–2 a–1 ASi) have high amorphous silica yields in comparison to the smaller Kiattuut Sermiat catchment (5.29 tons km–2 a–1 ASi). This is likely explained by the elevated physical erosion rates from Leverett Glacier and other large glaciers draining into the Watson River, which are at least an order of magnitude larger in size than Kiattuut Sermiat (Hawkings et al., 2017). This supports the hypothesis made in recent studies that GrIS exports large fluxes of reactive silica to neighboring ecosystems, where it may be important in stimulating the productivity of siliceous organisms (Meire et al., 2016; Hawkings et al., 2017; Hendry et al., 2019).
Variations in Chemical Weathering Between Greenland Ice Sheet Catchments
Further insight into chemical weathering processes beneath the GrIS is gained by comparing molar ratios of the major weathering products. These reveal that the relative molar ratios in runoff from GrIS catchments are variable in time and space (Figure 3A). For example, Watson River and Leverett Glacier bulk meltwaters plot further toward a Na+ + K+ dominated composition in higher melt years (Watson River: 2007, 2010; Leverett Glacier: 2012). Data points in these years plot closer to those from Subglacial Lake Whillians and GrIS borehole samples, suggesting a greater contribution of silicate mineral dissolution and release of longer residence time waters (Scribner et al., 2015). One potential explanation could be that in high melt years (e.g., Watson River 2007 and Leverett Glacier: 2012) the snowline retreats to higher elevations and promotes drainage of supraglacial meltwaters to areas of the glacier bed further inland, flushing out long residence subglacial water (Howat et al., 2013). This expulsion of long residence time meltwaters from inland zones would serve to increase the molar ratio of Na+ + K+ (slow dissolution kinetics via enhanced silicate mineral weathering in a long residence time system) over Ca2+ + Mg2+ (fast dissolution kinetics via carbonate mineral weathering) (Wadham et al., 2010a).
In contrast with Na+ + K+, the Si molar ratio is low in all GrIS catchments (∼3%) (Figure 3A), a reflection of the typically incongruent behavior of silicate mineral dissolution and formation of secondary weathering mineral products with a high proportion of Si (e.g., ASi) (Graly et al., 2014; Hawkings et al., 2017). Hence, low Si molar ratios in Greenlandic catchments, might reflect an under saturation of albite, anorthite and K-feldspar minerals as well as a concaminant saturation of gibbsite and kaolinite (Wimpenny et al., 2010). Collectively these effects, would yield low dissolved silica concentrations (Scribner et al., 2015) in comparison to Na+ + K+ and Ca2+ + Mg2+.
The only GrIS catchment investigated in this study that exhibits a high Ca2+ + Mg2+ molar ratio is Kiattuut Sermiat. This observation can be explained by both the smaller catchment size (Hawkings et al., 2016) and the basaltic intrusions present in the bedrock. Basaltic mineral dissolution experiments have shown that basalts dissolve up to 10 times faster than crystalline rocks (Gislason and Eugster, 1987; Gislason and Arnórsson, 1993; Gislason et al., 2009). Basaltic intrusions contain highly reactive Ca and Mg- silicates, thus Ca2+ + Mg2+ concentrations are likely enhanced by the dissolution of these minerals (Flaathen et al., 2009). Interestingly, the meltwater chemistry of this catchment is strongly dominated by HCO3– and it is also the only GrIS catchment examined in this study that exhibits a relatively high sulfate molar ratio. This suggests silicate mineral dissolution is driven by both carbonation and sulfide oxidation (Tranter et al., 1997; Fairchild et al., 1999; Anderson et al., 2000; Brown, 2002).
Specific discharge is the primary control on chemical weathering yields in GrIS catchments studied here (Figure 2). This is likely due to: (1) high rates of physical weathering under large catchments with a high specific discharge, which lead to the exposure of fresh bedrock surface to weathering and production of freshly comminuted debris (Brown, 2002) and (2) high flushing rates and the expulsion of long-time stored subglacial waters from inland zones (Wadham et al., 2001), as supraglacial lakes form at progressively high altitudes (Howat et al., 2013). If these lakes drain, they have the potential to connect more extensive areas of the ice sheet bed to the subglacial drainage system, flushing long-term stored waters, rich in dissolved solutes (Bartholomew et al., 2011). Thus, increase specific discharge with warming temperatures has the potential to lead to increased chemical weathering rates.
Conclusion
The multi-year/catchment analysis of chemical weathering rates and solute yields presented here is the first compiled for large ice sheet catchments. Chemical weathering rates from large GrIS catchments are comparable to major world rivers, such as the Mississippi and Nile. GrIS subglacial weathering appears to be dominated by the incongruent dissolution of silicate mineral weathering, unlike more commonly studied smaller valley glaciers, which have waters more indicative of carbonate weathering. This likely reflects the longer rock: water contact times for meltwater beneath GrIS catchments, and the extremely low concentrations of carbonates in the bedrock.
The primary control upon solute export from Greenland is the specific water flux, with peak solute yields observed in catchments with high specific discharge. This is likely due to rapid weathering of reactive subglacial sediments by high flushing rates of supraglacial meltwater and drainage of long-term stored subglacial waters in poorly connected regions of the bed (Hawkings et al., 2015). We would therefore expect GrIS catchment chemical weathering rates to increase with specific discharge in a warming climate. Chemical weathering rates are a factor of 2–3 higher in extreme melt years (e.g., 2010 and 2012 for Leverett Glacier) compared with lower discharge years (e.g., 2009, 2011 for Leverett Glacier). This has the potential to increase rates of chemical denudation, resulting in elevated Si and Na+ + K+ yields from these catchments to downstream environments, if high melt years become increasingly common.
Author Contributions
AU processed the data and drafted the manuscript. JW conceived the research and fundamental ideas behind it. JRH and JEH carried out the sample collection and contributed with the data analysis. JT, JY, BH, DA, MB, and PN provided hydrological and geochemical data sets and important suggestions during the data processing. All authors contributed ideas and assisted with writing and editing the manuscript.
Funding
This research was part of UK Natural Environment Research Council Project, DELVE (NERC grant NE I008845/1) and the Becas Chile (CONICYT) Ph.D. studentship to AU and Leverhulme Research Project grant RPG-2016-439 to JW. PN was supported by the Carnegie Trust for the University of Scotland and the University of Edinburgh Development Trust. Additional support was provided by Leverhulme Trust Fellowship and Royal Society Wolfson Award to JW and a European Commission Horizon 2020 Marie Skłodowska-Curie Actions fellowship ICICLES (grant agreement #793962) to JRH.
Conflict of Interest
The authors declare that the research was conducted in the absence of any commercial or financial relationships that could be construed as a potential conflict of interest.
Acknowledgments
We would like to thank all of those who assisted with fieldwork in Greenland over the field seasons. Mr. James Williams and Dr. Fotis Sgouridis in LOWTEX laboratories, School of Geographical Sciences, University of Bristol, are thanked for their support. Mr. Thomas Loriaux in School of Earth Sciences, University of Bristol, is thanked for his assistance with the manuscript images.
References
Anderson, S. P. (2007). Biogeochemistry of glacial landscape systems. Annu. Rev. Earth Planet. Sci. 35, 375–399. doi: 10.1146/annurev.earth.35.031306.140033
Anderson, S. P., Drever, J. I., Frost, C., and Holden, P. (2000). Chemical weathering in the foreland of a retreating glacier. Geochim. Cosmochim. Acta 64, 1173–1189. doi: 10.1016/s0016-7037(99)00358-0
Anderson, S. P., Drever, J. I., and Humphrey, N. F. (1997). Chemical weathering in glacial environments. Geology 25, 399–402.
Arrigo, K. R., van Dijken, G. L., Castelao, R. M., Luo, H., Rennermalm, A. K., Tedesco, M., et al. (2017). Melting glaciers stimulate large summer phytoplankton blooms in southwest greenland waters. Geophys. Res. Lett. 44, 6278–6285. doi: 10.1002/2017GL073583
Bartholomew, I., Nienow, P., Sole, A., Mair, D., Cowton, T., Palmer, S., et al. (2011). Supraglacial forcing of subglacial drainage in the ablation zone of the greenland ice sheet. Geophys. Res. Lett. 38:L08502. doi: 10.1029/2011GL047063
Berner, R. A. (1992). Weathering, plants, and the long-term carbon cycle. Geochim. Cosmochim. Acta 56, 3225–3231. doi: 10.1016/0016-7037(92)90300-8
Bhatia, M. P., Das, S. B., Xu, L., Charette, M. A., Wadham, J. L., and Kujawinski, E. B. (2013a). Organic carbon export from the Greenland ice sheet. Geochim. Cosmochim. Acta 109, 329–344. doi: 10.1016/j.gca.2013.02.006
Bhatia, M. P., Kujawinski, E. B., Das, S. B., Breier, C. F., Henderson, P. B., and Charette, M. A. (2013b). Greenland meltwater as a significant and potentially bioavailable source of iron to the ocean. Nat. Geosci. 6, 274–278. doi: 10.1038/ngeo1746
Blum, A. E., and Stillings, L. (1995). Chemical weathering of feldspars. Chem. Weather. Rates Silic. Miner. Min. Soc. Am. Rev. Min. 31, 291–351.
Brown, G. (2002). Glacier meltwater hydrochemistry. Appl. Geochem. 17, 855–883. doi: 10.1016/s0883-2927(01)00123-8
Brown, G. H., Tranter, M., and Sharp, M. J. (1996). experimental investigations of the weathering of suspended sediment by alpine glacial meltwater. Hydrol. Process. 10, 579–597. doi: 10.1002/(sici)1099-1085(199604)10:4<579::aid-hyp393>3.0.co;2-d
Calvaruso, C., Turpault, M., and Frey-klett, P. (2006). Root-associated bacteria contribute to mineral weathering and to mineral nutrition in trees : a budgeting analysis. 72, 1258–1266. doi: 10.1128/AEM.72.2.1258
Chillrud, S. N., Pedrozo, F. L., Temporetti, P. F., Planas, H. F., and Froelich, P. N. (1994). Chemical weathering of phosphate and germanium in glacial meltwater streams: effects of subglacial pyrite oxidation. Limnol. Oceanogr. 39, 1130–1140. doi: 10.4319/lo.1994.39.5.1130
Conley, D. J. (1998). An interlaboratory comparison for the measurement of biogenic silica in sediments. Geophys. Res. Lett. 38, 39–48. doi: 10.1016/s0304-4203(98)00049-8
Cornelis, J. T., Titeux, H., Ranger, J., and Delvaux, B. (2011). Identification and distribution of the readily soluble silicon pool in a temperate forest soil below three distinct tree species. Plant Soil 342, 369–378. doi: 10.1007/s11104-010-0702-x
Cowton, T., Nienow, P., Bartholomew, I., Sole, A., and Mair, D. (2012). Rapid erosion beneath the Greenland ice sheet. Geology 40, 343–346. doi: 10.1130/G32687.1
De Angelis, M., Petit, J. R., Savarino, J., Souchez, R., and Thiemens, M. H. (2004). Contributions of an ancient evaporitic-type reservoir to subglacial lake vostok chemistry. Earth Planet. Sci. Lett. 222, 751–765. doi: 10.1016/j.epsl.2004.03.023
DeMaster, D. J. (1981). The supply and accumulation of silica in the marine environment. Geochim. Cosmochim. Acta 45, 1715–1732. doi: 10.1016/0016-7037(81)90006-5
Dubnick, A., Wadham, J., Tranter, M., Sharp, M., Orwin, J., Barker, J., et al. (2017). Trickle or treat: the dynamics of nutrient export from polar glaciers. Hydrol. Process. 31, 1776–1789. doi: 10.1002/hyp.11149
Fairchild, I. J., Killawee, J. A., Sharp, M. J., Spiro, B., Hubbard, B., Lorrain, R., et al. (1999). Solute generation and transfer from a chemically reactive alpine glacial ± proglacial system. Earth Surf. Process. Landforms 24, 1189–1211. doi: 10.1002/(sici)1096-9837(199912)24:13<1189::aid-esp31>3.0.co;2-p
Fettweis, X., Franco, B., Tedesco, M., van Angelen, J. H., Lenaerts, J. T. M., van den Broeke, M. R., et al. (2013). Estimating the Greenland ice sheet surface mass balance contribution to future sea level rise using the regional atmospheric climate model MAR. Cryosph 7, 469–489. doi: 10.5194/tc-7-469-2013
Flaathen, T. K., Gislason, S. R., Oelkers, E. H., and Sveinbjörnsdóttir, Á. E. (2009). Chemical evolution of the Mt. Hekla, Iceland, groundwaters: a natural analogue for CO2 sequestration in basaltic rocks. Appl. Geochem. 24, 463–474. doi: 10.1016/j.apgeochem.2008.12.031
Föllmi, K. B., Arn, K., Hosein, R., Adatte, T., and Steinmann, P. (2009). Biogeochemical weathering in sedimentary chronosequences of the rhône and oberaar glaciers (Swiss Alps): rates and mechanisms of biotite weathering. Geoderma 151, 270–281. doi: 10.1016/j.geoderma.2009.04.012
Gaillardet, J., Dupré, B., Louvat, P., and Allègre, C. J. (1999). Global silicate weathering and CO2 consumption rates deduced from the chemistry of large rivers. Chem. Geol. 159, 3–30. doi: 10.1016/S0009-2541(99)00031-5
Gibbs, M. T., and Kump, L. R. (1994). Global chemical erosion during the last glacial maximum and the present : sensitivity to changes in lithology and hydrology spheric pCO on timescales. Paleoceanography 9, 529–543. doi: 10.1029/94pa01009
Gislason, S. R., and Arnórsson, S. (1993). Dissolution of primary basaltic minerals in natural waters: saturation state and kinetics. Chem. Geol. 105, 117–135. doi: 10.1016/0009-2541(93)90122-Y
Gislason, S. R., and Eugster, H. P. (1987). Meteoric water-basalt interactions. II: a field study in N.E. Iceland. Geochim. Cosmochim. Acta 51, 2841–2855. doi: 10.1016/0016-7037(87)90162-1
Gislason, S. R., Oelkers, E. H., Eiriksdottir, E. S., Kardjilov, M. I., Gisladottir, G., Sigfusson, B., et al. (2009). Direct evidence of the feedback between climate and weathering. Earth Planet. Sci. Lett. 277, 213–222. doi: 10.1016/j.epsl.2008.10.018
Graly, J. A., Humphrey, N. F., Landowski, C. M., and Harper, J. T. (2014). Chemical weathering under the greenland ice sheet. Geology 42, 551–554. doi: 10.1130/G35370.1
Hanna, E., Huybrechts, P., Steffen, K., Cappelen, J., Huff, R., Shuman, C., et al. (2008). Increased runoff from melt from the Greenland Ice Sheet: a response to global warming. J. Clim. 21, 331–341. doi: 10.1175/2007JCLI1964.1
Hasholt, B., Bech Mikkelsen, A., Holtegaard Nielsen, M., and Andreas Dahl Larsen, M. (2013). observations of runoff and sediment and dissolved loads from the greenland ice sheet at kangerlussuaq, west greenland, 2007 to 2010. Zeitschrift Geomorphol. Suppl. Issues 57, 3–27. doi: 10.1127/0372-8854/2012/S-00121
Hatton, J. E., Hendry, K. R., Hawkings, J. R., Wadham, J. L., Opfergelt, S., Kohler, T. J., et al. (2019). Silicon isotopes in Arctic and sub-Arctic glacial meltwaters: the role of subglacial weathering in the silicon. Proc. R. Soc. 475:20190098. doi: 10.1098/rspa.2019.0098
Hawkings, J., Wadham, J., Tranter, M., Telling, J., and Bagshaw, E. (2016). thegreenland ice sheet as a hot spot of phosphorus weathering and export in the Arctic. Glob. Biogeochem. Cycles 30, 1–20. doi: 10.1002/2015GB005237
Hawkings, J. R., Hatton, J. E., Hendry, K. R., Souza, G. F., De, Wadham, J. L., et al. (2018). The silicon cycle impacted by past ice sheets. Nat. Commun. 9, 1–10. doi: 10.1038/s41467-018-05689-1
Hawkings, J. R., Wadham, J. L., Benning, L. G., Hendry, K. R., Tranter, M., Tedstone, A., et al. (2017). Ice sheets as a missing source of silica to the polar oceans. Nat. Commun. 8, 1–10. doi: 10.1038/ncomms14198
Hawkings, J. R., Wadham, J. L., Tranter, M., Lawson, E., Sole, A., Cowton, T., et al. (2015). The effect of warming climate on nutrient and solute export from the greenland ice sheet. Geochem. Perspect. Lett. 2000, 94–104. doi: 10.7185/geochemlet.1510
Hawkings, J. R., Wadham, J. L., Tranter, M., Raiswell, R., Benning, L. G., Statham, P. J., et al. (2014). Ice sheets as a significant source of highly reactive nanoparticulate iron to the oceans. Nat. Commun. 5:3929. doi: 10.1038/ncomms4929
Hendry, K. R., Huvenne, V. A. I., Robinson, L. F., Annett, A., Badger, M., Jacobel, A. W., et al. (2019). The biogeochemical impact of glacial meltwater from Southwest Greenland. Prog. Oceanogr. 176:102126. doi: 10.1016/j.pocean.2019.102126
Henriksen, N. A., Higgins, A. K., Kalsbeek, F., and Pulvertaft, C. R. (2009). Greenland from archean to quaternary descriptive Text to 1995 geological map of greenland 1:2500000. Geol. Surv. Denmark Greenland Copenhagen 18, 9–116.
Hodson, A., Mumford, P., and Lister, D. (2004). Suspended sediment and phosphorous in proglacial rivers: bioavailability and potential impacts upon the P status of ice-marginal receiving waters. Hydrol. Process. 18, 2409–2422. doi: 10.1002/hyp.1471
Hodson, A., Trante, M., and Vatne, G. (2000). contemporary rates of chemical denudation and atmospheric co 2 sequestration in glacier basins : an arctic perspective. Earth Surf. Process. Landforms 1471, 1447–1471. doi: 10.1002/1096-9837(200012)25:13<1447::aid-esp156>3.0.co;2-9
Howat, I. M., de la Peña, S., van Angelen, J. H., Lenaerts, J. T. M., and van den Broeke, M. R. (2013). Brief communication expansion of meltwater lakes on the Greenland Ice Sheet. Cryosph 7, 201–204. doi: 10.5194/tc-7-201-2013
Huh, Y., and Edmond, J. M. (1999). The fluvial geochemistry of the rivers of eastern siberia: III. Tributaries of the lena nabar draining the basement terrain of the siberian craton and the trans-baikal highlands. Geochim. Cosmochim. Acta 63, 967–987. doi: 10.1016/S0016-7037(99)00045-9
Jacobson, A. D., Blum, J. D., Chamberlain, C. P., Craw, D., and Koons, P. O. (2003). Climatic and tectonic controls on chemical weathering in the New Zealand Southern Alps. Geochim. Cosmochim. Acta 67, 29–46. doi: 10.1016/S0016-7037(02)01053-0
Konnerup-Madsen, J. (2001). A review of the composition and evolution of hydrocarbon gases during solidification of the Ilímaussaq alkaline complex, South Greenland. Geol. Greenl. Surv. Bull. 190, 159–166.
Kump, L. R., and Alley, R. B. (1994). “Global chemical weathering on glacial time scales,” in Material Fluxes on the Surface of the Earth (Washington, DC: National Academies), 46–61.
Lafrenière, M., and Lamoureux, S. (2008). Seasonal dynamics of dissolved nitrogen exports from two High Arctic watersheds, Melville Island, Canada. Hydrol. Res. 39, 323–335. doi: 10.2166/nh.2008.008
Lasaga, A. C., Soler, J. M., Ganor, J., Burch, T. E., and Nagy, K. L. (1994). Chemical weathering rate laws and global geochemical cycles. Geochim. Cosmochim. Acta 58, 2361–2386. doi: 10.1016/0016-7037(94)90016-7
Lawson, E., Wadham, J. L., Tranter, M., Stibal, M., Lis, G. P., Butler, C. E. H., et al. (2014). Greenland ice sheet exports labile organic carbon to the Arctic oceans. Biogeosciences 11, 4015–4028. doi: 10.5194/bg-11-4015-2014
Lindbäck, K., Pettersson, R., Hubbard, A. L., Doyle, S. H., Van As, D., Mikkelsen, A. B., et al. (2015). Subglacial water drainage, storage, and piracy beneath the Greenland ice sheet. Geophys. Res. Lett. 42, 7606–7614. doi: 10.1002/2015GL065393
McGrath, D., Steffen, K., Overeem, I., Mernild, S. H., Hasholt, B., and Van Den Broeke, M. (2010). Sediment plumes as a proxy for local ice-sheet runoff in kangerlussuaq fjord, West Greenland. J. Glaciol. 56, 813–821. doi: 10.3189/002214310794457227
Meire, L., Meire, P., Struyf, E., Krawczyk, D., Arendt, K., Yde, J., et al. (2016). High export of dissolved silica from the Greenland Ice Sheet. Geophys. Res. Lett. 43, 9173–9182.
Mernild, S. H., and Hasholt, B. (2009). Observed runoff, jökulhlaups and suspended sediment load from the Greenland ice sheet at kangerlussuaq, west Greenland, 2007 and 2008. J. Glaciol. 55, 855–858. doi: 10.3189/002214309790152465
Mernild, S. H., Hasholt, B., Kane, D. L., and Tidwell, A. C. (2008). Jökulhlaup observed at greenland ice sheet. Eos. Trans. Am. Geophys. Union 89:321. doi: 10.1029/2008EO350001
Meybeck, M. (1987). Global chemical weathering of surficial rocks estimated from river dissolved loads. Am. J. Sci. 287, 401–428. doi: 10.2475/ajs.287.5.401
Meybeck, M., and Ragu, A. (2012). GEMS-GLORI World River Discharge Database. Paris: Université Pierre et Marie Curie.
Michaud, A. B., Skidmore, M. L., Mitchell, A. C., Vick-Majors, T. J., Barbante, C., Turetta, C., et al. (2016). Solute sources and geochemical processes in subglacial lake whillans. West Antarctica. Geology 44, 347–350. doi: 10.1130/G37639.1
Scribner, C. A., Martin, E. E., Martin, J. B., Deuerling, K. M., Collazo, D. F., and Marshall, A. T. (2015). Exposure age and climate controls on weathering in deglaciated watersheds of western Greenland. Geochim. Cosmochim. Acta 170, 157–172. doi: 10.1016/j.gca.2015.08.008
Sharp, M. J., Brown, G. H., Tranter, M., Willis, I. C., and Hubbard, B. P. (1995). Comments on the use of the chemically based mixing models in glacier hydrology. J. Glaciol. 41, 241–246. doi: 10.3189/s0022143000016142
Sharp, M., Tranter, M., Brown, G. H., and Skidmore, M. (1995). Rates of chemical denudation and CO2 drawdown in a glacier-covered alpine catchment. Geology 23, 61–64.
Singh, V. B., Ramanathan, A. L., Pottakkal, J. G., Sharma, P., Linda, A., Azam, M. F., et al. (2012). Chemical characterisation of meltwater draining from gangotri glacier, garhwal himalaya, India. J. Earth Syst. Sci. 121, 625–636. doi: 10.1007/s12040-012-0177-7
Skidmore, M., Sharp, M., and Tranter, M. (2004). Kinetic isotopic fractionation during carbonate dissolution in laboratory experiments: implications for detection of microbial CO2 signatures using δ13C-DIC. Geochim. Cosmochim. Acta 68, 4309–4317. doi: 10.1016/j.gca.2003.09.024
Steffensen, J. P. (1988). Analysis of the seasonal variation in dust, ci-, n0 3-, and SO4 in two central Greenland firn cores. Ann. Glaciol. 10, 171–177. doi: 10.1017/s0260305500004389
Tedstone, A. J., Nienow, P. W., Sole, A. J., Mair, D. W. F., Cowton, T. R., Bartholomew, I. D., et al. (2013). Greenland ice sheet motion insensitive to exceptional meltwater forcing. Proc. Natl. Acad. Sci. U.S.A. 110, 19719–19724. doi: 10.1073/pnas.1315843110
Torres, M. A., Moosdorf, N., Hartmann, J., Adkins, J. F., and West, A. J. (2017). Glacial weathering, sulfide oxidation, and global carbon cycle feedbacks. Proc. Natl. Acad. Sci. U.S.A. 114, 8716–8721. doi: 10.1073/pnas.1702953114
Tranter, M., Huybrechts, P., Munhoven, G., Sharp, M. J., and Brown, G. H. (2002a). Direct effect of ice sheets on terrestrial bicarbonate, sulphate and base cation fluxes during the last glacial cycle : minimal impact on atmospheric CO 2 concentrations. Chem. Geol. 190, 33–44. doi: 10.1016/s0009-2541(02)00109-2
Tranter, M., Huybrechts, P., Munhoven, G., Sharp, M. J., Brown, G. H., Jones, I. W., et al. (2002b). Direct effect of ice sheets on terrestrial bicarbonate, sulphate and base cation fluxes during the last glacial cycle: minimal impact on atmospheric CO2 concentrations. Chem. Geol. 190, 33–44. doi: 10.1016/S0009-2541(02)00109-2
Tranter, M., Sharp, M. J., Lamb, H. R., Brown, G. H., Hubbard, B. P., and Willis, I. C. (2002c). Geochemical weathering at the bed of Haut glacier d’arolla, switzerland - a new model. Hydrol. Process. 16, 959–993. doi: 10.1002/hyp.309
Tranter, M., Sharp, M. J., Brown, G. H., Wills, I. C., Hubbard, B. P., Nielsen, M. K., et al. (1997). Variability in the chemical composition of in situ subglacial meltwaters. Hydrol. Process. 11, 59–77. doi: 10.1002/(sici)1099-1085(199701)11:1<59::aid-hyp403>3.3.co;2-j
van As, D., Hasholt, B., Ahlstrøm, A. P., Box, J. E., Cappelen, J., Colgan, W., et al. (2018). Reconstructing Greenland Ice Sheet meltwater discharge through the watson river (1949–2017). Arctic Antarct. Alp. Res. 50:S100010. doi: 10.1080/15230430.2018.1433799
van As, D., Hubbard, A. L., Hasholt, B., Mikkelsen, A. B., Van Den Broeke, M. R., and Fausto, R. S. (2012). The Cryosphere Large surface meltwater discharge from the kangerlussuaq sector of the Greenland ice sheet during the record-warm year 2010 explained by detailed energy balance observations. Cryosph 6, 199–209. doi: 10.5194/tc-6-199-2012
van Gool, J. A., Connelly, J. N., Marker, M., and Mengel, F. C. (2002). The nagssugtoqidian orogen of west greenland: tectonic evolution and regional correlations from a West Greenland perspective. Can. J. Earth Sci. 39, 665–686. doi: 10.1139/e02-027
Wadham, J. L., Hodgkins, R., Cooper, R. J., and Tranter, M. (2001). Evidence for seasonal subglacial outburst events at a polythermal glacier, Finsterwalderbreen, Svalbard. Hydrol. Process. 15, 2259–2280. doi: 10.1002/hyp.178
Wadham, J. L., Hodson, A. J., Tranter, M., and Dowdeswell, J. A. (1997). The rate of chemical weathering beneath a quiescent, surge-type, polythermal-based glacier, southern Spitsbergen, Svalbard. Ann. Glaciol. 24, 27–31. doi: 10.3189/S0260305500011885
Wadham, J. L., Tranter, M., and Dowdeswell, J. A. (2000). Hydrochemistry of meltwaters draining a polythermal-based, high-Arctic glacier, south Svalbard : II. Winter and early Spring. Hydrol. Process. 14, 1767–1786.
Wadham, J. L., Tranter, M., Hodson, A. J., Hodgkins, R., Bottrell, S., Cooper, R., et al. (2010a). Hydro-biogeochemical coupling beneath a large polythermal Arctic glacier: implications for subice sheet biogeochemistry. J. Geophys. Res. Earth Surf. 115, 1–16. doi: 10.1029/2009JF001602
Wadham, J. L., Tranter, M., Skidmore, M., Hodson, A. J., Priscu, J., Lyons, W. B., et al. (2010b). Biogeochemical weathering under ice: size matters. Global Biogeochem. Cycles 24:GB3025. doi: 10.1029/2009GB003688
Weidick, A., Boggild, C. E., and Knudsen, N. T. (1992). Glacier Inventory and Atlas of West Greenland. Grønlands: Grønlands Geologiske Undersølgelse.
Wimpenny, J., Burton, K. W., James, R. H., Gannoun, A., Mokadem, F., and Gíslason, S. R. (2011). The behaviour of magnesium and its isotopes during glacial weathering in an ancient shield terrain in West Greenland. Earth Planet. Sci. Lett. 304, 260–269. doi: 10.1016/j.epsl.2011.02.008
Wimpenny, J., James, R. H., Burton, K. W., Gannoun, A., Mokadem, F., and Gíslason, S. R. (2010). Glacial effects on weathering processes: new insights from the elemental and lithium isotopic composition of West Greenland rivers. Earth Planet. Sci. Lett. 290, 427–437. doi: 10.1016/j.epsl.2009.12.042
Keywords: Greenland, ice sheet, glaciers, solute fluxes, cations, silica, weathering
Citation: Urra A, Wadham J, Hawkings JR, Telling J, Hatton JE, Yde JC, Hasholt B, van As D, Bhatia MP and Nienow P (2019) Weathering Dynamics Under Contrasting Greenland Ice Sheet Catchments. Front. Earth Sci. 7:299. doi: 10.3389/feart.2019.00299
Received: 09 December 2018; Accepted: 30 October 2019;
Published: 26 November 2019.
Edited by:
Julia Ribeiro, Guangzhou Institute of Geochemistry (CAS), ChinaReviewed by:
Aga Nowak, The University Centre in Svalbard, NorwayNils Moosdorf, Leibniz Centre for Tropical Marine Research (LG), Germany
Copyright © 2019 Urra, Wadham, Hawkings, Telling, Hatton, Yde, Hasholt, van As, Bhatia and Nienow. This is an open-access article distributed under the terms of the Creative Commons Attribution License (CC BY). The use, distribution or reproduction in other forums is permitted, provided the original author(s) and the copyright owner(s) are credited and that the original publication in this journal is cited, in accordance with accepted academic practice. No use, distribution or reproduction is permitted which does not comply with these terms.
*Correspondence: Alejandra Urra, ale.urragallardo@bristol.ac.uk