Selective Recording of Tectonic Forcings in an Oligocene/Miocene Submarine Channel System: Insights From New Age Constraints and Sediment Volumes From the Austrian Northern Alpine Foreland Basin
 Julian Hülscher
 Gero Fischer1
  Gerald Auer
 Anne Bernhardt
- 1Institute of Geological Sciences, Tectonics and Sedimentary Systems, Freie Universität Berlin, Berlin, Germany
- 2Institute of Geology and Mineralogy, University of Cologne, Cologne, Germany
- 3Research Institute for Marine Resources Utilization (Biogeochemistry Program), Japan Agency for Marine-Earth Science and Technology, Yokosuka, Japan
Detailed characterization of variations in sediment architecture, flux, and transport processes in peri-orogenic basins offers insights into external climatic or tectonic forcings. We tested how four well-known tectonic/erosional events in the Oligocene/Miocene Alpine source area are recorded in the sediment-accumulation rates (SARs) of the deep marine sink in the Northern Alpine Foreland Basin (NAFB): exhumation of the Lepontine Dome (starting at 30 Ma) and the Tauern Window (23-21 Ma), erosion of the Augenstein Formation (∼21 Ma), and the visco-elastic relaxation of the European Plate. The Upper Austrian NAFB offers a unique opportunity to investigate external forcings on sedimentary infill due to the large amount of data on the Alpine hinterland and foreland. Deep-marine sedimentation, forming the Puchkirchen Group and the basal Hall Formation, was controlled by a basin-axial submarine channel (3–5 km wide, >100 km length). Two basin-wide unconformities were recognized in seismic-reflection data: the Northern Slope Unconformity (NSU) and the Base Hall Unconformity (BHU). We combine biostratigraphic and chemostratigraphic analyses of 316 drill-cutting samples from three wells with a large 3D-seismic-reflection data set (3300 km2, >5 km depth) to determine age and duration of the unconformities and to calculate spatially averaged SARs for the submarine channel and its overbanks, separately. Deepening of the basin, recorded by the NSU, occurred between 28.1 and 26.9 Ma. The Puchkirchen Group (26.9–19.6 Ma) is characterized by constant SARs (within standard deviation) in the channel [432–623 (t/m2/Ma)] and on the overbanks [240–340 (t/m2/Ma)]. The visco-elastic relaxation of the European Plate results in low SARs on the overbanks [186 (t/m2/Ma)], a decrease in sediment grain size in channel deposits and a decrease in sea level at the BHU (19.6–19.0 Ma). In the upper Hall Formation (19.0–18.1 Ma), clinoforms prograding from the south filled up the basin [1497 (t/m2/Ma)] within 1 Myrs. We conclude that only two of the tectonic signals are recorded in this part of the deep-marine sink, erosion of Augenstein Formation and visco-elastic relaxation of the European Plate; the exhumation of the Tauern Window and Lepontine Dome remain unrecorded.
Introduction
Sediment production, paleotopography, sediment-routing and transport processes control the temporal and spatial infill of peri-orogenic basins. The identification of the dominating control processes offers insights into the underlying external environmental forcing mechanisms such as climatic transitions or deep-seated tectonic processes (Clift, 2006; Guillocheau et al., 2012; Gulick et al., 2015). Calculation of spatially averaged sediment-accumulation rates (SARs) allow to investigate these external environmental forcings and intrinsic controls within the sediment-routing system (Romans et al., 2016). Nevertheless, the correct interpretation of external environmental forcings from the sedimentary record remains challenging as its signal might be buffered (Clift and Giosan, 2014), shredded (Jerolmack and Paola, 2010), delayed (Schlunegger and Castelltort, 2016), or masked by autogenic processes (Murray et al., 2009). The attempt of correlating changes in the stratigraphic record to changes in external forcing necessarily involves an evaluation of preceding and contemporaneous tectonic events, sea-level changes, and changes in sediment-routing pathways, as all these internal factors shape the production and storage of sediments in all compartments of the source-to-sink system (Carvajal and Steel, 2012). Moreover, the precise evaluation of all depositional environments of the sedimentary system, both in space and in time, is crucial, as environmental signals may be recorded differently in different depositional environments within a single sedimentary system (e.g., Romans et al., 2016).
The Upper Austrian Northern Alpine Foreland Basin (NAFB, Figure 1) offers an excellent opportunity to investigate such signals. The sediment-source area, the European Alps, form one of the most extensively studied orogens in the world with well-constrained phases of uplift and denudation, and relatively well understood tectonic drivers (e.g., Handy et al., 2015). Similarly, the Upper Austrian NAFB is one of the most thoroughly studied foreland-basin systems (Gross et al., 2018). During the deposition of the Oligocene to Miocene Zupfing Formation, Puchkirchen Group – consisting of the Lower (LPF) and Upper Puchkirchen (UPF) Formations – and the lower Hall Formation, sediment routing in the basin was largely controlled by a submarine channel system along the basin axis (Figures 2, 3) (De Ruig and Hubbard, 2006; Hubbard et al., 2009). This channel system received detritus (Figure 4) from the Central and Eastern Alps (Sharman et al., 2018) and separated the basin into a wide, gently sloping northern (De Ruig and Hubbard, 2006) and a steep tectonically active southern margin (Covault et al., 2009). The deep marine conditions of the Upper Austrian NAFB are in contrast to the fluvial, continental depositional environment in Oligocene/Miocene (Lower Freshwater Molasse, Figure 3) times in the central and western part of the NAFB (Kuhlemann and Kempf, 2002). Due to its economic importance as a hydrocarbon province (Boote et al., 2018), the basin is densely covered by exploration and production wells and by a large, 3D seismic-reflection dataset covering 3300 km2 and >5 km in depth (Figure 1). The post-stack, 3D time-migrated seismic-reflection data cube and the well data are provided by the RAG Austria AG (Vienna).
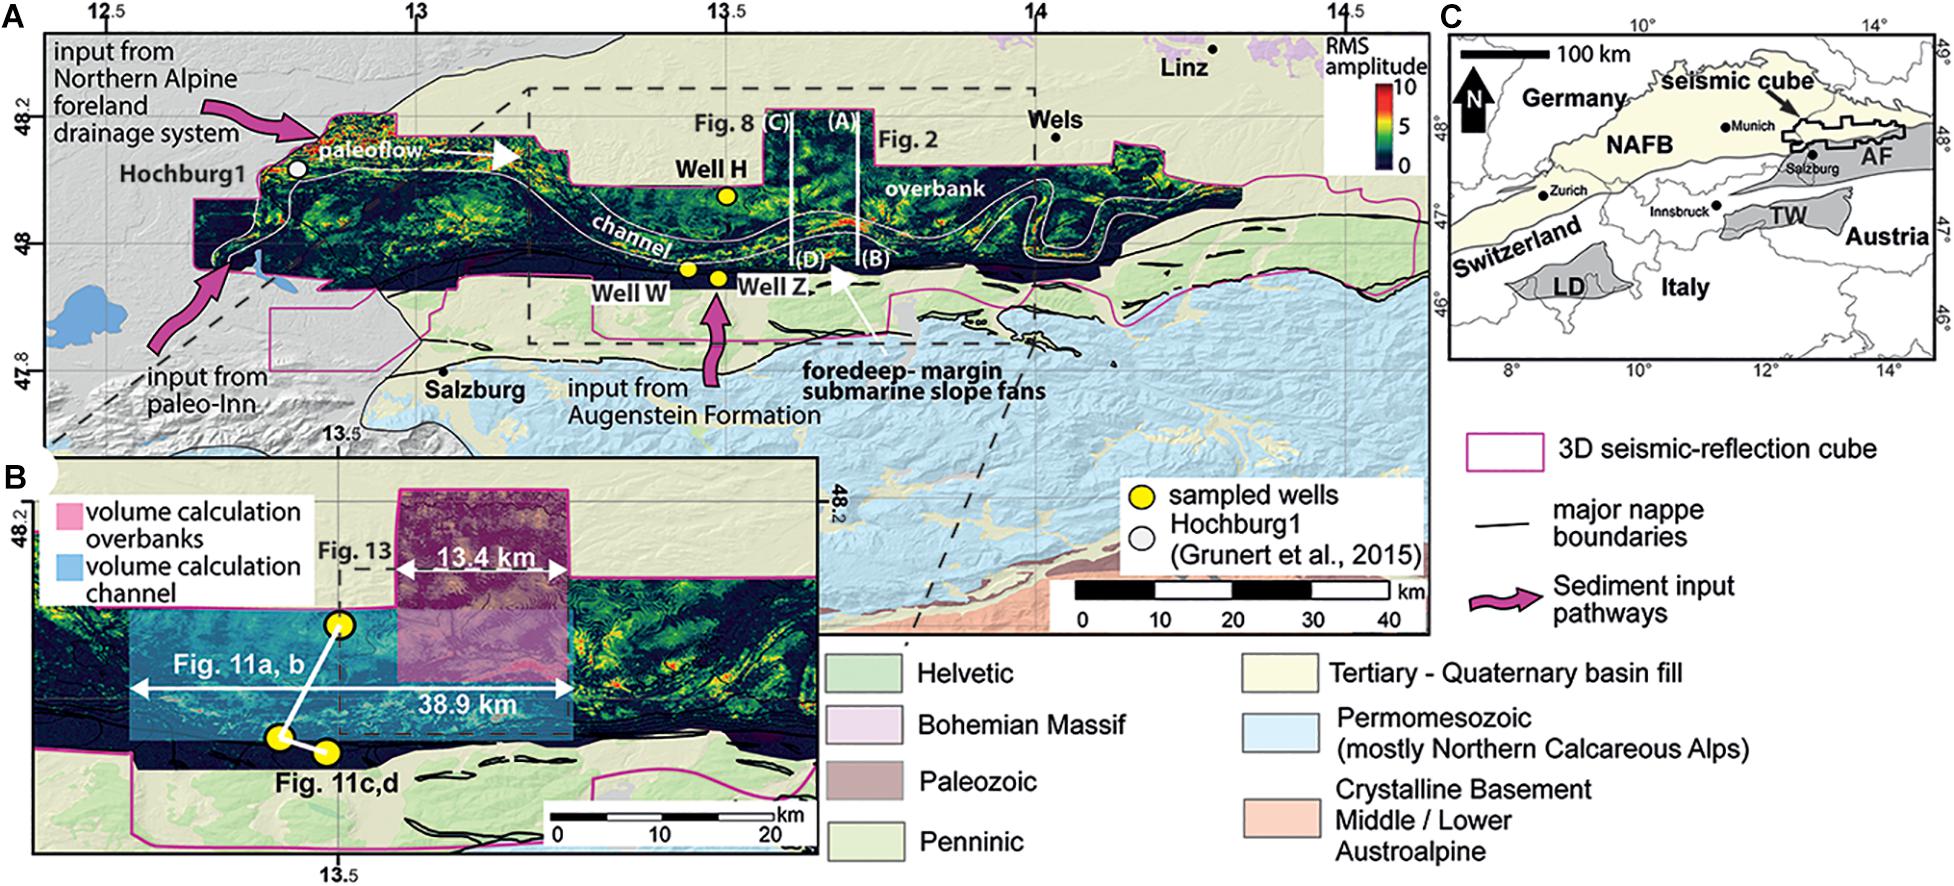
Figure 1. (A) Simplified geological map of the Upper Austrian NAFB and position of the three analyzed wells and reference well Hochburg1 (Grunert et al., 2015). The pink outline shows the extent of the 3D-seismic cube provided by RAG. The inset shows a root mean square (RMS) amplitude map of the seismic-reflection surface of the Base Hall Unconformity outlining the axial channel, the extensive overbank deposits on the northern basin margin and the slope fans on the southern tectonically active margin. (B) Detail of (A) with location and extent of the volume calculation, the position of the three wells and the seismic cross sections between them. (C) Present location of the NAFB, the Lepontine Dome (LD), Tauern Window (TW), and 3D-seismic cube in central Europe. Additionally, the approximated position of the nowadays mostly eroded Augenstein Formation (AF) is marked.
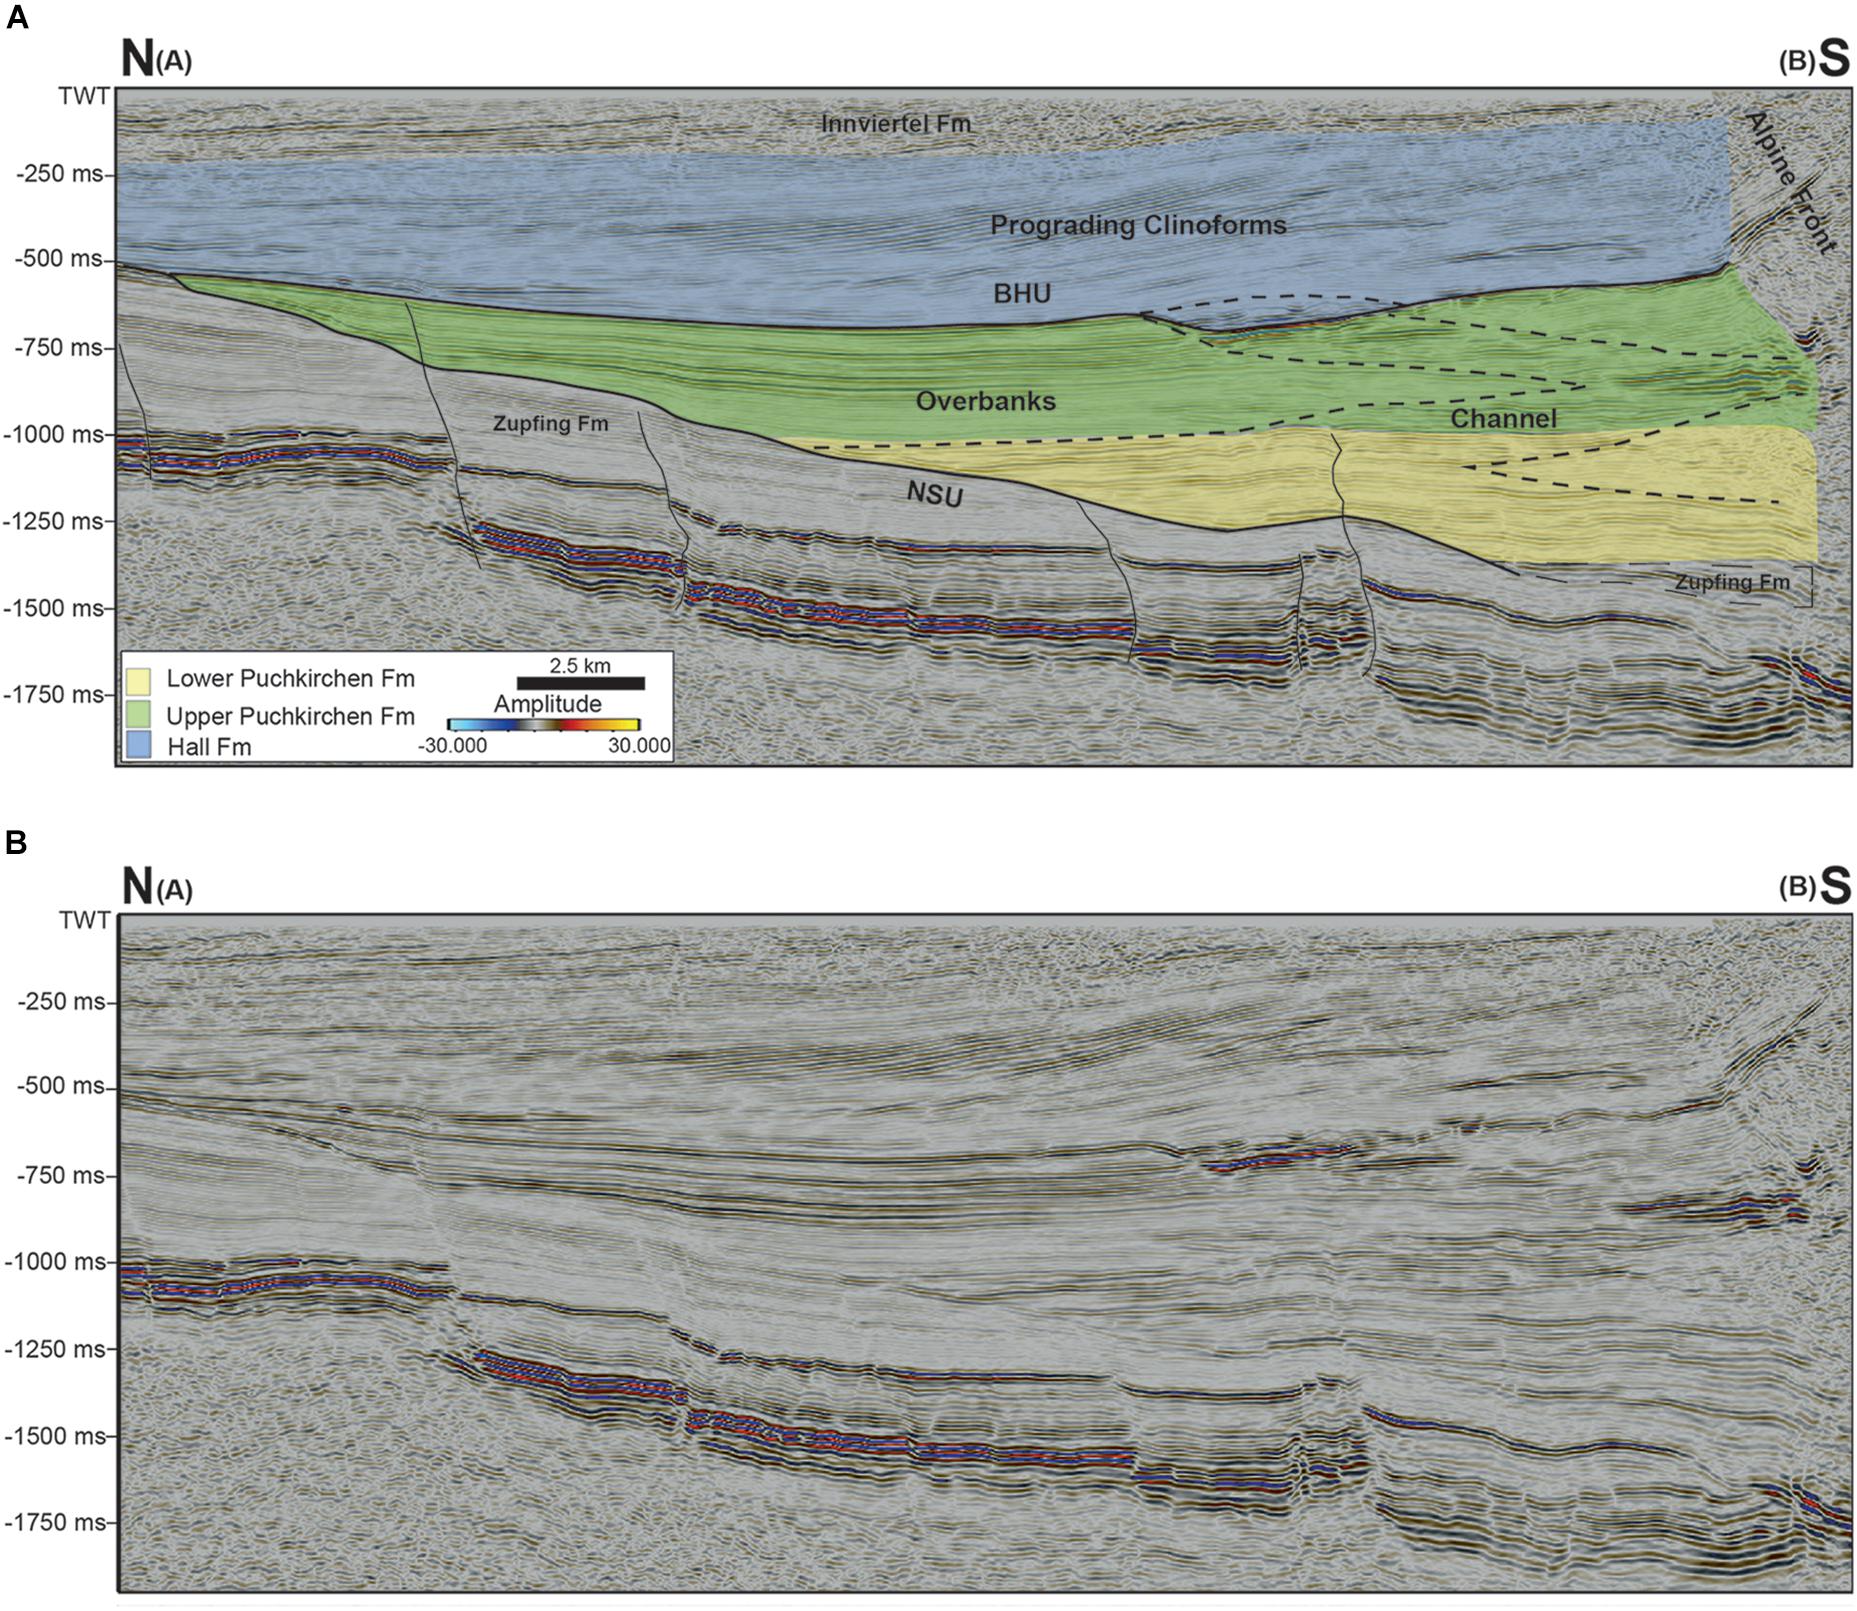
Figure 2. Cross section (N – S) through the Upper Austrian Molasse Basin (for position see Figure 1) showing the lateral migration of the main channel belt in the Puchkirchen and Hall formations (black, dotted lines). On the northern slope the NSU (thick black line) is visible with the Zupfing Formation below it. The wide (≤15 km) overbanks of the UPF and BHF north of the channel are illustrated. The BHU is characterized by truncated reflectors in the channel and two strong reflectors on the overbanks. Above the BHU a small segment with transparent reflectors is visible before clinoforms start to prograde from the southern margin into the basin. (A) Interpreted seismic cross section; (B) uninterpreted seismic cross section.
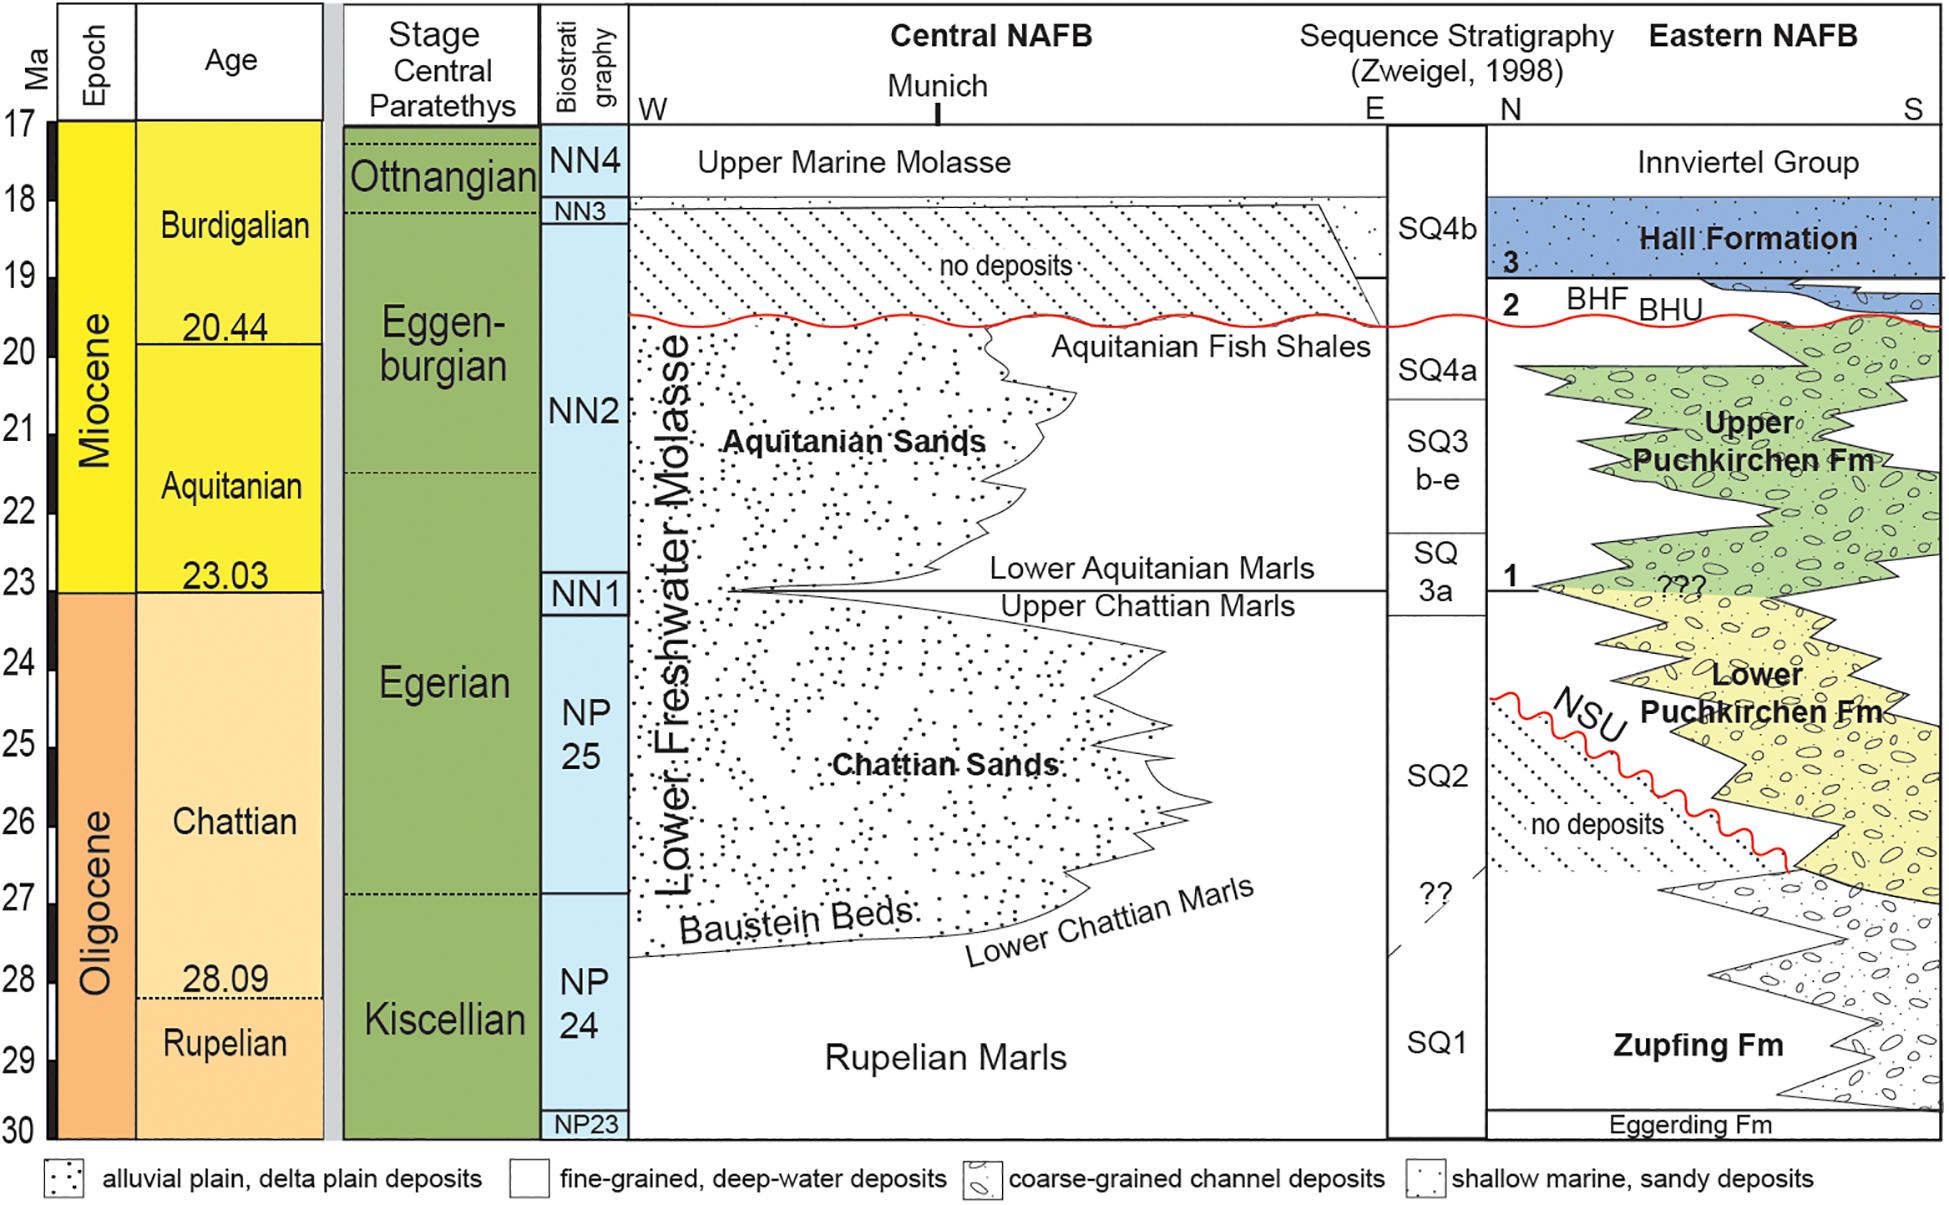
Figure 3. Schematic correlation of the global stages (Gradstein et al., 2012), the stages of the Central Paratethys (Piller et al., 2007), the calcareous nannoplankton after Backman et al. (2012) and Agnini et al. (2014), the stratigraphic and facies evolution (from W to E) in the central NAFB (Kuhlemann and Kempf, 2002), the sequence stratigraphy for the eastern NAFB (Zweigel, 1998), and the stratigraphy and facies evolution (N-S cross section) in the deep-marine Puchkirchen Trough. Depositional ages of the Eggerding and Zupfing Fm from Sachsenhofer et al. (2010) and Soliman (2012). Please note: Correlation between the eastern and the central NAFB is highly speculative. Only the Oligocene/Miocene (1) boundary (SQ 3a), the BHU (2), and the maximum flooding surface (mfs) in the HFM (3) can be used as reliable temporal markers.
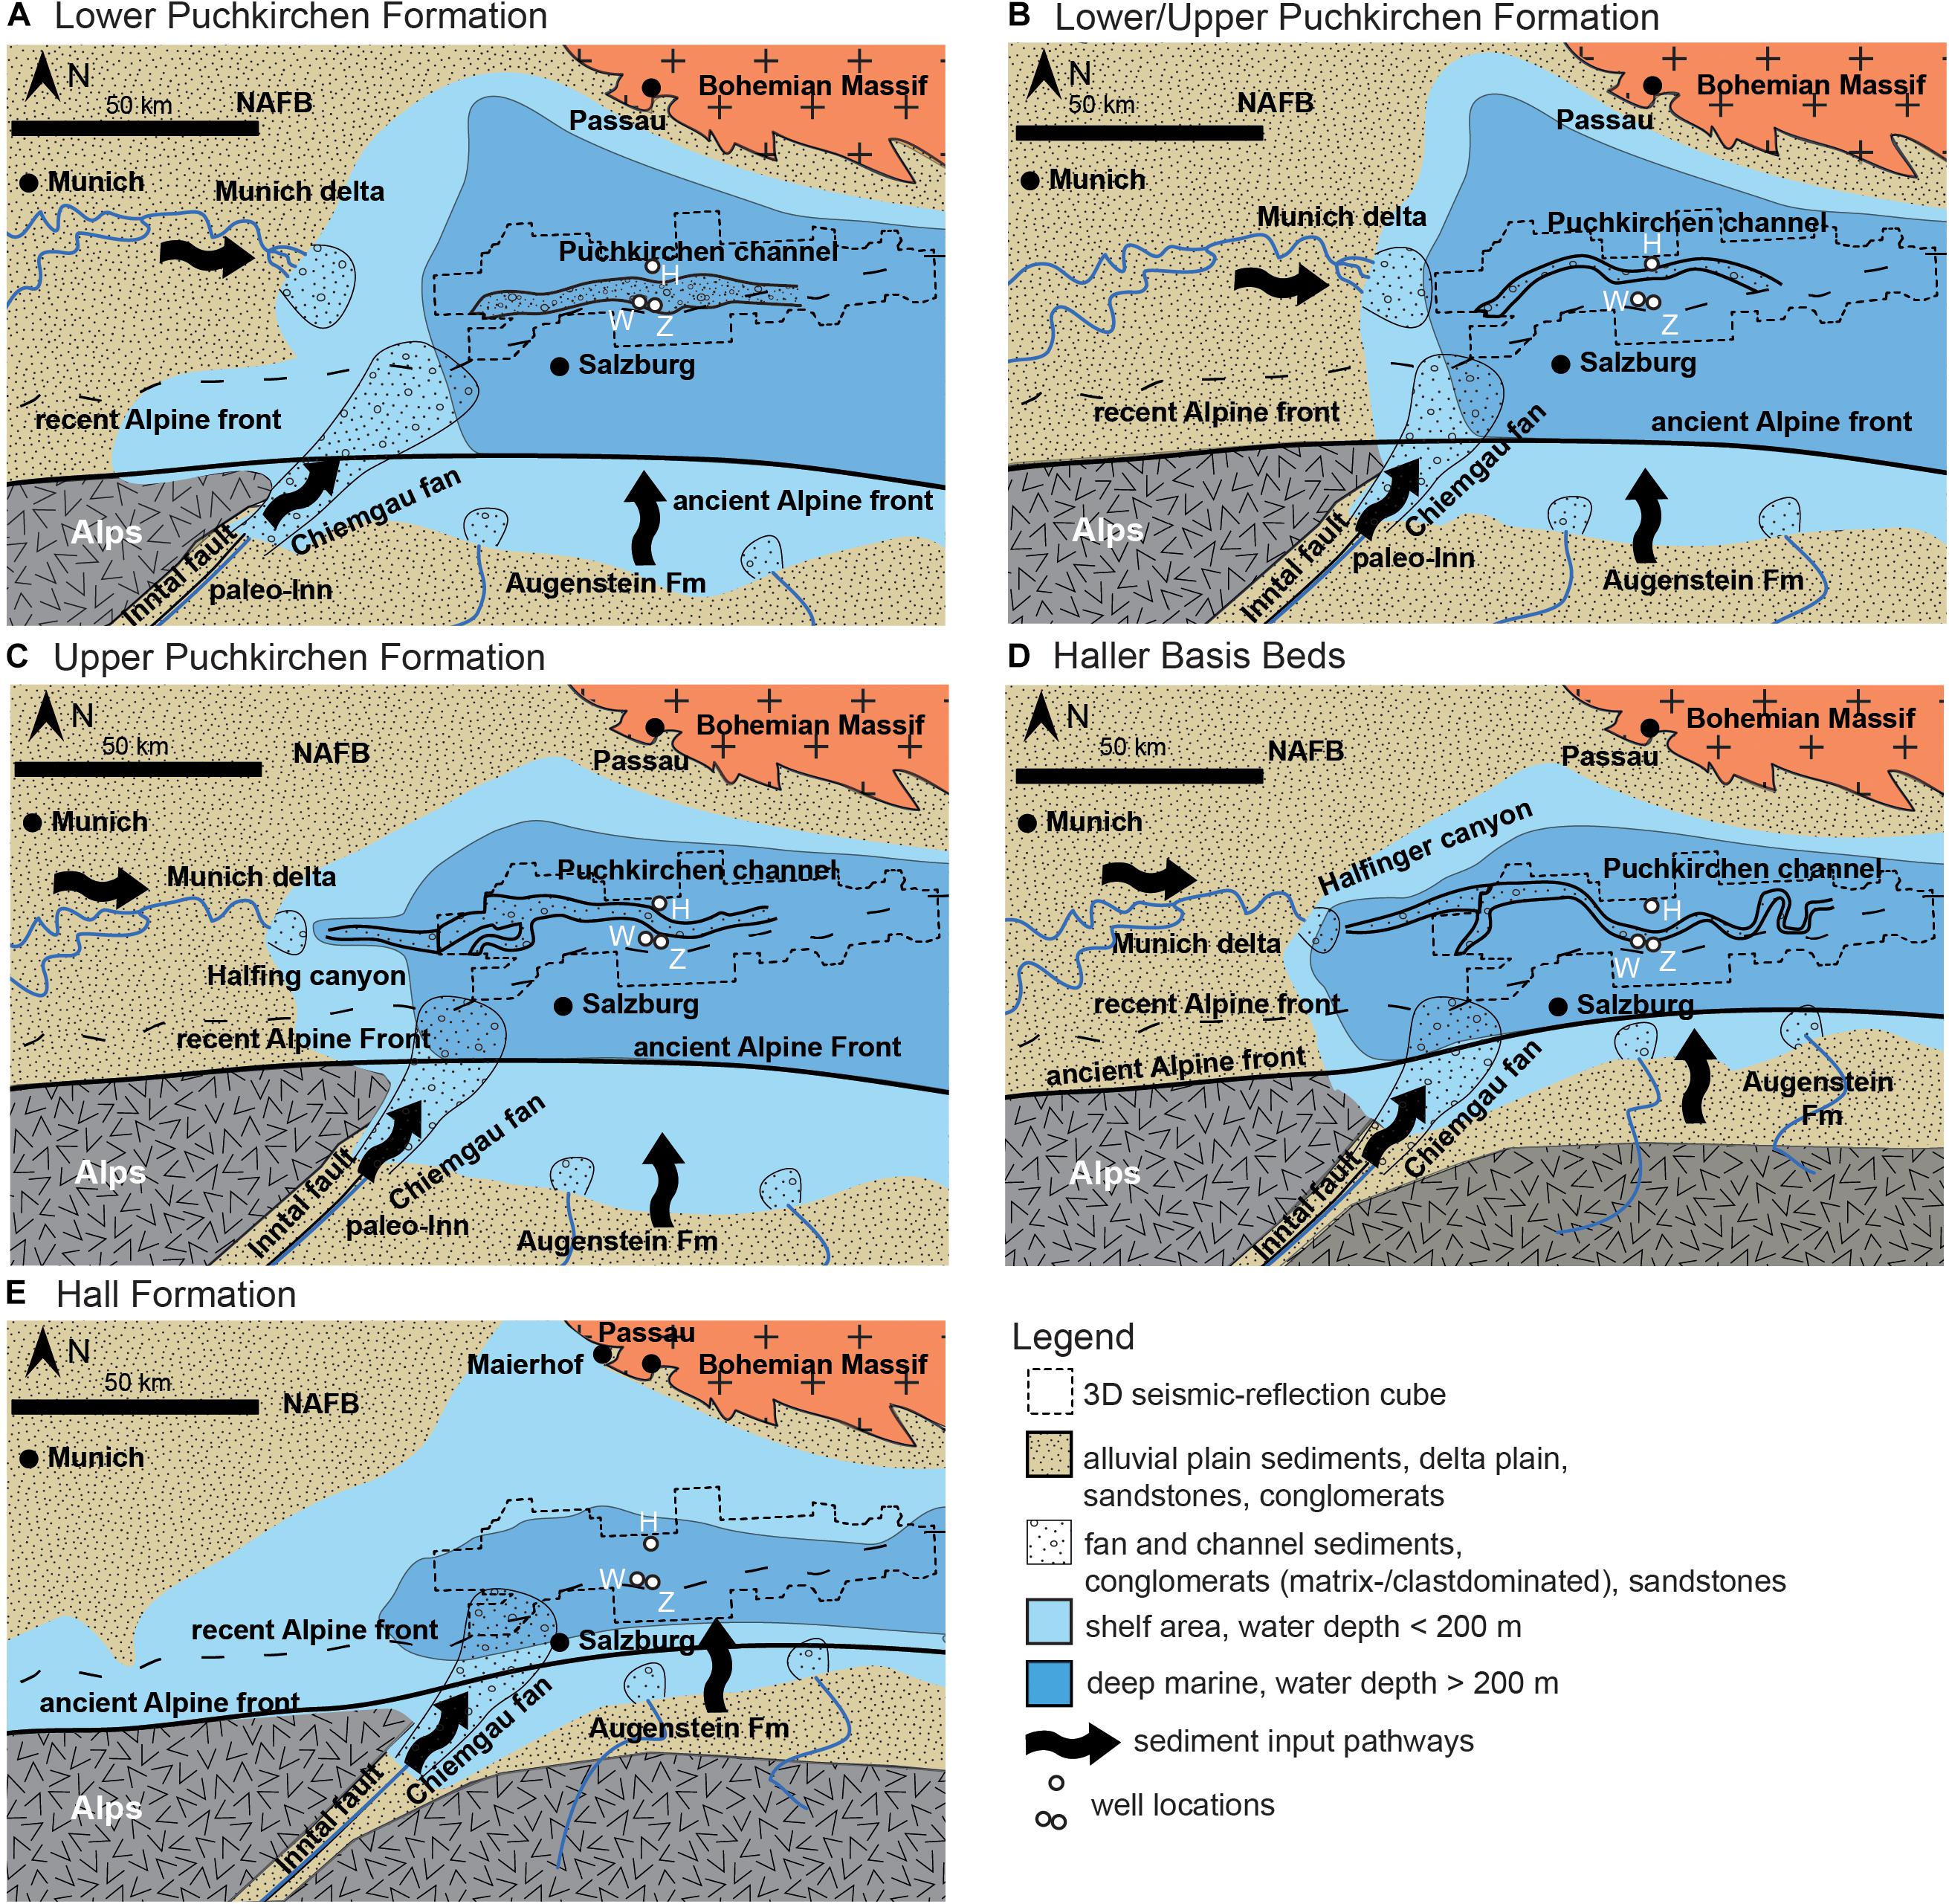
Figure 4. Paleogeographic reconstructions of the Upper Austrian and SE German NAFB during the late Oligocene through Early Miocene (A–E) and their main sediment input pathways. Channel geometries were mapped in the 3D seismic cube. Information compiled from [opetwcite]B67,B83[clotwcite]Reiser (1987); Wenger (1987), [opetwcite]B54,B85[clotwcite]Lemcke (1988); Zweigel (1998), Kuhlemann and Kempf (2002), and Grunert et al. (2013). During the deposition of the LPF (A) the channel shows a low sinuosity and is located at the southern basin margin. The Puchkirchen Trough was fed from the paleo-Inn, the Augenstein deposits, and the Munich delta from which clinoforms prograded into the basin, the shoreline moved to the east. At the L/UPF boundary (B) the shoreline reached its easternmost position, the channel started to meander and reached its northernmost position. In the UPF (C) the depositional system on the Bavarian Shelf changed, the Halfing canyon developed and was connected to the Puchkirchen channel. The shoreline was located further to the west compared to (B). During the formation of the BHU (D) a major sea-level fall occurred and the channel acquired its highest sinuosity; the Halfinger canyon was still active. In the HFM (E) the sedimentation system in the Molasse Basin changed completely due to reestablishment of marine conditions in the western NAFB (Upper Marine Molasse), channel sedimentation ended and clinoforms started to prograde into the basin from the south.
To relate changes in sediment fill to external or internal forcings, well-constrained stratigraphic control is essential. A long history of stratigraphic work in the Upper Austrian NAFB indicate Chattian to earliest Aquitanian age for the Lower and Upper Puchkirchen formations and a Burdigalian age for the Hall Formation (Küpper and Steininger, 1975; Papp, 1975; Rögl et al., 1979). However, recent publications suggest a younger, late Chattian to Burdigalian age (24.5 to 19.5 – 18.9 Ma) for the Puchkirchen Group on the northern basin slope (Grunert et al., 2013, 2015) in agreement with previous interpretations from surface outcrops of coeval lithostratigraphic units in Bavaria (Martini, 1981; Reiser, 1987; Wenger, 1987).
In this study, we re-evaluate and extend the stratigraphic concept introduced by Grunert et al. (2013, 2015) for the late Oligocene/early Miocene Upper Austrian NAFB by using benthic foraminifera and geochemistry (TOC, S, CaCO3) for the identification of lithostratigraphic boundaries, calcareous nannoplankton and stable carbon isotopy (δ13C) of bulk sediment for chronostratigraphic information. Drill cuttings from three wells were analyzed, one from the northern and two from the southern basin margin (Figure 1, Well H, W, Z). The new age constraints are then used to calculate spatially averaged SARs (t/m2/Ma) for discrete time intervals by using the 3D seismic-reflection cube and well data. We calculated sediment volumes as this reduces the dependence on timescales < 101 a (Sadler and Jerolmack, 2015) below the maximal resolution estimated to c. 100 ka based on the available bio- and chemostratigraphic constraints.
We hypothesize to detect the externally induced signals of four tectonic events in the Alps (for a detailed discussion of expected environmental signal see section 2.1): (1) the exhumation of the Lepontine Dome led to a doubling in SAR from 25 Ma onward; (2) the exhumation of the Tauern Window increased the SAR in early Miocene; (3) a reduction of SAR due to uplift in the foreland and decreasing elevation in the hinterland at the BHU; (4) the unroofing and erosion of the Augenstein Formation increase the SAR from 21 Ma onward. Our results shed new light on the development of the Upper Austrian NAFB during the Oligocene and Miocene and the forcings that controlled the sediment fill and the formation of two basin-wide unconformities.
Geological Overview and Stratigraphy
The NAFB is located on the northern border of the Alpine orogen in central Europe (Figure 1) and extends from Switzerland through Germany and into Austria for c. 1000 km in a west-east direction and up to 120 km in a north-south direction (Kuhlemann and Kempf, 2002). The development of the NAFB commenced in the upper Eocene due to flexure of the southern European continent. From 32–30 Ma to ∼6 Ma, proximal, conglomeratic sediments (the Molasse) were deposited in the basin (Sissingh, 1998). The sediments in the German and Swiss part of the basin are characterized by two shallowing-upward megacycles, which are further subdivided into the Lower Marine Molasse (32–28 Ma), the Lower Freshwater Molasse (28–20 Ma), the Upper Marine Molasse (20–16 Ma), and the Upper Freshwater Molasse (16–6 Ma) (Kuhlemann and Kempf, 2002).
The eastern part of the NAFB is located in Upper Austria (Figure 1) and hosted a deep-marine environment (1000 – 1500 m water depth, Rögl et al., 1979) in the Oligocene and early Miocene (Wagner, 1998). After a period of neritic environmental conditions in the Eggerding Formation [nannoplankton zone (NP) 23, Figure 3] the basin rapidly deepened (Sachsenhofer et al., 2010; Soliman, 2012) and deep-marine (water depth ∼1000 m) conditions are recorded in the overlying Zupfing Formation (ZFM) (Wagner, 1998). The ZFM contains the Rupelian/Chattian boundary (Figure 3) and is located in NP 24 (Wagner, 1998; Soliman, 2012). The benthic index foraminifera of the ZFM are Cancris bavaricus and Uvigerina moravia (Cicha et al., 1998).
During deposition of the ZFM and the overlying LPF, UPF, and basal Hall Formation (BHF), the basin was characterized by a gently sloping northern margin and a steep, tectonically active southern margin (Figures 1–3). Depositional processes in the basin were largely controlled by a 3–6 km wide, deep-marine, gravity-flow dominated channel system flowing parallel to the Alpine front from west to east for >100 km (De Ruig and Hubbard, 2006). The submarine channel system is characterized by intercalated sandstones (structured and structureless), conglomerates (clast-supported and matrix-supported) and silty marls which are interpreted as the deposits of turbidity currents (high to low density), debris flows, and hemipelagic suspension settling (De Ruig and Hubbard, 2006; Hubbard et al., 2009; Bernhardt et al., 2012). To the north, the channel is flanked by wide overbank deposits (≤15 km, Figure 2), which are formed by hemipelagic silty marls and subordinate turbiditic sandstones resulting from northward-directed overspill of sediment by gravity flows in the channel (De Ruig and Hubbard, 2006; Hubbard et al., 2009; Bernhardt et al., 2012; Masalimova et al., 2015). From the southern basin margin, submarine turbidite fans prograded northward into the basin (Covault et al., 2009) and large (≤30 km3) mass-wasting events were shed into the channel (Kremer et al., 2018).
The lower boundary of the LPF is defined by the occurrence of the agglutinated foraminifera Psammosiphonella cylindrica (formerly “Rhabdammina linearis“). The agglutinated species Reticulophragmium acutidorsatum, R. rotundidorsatum, and R. aff. amplectens are typical. Of the calcareous foraminiferal species, Uvigerina steyri is common (Cicha et al., 1998). The lower boundary of the UPF is defined by the first occurrence (FO) of Gaudryinopsis austriacus (sometimes referred to as “Bigenerina sp. 7”) and the disappearance of Psammosiphonella cylindrica (Cicha et al., 1998). The lower boundary of the HFM is defined by the FO of Uvigerina posthantkeni (Cicha et al., 1998).
Channel sedimentation terminated contemporaneously with a rise in sea level during the deposition of the BHF (Figure 3), a deep-marine environment dominated by hemipelagic sediments (Figure 2) was established in the Hall Formation (HFM) (Zweigel, 1998; Grunert et al., 2013). Clinoforms started to prograde from the southern margin during the middle HFM and filled the basin. The overlying mid-Burdigalian Innviertel Group was deposited in a tide-influenced shelf sea (<200 m water depth) (Grunert et al., 2012, 2013). The base of the Innviertel Group (Figure 3) is marked by the FO of Amphicoryna ottnangensis (Cicha et al., 1998).
Two large unconformities have been described in the basin, the Northern Slope Unconformity (NSU) and the Base Hall Unconformity (BHU, from bottom to top, Figure 2) (De Ruig and Hubbard, 2006; Masalimova et al., 2015). The NSU is located on the northern basin slope and is present for at least 20 km in N-S direction and 100 km in W-E direction throughout the entire 3D seismic-reflection cube. Puchkirchen Group strata lap onto the unconformity. Masalimova et al. (2015) interpreted the unconformity as an over-steepened slope, characterized by sediment bypass. The age and duration of the NSU and the process that led to the oversteepening of the slope are currently unknown (Masalimova et al., 2015).
The BHU (Figure 2) separates the UPF from the HFM and forms a basin-wide, deep-marine unconformity which was also described on the Bavarian Shelf to the east (Zweigel, 1998; De Ruig and Hubbard, 2006). In the 3D seismic-reflection data, the unconformity is characterized within the submarine channel system by truncated reflectors and on both margins by two high-impedance reflectors (Figure 2). Wenger (1987), Jin et al. (1995), and Zweigel (1998) pointed to a sea-level fall at the UPF/HFM boundary (Figure 4). Grunert et al. (2015) suggest an age of 19.5 – 18.9 Ma for the formation of the BHU. Additionally, Zweigel (1998) and Kuhlemann (2000) proposed a decrease in the subsidence and sedimentation rates at that time.
The so-called Puchkirchen Trough was fed by three different sources (Kuhlemann and Kempf, 2002). (1) A large, eastward prograding delta close to the present position of Munich received sediment from the Central Alps (Kuhlemann and Kempf, 2002; Sharman et al., 2018) (Figure 4). (2) The paleo-Inn Fan fed by intra-Alpine material served as a second source for detritus to the Puchkirchen Trough (Kuhlemann and Kempf, 2002). (3) A series of rivers were running from the central Eastern Alps through the Augenstein deposits into the NAFB (Frisch et al., 2001; Covault et al., 2009). With the change of the paleo-drainage system at the beginning of the UMM, the NAFB was flooded (Figure 4), the Puchkirchen Trough was cut off from the Central Alpine sediment supply (Kuhlemann and Kempf, 2002; Grunert et al., 2013).
Expected Tectonic Forcings
We hypothesize to detect the externally induced signals of four tectonic events in the results of the SARs calculation:
(1) The exhumation of the Lepontine Dome in the Central Alps (Figure 1C) – starting ∼32 Ma, accelerating at 25.5 Ma (Schlunegger and Castelltort, 2016) – has led to a twofold increase of SARs on the proximal megafans in the Swiss NAFB (250–450 m/Ma to 400–600 m/Ma, compacted rates) at 25.5 Ma (Schlunegger and Norton, 2015). Zweigel (1998) also reported an increase of SAR on the Bavarian Shelf (Figure 4) from 25 Ma onward. We expect to see a similar twofold increase in the SARs of the Upper Austrian NAFB.
(2) Between 23 and 21 Ma, the rapid exhumation of the Tauern Window (Figure 1C) began in the Eastern Alps (Scharf et al., 2013; Favaro et al., 2015). In the proximal Chiemgau Fan (Figure 4), the Chattian deposits reach a (compacted) thickness of 1200–1500 m, whereas the Aquitanian contains 1250 m thick deposits (Ganss, 1977). SARs increase from 237–296 m/Ma in Chattian times to 483 m/Ma in Aquitanian times. Due to the short lag time (2–4 Ma) of apatite fission track ages in the Aquitanian deposits (deposition age: 21 Ma) (Kuhlemann et al., 2006), the increase in SARs is interpreted to be related to the exhumation of the Tauern Window. Therefore, we expect to find a similar ∼65 – 100% increase in our SAR in Aquitanian times.
(3) Zweigel (1998) explains her findings in the German NAFB (low SARs, angular unconformity, uplift in the northern part of the basin, sea-level decrease, reduction in deposited grain size) during the establishment of the BHU with the model of a visco-elastic relaxation of the European Plate. A visco-elastic behaving lithosphere loses strength with time depending on temperature, rheology, and initial stress of the lithospheric plate. Even without an additional load, the elevation in the hinterland can be reduced and the forebulge can migrate to the orogenic front (Beaumont, 1981), leading to a reduction in grain size and sediment flux from the hinterland, whereas the foreland is uplifted causing the angular unconformity and the decrease in sea level (Zweigel, 1998). An alternative explanation for Zweigel’s (1998) findings might be the proposed slab-tearing event underneath the Eastern Alps at 20–25 Ma that may have led to a retreat and steepening of the European slab (Handy et al., 2015), causing a decrease in elevation in the orogen. The proposed slab-polarity switch underneath the Eastern Alps (Lippitsch et al., 2003) is still controversially discussed. However, the published literature does not conclude which of those models is more realistic. We hypothesize to find a reduction in SARs and redeposition of shelf strata.
(4) The unroofing and redeposition of the Augenstein Formation (Figure 4) into the Puchkirchen Trough, caused by the beginning uplift of the underlying but sealed Northern Calcareous Alps, started ∼21 Ma (Frisch et al., 2001). These fluvial sands and gravels with an estimated thickness of 1.8–2.2 km are today only persevered as relicts, hampering a precise evaluation of the expected material that might have been relocated (Frisch et al., 2001). However, we expect to detect an increase in the SAR with the beginning of the unroofing and the redeposition of the Augenstein Formation into the Puchkirchen Trough.
Materials and Methods
Samples for bio- and chemostratigraphy were collected from three drill sites (sampling interval 10–40 m), one from the northern margin (Well H; Figures 1, 5) and two from the southern margin of the basin (Well W and Well Z, Figures 6, 7). In Well W, a ∼800 m thick mass-wasting deposit shed from the south was excluded from sampling (Figure 6). All named depth (m) are measured depth and not corrected for deflection of the wells.
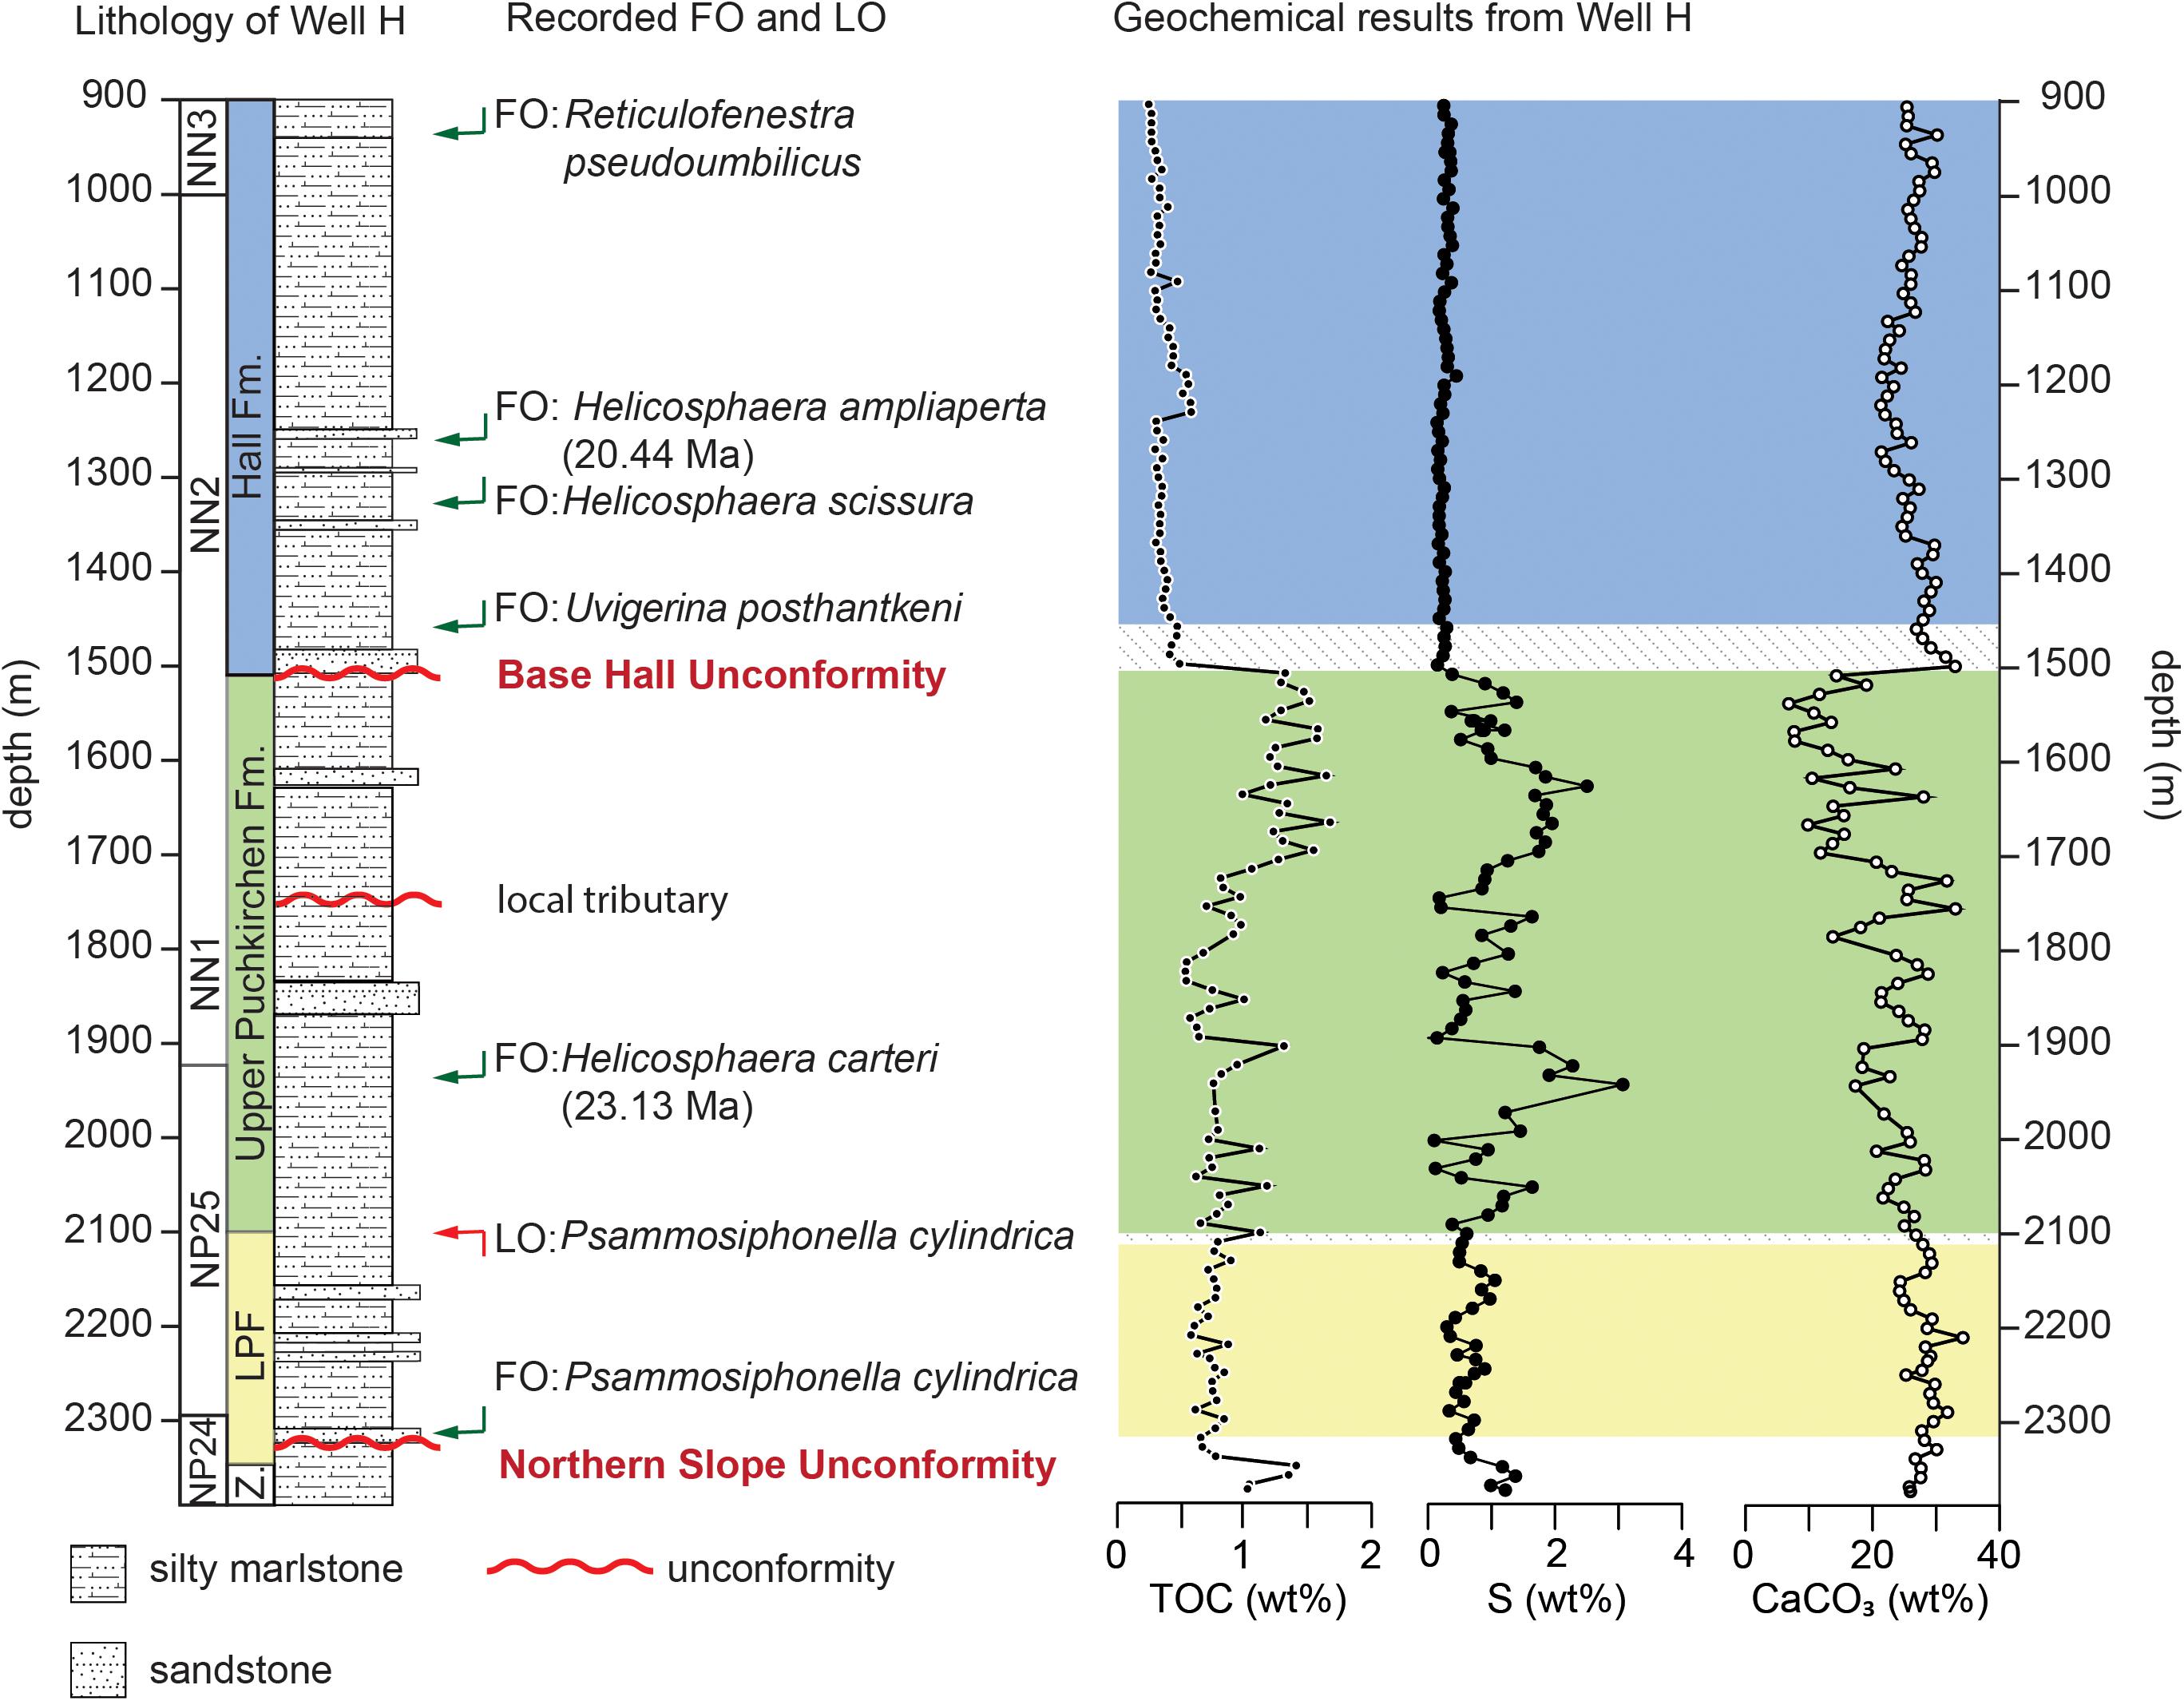
Figure 5. Simplified lithological section of Well H (see Figure 1 for location) with FO and last occurrence (LO) of index taxa (nannofossils and benthic foraminifera). Total organic carbon (TOC) and sulfur (S) increase from moderate levels with low variance in the LPF (from 2100 m) to very high levels in the upper half of the UPF showing great variance, indicating highly unstable ecologic conditions. Above the BHU, TOC, and S values drop to very low and stable levels, while CaCO3 dramatically increases. Uncertainties are due to sampling resolution and preservation. See text for discussion.
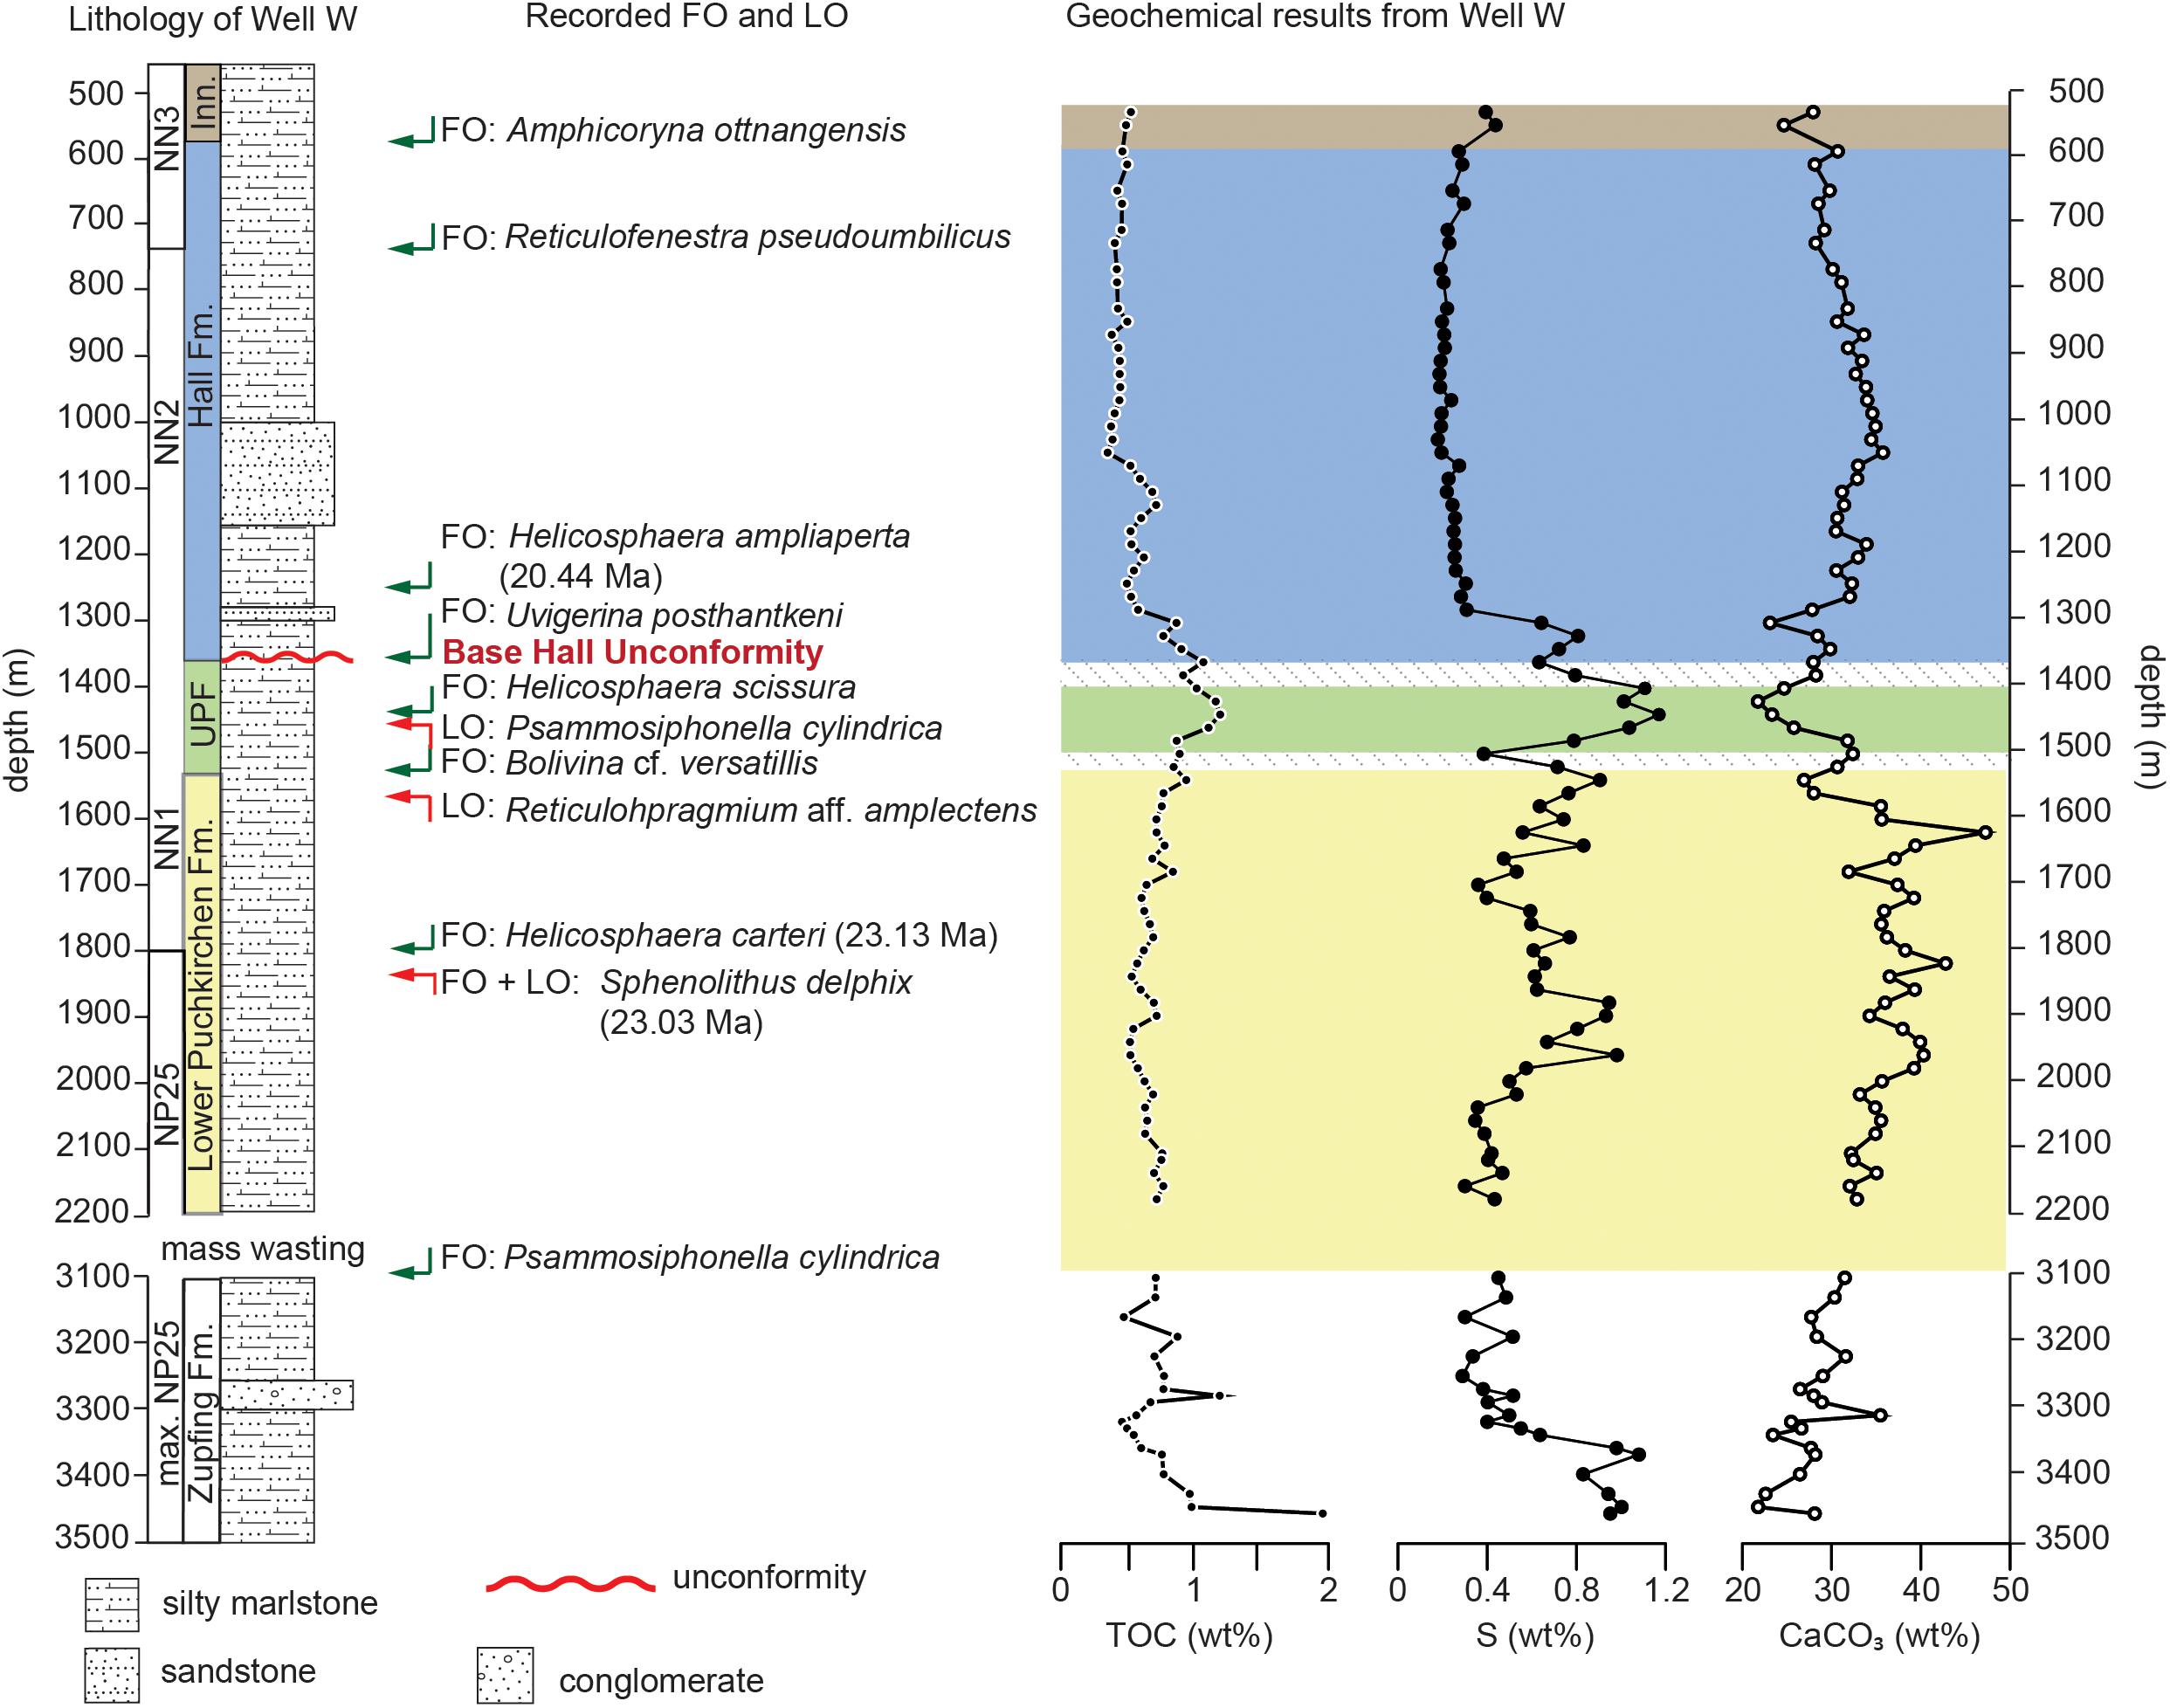
Figure 6. Simplified lithological section of Well W (for position see Figure 1) with FO and LO of index taxa (nannofossils and benthic foraminifera), above 3200 m TOC- and S-values decrease compared to the underlying section and TOC-values show low variance, while S-values fluctuate heavily, until 1600m, the CaCO3-content steadily rises. The UPF shows higher S and slightly higher TOC and greatly decreased CaCO3-values. In the HFM, after 1300 m, TOC- and S-values drop to very low and stable levels, while CaCO3 increases. Uncertainties are due to sampling resolution and preservation. See text for discussion.
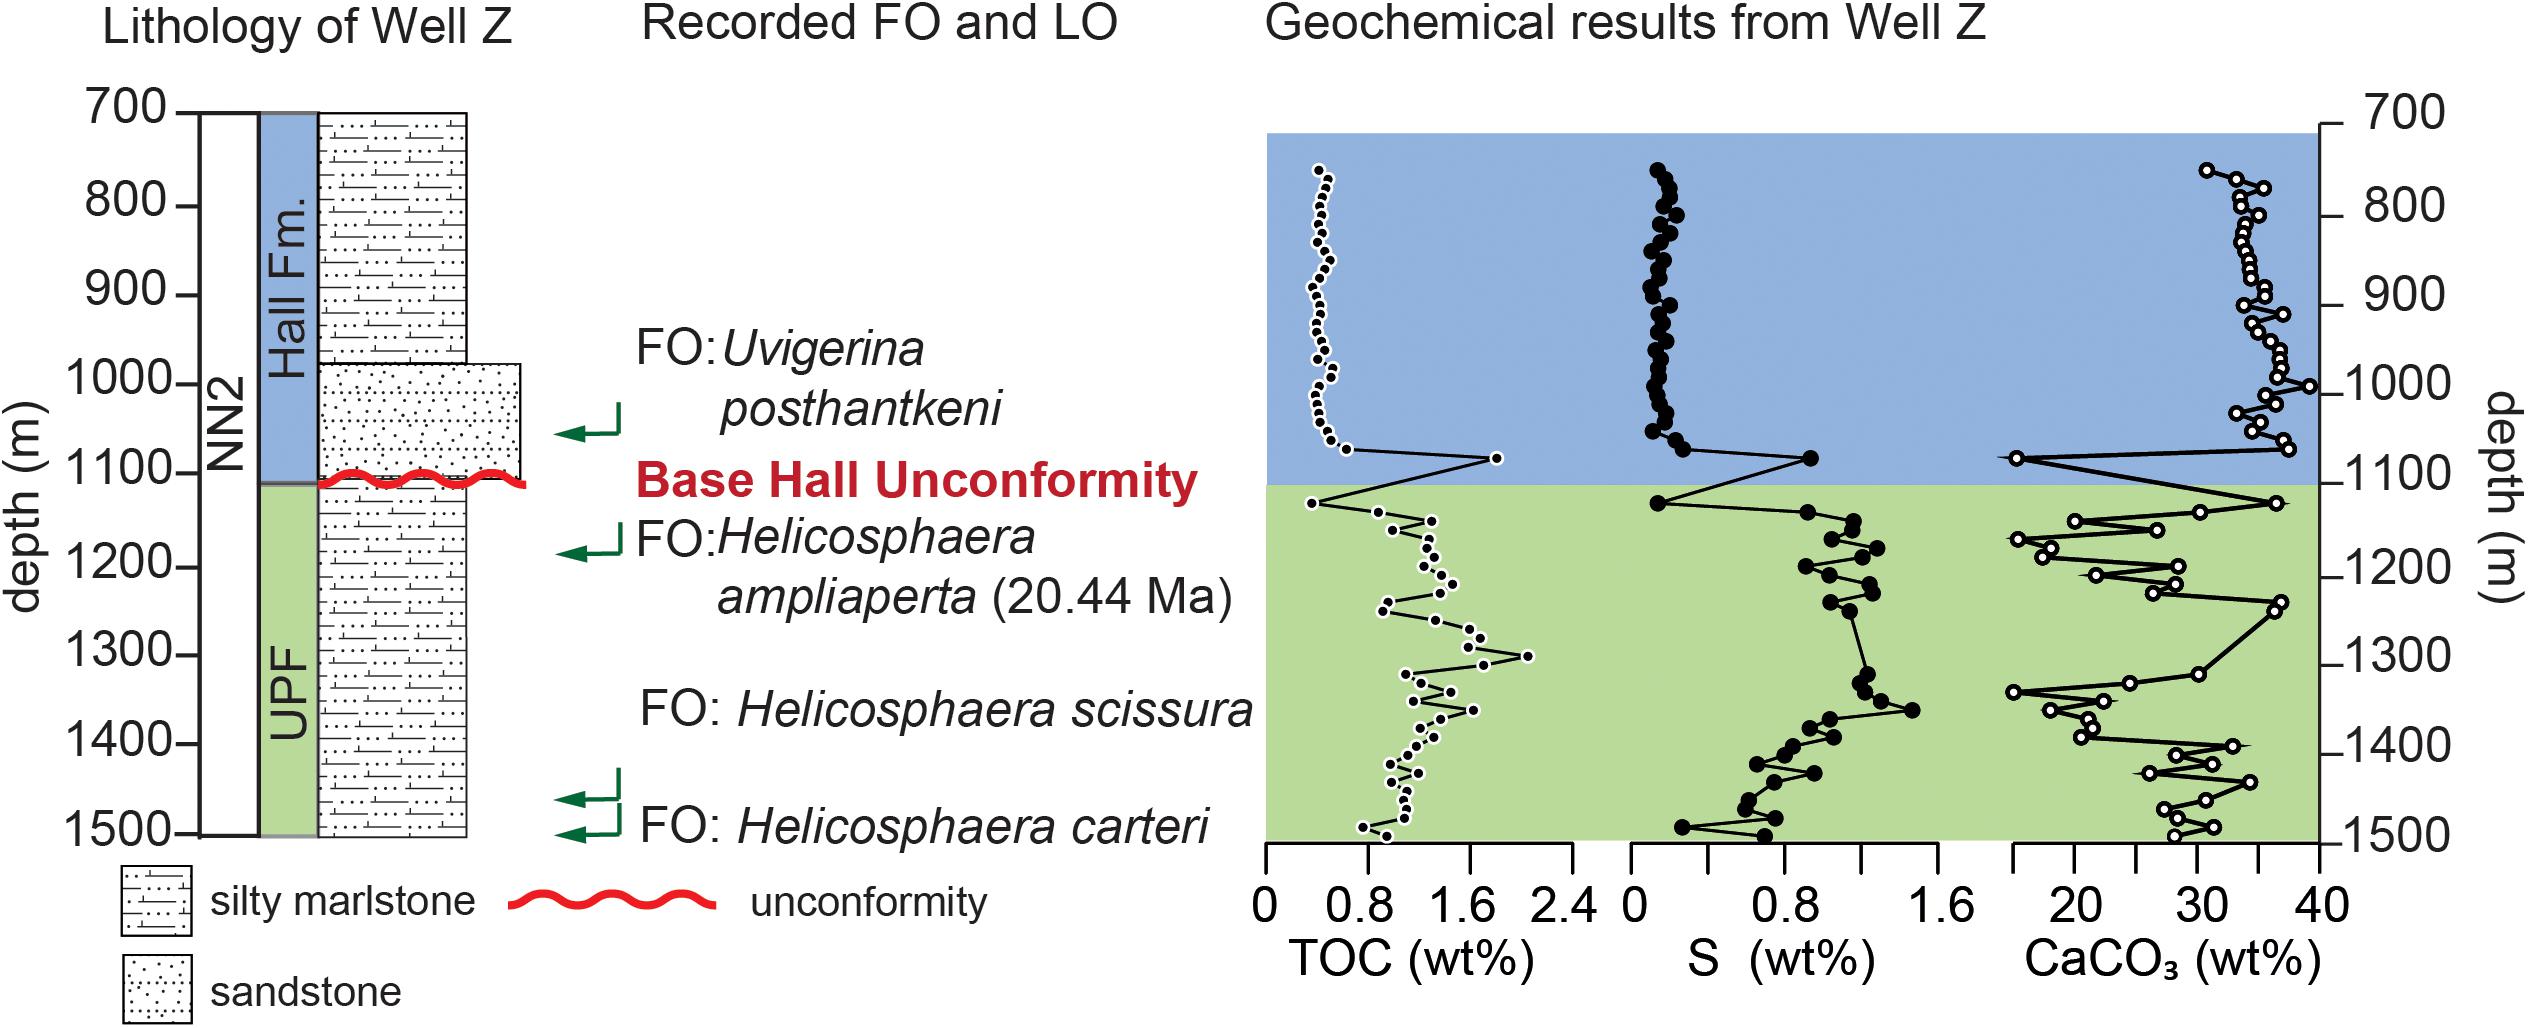
Figure 7. Simplified lithological section of Well Z (for position see Figure 1) with FO and LO of index taxa [nannofossils and benthic foraminifera (Ćorić and Spezzaferri, 2009)], TOC- and S-values are high in the UPF and CaCO3-content is highly variable (A1-horizon after Gross et al., 2018). At 1125 m TOC- and S-contents show a decrease, increase again and finally decrease to low and stable levels until the end of the section. See text for discussion.
Biostratigraphy
For the analysis of foraminiferal assemblages, the drill-cuttings (each representing about 2 m of sediment thickness) were wet-sieved (20 – 100 g per sample) under addition of diluted hydrogen peroxide (30%) through mesh-sizes of 250, 125, and 63 μm. The fraction > 250 μm was barren of foraminifera, all analyses were therefore conducted on the 125 to 250 μm size fraction. Taxonomic identification relied on the Atlas of Oligocene – Miocene foraminifera of the Central Paratethys (Cicha et al., 1998). For Well Z, already existing biostratigraphic constraints from a RAG internal report were used (Ćorić and Spezzaferri, 2009).
The preparation of smear slides followed the methodology of Bown (1998). Sediment was suspended in NH3-buffered ultrapure milli-Q water and fully disaggregated by ultrasonic treatment. One drop of the suspension was placed on coverslips (24 × 30 mm) and slowly dried at a temperature of ∼ 50°C. The slides were mounted using Norland No. 61® optical adhesive and investigated using an Olympus BX53 light microscope under parallel and crossed nicols at a 1000X magnification. Coccoliths were identified to species level if possible, following the taxonomic concepts of Bown (1998) and Galović and Young (2012), supplemented by the Nannotax 3 website (Young et al., 2014) and the handbook of calcareous nannofossils (Aubry, 1984, 1988, 1989, 1999, 2013). Calcareous nannoplankton zonation used in this study is based on the standard zonation of Martini (1971, recalibrated in Gradstein et al., 2012) as well as the revised zonal scheme of Backman et al. (2012) and Agnini et al. (2014).
Chemostratigraphy
From Well H, W, and Z, 151, 103, and 71 samples, respectively, were chosen for analyses of stable carbon isotopes (δ13Ccarb), total organic carbon content (TOC), sulfur content (S), and carbonate content. δ13Ccarb measurements were performed at the GeoZentrum Nordbayern, University of Nürnberg-Erlangen, using a Gasbench II connected to a ThermoFisher Delta V Plus mass spectrometer. Samples were dried, homogenized with a mortar and the carbonate powders reacted with 100% phosphoric acid at 70°C. Values are reported in the conventional δ13Ccarb notation in ‰ relative to Vienna Pee Dee Belemnite standard (VPDB). Reproducibility and accuracy were monitored by replicate analysis of laboratory standards calibrated by assigning δ13C values of +1.95‰ to NBS19 and −47.3‰ to IAEA-CO9. Reproducibility for δ13Ccarb was ±0.05‰.
The measurements for TOC, S and carbonate content were performed at the Institute for Earth Science, University of Graz, using a Leco CS-300 device. The dried, homogenized and mortared samples were analyzed for their total carbon (TC) and TOC content, total inorganic carbon (TIC) was calculated by subtracting TOC from TC. Carbonate content was calculated from TIC as calcite equivalent percentages (CaCO3 = 8.34∗TIC; Grunert et al., 2015).
Seismic Interpretation and Sediment-Accumulation Rates
Sediment-mass calculations were performed by using Petrel E&P software platform [(∗) = Mark of Schlumberger], a cell-based modeling software, by integrating the 3D reflection-seismic data and density well logs. Two models were built (Figure 1B), one including the channel-belt strata (in the following referred to as “channel model”) and one including the overbank deposits (“overbanks model”). The term geobody is used here to describe the separation of the models into different 3-dimensional segments for which masses were calculated (Figure 8). The SARs are spatially averaged over large areas (variations between 31 and 255 km2, Table 1) and long-time intervals (0.4 to 3.9 Ma) and, hence, should be time-scale invariant according to Sadler and Jerolmack (2015). The local erosional processes which may influence small scale SAR calculations are averaged out with increasing temporal and spatially scale (Sadler and Jerolmack, 2015).
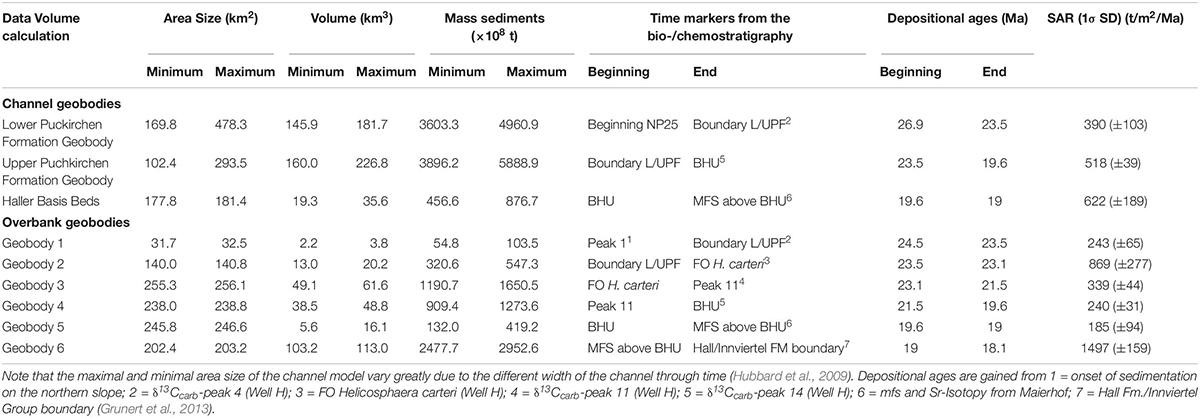
Table 1. Results from the channel and overbank model of the volume and SAR calculation.
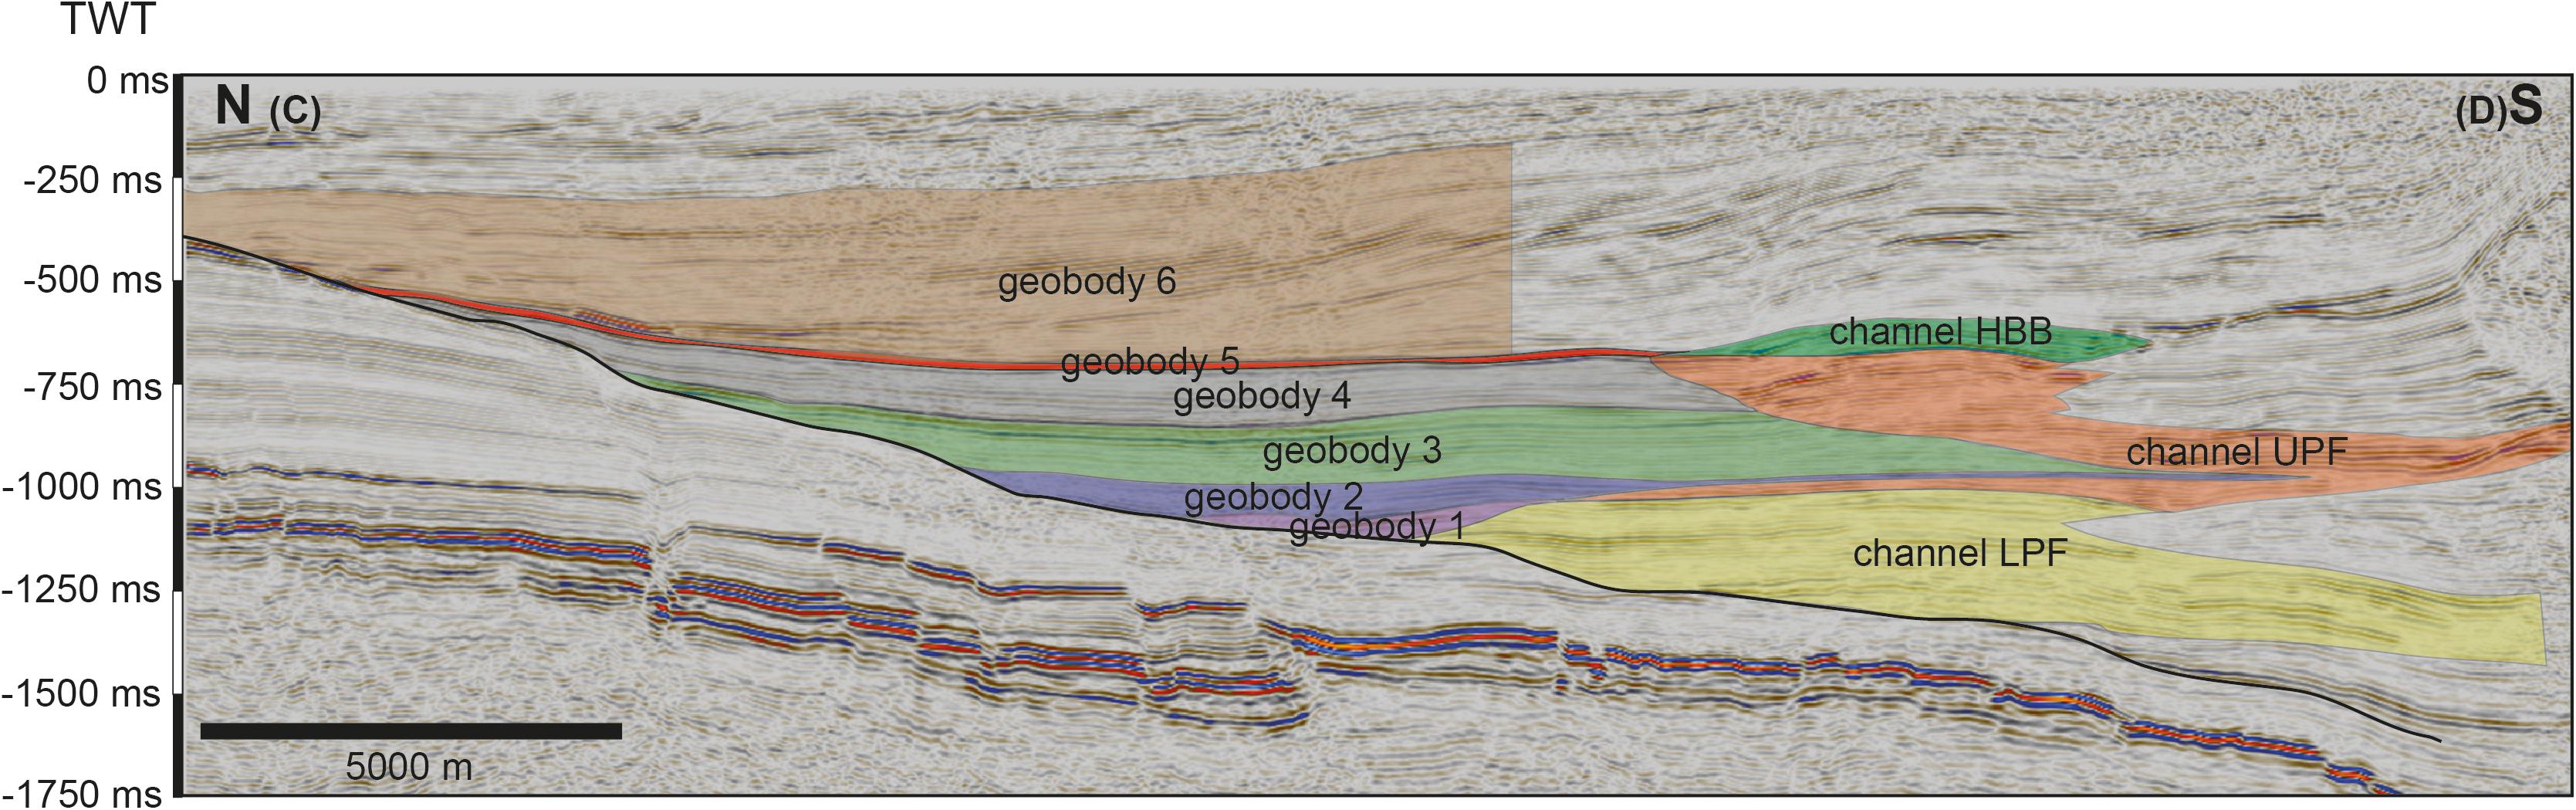
Figure 8. Cross section (N – S) through the Upper Austrian Molasse Basin (for position see Figure 1) showing the extent of the geobodies in the channel and overbank model. Note the varying base area of the geobodies.
The seismic-reflection data have a dominant frequency of ∼28 Hz and the average velocity in the area of interest is c. 3700 m/s, which results in a theoretical vertical resolution of ∼33 m (De Ruig and Hubbard, 2006; Masalimova et al., 2015). The extent of the channel-belt strata and overbank deposits was mapped out based on 3-dimensional, time-migrated seismic reflectors. The models were built by using the ‘Structural Modeling’ toolbox in Petrel (∗). The toolbox generates a grid, based on input data (geometry, upper, and lower boundary, cell size) with a certain number of cells. Cell size was established as 10 m∗10 m∗5.5 milliseconds. Mapped seismic-reflection horizons were merged into geobodies and were loaded via the Geometrical Modeling tool into the model (Figure 8). This tool allows the user to generate properties for cells in the model. The model was converted into elevation depth (m) by using an in-house velocity model provided by RAG, which changed the individual z-axis of each cell (variation between 7 and 15 m).
Density (ρ) and lithology well data of 52 and 16 wells for the channel and overbank model, respectively, were downsampled into the depth-converted models. The downsampling for the lithological logs was accomplished by using the “most of” average method. Each model cell is assigned to a single lithology that is given by the most abundant lithology in the well section within the model cell, e.g., a 40% claystone and 60% sandstone cell will be assigned as a sandstone cell. Based on these modeled cells along the well paths, Petrel’s (∗) ‘Facies Modeling’ process assigns lithologies to the cells in between the individual wells using the horizontal and vertical trends in the data to guide the interpolation process.
The downsampling of the density data was performed by using the arithmetic mean of the well data for each individual cell intersected by a well. Data was then interpolated between the individual wells of the model by using Petrel’s (∗) ‘Petrophysical Modeling’ tool. The interpolation of the density data between the wells is based on the results of the facies modeling, so that the modeled density data reflects the modeled trends from the lithological interpolation.
Masses are calculated by using m (kg)=V (m3)∗ ρ () for each individual cell and then summed up for an entire geobody. Calculations were run for three geobodies in the channel model and six geobodies within the overbank model (Table 1 and Figure 8). Geobody boundaries were selected based on good temporal control on base and top. For each geobody, a calculation with a minimum (−5%), average and maximum (+5%) ρ was run (Table 1). The mass of each geobody was calculated twice, first within the mapped boundaries and a second time by adding a 35 m segment on every boundary to account for erroneous seismic-reflection interpretation and the resolution of the seismic-reflection data. The calculated masses were divided by the base area [A (m2)] of the geobody (Table 1) resulting in the areal density N().
Calculated SARs (QS) are based on the presented bio- and chemostratigraphic results (tn, tm,…). For the geobodies in the channel model, the temporal information from the overbank geobodies was assumed (Table 1), except for the beginning of the LPF (see section Revisiting the Stratigraphic Concept for the Upper Austrian Molasse). The calculated areal densities were divided by the time interval following QS (kg/(m2 ∗Ma))= . The results represent the arithmetical mean rates and standard deviation (1σ; SD) from the six calculated rates of every geobody. Every geobody was calculated also in age brackets t ± 0.1 Ma based on the highest temporal resolution of our bio- and chemostratigraphic results. We note that this is an optimist boundary condition for temporal uncertainty quantification, however, the influence of spatial uncertainties on uncertainty dimensions exceeds the temporal ones (Table 1). To further constrain the sediment transport direction in the upper HFM clinoforms were mapped in the 3D seismic data (see Supplementary Figure S1).
Results
Foraminifera and Calcareous Nannoplankton
The abundance of benthic foraminifera is generally <50 specimen per sample and several barren intervals are present (see Supplementary Table S1 for a complete list of species and Supplementary Figure S2 for representative specimens). Especially the index species are very rare and often poorly preserved. Calcareous nannoplankton abundance in the samples ranges from common to very rare, with index species often being very rare (see Supplementary Table S2 and Supplementary Figure S3 for complete list and representative specimens). Their preservation ranges from good to poor. The scarcity and preservation state impose a challenge for taxonomic identification and biostratigraphic interpretation. We had to resort to secondary marker species, co-occurrences and the interpretation of the assemblage as a whole.
Well H
The FO and LO of Psammosiphonella cylindrica indicates the Lower Puchkirchen Formation between 2325 and 2100 m (Figure 5). The fauna in the lower part of the LPF (2325–2190 m) consists of Lenticulina sp., Praeglobobulimina sp., Virgulinella sp., Psammosiphonella cylindrica, Heterolepa sp., Bathysiphon sp., Bulimina sp., Cibicides sp., and Asterigerinata sp. following a widespread absence of foraminifera for several tens of meters, Praeglobobulimina sp. re-appears as first species at 2150 m and soon dominates the assemblages, outnumbering the few Bathysiphon sp. and Bolivina sp. This is followed above by a second interval of widespread absence of foraminifera for 30 m. In the UPF (from 2100 m), some Bathysiphon specimens were found while above 1960 m Bulimina sp. and Lenticulina sp. occur.
Above 1960 up to 1450 m benthic foraminifera are generally scarce (Supplementary Table S1). Only between 1540 to 1510 m depth, very few specimens of Bulimina sp., Lenticulina sp. and Cibicidoides sp. occur. Uvigerina posthantkeni and some Lenticulina specimens were found just above this interval at 1455 m marking the base of the Hall Formation. All samples above 1455 m are barren of benthic foraminifera.
The FO of Helicosphaera carteri was found at 1920 m (Figure 5). The FO of Helicosphaera ampliaperta at 1260 m, shows specimen already at full size (>10 μm; Supplementary Figure S3). The FO of R. pseudoumbilicus > 7 μm is recorded at 910 m. Samples barren of nannofossils are recorded for 2165 m, intervals from 2110 to 2085 m, 1900 to 1800 m, and sample 1540 m (Supplementary Table S2).
Well W
The samples from 3470 to 3100 m are barren, with only a few, single specimens of no stratigraphic relevance (Figure 6). The FO of Psammosiphonella cylindrica at 3100 m marks the beginning of the LPF. The LO of Reticulophragmium aff. amplectens (1560 m) and the FO of Bolivina versatilis (1520 m) indicate the boundary of the Upper and Lower Puchkirchen Formation between 1560 and 1520 m. The FOs of Uvigerina posthantkeni and Fontbotia wuellerstorfi (1360 m) mark the onset of the Hall Formation. The base of the Innviertel Group is marked by the FO of Amphicoryna ottnangensis at 580 m (Figure 6).
From 3230 to 3100 m, Bulimina sp., Heterolepa sp., few Praeglobobulimina sp., and Valvulineria sp. were found. Valvulineria sp. becomes increasingly rare above 2200 m and is replaced by Praeglobobulimina sp., becoming very common especially from 2200 to 2152 m. In the same interval Cibicides sp. becomes a relevant constituent of the assemblage. From 1800 m upward, the samples are functionally barren up to 1600 m. With the onset of the Upper Puchkirchen Formation at 1520 m, a new faunal assemblage is established consisting of Bolivina sp., Lenticulina sp., Heterolepa sp., Bulimina sp., and Asterigerinata sp. All samples from the 900 to 760 m interval and from 520 to 420 m are barren (Supplementary Table S1).
The FOs of the calcareous nannofossil taxa Helicosphaera carteri and Sphenolithus delphix occur at 1800 m (Figure 6). The crossover in the dominance of Helicosphaera euphratis and Helicosphaera carteri was identified at 1400 m, shortly above the FO of Helicosphaera scissura at 1424 m. At 1260 m also the FO of already comparatively large (>10 μm) Helicosphaera ampliaperta was recorded. Reticulofenestra pseudoumbilicus first occurs at 760 m. The interval of 1440 to 1520 m, 1220 to 1240 m, 820 to 1140 m and the sample from 400 m are devoid of nannofossils (Supplementary Table S2).
TOC, S, and Carbonate Content
Well H
In Well H (Supplementary Table S3), the lowermost samples (2385 – 2360 m) show high TOC [Average (A) = 1.2 wt%, standard deviation (σ) = 0.2 wt%] and S [A = 1.2 wt%, σ = 0.1 wt%] values that rapidly decrease at 2350 m (A = 0.8 wt% TOC and 0.6 wt% S; Figure 5). These TOC contents are stable with small variations until 2100 m (S σ = 0.2 wt%; TOC σ = 0.1 wt%). The CaCO3 content remains stable from 2385 until 2100 m with an average of 28 wt% (σ = 2 wt%). From 2100 m until 1510 m, CaCO3 content shows higher variations (σ = 7 wt%, A = 20 wt%) and TOC (A = 1.0 wt%, σ = 0.3 wt%) and S (A = 1.1 wt%, σ = 0.6 wt%) contents are high compared to the underlying interval. Especially, from 1700 m until 1510 m, the S content and TOC (Figure 5) are high (>1 wt%, σ < 0.5 wt%) and the CaCO3 content decreases (<20 wt%, σ = 6 wt%). At 1500 m, the TOC and S content both decrease and remain stable until the top of the section with small variations (TOC A = 0.4 wt%, σ = 0.1 wt%; S A = 0.3 wt%, σ = 0.1 wt%), whereas the CaCO3 content increases to values around 25 wt% (σ = 3 wt%).
Well W
The variations of the LECO data in Well W (Supplementary Table S3) are similar to the variations in Well H. The deepest samples (3460 – 3370 m) show high TOC (A = 1.1 wt%, σ = 0.4 wt%) and S contents (A = 1.0 wt%, σ = 0.8 wt%) but low carbonate contents (A = 25 wt%, σ = 3 wt%) (Figure 6). From 3360 m upward until 1560 m, the TOC shows only minor variations (σ = 0.1 wt%) around an average content of 0.7 wt%. The S content (A = 0.6 wt%) is more variable (σ = 0.2 wt%) in this section and the CaCO3 content is high compared to the underlying section (A = 35 wt%, σ = 4 wt%). From 1540 to 1380 m, the TOC (A = 1.0 wt%, σ = 0.1) and S (A = 0.9 wt%, σ = 0.3 wt%) values are increased, whereas the carbonate content is decreased (A = 27 wt%, σ = 4 wt%). At 1380 m, a decrease in the S content (from 1.1 to 0.3 wt%) and TOC (from 1.0 to 0.6 wt%) starts that lasts until 1280 m, in the same interval the CaCO3 content increases (from 25 to 32 wt%; Figure 6). After this decrease, TOC (A = 0.5 wt%, σ = 0.2 wt%), S (A = 0.3 wt%, σ = 0.2 wt%), and carbonate content (A = 31 wt%, σ = 3 wt%) show little variation until the top of the sampled section.
Well Z
In Well Z (Supplementary Table S3) from 1495 m upward high TOC (A = 1.2 wt%, σ = 0.2 wt%) and S content (A = 1.0 wt%, σ = 0.3 wt%) with high standard deviations (Figure 7) were found, accompanied by CaCO3 contents of 26 wt% (σ = 6 wt%), At 1125 m the TOC and S values decrease and rapidly increase to >1wt% at 1075 m again, where the CaCO3 is low again (15 wt%). From 1065 m until the top of the sampled interval (755 m), the TOC (A = 0.4 wt%, σ = 0.1 wt%) and S (A = 0.2 wt%, σ = 0.1 wt%) are low and show low standard deviations. In contrast, the carbonate content is high (A = 35 wt%, σ = 2 wt%) in this uppermost section.
δ13Ccarb
Results for δ13Ccarb are shown in detail in Figure 9 (Well H, Z) and the Supplementary Data (Well W, Supplementary Figure S4 and Supplementary Table S3). δ13Ccarb from Well H varies between −2.03 and +1.34‰ with the lowest values at the lowest part of the sampled section (2385 – 2350 m). At 2290 m, the δ13Ccarb values show a first maximum (0.82‰). They then decrease to values around 0.23‰ from 2250 to 2020 m with distinct negative and positive peaks at 2120 and 2070 m, respectively. From 2020 to 1840 m, the δ13Ccarb data show an increase to values around 1.00‰ (Figure 9). This plateau is present until 1740 m. At this depth, δ13Ccarb values show a decreasing trend until a minimum value of −1.27‰ at 1480 m. An interruption of this decreasing trend appears between 1610 and 1560 m with values up to 0.94‰. From 1480 to 1360 m, the δ13Ccarb values again increase to around 0.04‰ which then vary (σ = 0.19‰) around this value until the top of the section at 700 m. An outlier is present at 1090 m with a δ13Ccarb of −0.88‰.
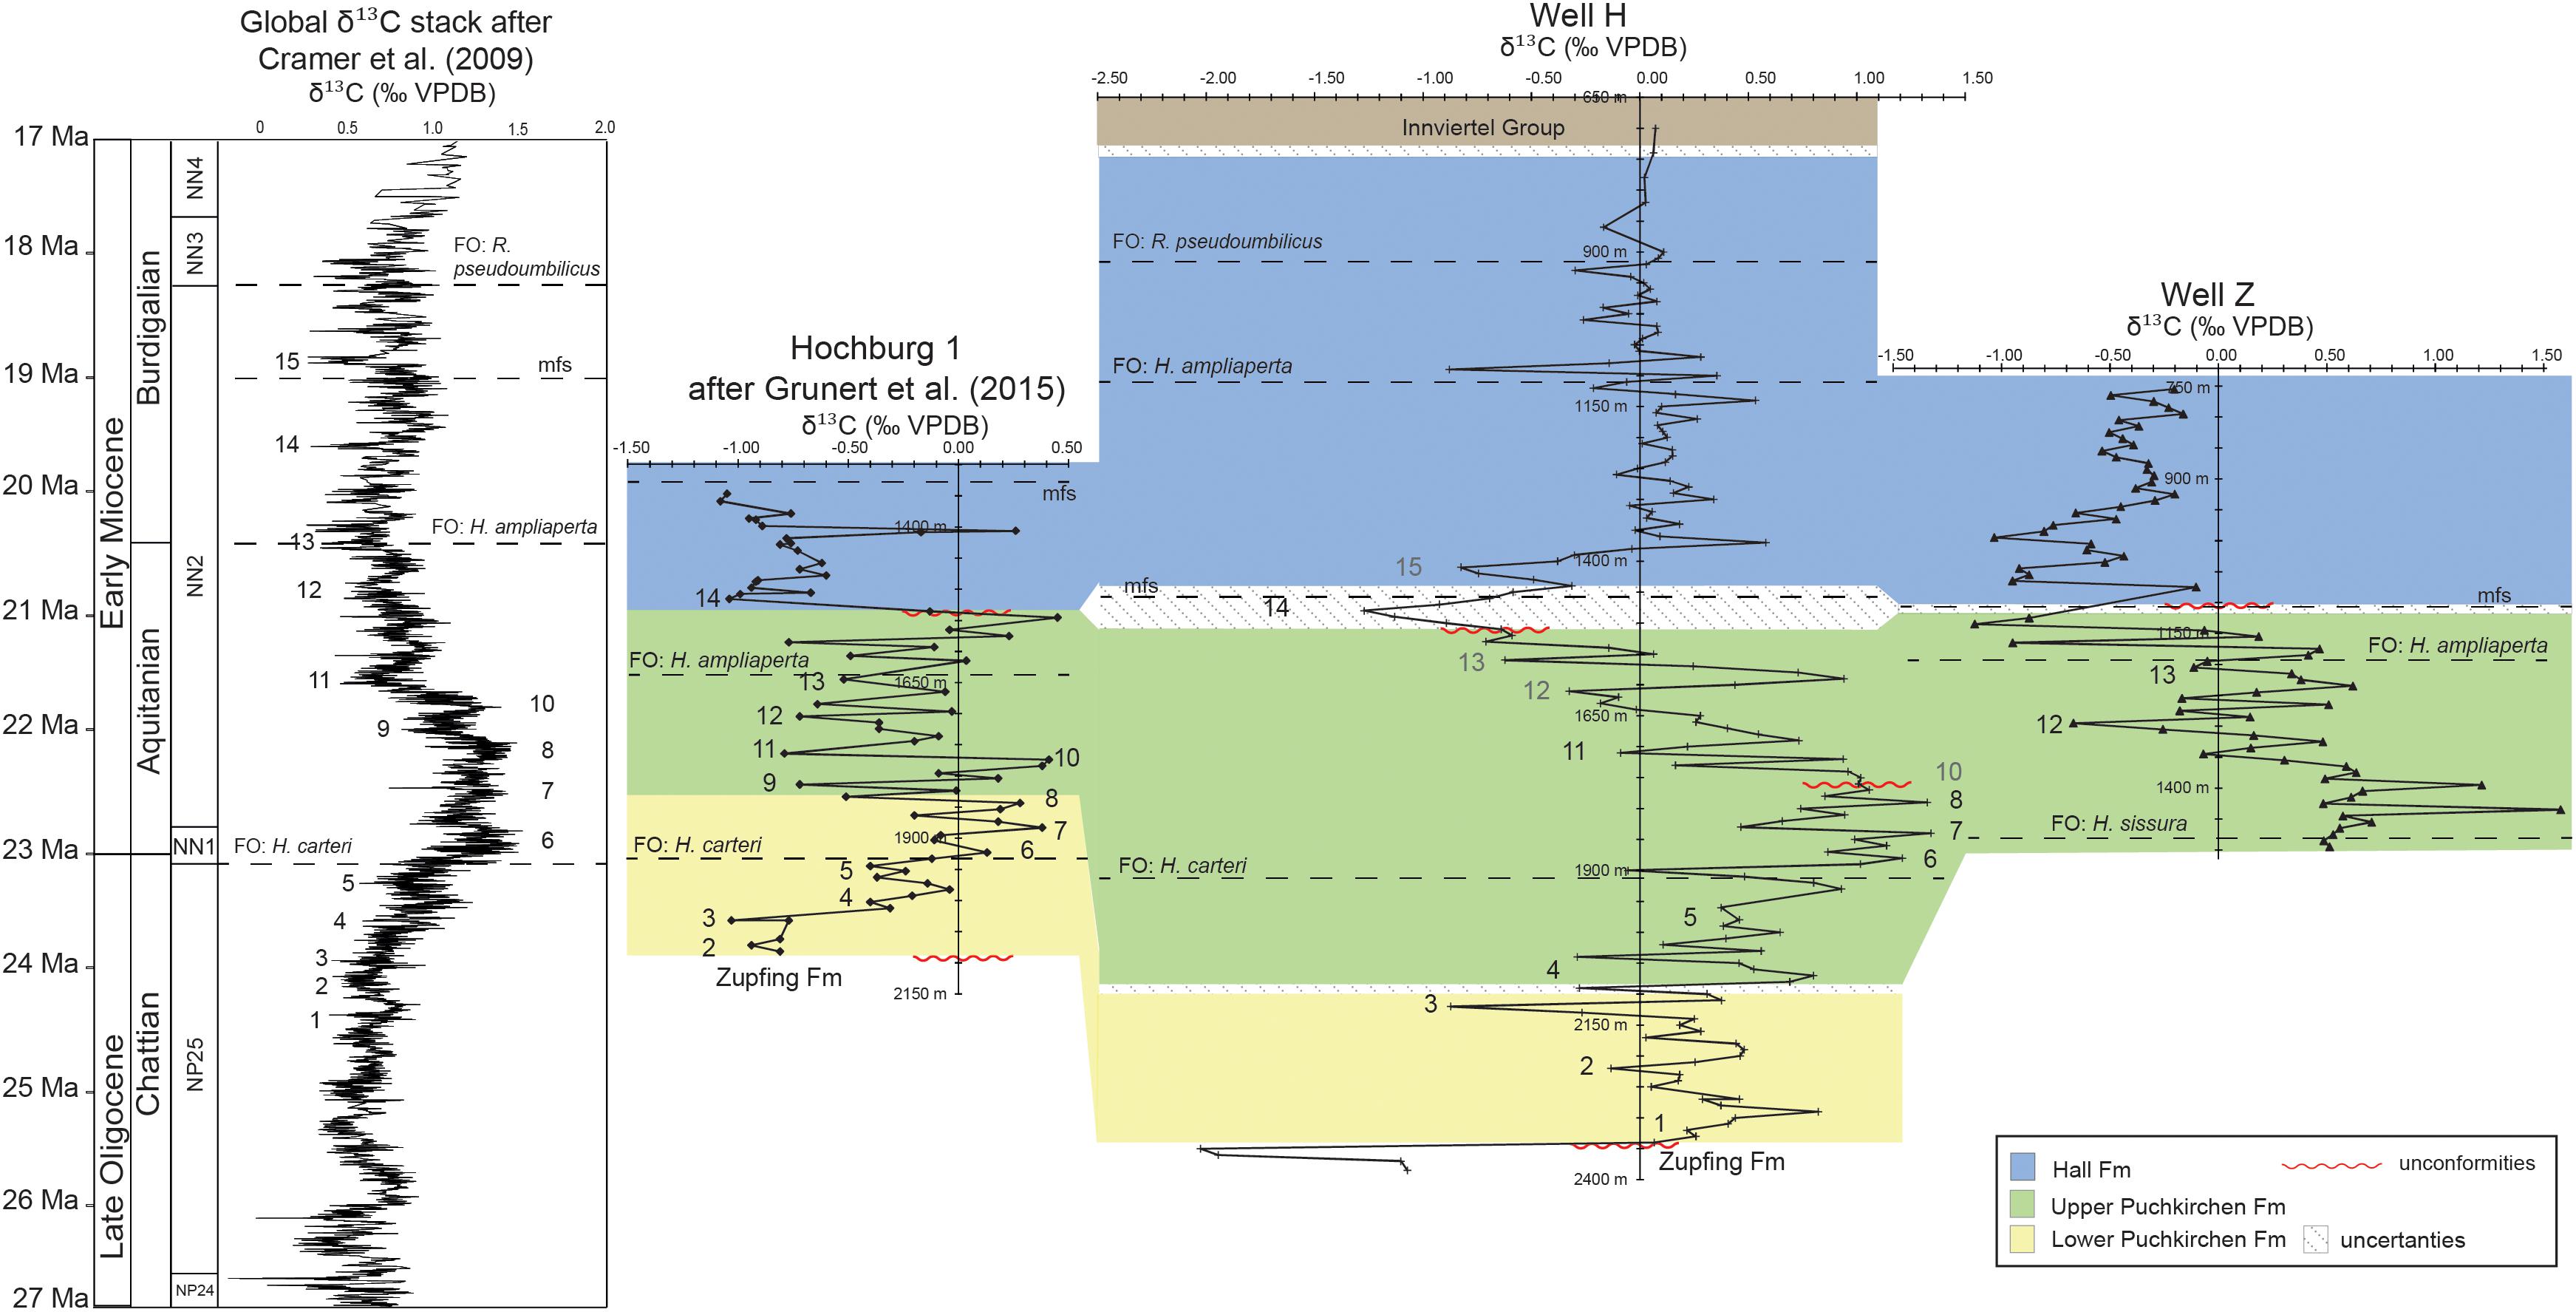
Figure 9. Correlation of δ13Ccarb data from the Upper Austrian NAFB (Hochburg1, Well H and Z) and the global stack of Cramer et al. (2009). Numbers indicate minima and maxima in the global stack that are used for correlation. FO of Helicosphaera ampliaperta, Helicosphaera carteri, and Reticulofenestra pseudoumbilicus are shown. Maximum flooding surface (mfs) is taken from Grunert et al. (2013) in Hochburg1 and correlated by seismic interpretation to Well H and Z.
Data from Well W δ13Ccarb show a large variability between −4.85 and 2.86‰. The section from 3640 to 3100 m is characterized by values around 0.50 to 1.00‰, except for the deepest sample, which shows a value of −4.85‰. From 2200 to 1360 m, the values vary between 0.40 and 0.70‰. Exceptions are the intervals from 2020 to 1960 m (−0.10 to 0.22‰), from 1660 to 1620 m (1.06–2.68‰) and at 1500 m with a value of −0.51‰. Isotopic values from 1360 to 1260 m show a pronounced decrease from 0.77 to −0.56‰. Above 1260 m depth, the values show an increasing trend to 0.37‰ at 820 m. From 820 m to 400 m, δ13Ccarb data show only small variation (σ = 0.08‰) around 0.20‰ except for an outlier at 420 m depth with a value of −1.45‰.
Well Z shows δ13Ccarb values from −1.12 to 1.58‰ (Figure 9). The lowest part of the sampled section shows a plateau with mean δ13Ccarb values around 0.69‰ and σ = 0.09‰, with two outliers at 1435 and 1395 m (Figure 9). Isotopic values then decrease until 1295 m to −0.67‰ and vary until 1175 m around 0.14‰ (σ = 0.11‰). From 1175 m upward, the values decrease until they reach −1.12‰ at 1135 m. The values then increase slightly to −0.20‰ until 925 m, an outlier is located at 1075 m (−0.10‰). From 925 m until the top of the section at 755 m, the δ13Ccarb values show only small variations (σ = 0.01 ‰) around −0.36‰.
Sediment-Accumulation Rates and Transport Direction
In the channel model, SARs vary between 390 and 622 (t/m2/Ma) (Figure 10). In the LPF, the geobody (Figure 10) shows a SAR of 390 (±103) (t/m2/Ma). The UPF has a slightly increased SAR of 518 (±39) (t/m2/Ma) and in the BHF the rates reach a maximum of 622 (±189) (t/m2/Ma) (Table 1 and Figure 10). The SARs of all three geobodies in the channel model overlap within their 1σ SD.
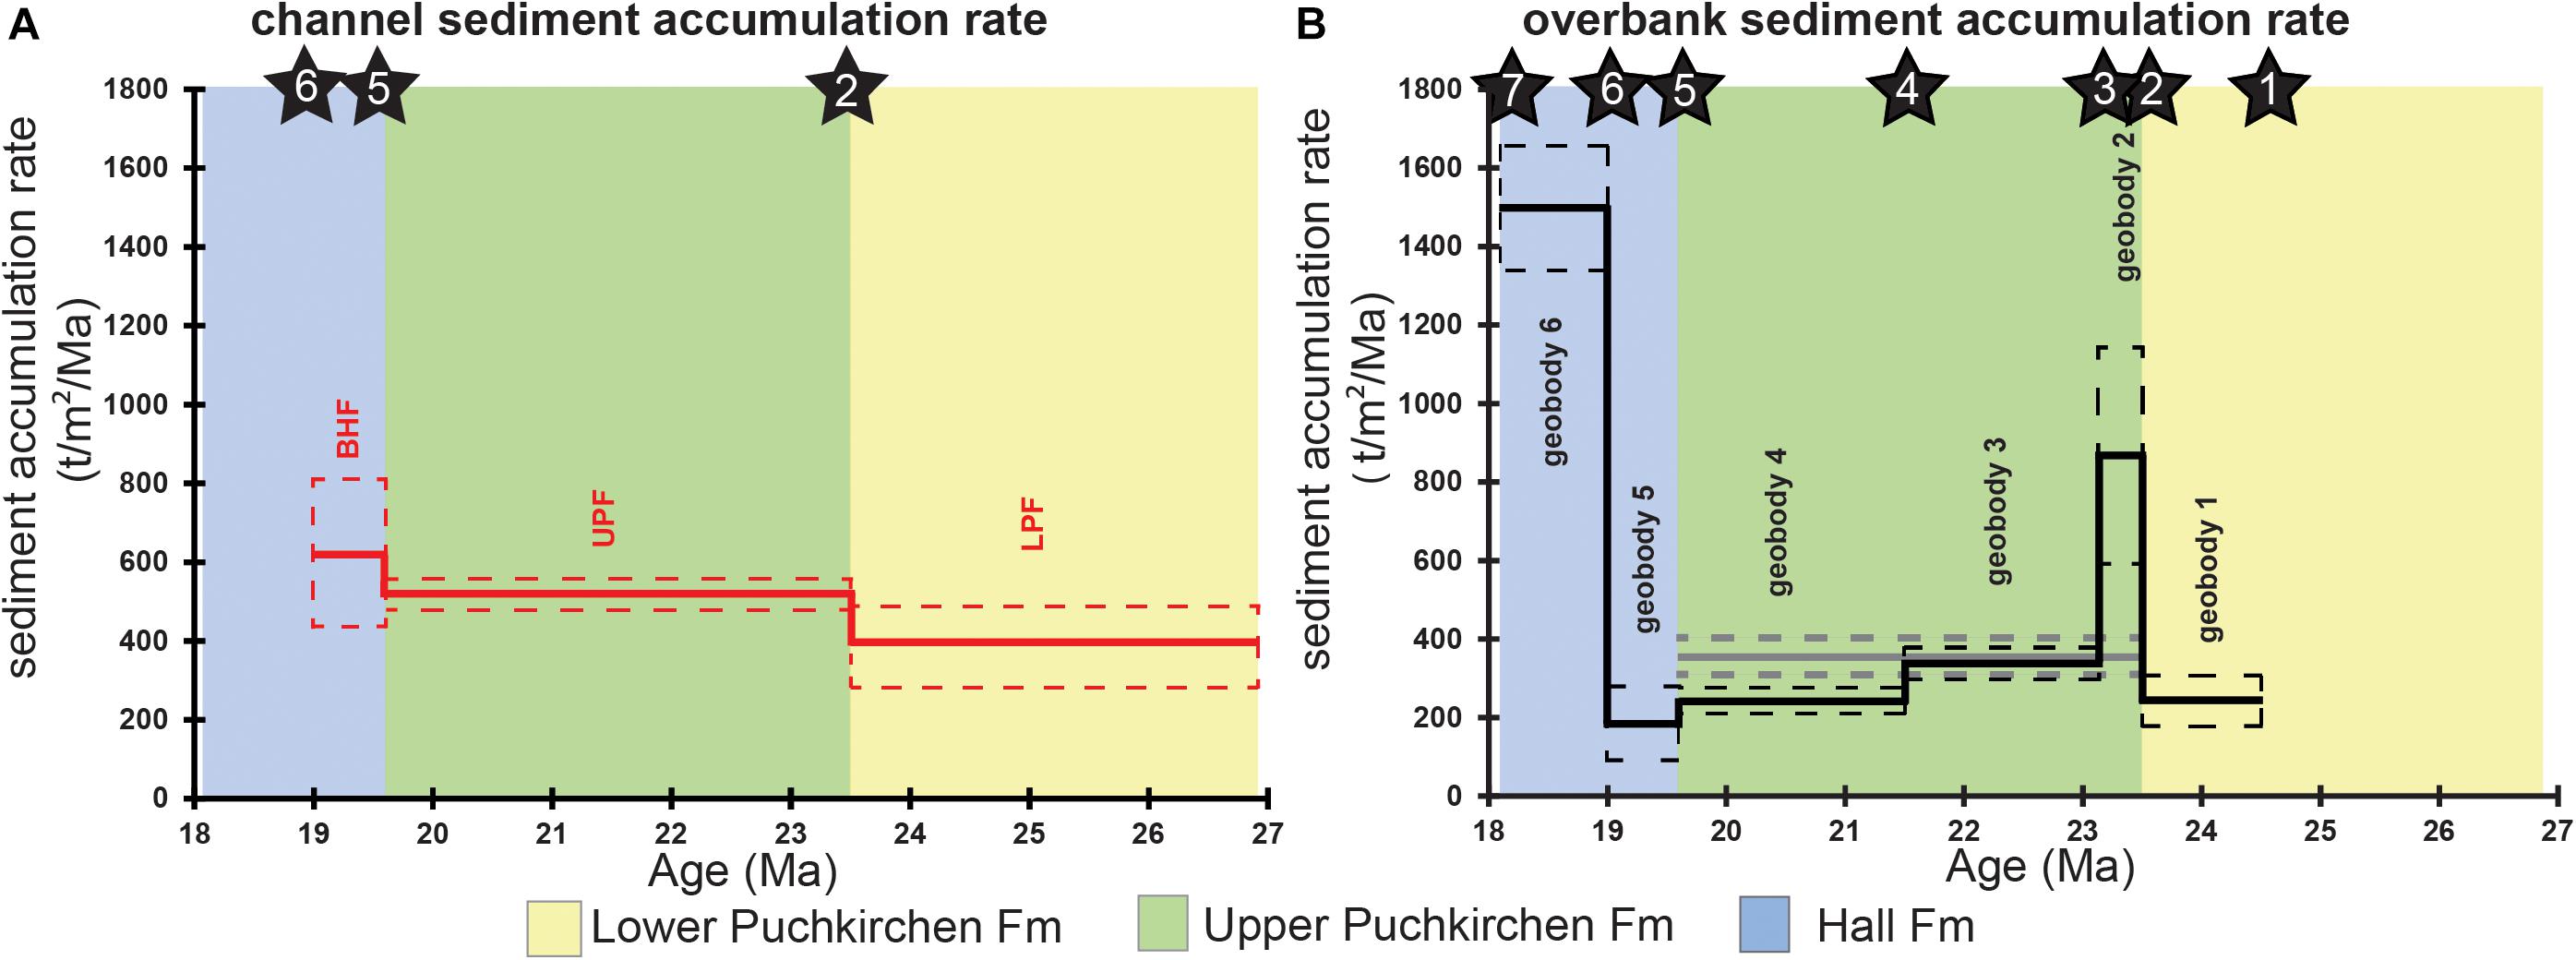
Figure 10. Calculated sediment accumulation rates [SARs, (t/m2/Ma)] of the channel (A) and the northern overbanks (B), stars indicate the bio- and/or chemostratigraphic constrains of Well H (see Table 1); 1 = Peak 1 in δ13Ccarb; 2 = U/LPF boundary (Peak 4 in δ13Ccarb); 3 = FO Helicosphaera carteri; 4 = Peak 11 (carbon isotopy Well H); 5 = Peak 14 (carbon isotopy Well H); 6 = mfs and Sr-Isotopy from Maierhof; 7 = Hall/Innviertel boundary (Grunert et al., 2013). The gray bar in (B) indicates the combined, average SAR during the UPF onto the northern overbanks. SARs in the channel show variation within their 1σ standard deviation (SD). Note that during geobody 6 (star 6–7) channel sedimentation had ended; therefore, geobody 6 does not represent an overbank setting.
SARs of the overbank model vary widely between 186 and 1497 (t/m2/Ma) (Figure 10). Geobody 1 (Figure 8) shows a SAR of 243 (±65) (t/m2/Ma). In geobody 2, the SAR increases to 869 (±277) (t/m2/Ma), and geobody 3 shows a SAR of 340 (±44) (t/m2/Ma). In geobody 4, the SAR decreases to values of 240 (±31) (t/m2/Ma). This decrease in SAR is continued in geobody 5 with a rate of 186 (±94) (t/m2/Ma). Geobody 6 shows the highest SARs of both models of 1497 (±159) (t/m2/Ma) (Table 1 and Figures 8, 10).
The rates of overbank geobodies 1, 3, and 4 illustrate the “background” SAR [243 ± 65 (t/m2/Ma) from 24.5 to 23.5 Ma; 340 ± 44 (t/m2/Ma) from 23.1 to 21.5 Ma; 240 ± 31 (t/m2/Ma) from 21.5 to 19.6 Ma]. The differences (increase of ∼40% from geobody 1 to 3, decrease of ∼30% from geobody 3 to 4) overlap in their 1σ standard deviation.
Due to insufficient age-control points, the channel model consists of a single geobody in the UPF. To enable direct comparison of the SARs between the channel and the overbanks in the UPF, we combined geobody 2, 3, 4 of the overbank model (Figure 9). SAR in the overbank model in the UPF is 355 (±46) (t/m2/Ma), ∼ 2/3 of the SAR in the channel model during UPF [518 (±39) (t/m2/Ma); Figure 9].
The results of the clinoform dip-azimuth calculation show small variations between the eastern part (NNW dip) of the basin and the western part (NNE dip). However, a dominating northern dip direction was found in the whole basin (Supplementary Figure S1).
Discussion
Formation Boundaries
In Well H (Figure 5), the ZFM occurs from 2375 to 2325 m. Due to the absence of foraminiferal index species, this interpretation relies on the geochemical data (high TOC and S values, highly negative δ13Ccarb values). As nannofossil markers indicative of NP25 or younger are absent, we suggest an age of NP24 which is in agreement with Sachsenhofer et al. (2010) and Soliman (2012). The base of the LPF is defined in Well H by the FO of Psammosiphonella cylindrica (2325 m), what is supported by an increase in abundances diversity of the fauna (Figure 5). A distinctive decrease from very high S and TOC values (Figure 5) implies dysoxic to anoxic conditions compared to the more oxygenated conditions of the LPF.
The base of the UPF is located at 2100 m based on the LO of Psammosiphonella cylindrica (Figure 5) which is in agreement with the more variable TOC (σ = 0.3 wt%), S (σ = 0.6 wt%), and CaCO3 (σ = 7 wt%) content compared to the LPF (TOC σ = 0.1 wt%; S σ = 0.2 wt%; CaCO3 σ = 2 wt%) (Grunert et al., 2015). The FO of Helicosphaera carteri at 1920 m indicates nannoplankton zone NN1 (Aubry, 1989). Below 1920 m, we interpret NP25 based on the general assemblage including common and continuous occurrences of Sphenolithus ciperoensis and Reticulofenestra bisecta.
The HFM is defined by the FO of Uvigerina posthantkeni at 1455 m in Well H. However, based on a pronounced decrease in both, TOC and S, the base of the HFM is placed about 50 m deeper in the section at 1500 m (Figure 5). This significant change in the geochemical signature is typical for the base of the HFM (Sachsenhofer et al., 2017). Hence, we regard this change as a more reliable marker for the HFM than U. posthantkeni, which occurs in a single sample between foraminifera-barren intervals (Supplementary Table S1). In the HFM the FO of H. ampliaperta together with Helicosphaera scissura at 1120 m indicates NN2 and the FO of R. pseudoumbilicus > 7 μm indicates nannofossil zones NN3–NN4 at 910 m (Figure 5). Both findings support the stratigraphic concept of Grunert et al. (2013).
In Well W, the ZFM (3470 – 3200 m) appears similar to the ZFM in Well H, without indicators for neither NP24 nor NP25, high TOC and S values and no index foraminifera indicating the ZFM (Figure 6) nor the Puchkirchen Group. The CaCO3 content is low (A = 25 wt%) and matches values reported in Sachsenhofer et al. (2010) for the ZFM.
From 3320 m upward, the geochemical data show low variability, which is indicative for the LPF (Grunert et al., 2015). Nevertheless, due to the FO Psammosiphonella cylindrica (3100 m), we interpret the base of the LPF to be located at 3100 m. The FO of H. carteri and presence of S. delphix (23.21 – 22.97 Ma; Backman et al., 2012) indicate the Oligocene/Miocene boundary and the lower boundary of NN1 at 1800 m. The base of the UPF is located between 1560 and 1520 m (Figure 6). The FO of H. scissura is recorded at 1424 m, a clear indicator for NN2 (Figure 6; Backman et al., 2012).
The HFM was defined by the FO of U. posthantkeni at 1360 m. This is supported by the decrease of TOC and S values that initiates at 1360 m but terminates at 1300 m (Figure 6). The FO of H. ampliaperta at 1260 m indicates mid-NN2. The FO of R. pseudoumbilicus > 7 μm indicates NN3 at 760 m. The FO of Amphicoryna ottnangensis (580 m) points to the Innviertel Group.
In Well Z, the geochemical data at 1500 m depth indicates that the section is part of the UPF. TOC and S content are above 1 wt% in the section until 1150 m where both contents decrease (Figure 7). At 1125 m, both curves indicate a minimum, which we interpret as the BHU (Figure 7), whereas the FO of U. posthantkeni is recorded shortly above that at 1110 m. The FO of H. ampliaperta at 1190 m indicates mid-NN2 (Ćorić and Spezzaferri, 2009).
When our new data are compared to the stratigraphic concept of Grunert et al. (2015), the positions of FOs of the calcareous nannoplankton with regard to the formation boundaries from foraminiferal analysis vary between the analyzed drill sites and the published data. The findings of Well H indicate the FO of H. carteri in the UPF (Figures 5, 11) whereas Grunert et al. (2015) report it from the LPF. The FO of H. ampliaperta in Well H is located in the HFM, which Grunert et al. (2015) found in the UPF. An earlier occurrence is possibly not recorded as the 400 m below the FO are barren of nannofossils. In Well W, the FOs of H. carteri and S. delphix (1800 m) mark the Oligocene/Miocene boundary within the LPF (Figures 6, 11) and support the results of Grunert et al. (2015). However, the FO of H. ampliaperta is recorded within the HFM at this site. H. ampliaperta specimens were large in size (∼10 μm), indicating that the recorded FO does not correspond to the actual base of the taxon range, as specimens are generally smaller (∼4 – 6 μm) at its stratigraphic base occurrence (Holcová, 2009; Grunert et al., 2015). The FO of H. scissura is already recorded below the BHU. This FO normally occurs before H. ampliaperta (Grunert et al., 2015). Therefore, we interpret the FO of H. ampliaperta in Well W as delayed, due to the erosive activity of the channel at the BHU (Figure 11). In Well Z, the FO H. ampliaperta is also reported below the BHU (Ćorić and Spezzaferri, 2009) which agrees with the concept of Grunert et al. (2015).
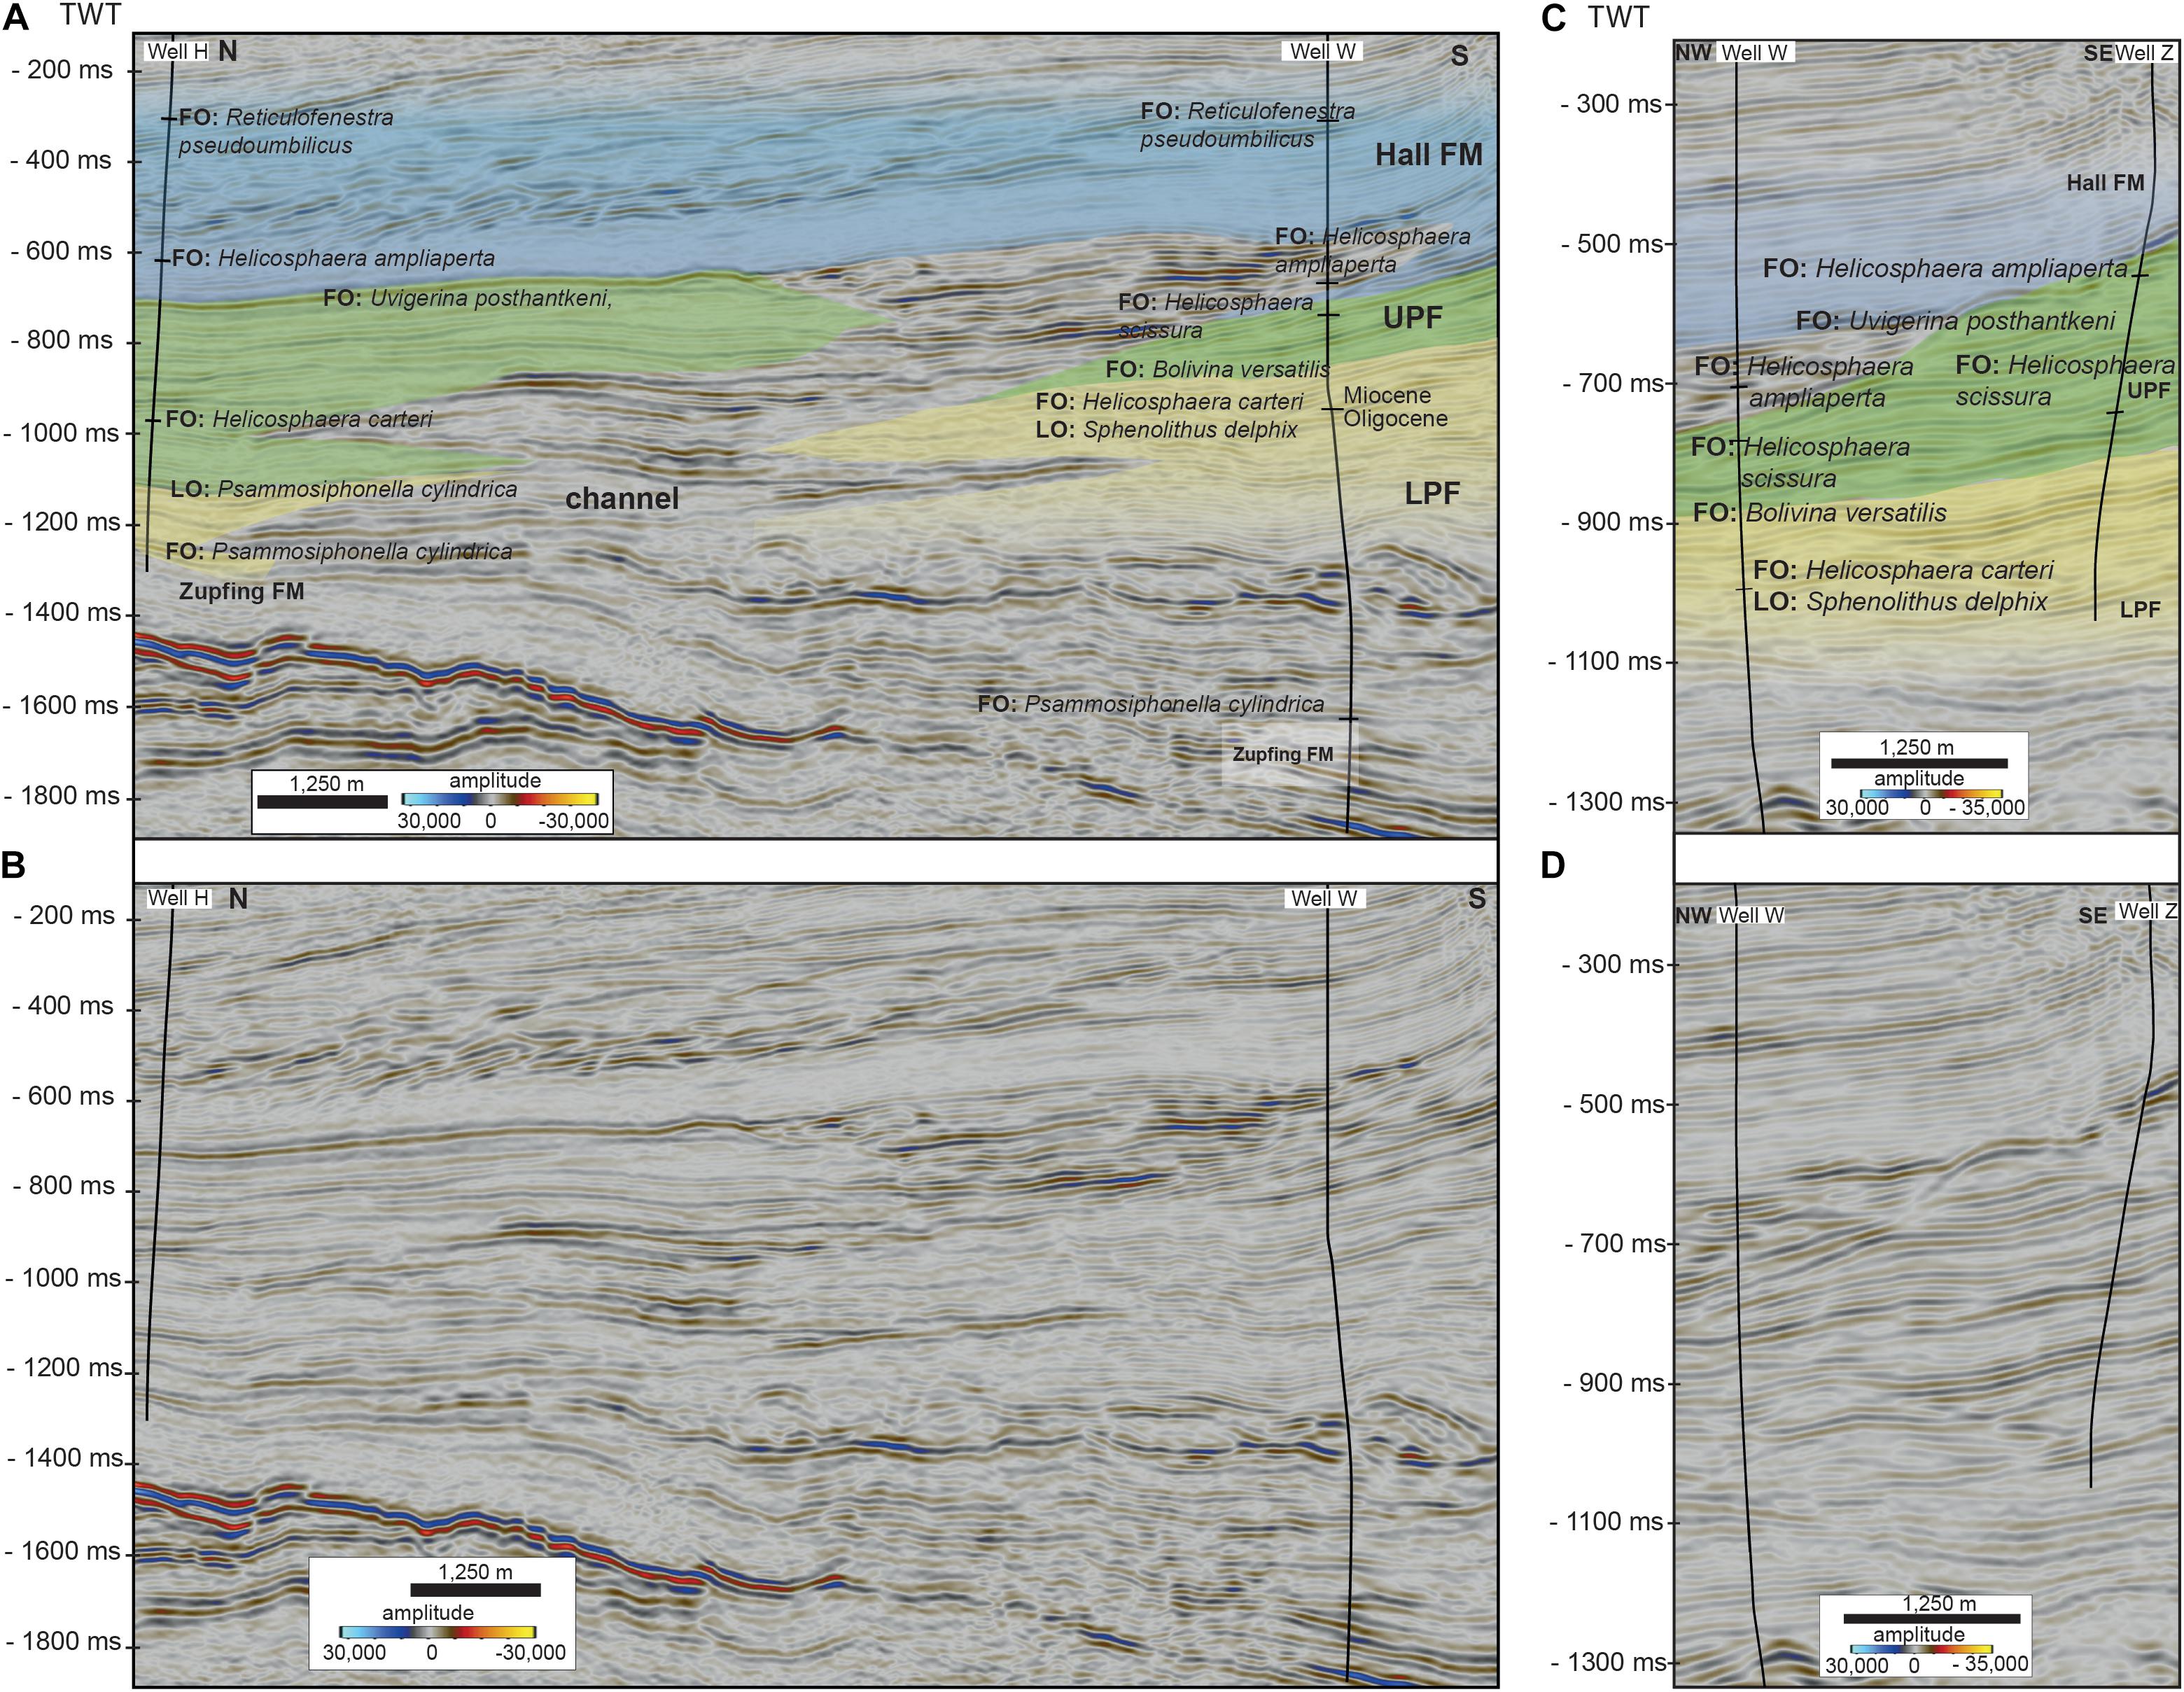
Figure 11. (A,B) Seismic cross section from Well H to W (for location see Figure 1), (A) interpreted section, (B) un-interpreted section, with first and last occurrences of index taxa, note the difference in strata thickness on the northern and southern side of the channel. In Well W, the boundary of ZFM/LPF was drilled ∼600 m deeper, than in Well H. The boundary LPF/UPF differs significantly on the northern and southern side of the channel, probably due to differences in biofacies, while the facies independent nannofossil Helicosphaera carteri has its FO approximately at the same depth. (C,D) Seismic cross section from Well Z to W (for location see Figure 1), (C) interpreted section, (D) un-interpreted section, with first and last occurrences of index taxa, note the great lateral variability of sediment thickness on the southern slope and the filled up, paleo-relief created by slope failure. The erosive character of the channel is well visible in Well W and is responsible for the delayed FO of Helicosphaera ampliaperta. Note that the UPF/LPF boundary in Well Z is correlated from Well W. In (A,C) the channel was excluded from the interpretation.
Sample contamination of the investigated drill cuttings by sediment movement during the drilling process and upward transport of cuttings potentially pose significant obstacles for biostratigraphic interpretation. We consider contamination unlikely in the present study, because the order of FO of the index nannofossils in each sampled well is agreement with their order of appearance in the open ocean (Martini, 1971). The results of the δ13Ccarb analysis and its good match to the global record (Cramer et al., 2009) further suggest comparable depositional ages. This illustrates that the temporal lag of migration of the nannoplankton between the open ocean and the Oligocene/Miocene western part of the Paratethys – a highly restricted marginal sea (Rögl, 1998) – is small and mainly controlled by our sampling rate and/or the preservation.
The variations in the position of the Oligocene/Miocene boundary (LPF in Well W and Hochburg1; Grunert et al., 2015; UPF in Well H, Figures 5, 6, 11) is attributed to the facies-dependency of benthic foraminifera that are used to define the formations (Küpper and Steininger, 1975). Benthic foraminifera are highly responsive to ecological changes at the sea floor (Murray, 2006). The proximity of the channel creates a highly dynamic paleoenvironment with significant lateral biofacies variability ultimately impacting the correlation across the channel-belt by benthic foraminifera analysis (Figure 11) (Grunert et al., 2013, 2015). This influences the formation boundaries which are based on benthic foraminifera as these changes are very likely to be local rather than basin-wide. This also heavily impacts the correlation across the channel-belt (Figure 11). These problems are manifest in problems with the identification of the LPF/UPF boundary. The boundary is hard to identify (Figures 5, 6), facies-dependent (Figure 11), and an artificial one.
The FOs of the nannofossils are facies independent and therefore a more reliable way to correlate strata across the channel-belt and to global chronostratigraphy (Figure 11) (Backman et al., 2012). However, the low abundance, generally poor preservation of nannofossils, and sampling resolution complicate biostratigraphic correlation, resulting in the observed diachroneity of nannofossil datums between wells (Figure 11). On the southern basin slope, the proximity of our sampled locations to their sediment sources created a sedimentological environment that is laterally highly variable (Figure 11C) and further complicated by occasional mass-wasting events (Hinsch, 2008; Covault et al., 2009; Kremer et al., 2018).
Stratigraphic Correlation Based on δ13Ccarb, Biostratigraphy and Temporal Duration of Unconformities
The newly acquired results from the δ13Ccarb analysis are supported by our biostratigraphic results. When compared to the global curve after Cramer et al. (2009), the δ13Ccarb data from Well H show similar trends (Figure 9). A prominent feature of the global carbon isotope curve is a plateau of positive values at the beginning of the Aquitanian (NN1 to lower part of NN2, ∼23.13 to 21.7 Ma) with four positive peaks. This plateau occurs in the global δ13Ccarb stack after a steady increase during the upper part of NP25 interrupted by four local minima, at 23.3, 23.5, 23.9, and 24.2 Ma. Data from Well H suggest a similar trend of increasing δ13Ccarb values from 2250 m with distinct minima at 2010 – 1960 m, 2090 m, 2120 m and 2200 m (upper NP25). At 24.5 Ma the global δ13Ccarb curve indicates a maximum, a similar feature is shown at 2290 m in the data from Well H. These findings imply a duration of ∼24.5 to 23.5 – 23.2 Ma for the deposition of the LPF (Figure 9).
The plateau (23.0 to 21.8 Ma, Figure 9) in the δ13Ccarb curve (Cramer et al., 2009) is mirrored in the data from Well H between 1890 and 1740 m. This interpretation is in good agreement with the FO Helicosphaera carteri at 1920 m, indicating an age of 23.13 Ma.
The global δ13Ccarb data decrease quickly from the previous plateau to lower values at ∼21.5 Ma and stay at low values during the remaining NN2. Significant negative excursions are noticeable at 20.8, 20.4, 20.2, 20, 19.6, and 18.8 Ma (Figure 9). The decrease in isotopic values of the global stack is recorded by the data of Well H at 1710 m, indicating an age of 21.5 Ma and for the minima in δ13Ccarb data at 1610 m an age of 20.8 Ma. We correlate the maxima at 1590 m and two minima at 1560 and 1480 m in the δ13Ccarb record from Well H to minima in the global curve at 20.2, 20, or 19.6 Ma. In contrast to well Hochburg1 (Grunert et al., 2015), erosion at Well H was minor or absent at the BHU (Figure 11). Grunert et al. (2015) assigned an age of 19.5 – 18.9 Ma for the BHU by extrapolating sedimentation rates. We suggest that the negative δ13Ccarb values in our samples at the BHU (1510 m) can be correlated to the negative excursion at 19.6 Ma on the global δ13C curve. This implies a time span of 23.5 – 23.2 Ma to 19.6 Ma for the UPF at Well H (Figure 9).
This interpretation is supported by 87Sr/86Sr data from Janz and Vennemann (2005). These authors presented the isotopic composition (O, C, Sr, and Nd) of brackish ostracods from an outcrop at Maierhof at the northern boundary of the NAFB (Figure 4E). The outcrop is interpreted to record a middle Eggenburgian maximum flooding surface (mfs) accompanied by the FO Elphidium ortenburgense (Wenger, 1987). Janz and Vennemann (2005) inferred open marine conditions at Maierhof in the middle Eggenburgian from their results. When tuned to the global 87Sr/86Sr curve (McArthur et al., 2012), the isotopic values from Maierhof indicate a depositional age of 19.1 to 18.9 Ma. Grunert et al. (2013) postulated that the termination of submarine channel sedimentation in the BHF was associated with a maximum flooding surface at well Hochburg1 and the FO of Elphidium ortenburgense. The interpretation that the negative δ13Ccarb excursion at 1480 m is related to the negative excursion at 19.6 Ma on the global carbon isotopic stack is supported by these ages, as there is no other large negative excursion at that time in the global record (Figure 9). Increasing δ13Ccarb values above the BHF can be correlated to the global stack of Cramer et al. (2009) at 19 Ma. These results imply a time span of 19.6 to 19.1 – 18.9 Ma for the BHF and the timing of the BHU on the overbanks. From 1370 m until the top of the section, the δ13Ccarb data from Well H do not reflect global trends.
Diagenetic alteration of the original δ13Ccarb signal due to the release of 12C from sedimentary organic matter or clay minerals (Marshall, 1992) is unlikely to explain the trend in δ13Ccarb in Well H. In most samples from Well H, the CaCO3 content is > 20 wt% and statistical analysis shows no correlation between carbonate content and the carbon isotope record (R2 = 0.03). Only in samples from 1740 – 1510 m, CaCO3 contents are low (≥7 wt%), nevertheless, the CaCO3 and δ13Ccarb values show no correlation (R2 = 0.07) in this part. The δ13Ccarb and the δ18Ocarb data from Well H do not correlate (R2 = 0.1). Therefore, we argue against an influence of diagenetic alteration to this data set.
The δ13Ccarb values from Well W (Supplementary Figure S4) do not resemble the trends of the global stack or the wells H and Hochburg1 (Cramer et al., 2009). The δ13Ccarb values from Well W show a moderate correlation (R2 = 0.58) to the δ18Ocarb values of the section, we thus refrained from using the data due to a diagenetic overprint.
In Well Z, the δ13Ccarb data of the lowermost section show a plateau with three distinct peaks (1435, 1395, 1325 m, Figure 9). Based on the FO of Helicosphaera scissura at 1490 m (Figure 7), we suggest a lower NN2 age for the base of the well. The rapid decrease to negative values (−0.67‰) at 1295 m may represent the abrupt decrease of the global δ13Ccarb curve at 20.8 Ma. The FO of Helicosphaera ampliaperta at 1190 m in Well Z supports the interpretation that the second negative excursion represents the global decrease at 20.44 Ma in the global δ13Ccarb curve. From 1190 m upward, the δ13Ccarb data of Well Z are highly variable making unambiguous correlation to the global stack difficult (Figure 9). These findings indicate a timespan from 20.92 Ma to <20.44 Ma for the investigated section of the UPF, with the BHU having an age of <20.44 Ma.
In context of possible alteration of the isotopic signal due to 12C from organic matter or clays (Marshall, 1992), the data from Well Z indicate only sporadic samples with CaCO3 values of <20 wt%. The isotopic data from the UPF section shows no correlation with the CaCO3 content (R2 = 0.03), but the data from above the BHU indicate a weak correlation (R2 = 0.39). Therefore, diagenetic alteration is considered unlikely for the samples within the UPF, whereas in the HFM such a bias may be present.
Revisiting the Stratigraphic Concept for the Upper Austrian Molasse
Grunert et al. (2015) have introduced a new stratigraphic concept for the Puchkirchen Group and the overlying Hall Formation. The results presented here support, improve and expand this concept (Figure 12). The samples from the ZFM in Well H and Well W suggest an intra-NP24 age. This intra-NP24 age is in agreement with the results of Sachsenhofer et al. (2010) and Soliman (2012) from dinoflagellate cysts and calcareous nannoplankton, respectively. Furthermore, Soliman (2012) stated that the ZFM contains the Rupelian/Chattian boundary (28.09 Ma), indicated by a peak in Rhombodinium draco in the lower part of the ZFM. Therefore, a depositional age of 29.6 to 28.1 – 26.9 Ma for the ZFM is likely.
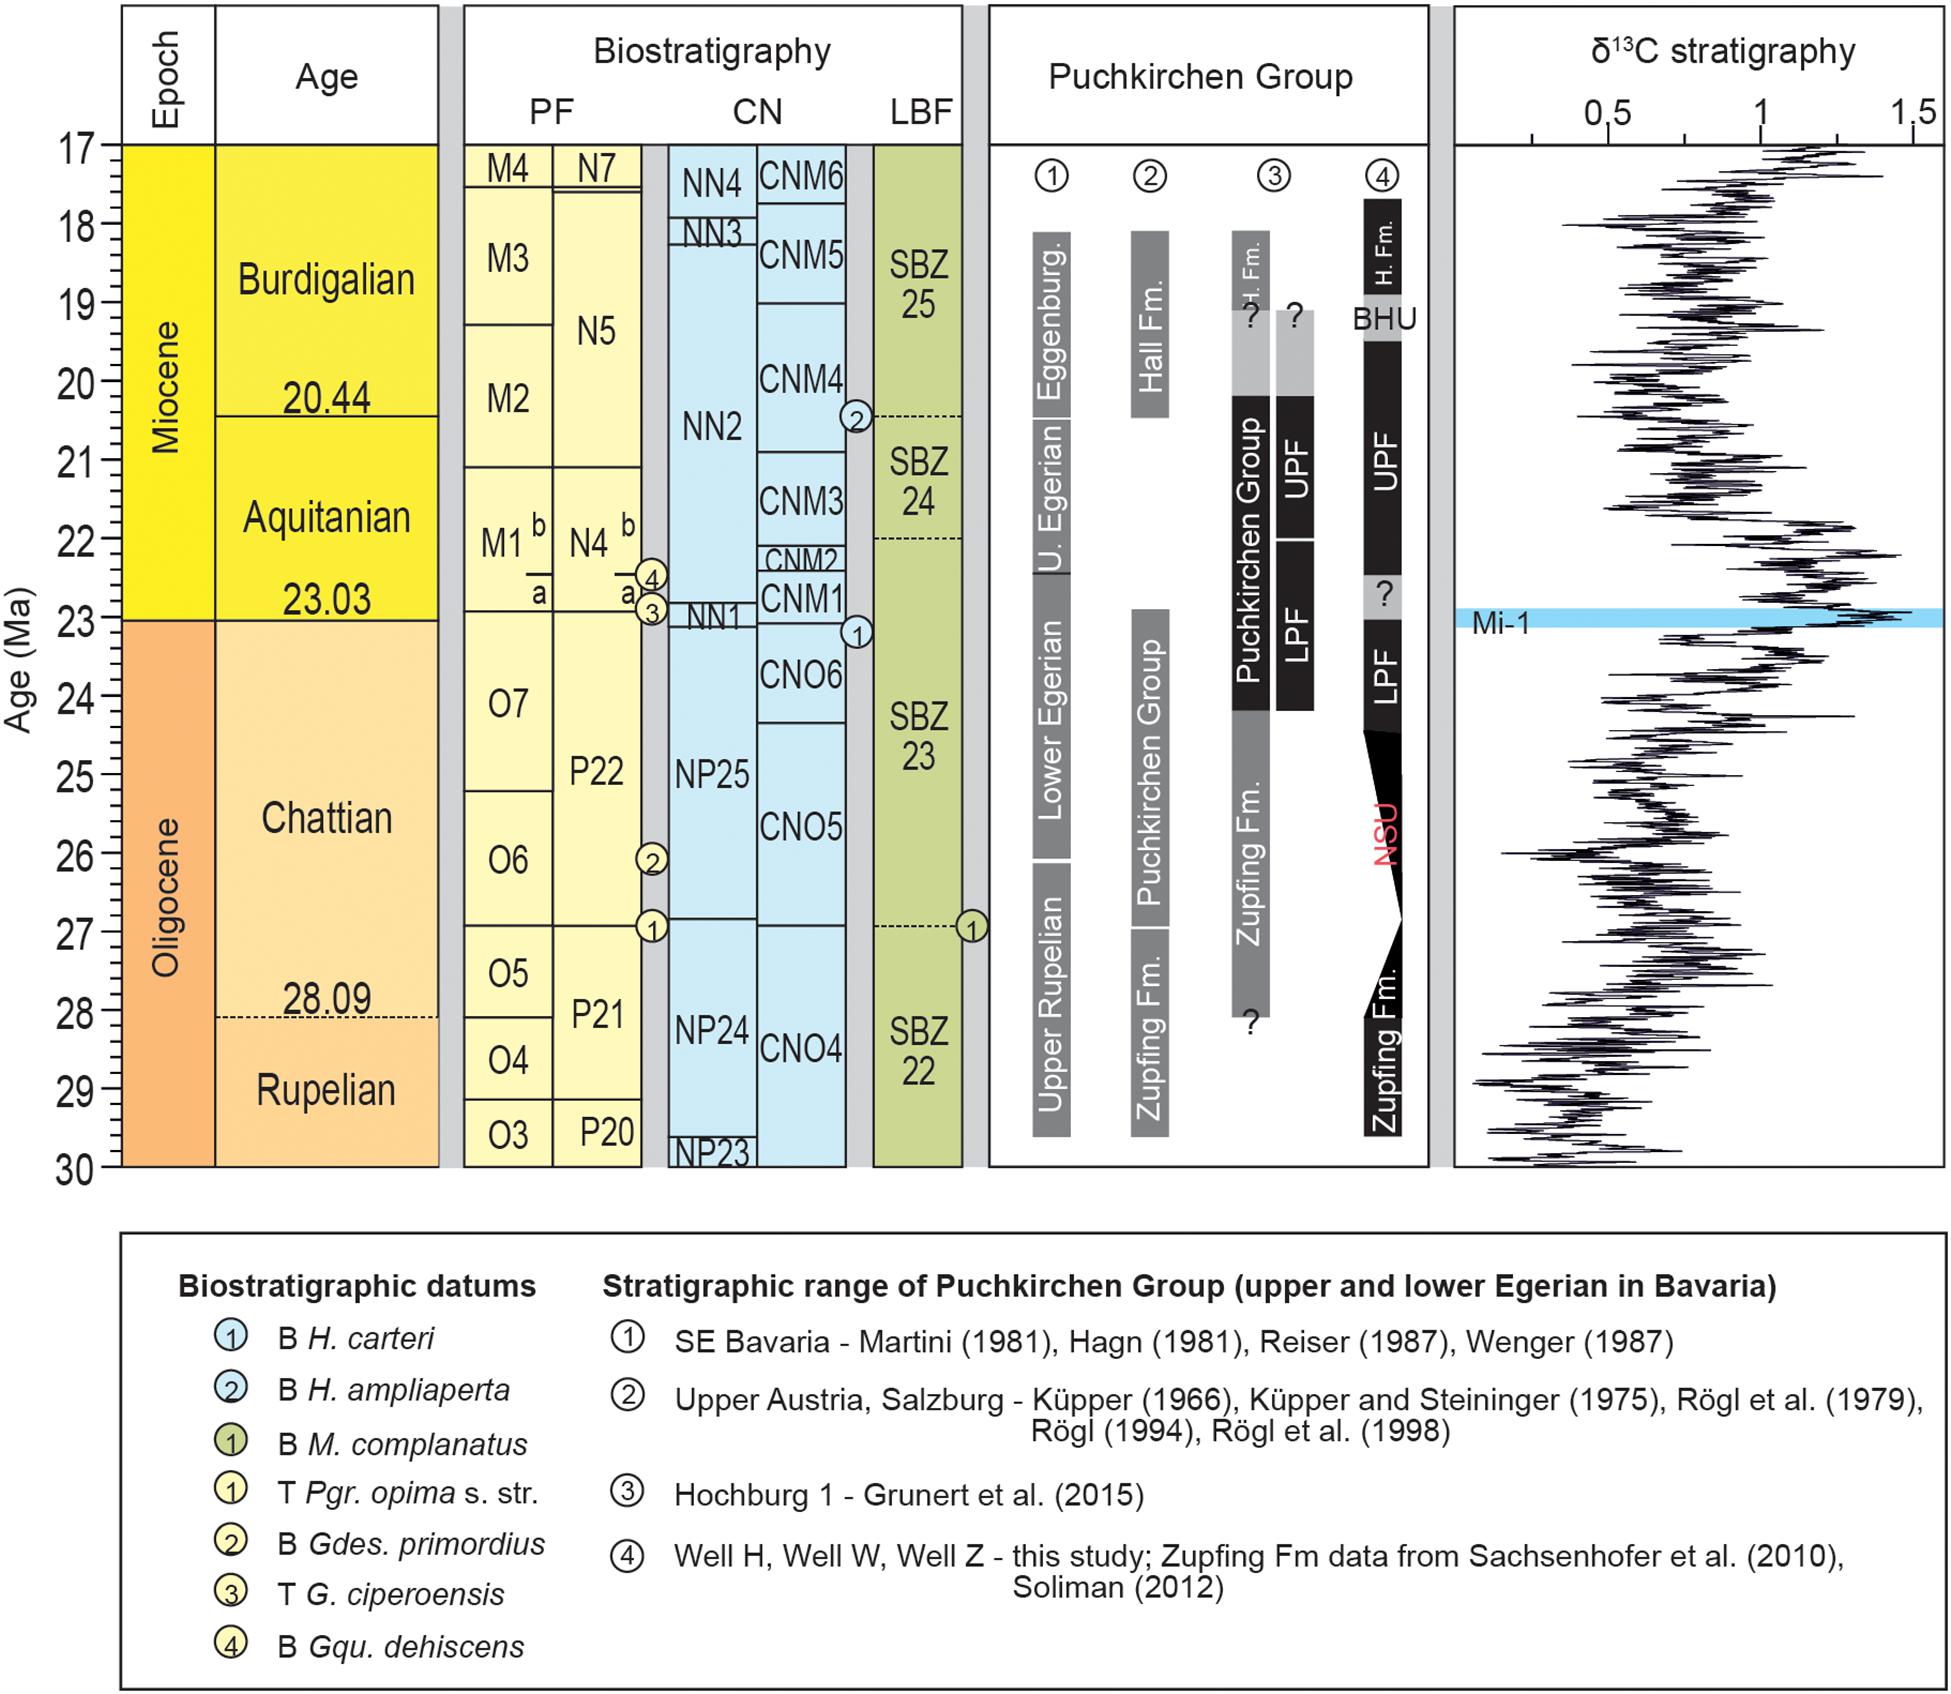
Figure 12. Summary of the proposed stratigraphic concepts (number 1, 2, 3) of the Puchkirchen Group and the concept presented here (4). Planktonic foraminifera (PF) zonation follows Wade et al. (2011) and Gradstein et al. (2012); calcareous nannoplankton (CN) zonation follows [opetwcite]B8,B31[clotwcite]Backman et al. (2012); Gradstein et al. (2012), and Agnini et al. (2014); larger benthic foraminifera zonation follows Cahuzac and Poignant (1997) and Gradstein et al. (2012). Global δ13C stack from Cramer et al. (2009). Gray bars indicate uncertainties, BHF summarized as BHU. See text for details. Redrawn after Grunert et al. (2015).
The base of the Puchkirchen Group on the northern slope is now well dated to ∼ 24.5 Ma based on the data from this study and Grunert et al. (2015). Sedimentation on the northern basin slope started after a period of non-deposition from <28.1 Ma (Soliman, 2012) to ∼ 24.5 Ma (Figure 12), which is expressed in the NSU (Masalimova et al., 2015). Nevertheless, it is unclear whether a similar hiatus is present along the axis of the basin or if deposition of the Puchkirchen Group began earlier here than on the northern slope. In the 3D seismic-reflection data, no indication for a large-scale hiatus was found. Our efforts to date the ZFM/LPF boundary in Well W were unsuccessful due to diagenetic alteration of δ13Ccarb and further investigations are necessary to solve this question. Today, a difference in depth of ∼600 m is separating the ZFM/LPF boundary in Well H and W (Figure 11). The diachronic deposition of sediments on a passive margin and the axial part is a well-documented feature of underfilled, wedge-shaped foreland basin (DeCelles and Giles, 1996) and has also been described in the western part of the NAFB (Sinclair, 1997). Therefore, we argue against a significant hiatus in the central part of the basin and propose an age of 26.9 Ma (base NP25) to 24.5 Ma for the base of the LPF (Figure 12).
The age of the boundary between the Lower and Upper Puchkirchen Formation can be constrained by carbon isotope data to ∼23.5 Ma in Well H (Figure 9), from calcareous nannoplankton in Well W to 23.1 – 20.4 Ma (Figure 6) and to >20.4 Ma from chemo- and biostratigraphy in Well Z (Figure 7). Grunert et al. (2015) postulated an age of 22.2 – 22 Ma (Figure 12). The differences can be explained by the facies dependency of the foraminiferal index taxa (see section Formation Boundaries).
The top of the UPF in Well W and Well Z has been eroded precluding unambiguous correlation with global chronostratigraphy. Nannofossils from Well W and Z indicate an age of <23.1 Ma and <20.4 Ma, respectively. At Well H, seismic reflections show no erosion at the BHU (Figure 11). Carbon isotopic correlation indicates an age of ∼19.6 Ma (Figure 12), which is in good agreement with estimates of Grunert et al. (2015) and 87Sr/86Sr data by Janz and Vennemann (2005). The termination of channel sedimentation and the BHF at 19.1 – 18.9 Ma result from a sea-level increase resulting in a mfs at Hochburg1 (Grunert et al., 2013) and Maierhof (Wenger, 1987; Janz and Vennemann, 2005). This correlates well with the middle Eggenburgian mfs which was correlated to global 3rd order sequence Bur2 (Piller et al., 2007) and the mfs in the Swiss NAFB (Garefalakis and Schlunegger, 2019). Nannofossil biostratigraphy from Well H suggests an age of 18.1 Ma for the base of the Ottnangian Innviertel Group above the Hall Formation, which is in good accordance with previous results (Grunert et al., 2010, 2013).
This stratigraphic framework with the Puchkirchen Group on the northern basin margin ranging from 24.5 to 19.6 Ma – in the axial part of the basin, sedimentation of the Puchkirchen Group is likely to have started before 24.5 Ma – and the Hall Formation spanning from 19.6 to 18.1 Ma agrees with the data from Grunert et al. (2013, 2015) but differs significantly (Figure 12) from previous concepts (Küpper and Steininger, 1975; Rögl et al., 1979). Reasons for these differences were discussed by Grunert et al. (2015). These authors also discussed the complications of the stratigraphic correlation in the Paratethys which arise from the assignment of lithostratigraphic units to regional stages. The regional stages are often defined by locally restricted ecostratigraphy what hampers the correlation (Grunert et al., 2015).
External Forcings Detected in SARs
Comparing the SARs between the channel and overbank models is not straightforward as sediment is eroded in the channel (Hubbard et al., 2009). Furthermore, the channel continues toward the east where it is affected by thrust tectonics. Hence, the channel in the study area is also subject to sediment bypass and does not form the ultimate sediment sink of the sedimentary system. In fact, the position of the final sink, the submarine fan that is associated with this submarine channel is currently unknown (Hubbard et al., 2009). The Puchkirchen channel system represents a sediment-transfer zone for the Alpine detritus. Therefore, decreased channel SARs may be interpreted as decreased sediment supply or as periods of increased sediment bypass. Sediment on the northern overbanks might remain in the basin over longer time scales as it is remobilized only by channel-meander bend migration and associated erosion into the underlying overbank deposits, channel avulsion (undocumented in the study area), and/or levee breaches (Hubbard et al., 2009). Therefore, the overbanks may represent a local, terminal sink.
Overbank geobody 2 shows a 3.5-fold increase compare to Overbank geobody 1 in SAR from 23.5 to 23.1 Ma (Figure 10). On the shelf, Zweigel (1998) showed prograding and aggrading clinoforms with a high SAR which might be linked to increased sediment flux from the exhumation of the Lepontine Dome. This is followed by a sea-level highstand at the Oligocene/Miocene boundary as indicated by the deposition of marly claystones (Zweigel, 1998). The increase in the overbank SAR around 23.5 Ma might be related to the high SARs on the shelf before the Chattian/Aquitanian boundary, which in turn may be related to the exhumation on the Lepontine Dome.
However, we favor an alternative explanation related to an autogenic process within the channel system, because of the drastic SAR increase and the short duration (∼0.4 Ma) of the increase: During the deposition of overbank geobody 1, the channel showed a slightly sinuous course and a northward-directed, subtle meander bend located on the northern edge of the seismic cube (Figure 13A). During the deposition of overbank geobody 2, the channel meander adjacent to the overbank volume abruptly changed its course to the south (Figure 13B) forming a pronounced meander bend and a broad northern overbank plain (Figures 2, 8, 13). The channel was forced to change its geometry due to plugging by debris-flow deposits sourced from the west (Masalimova et al., 2015). The increase in sinuosity probably led to an increase of flow stripping of the upper part of channel-traversing turbidity currents onto the northern overbanks. The upper surface of the NSU is characterized by southward (channel)- directed gullies, that transported material into the main channel belt (Figure 13A, Masalimova et al., 2015). Such gullies are absent after the change in channel-meander geometry (Figure 13B). Increased flow stripping and the absence of gullies have led to a uniform and widespread deposition of sandstones on the overbanks (Masalimova et al., 2015). Therefore, the dramatic increase in SAR between 23.5 and 23.1 Ma (Figure 10B) is interpreted to be the result of an autogenic change in channel geometry.
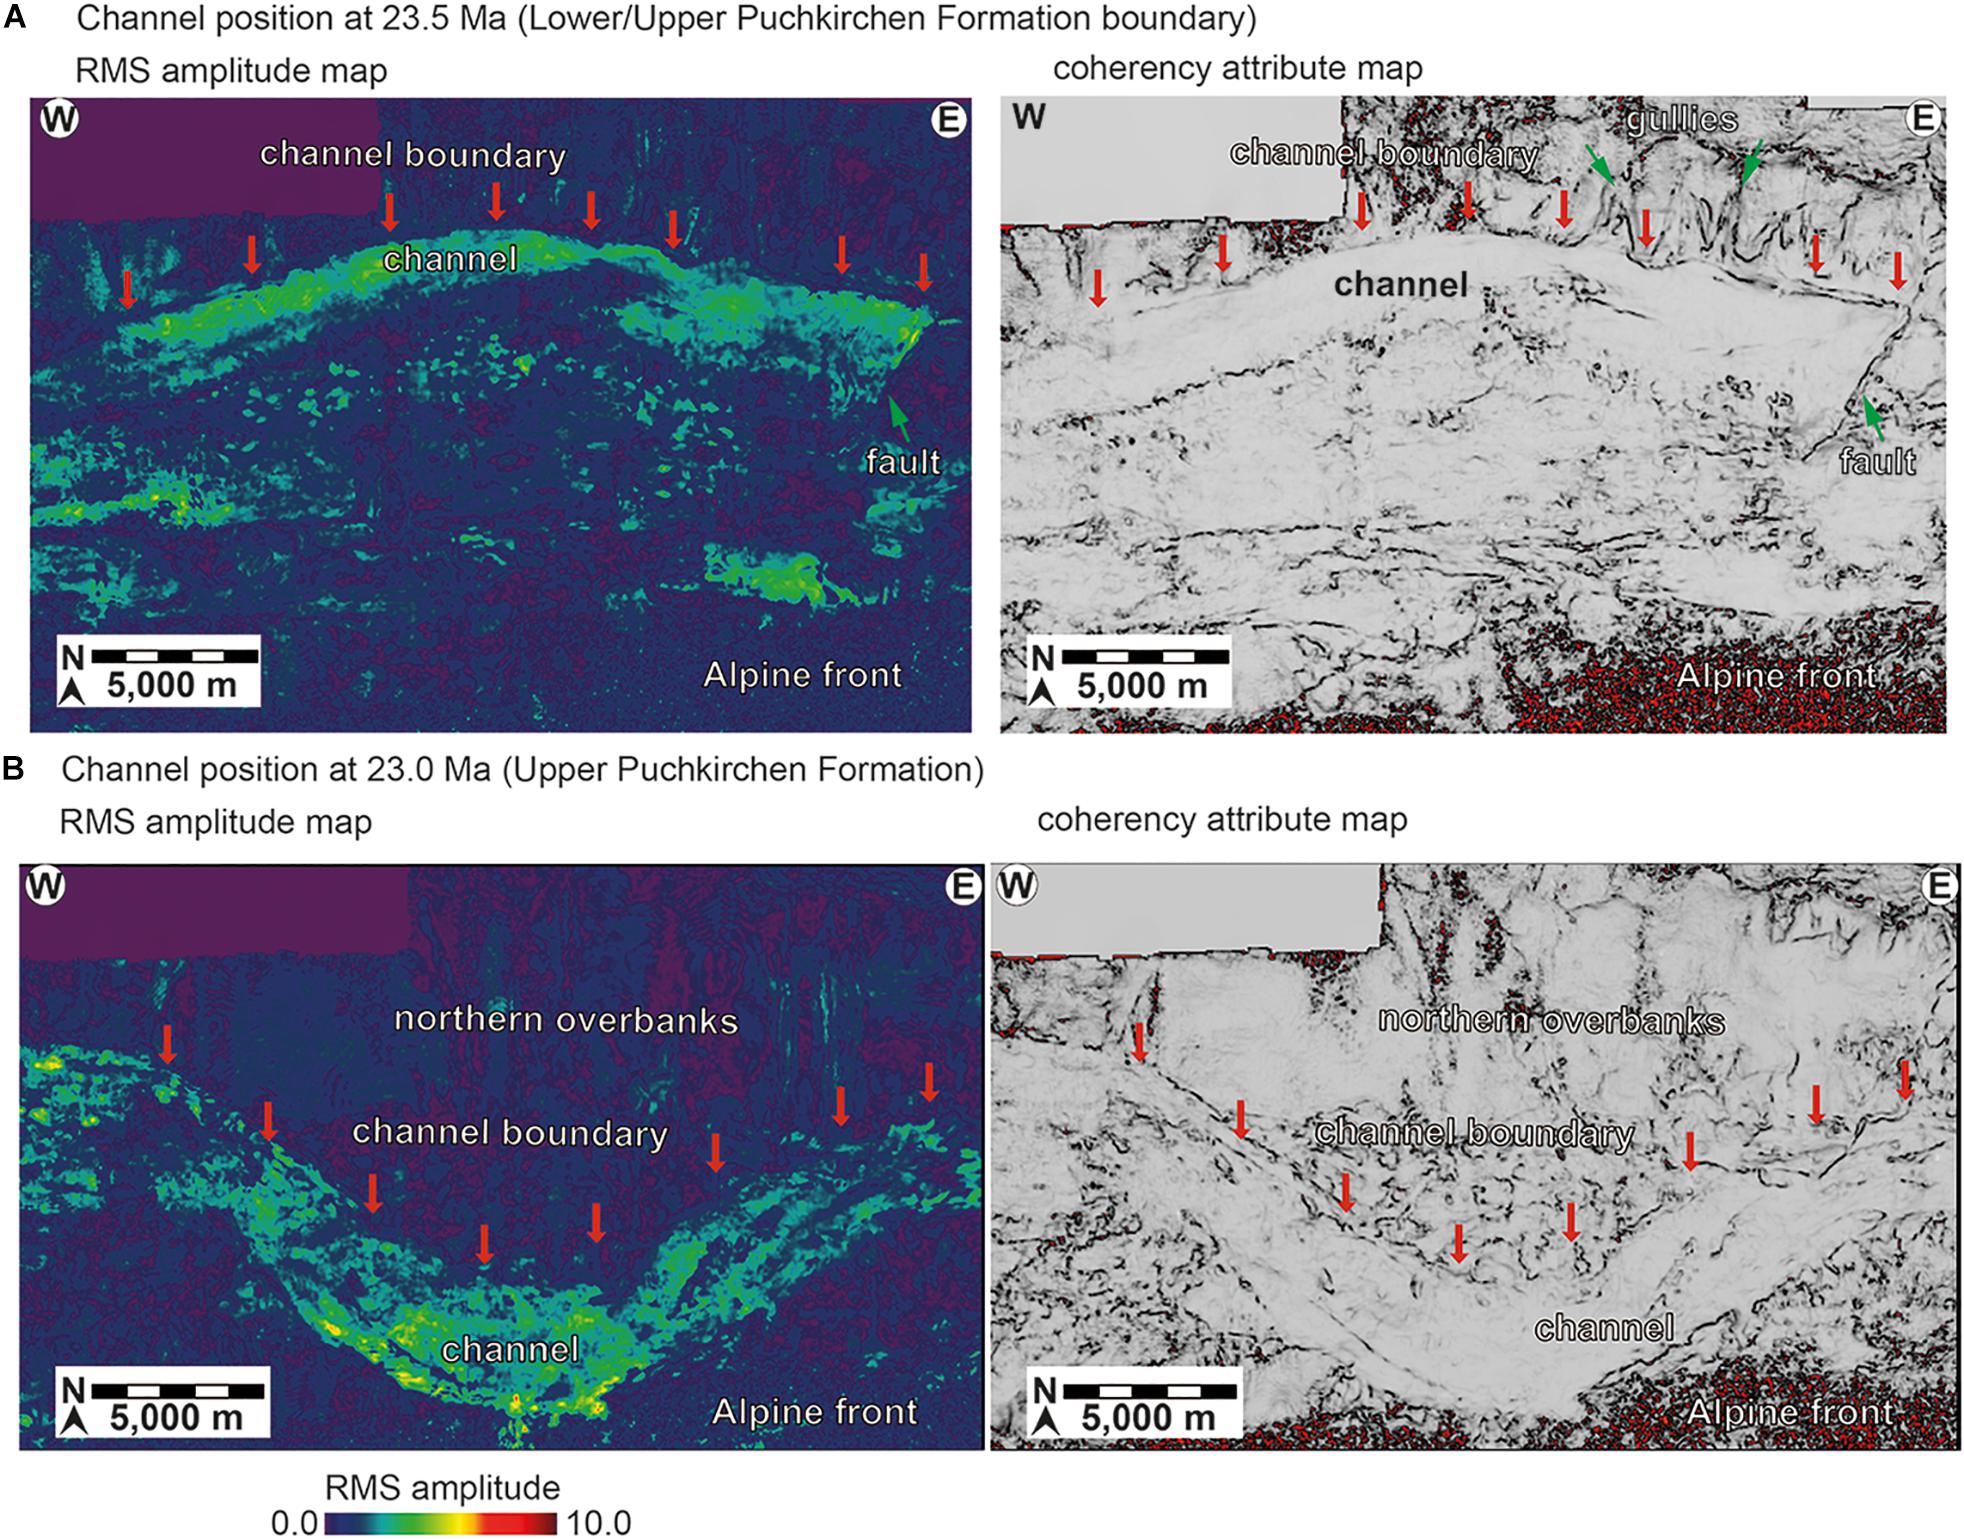
Figure 13. RMS amplitude and coherency maps of the channel and overbank area (for position see Figure 1B) at 23.5 Ma (A) and 23.0 Ma (B). At 23.5 Ma (A) the channel is close to the northern border of the seismic cube, the overbanks are narrow. Until 23.0 Ma (B) the channel changes its position close to the Alpine thrust front and creates wide, northern overbanks. Red arrows mark the channel boundary, green arrows the gullies on the NSU and a fault.
Results from laboratory and numerical models suggest, that overbanks of high sinuous channels show increased SARs due to overspill than those overbanks of low sinuous channels (Amos et al., 2010; Huang et al., 2012). The observed increase in sinuosity of the channel from ∼1.05 at 23.5 Ma to ∼1.14 at 23.0 Ma (Figure 13) is in line with these results and further supports our interpretation of an autogenic SAR increase. Furthermore, on the Monterey Fan and channel system, Fildani et al. (2006) observed a similar fourfold increase in sedimentation rates in areas of increased flow stripping when compared with background overbank sedimentation.
Geobody 5 records stable and low SAR on the overbanks (compare to geobody 4 overlap within their standard deviation; Figure 10 and Table 1). As reported by De Ruig and Hubbard (2006), the uppermost UPF and BHF show a decrease in grain size and an increase in mud content, which suggests a reduction of turbidity-current height, density and/or competence. The turbidity currents in the channel became less efficient in spilling their diluted tops onto the overbanks. This process also explains the two characteristics of the BHU in the seismic-reflection data (Figure 2): Whereas on the northern overbanks the section above and below the BHU is characterized by continuous, high-amplitude reflectors, the channel around the BHU is highly erosive – evidenced by truncated reflectors and the biostratigraphic results from Well W (Figures 2, 6, 11, late appearance of H. ampliaperta, see section Formation Boundaries for discussion).
The SARs from the channel and overbank model in the time interval from 19.6–19.0 Ma are directly linked to the process which has caused the formation of the BHU. Zweigel (1998) pointed out that on the Bavarian Shelf the SAR became negative (erosion) in her Sequence 4a (interval below BHU, Figure 3). Sequence stratigraphy (Jin et al., 1995; Zweigel, 1998) as well as foraminifera analysis (Wenger, 1987) indicate a major sea-level decrease in the eastern NAFB. Erosion on the shelf (Zweigel, 1998) points to a redeposition of shelf sediments into the deeper basin in the period from 19.6 – 19.0 Ma also evident by the foraminiferal fauna in the channel sediments in Hochburg1 (Figure 1) (Grunert et al., 2013). If from 19.6 – 19.0 Ma the channel was mainly fed by redeposited material from the Bavarian Shelf, sediment-supply rate from the hinterland must have dropped accordingly within this period to maintain the relatively constant and low SARs. Consistently, Kuhlemann (2000) described on the Egerian/Eggenburgian boundary a ∼45% decrease in sediment-supply rates from the Eastern Alps and a decrease of ∼35% in rates from the Central Alps.
Zweigel (1998) explained her findings on the shelf (sediment starvation, an angular unconformity, uplift in the northern part of the NAFB, decrease in sea level, deepening of the basin at the axis) with the visco-elastic relaxation of the European Plate that has caused an uplift of the forebulge, propagation of the bulge toward the orogenic front and a decrease in elevation in the hinterland. This would explain the decrease in sea level, the erosion and redeposition of older foreland sediments into the deeper basin through uplift and subareal exposure of parts of the shelf, and the decrease in sediment-supply rates and grain size related to a decrease in elevation in the Alpine hinterland. Zweigel’s (1998) model is further in line with the ceasing of northward progradation of the Eastern Alpine front during the UPF (Hinsch, 2013). The uplift and progradation of the forebulge does not require a northward progradation of the thrust front as the stress relaxation of the lithospheric plate is dependent on temperature, rheology, and initial stress (Beaumont, 1981). The doubling in lag times in apatite fission track ages from the proximal archives of the paleo-Inn from 2–4 Ma in Aquitanian to 6–8 Ma in Burdigalian sediments (Kuhlemann et al., 2006) further support the idea of a relief reduction in the hinterland. We therefore interpret the BHU as the result of a period of non-sedimentation on the overbanks and, likely, in the channel, followed by a period when the channel was fed by remobilized shelf sediments. Grunert et al. (2013) pointed out that the channel in Hochburg1 (Figure 1) cuts into the UPF, deposited middle Eggenburgian strata but lower Eggenburgian strata is missing. Therefore, we suggest that the period of non-sedimentation extends over the entire early Eggenburgian.
After the mfs at 19 Ma, the SAR indicates a 8-fold increase compared to the geobody 5 (Figure 10, 4.5-fold increase compared to geobody 3). During this period – the beginning of the Upper Marine Molasse – channel sedimentation terminated and hemipelagic sedimentation (Figures 2–4) was established (middle Eggenburgian), which was replaced by clinoform progradation from the southern margin into the basin in the late Eggenburgian. These clinoforms indicate a sediment transport direction roughly from S to N (Figures 2, 7 and Supplementary Figure S1) (Grunert et al., 2013). It is likely that the clinoform progradation caused the tremendous increase in the SAR from 19 to 18.1 Ma (Figure 10).
During the period from 19.0 to 18.1 Ma, the basin shallowed from 1,000 – 1,500 m water-depth (Grunert et al., 2013) to water-depths <200 m (Grunert et al., 2012). The basin was transformed from an underfilled foreland basin (characterized by wedge-shaped deposits) to a filled one (sedimentary deposits tabular) (Figure 2), an evolution that occurred ∼11 Ma earlier in the Swiss part of the NAFB (Sinclair, 1997). The shallowing trend cannot be explained by eustatic sea-level fall (Haq et al., 1987) or a drastic change in subsidence patters in the basin (Genser et al., 2007). Instead, the basin was filled-up by sediments deposited by prograding clinoforms (Figures 2, 10). The migration direction of the clinoforms (from S to N, Figure 2 and Supplementary Figure S1) indicate a southern source. Detrital zircon U-Pb ages further suggest a change in provenance, when compared to the underlying UPF (Sharman et al., 2018). The provenance change and the predominantly northward directed sediment supply is consistent with redeposition of the Augenstein Formation on top of today’s Northern Calcareous Alps (Frisch et al., 2001).
Two of the four expected external forcings are mirrored in the SARs of the Oligocene/Miocene Upper Austrian NAFB; the visco-elastic relaxation of the European Plate at 19.6 – 19 Ma and the unroofing and redeposition of the Augenstein Formation from 19.0 Ma onward. However, our data do not record the initially hypothesized doubling in SAR in connection with the external signals of the exhumation of the Lepontine Dome and the Tauern Window. Both signals were described within the proximal sedimentary archives in the Swiss NAFB (Schlunegger and Norton, 2015) and the south-east German NAFB (Figure 4; Ganss, 1977). In case of the external forcing of the Lepontine Dome, signal shredding may have occurred within the fluvial sediment-transfer zone. Sediments traveled a distance of ∼500–600 km from the proximal archives into the deep-marine sink. The intermittent basins, the Swiss and German NAFB, created transient accommodation space along the sediment-routing system in which the excessive sediment load was stored (Kuhlemann and Kempf, 2002) and, hence, the tectonic signal is not manifested in the SARs of the marine transfer zone of the study area.
The increase in SAR of ∼65–100% (Ganss, 1977) described from the deep-marine section (Wenger, 1987) of the Chiemgau Fan (Figure 4) and related to the exhumation of the Tauern Window in the Eastern Alps is also not recorded in our SAR results. At present, the Chiemgau Fan is located merely ∼70 km south-west of our research area (Figure 4). This implies that the Puchkirchen channel system has been very efficient in bypassing sediment. The channel system is characterized by low sinuosity (1.05 – 1.5; De Ruig and Hubbard, 2006) and the absence of avulsions (Hubbard et al., 2009) throughout the >7.4 Myrs of channel activity, possibly due to the lack of available space in the narrow (<20 km) foreland (Hubbard et al., 2009). These channel characteristics may increase bypass efficiency through the reduction of areas of sediment deposition, such as channel-avulsion strata and lateral accretion at inner meander bends. The bypass efficiency of the system may be an additional reason for the non-recording of the signal from Lepontine-Dome exhumation.
After the reorganization of the NAFB at 19 Ma, resulting in the termination of channel sedimentation and the decrease of bypass efficiency of the sediment-routing system, the basin in the study area evolved from the marine transfer zone to the marine, terminal sediment sink. Hence, the sedimentary archive in the Upper Austrian NAFB was able to record the redeposition of the Augenstein Formation.
Geodynamic Implications
With the new stratigraphic results, we are able to further constrain the evolution of the basin. The NSU formed between 28.1 (Soliman, 2012) and 26.9 Ma (Figure 14). Masalimova et al. (2015) suggested a tectonically induced oversteepening of the northern basin slope due to a deepening of the basin axis. A temporal correlation exists with a northward advance of the Alpine thrust front (Kuhlemann and Kempf, 2002) as well as the final nappe stacking and crustal thickening in the Eastern Alps (Frisch et al., 2000). Both processes lead to an extra load onto the European Plate and could account for the basin deepening.
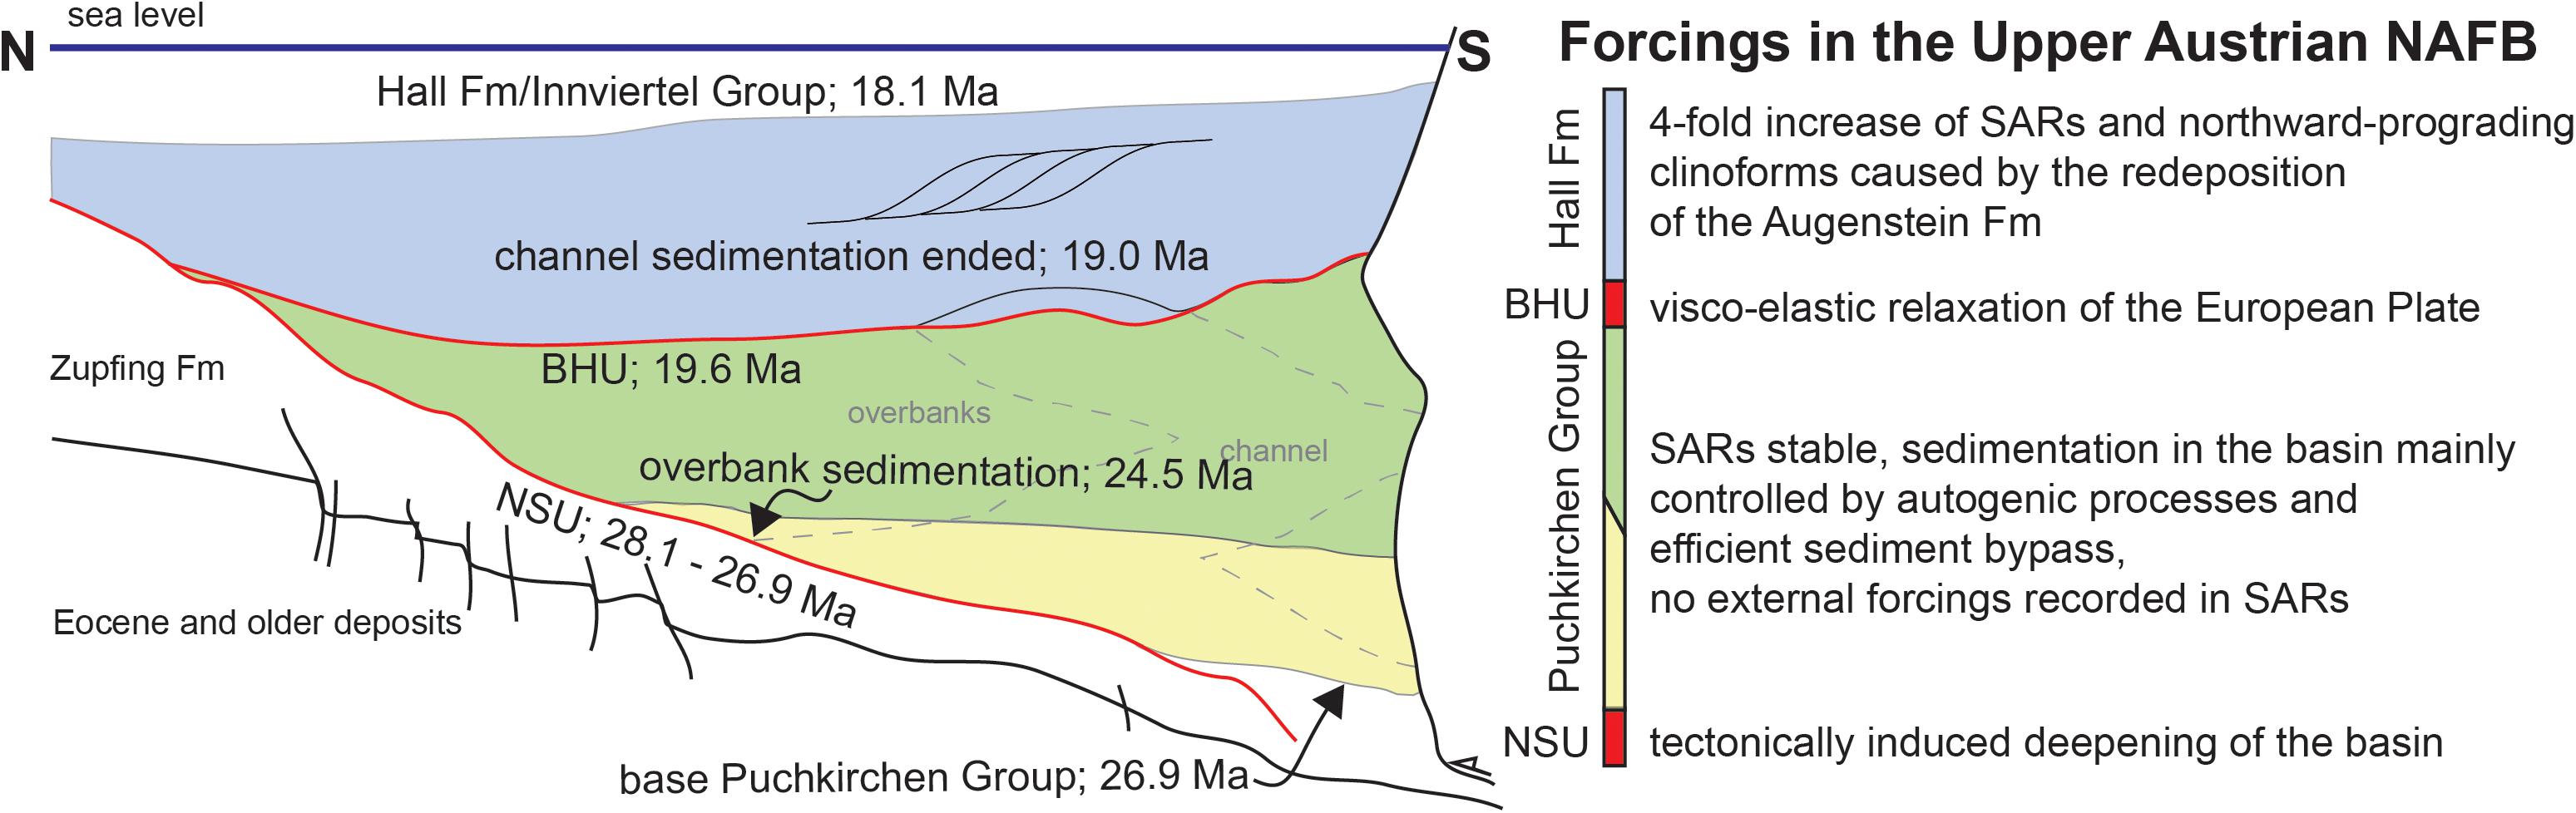
Figure 14. Schematic cross section through the Upper Austrian NAFB, with the Puchkirchen Group (yellow and green) and the Hall Fm (blue) and the dominating processes in the basin. Important steps in basin evolution were newly dated with the NSU (lower red line) being established at 28.1 – 26.9 Ma. Puchkirchen Group sedimentation started at 26.9 Ma in the axial part of the basin and at 24.5 Ma on the overbanks. The BHU (upper red line) is now dated to 19.6 – 19.0 Ma and the termination of channel sedimentation to 19.0 Ma. The Hall Fm (19.6 – 18.1 Ma) recorded the filling of the basin. See text for discussion.
During the deposition of the Puchkirchen Group, sedimentation rates in the basin were mainly controlled by autogenic processes (Figure 14). However, minor tectonic activity is evident in the basin on the southern slope where Penninic and Helvetic thrust sheets overthrusted and partly incorporated Puchkirchen strata (Covault et al., 2009; Hinsch, 2013). The northward progradation of the Alpine front ceased in the UPF and the deformation stepped back into the orogenic wedge (Hinsch, 2013).
The northern NAFB was uplifted (Zweigel, 1998) at 19.6–19.0 Ma, reflected in the change in sediment-transport direction (Figures 2, 4, 14). The Puchkirchen channel consistently funneled sediments to the east (De Ruig and Hubbard, 2006) indicating an eastward-directed slope in the basin. The northward migration of the clinoforms in the HFM (Figure 2 and Supplementary Figure S1) indicate that either the deep eastern basin part was cut off from the Puchkirchen Trough or the eastern part was uplifted. In the upper HFM (19.0–18.1 Ma), the Upper Austrian NAFB turned from an underfilled basin to a filled one further indicating an absence of subsidence (Figure 14). In contrast, the Southern Alpine Foreland Basin (Venetian and Friuli Basin) of the Eastern Alps from late Burdigalian (∼17 Ma) onward experienced higher subsidence rates and South-Alpine thrusts emerged (Mellere et al., 2000). These findings might indicate that the former pro-wedge foreland basin, the NAFB, was turned into a retro-wedge position, and the former retro-wedge basin, the Southern Alpine Foreland Basin, into a pro-wedge one. Taking this interpretation further, our and Zweigel’s (1998) findings could be interpreted as the surface expression of the postulated northward retreat and tearing event of European lithospheric mantle underneath the Eastern Alps at 25–20 Ma (Handy et al., 2015) as part of an early Miocene switch in subduction polarity to present northward subduction of the Adriatic Plate (Lippitsch et al., 2003). However, the subduction polarity switch and the exact timing and geometry of slab tearing are subject of extensive ongoing research (Handy et al., 2015, ongoing research of the Priority Program “SPP - Mountain building processes in 4D” of the German Research Foundation). At the current stage, the model of a slab polarity switch fails to explain the uplift of the forebulge in the German NAFB (Zweigel, 1998) and the redeposition of shelf strata into the deeper basin. Therefore, at present we prefer the model of visco-elastic relaxation of the lithosphere (Zweigel, 1998) to explain our results.
Conclusion
The results from the analysis of foraminifera, calcareous nannoplankton, geochemistry (TOC, S, CaCO3, δ13Ccarb) and spatially averaged SARs provide new constraints for the evolution of the Upper Austrian NAFB. Deep-marine sedimentation in the basin started with the Zupfing Formation (NP24), the Puchkirchen Group formed during NP25 to NN2 (26.9 – 19.6 Ma), and the Hall Formation accumulated during NN2 – NN3 (19.6 – 18.1 Ma). Deposits of the Puchkirchen Group are diachronic between the central basin axis and the northern overbanks. The differentiation between Upper and Lower Puchkirchen Formation first postulated by Papp and Steininger (1975) and perpetuated in most following studies proved to be difficult to identify and facies dependent.
Both large-scale unconformities in the basin were dated. The NSU was established between 28.1 – 26.9 Ma, possibly due to a tectonically induced oversteepening of the basin caused by an extra load onto the European Plate either related to a thrust front progradation or the final nappe stacking period in the Eastern Alps. The BHU (19.6 – 19.0 Ma) resulted from a period of non-sedimentation in the basin, followed by a period of redeposition of sediments from the shelf in Bavaria (Grunert et al., 2013).
The results of our SAR calculation show changes in SARs which are possibly related to two of the four expected tectonic forcings in the Oligocene/Miocene Upper Austrian NAFB. We did not detect the hypothesized doubling of SAR caused by the exhumation of the Lepontine Dome (Central Alps) and the Tauern Window (Eastern Alps), which is present in proximal (Bavarian and Swiss) sediment archives. These signals were either ‘shredded’ in the foreland during long (500–600 km) eastward sediment transport or not recorded in the deep-marine setting due to efficient sediment bypass within the submarine channel system.
A change in the foraminiferal assemblages suggests sediment reworking on the shelf and stable SARs despite a sea-level fall from 19.6-19.0 Ma. This period of sediment remobilization is interpreted as the result of the visco-elastic relaxation of the European Plate. This relaxation induced uplift in the shelf area of the basin and a decrease in relief in the hinterland, leading to stable SARs by the enhanced input of reworked shelf sediment.
The maximum SARs from 19.0 Ma onward are interpreted to result from unroofing and redeposition of the Augenstein Formation. This interpretation is furthermore supported by a shift in sediment-transport direction from east to north via northward prograding clinoforms and a major shift in sediment provenance (Sharman et al., 2018). During this time, the study area was transformed from a deep-marine transfer zone to a final sediment sink, efficiently preserving the tectonic signal in the SARs.
In the Hall Formation (19.6 – 18.1 Ma), the Upper Austrian NAFB experienced major changes in basin geometry (from underfilled to filled), subsidence, drainage network, and the ceasing of deformation along the Alpine thrust front (Hinsch, 2013). These changes may point to a large-scale orogen-wide reorganization triggered by a change in slab polarity (Lippitsch et al., 2003; Handy et al., 2015) which turned the former pro-wedge (>19.0 Ma) Upper Austrian NAFB into a retro-wedge setting.
Data Availability Statement
All datasets generated for this study are included in the article/Supplementary Material.
Author Contributions
JH and GF wrote the manuscript with major contributions from PG, GA, and AB. JH and GF drew the figures. GF carried out the foraminiferal analyses under the supervision of PG. GA carried out the calcareous nannoplankton analyses. JH undertook the interpretation of the seismic-reflection data and sediment-volume calculation. AB developed the project idea and provided funding.
Funding
RAG Austria AG provided funding for this study.
Conflict of Interest
The authors declare that the research was conducted in the absence of any commercial or financial relationships that could be construed as a potential conflict of interest.
The reviewer RS declared a past co-authorship with one of the authors PG to the handling Editor.
Acknowledgments
We would like to thank the RAG Austria AG for providing the 3D seismic-reflection data set and access to the samples. Claudia Puschenjak (University of Graz) is thanked for Leco analysis. Prof. Joachimski (GeoZentrum Nordbayern, University of Nürnberg-Erlangen) coordinated the isotopic analysis. Schlumberger is acknowledged for the donation of the Petrel (∗) license. JH would like to thank Schlumberger’s Support for their help and the Deutsche Bahn for unexpected extension of working time. We thank Mark Handy for comments on an earlier version of the manuscript. We also thank R. Sachsenhofer and J. Lorenzo-Trueba, for their constructive criticism and Associate Editor JF for carefully handling the manuscript.
Supplementary Material
The Supplementary Material for this article can be found online at: https://www.frontiersin.org/articles/10.3389/feart.2019.00302/full#supplementary-material
References
Agnini, C., Fornaciari, E., Raffi, I., Catanzariti, R., Pälike, H., Backman, J., et al. (2014). Biozonation and biochronology of Paleogene calcareous nannofossils from low and middle latitudes. Newslett. Stratigr. 47, 131–181. doi: 10.1127/0078-0421/2014/0042
Amos, K. J., Peakall, J., Bradbury, P. W., Roberts, M., Keevil, G., and Gupta, S. (2010). The influence of bend amplitude and planform morphology on flow and sedimentation in submarine channels. Mar. Pet. Geol. 27, 1431–1447. doi: 10.1016/j.marpetgeo.2010.05.004
Aubry, M. (1988). Handbook of Cenozoic Calcareous Nannoplankton, book 2, Ortholithae (Holococcoliths, Ceratoliths, Ortholiths and Other). American Museum of Natural History. New York, NY: Micropaleontol Press.
Aubry, M.-P. (1984). Handbook of Cenozoic Calcareous Nannoplankton, American Museum of Natural History. Newyork, NY: Micropaleontology Press.
Aubry, M.-P. (1989). Handbook of Cenozoic Calcareous Nannoplankton: Ortholithae (Pentaliths, and Others); Heliolithae (Fasciculiths, Sphenoliths and Others). New York, NY: Micropaleontology Press.
Aubry, M.-P. (1999). Handbook of Cenozoic Calcareous Nannoplankton: Book 5: Heliolithae (Zygoliths and Rhabdoliths), American Museum of Natural History. New York, NY: Micropaleontology Press.
Aubry, M.-P. (2013). Cenozoic Coccolithophores: Braarudosphaerales. New York, NY: Micropaleontology Press.
Backman, J., Raffi, I., Rio, D., Fornaciari, E., and Pälike, H. (2012). Biozonation and biochronology of miocene through pleistocene calcareous nannofossils from low and middle latitudes. Newslett. Stratigr. 45, 221–244. doi: 10.1127/0078-0421/2012/0022
Bernhardt, A., Stright, L., and Lowe, D. R. (2012). Channelized debris-flow deposits and their impact on turbidity currents: the puchkirchen axial channel belt in the Austrian Molasse Basin. Sedimentology 59, 2042–2070. doi: 10.1111/j.1365-3091.2012.01334.x
Boote, D., Sachsenhofer, R., Tari, G., and Arbouille, D. (2018). Petroleum provinces of the paratethyan region. J. Pet. Geol. 41, 247–297. doi: 10.1111/jpg.12703
Cahuzac, B., and Poignant, A. (1997). Essai de biozonation de l’oligo-miocène dans les bassins européens à l’aide des grands foraminifères néritiques. Bull. Soc. Géologique France 168, 155–169.
Carvajal, C., and Steel, R. (2012). “Source-to-sink sediment volumes within a tectono-stratigraphic model for a laramide shelf-to-deep-water basin: methods and results”, in Tectonics of Sedimentary Basins, eds C. Busby and A. Azor (Blackwell Publishing Ltd.), 131–151. doi: 10.1002/9781444347166.ch7
Cicha, I., Rogl, F., and Rupp, C. (1998). Oligocene-Miocene Foraminifera of the Central Paratethys. Philadelphia, PA: W Kramer Associates Inc.
Clift, P., and Giosan, L. (2014). Sediment fluxes and buffering in the post-glacial Indus Basin. Basin Res. 26, 369–386. doi: 10.1111/bre.12038
Clift, P. D. (2006). Controls on the erosion of Cenozoic Asia and the flux of clastic sediment to the ocean. Earth Planet. Sci. Lett. 241, 571–580. doi: 10.1016/j.epsl.2005.11.028
Ćorić, S., and Spezzaferri, S. (2009). ZIEG - 1: Mikropaläontologische und Biostratigraphische Auswertung (750m – 1500m).
Covault, J. A., Hubbard, S. M., Graham, S. A., Hinsch, R., and Linzer, H.-G. (2009). Turbidite-reservoir architecture in complex foredeep-margin and wedge-top depocenters, Tertiary Molasse foreland basin system, Austria. Mar. Pet. Geol. 26, 379–396. doi: 10.1016/j.marpetgeo.2008.03.002
Cramer, B., Toggweiler, J., Wright, J., Katz, M., and Miller, K. (2009). Ocean overturning since the Late Cretaceous: inferences from a new benthic foraminiferal isotope compilation. Paleoceanography 24:PA4216,
De Ruig, M. J., and Hubbard, S. M. (2006). Seismic facies and reservoir characteristics of a deep-marine channel belt in the Molasse foreland basin. Puchkirchen Formation, Austria. AAPG Bull. 90, 735–752. doi: 10.1306/10210505018
DeCelles, P. G., and Giles, K. A. (1996). Foreland basin systems. Basin Res. 8, 105–123. doi: 10.1046/j.1365-2117.1996.01491.x
Favaro, S., Schuster, R., Handy, M. R., Scharf, A., and Pestal, G. (2015). Transition from orogen-perpendicular to orogen-parallel exhumation and cooling during crustal indentation—key constraints from 147Sm/144Nd and 87Rb/87Sr geochronology (Tauern Window. Alps). Tectonophysics 665, 1–16. doi: 10.1016/j.tecto.2015.08.037
Fildani, A., Normark, W. R., Kostic, S., and Parker, G. (2006). Channel formation by flow stripping: large-scale scour features along the monterey east channel and their relation to sediment waves. Sedimentology 53, 1265–1287. doi: 10.1111/j.1365-3091.2006.00812.x
Frisch, W., Dunkl, I., and Kuhlemann, J. (2000). Post-collisional orogen-parallel large-scale extension in the Eastern Alps. Tectonophysics 327, 239–265. doi: 10.1016/s0040-1951(00)00204-3
Frisch, W., Kuhlemann, J., Dunkl, I., and Székely, B. (2001). The dachstein paleosurface and the augenstein formation in the northern calcareous Alps–a mosaic stone in the geomorphological evolution of the Eastern Alps. Intern. J. Earth Sci. 90, 500–518. doi: 10.1007/s005310000189
Galović, I., and Young, J. (2012). Revised taxonomy and stratigraphy of middle miocene calcareous nannofossils of the Paratethys. Micropaleontology 58, 305–334.
Ganss, O. (1977). Geologische Karte von Bayern 1: 25 000, Erläuterungen zum Blatt Nr. 8140 Prien a. Chiemsee und Blatt Nr. 8141 Traunstein. Germany: Bayerisches Geologisches Landesamt.
Garefalakis, P., and Schlunegger, F. (2019). Tectonic processes, variations in sediment flux, and eustatic sea level recorded by the 20 Myr old Burdigalian transgression in the Swiss Molasse basin. Solid Earth 10, 2045–2072.
Genser, J., Cloetingh, S. A., and Neubauer, F. (2007). Late orogenic rebound and oblique Alpine convergence: new constraints from subsidence analysis of the Austrian Molasse basin. Glob. Planet. Change 58, 214–223. doi: 10.1016/j.gloplacha.2007.03.010
Gradstein, F., Ogg, J., Schmitz, M., and Ogg, G. (2012). The Geologic Time Scale 2012. Amsrerdam: Elsevier.
Gross, D., Sachsenhofer, R., Bechtel, A., Gratzer, R., Grundtner, M. L., Linzer, H. G., et al. (2018). Petroleum systems in the Austrian sector of the North Alpine Foreland Basin: an overview. J. Pet. Geol. 41, 299–317. doi: 10.1111/jpg.12704
Grunert, P., Auer, G., Harzhauser, M., and Piller, W. E. (2015). Stratigraphic constraints for the upper Oligocene to lower miocene puchkirchen group (north alpine foreland basin. central paratethys). Newslett. Stratigr. 48, 111–133. doi: 10.1127/nos/2014/0056
Grunert, P., Hinsch, R., Sachsenhofer, R. F., Bechtel, A., Ćorić, S., Harzhauser, M., et al. (2013). Early Burdigalian infill of the puchkirchen trough (north alpine foreland basin, central paratethys): facies development and sequence stratigraphy. Mar. Pet. Geol. 39, 164–186. doi: 10.1016/j.marpetgeo.2012.08.009
Grunert, P., Soliman, A., Ćorić, S., Roetzel, R., Harzhauser, M., and Piller, W. E. (2012). Facies development along the tide-influenced shelf of the burdigalian seaway: an example from the ottnangian stratotype (early miocene, middle burdigalian). Mar. Micropaleontol. 84, 14–36. doi: 10.1016/j.marmicro.2011.11.004
Grunert, P., Soliman, A., Ćorić, S., Scholger, R., Harzhauser, M., and Piller, W. E. (2010). Stratigraphic re-evaluation of the stratotype for the regional ottnangian stage (central paratethys, middle burdigalian). Newslett. Stratigr. 44, 1–16. doi: 10.1127/0078-0421/2010/0001
Guillocheau, F., Rouby, D., Robin, C., Helm, C., and Rolland, N. (2012). Quantification and causes of the terrigeneous sediment budget at the scale of a continental margin: a new method applied to the Namibia-South Africa margin. Basin Res. 24, 3–30. doi: 10.1111/j.1365-2117.2011.00511.x
Gulick, S. P., Jaeger, J. M., Mix, A. C., Asahi, H., Bahlburg, H., Belanger, C. L., et al. (2015). Mid-Pleistocene climate transition drives net mass loss from rapidly uplifting st. elias mountains, alaska. Proc. Natl. Acad. Sci. U.S.A. 112, 15042–15047. doi: 10.1073/pnas.1512549112
Handy, M. R., Ustaszewski, K., and Kissling, E. (2015). Reconstructing the Alps–Carpathians–Dinarides as a key to understanding switches in subduction polarity, slab gaps and surface motion. Intern. J. Earth Sci. 104, 1–26. doi: 10.1007/s00531-014-1060-3
Haq, B. U., Hardenbol, J., and Vail, P. R. (1987). Chronology of fluctuating sea levels since the Triassic. Science 235, 1156–1167. doi: 10.1126/science.235.4793.1156
Hinsch, R. (2008). New insights into the Oligocene to Miocene geological evolution of the Molasse Basin of Austria. Oil Gas Eur. Magazine 34, 138–143.
Hinsch, R. (2013). Laterally varying structure and kinematics of the molasse fold and thrust belt of the central eastern alps: implications for exploration. AAPG Bull. 97, 1805–1831. doi: 10.1306/04081312129
Holcová, K. (2009). Morphometrical variability of Helicosphaera ampliaperta (calcareous nannoplankton) in the Central Paratethys: biostratigraphic and paleogeographic applications. Neues Jahrbuch Geol. Paläontologie Abhandlungen 253, 341–356. doi: 10.1127/0077-7749/2009/0253-0341
Huang, H., Imran, J., and Pirmez, C. (2012). The depositional characteristics of turbidity currents in submarine sinuous channels. Mar. Geol. 329, 93–102. doi: 10.1016/j.margeo.2012.08.003
Hubbard, S. M., de Ruig, M. J., and Graham, S. A. (2009). Confined channel-levee complex development in an elongate depo-center: deep-water Tertiary strata of the Austrian Molasse basin. Mar. Pet. Geol. 26, 85–112. doi: 10.1016/j.marpetgeo.2007.11.006
Janz, H., and Vennemann, T. W. (2005). Isotopic composition (O, C, Sr, and Nd) and trace element ratios (Sr/Ca, Mg/Ca) of Miocene marine and brackish ostracods from North Alpine Foreland deposits (Germany and Austria) as indicators for palaeoclimate. Palaeogeogr. Palaeoclimatol. Palaeoecol. 225, 216–247. doi: 10.1016/j.palaeo.2005.06.012
Jerolmack, D. J., and Paola, C. (2010). Shredding of environmental signals by sediment transport. Geophys. Res. Lett. 37, L19401.
Jin, J., Aigner, T., Luterbacher, H., Bachmann, G. H., and Müller, M. (1995). Sequence stratigraphy and depositional history in the south-eastern German Molasse Basin. Mar. Pet. Geol. 12, 929–940. doi: 10.1016/0264-8172(95)98856-z
Kremer, C. H., McHargue, T., Scheucher, L., and Graham, S. A. (2018). Transversely-sourced mass-transport deposits and stratigraphic evolution of a foreland submarine channel system: deep-water tertiary strata of the Austrian Molasse Basin. Mar. Pet. Geol. 92, 1–19. doi: 10.1016/j.marpetgeo.2018.01.035
Kuhlemann, J. (2000). Post-collisional sediment budget of circum-Alpine basins (Central Europe). Mem. Sci. Geol. Padova 52, 1–91.
Kuhlemann, J., Dunkl, I., Brügel, A., Spiegel, C., and Frisch, W. (2006). From source terrains of the eastern alps to the molasse basin: detrital record of non-steady-state exhumation. Tectonophysics 413, 301–316. doi: 10.1016/j.tecto.2005.11.007
Kuhlemann, J., and Kempf, O. (2002). Post-Eocene evolution of the north alpine foreland basin and its response to alpine tectonics. Sedimentary Geol. 152, 45–78. doi: 10.1016/s0037-0738(01)00285-8
Küpper, I., and Steininger, F. (1975). Faziostratotypen der puchkirchener schichtengruppe. Chronostratigr. Neostratotypen 5, 205–229.
Lemcke, K. (1988). Das bayerische Alpenvorland vor der Eiszeit. Geologie von Bayern I. Stuttgart: Schweizerbart.
Lippitsch, R., Kissling, E., and Ansorge, J. (2003). Upper mantle structure beneath the Alpine orogen from high-resolution teleseismic tomography. J. Geophys. Res.: Solid Earth 108, 2376.
Marshall, J. D. (1992). Climatic and oceanographic isotopic signals from the carbonate rock record and their preservation. Geol. Magazine 129, 143–160. doi: 10.1017/s0016756800008244
Martini, E. (1971). “Standard tertiary and quaternary calcareous nannoplankton zonation,” in Proceedings of the Second Planktonic Conference Roma, 1970 (Roma: Edizioni Tecnoscienza), 739–785.
Martini, E. (1981). Nannoplankton in der Ober-Kreide, im Alttertiär und im tieferen Jungtertiär von Süddeutschland und dem angrenzenden Österreich. Geol. Bavarica 82, 345–356.
Masalimova, L. U., Lowe, D. R., Mchargue, T., and Derksen, R. (2015). Interplay between an axial channel belt, slope gullies and overbank deposition in the puchkirchen formation in the molasse basin. Aust. Sedimentol. 62, 1717–1748. doi: 10.1111/sed.12201
McArthur, J., Howarth, R., and Shields, G. (2012). “Strontium isotope stratigraphy,” in The Geologic Time Scale, ed. F. M. Gradstein (Elsevier: Berlin), 127–144.
Mellere, D., Stefani, C., and Angevine, C. (2000). Polyphase tectonics through subsidence analysis: the oligo-miocene venetian and friuli basin, north-east italy. Basin Res. 12, 159–182. doi: 10.1046/j.1365-2117.2000.00120.x
Murray, J. (2006). Ecology and Applications of Benthic Foraminifera. Cambridge: Cambridge University Press. doi: 10.1017/CBO9780511535529
Murray, A. B., Lazarus, E., Ashton, A., Baas, A., Coco, G., Coulthard, T., et al. (2009). Geomorphology, complexity, and the emerging science of the Earth’s surface. Geomorphology 103, 496–505. doi: 10.1016/j.geomorph.2008.08.013
Papp, A. (1975). “Die Grossforaminiferen des egerien,” in Chronostratigraphie und Neostratotypen Miozän der Zentralen Paratethys, eds T. Báldi and J. Seneš (Bratislava: VEDA), 289–307.
Papp, A., and Steininger, F. (1975). “Die Entwicklung der Puch kirchener Schichtengruppe, der Melker und der Michelstettener Schichten in Österreich,” in Chronostratigraphie und Neostratotypen, Miozän der Zentralen Paratethys 5: OM”- Egerian. Die Egerer, Pouzdřaner, Puchkirchener Schichtengruppe und die Bretkaer Formation, ed. Brestenská, E. (Bratislava: Verlag der Slowakischen Akademie der Wissenschaften), 71–75.
Piller, W. E., Harzhauser, M., and Mandic, O. (2007). Miocene central paratethys stratigraphy–current status and future directions. Stratigraphy 4, 151–168.
Reiser, H. (1987). Die Foraminiferen der bayerischen oligozän-molasse systematik, stratigraphie und paläobathymetrie. Zitteliana 16:340.
Rögl, F. (1998). Palaeogeographic considerations for Mediterranean and Paratethys seaways (Oligocene to Miocene). Annalen Naturhistorischen Museums Wien. Serie Mineralogie Petrographie Geol. Paläontol. Anthropologie Prähistorie 99, 279–310.
Rögl, F., Hochuli, P., and Muller, C. (1979). Oligocene–early miocene stratigraphic correlations in the molasse basin of austria. Ann. Geol. Pays Helleniques. Tome Hors Series 30, 1045–1050.
Romans, B. W., Castelltort, S., Covault, J. A., Fildani, A., and Walsh, J. (2016). Environmental signal propagation in sedimentary systems across timescales. Earth Sci. Rev. 153, 7–29.
Sachsenhofer, R., Popov, S., Bechtel, A., Coric, S., Francu, J., Gratzer, R., et al. (2017). Oligocene and lower miocene source rocks in the paratethys: palaeogeographical and stratigraphic controls. Geol. Soc. Lond. Spec. Public. 464:S464.
Sachsenhofer, R. F., Leitner, B., Linzer, H.-G., Bechtler, A., Æoric, S., Gratzer, R., et al. (2010). Deposition, erosion and hydrocarbon source potential of the oligocene eggerding formation (Molasse Basin, Austria). Aust. J. Earth Sci. 103, 1–76.
Sadler, P. M., and Jerolmack, D. J. (2015). Scaling laws for aggradation, denudation and progradation rates: the case for time-scale invariance at sediment sources and sinks. Geol. Soc. Lond. Special Publ. 404, 69–88.
Scharf, A., Handy, M. R., Favaro, S., Schmid, S. M., and Bertrand, A. (2013). Modes of orogen-parallel stretching and extensional exhumation in response to microplate indentation and roll-back subduction (Tauern Window. Eastern Alps). Intern. J. Earth Sci. 102, 1627–1654. doi: 10.1007/s00531-013-0894-894
Schlunegger, F., and Castelltort, S. (2016). Immediate and delayed signal of slab breakoff in oligo/miocene molasse deposits from the european alps. Sci. Rep. 6:31010. doi: 10.1038/srep31010
Schlunegger, F., and Norton, K. P. (2015). Climate vs. tectonics: the competing roles of Late Oligocene warming and Alpine orogenesis in constructing alluvial megafan sequences in the North Alpine foreland basin. Basin Res. 27, 230–245. doi: 10.1111/bre.12070
Sharman, G. R., Hubbard, S. M., Covault, J. A., Hinsch, R., Linzer, H.-G., and Graham, S. A. (2018). Sediment routing evolution in the northern alpine foreland basin, austria: interplay of transverse and longitudinal sediment dispersal. Basin Res. 30, 426–447.
Sinclair, H. (1997). Tectonostratigraphic model for underfilled peripheral foreland basins: An Alpine perspective. Geol. Soc. Am. Bull. 109, 324–346.
Sissingh, W. (1998). Comparative tertiary stratigraphy of the rhine graben, bresse graben and molasse basin: correlation of alpine foreland events. Tectonophysics 300, 249–284.
Soliman, A. (2012). Oligocene dinoflagellate cysts from the north alpine foreland basin: new data from the eggerding formation (Austria). Geol. Carpathica 63, 49–70.
Wade, B. S., Pearson, P. N., Berggren, W. A., and Pälike, H. (2011). Review and revision of Cenozoic tropical planktonic foraminiferal biostratigraphy and calibration to the geomagnetic polarity and astronomical time scale. Earth Sci. Rev. 104, 111–142.
Wagner, L. R. (1998). Tectono-stratigraphy and hydrocarbons in the molasse foredeep of salzburg, upper and lower Austria. Geol. Soc. Lond. Special Publ. 134, 339–369.
Wenger, W. F. (1987). Die Foraminiferen des Miozän ans der bayerischen Molasse und ihre stratigraphische sowie paläogeographische Auswertung. Zitteliana 16:132.
Young, J., Bown, P., and Lees, J. (2014). Nannotax3 website. International Nannoplankton Association. Available at: http://www.mikrotax.org/Nannotax3 (accessed April 21, 2017)
Keywords: foraminiferal analysis, calcareous nannoplankton analysis, chemostratigraphy, submarine channel, Molasse Basin, environmental signal propagation, turbidity currents, time-scale invariant sediment accumulation rates
Citation: Hülscher J, Fischer G, Grunert P, Auer G and Bernhardt A (2019) Selective Recording of Tectonic Forcings in an Oligocene/Miocene Submarine Channel System: Insights From New Age Constraints and Sediment Volumes From the Austrian Northern Alpine Foreland Basin. Front. Earth Sci. 7:302. doi: 10.3389/feart.2019.00302
Received: 04 July 2019; Accepted: 31 October 2019;
Published: 28 November 2019.
Edited by:
Julie Fosdick, University of Connecticut, United StatesReviewed by:
Reinhard F. Sachsenhofer, University of Leoben, AustriaJorge Lorenzo-Trueba, Montclair State University, United States
Copyright © 2019 Hülscher, Fischer, Grunert, Auer and Bernhardt. This is an open-access article distributed under the terms of the Creative Commons Attribution License (CC BY). The use, distribution or reproduction in other forums is permitted, provided the original author(s) and the copyright owner(s) are credited and that the original publication in this journal is cited, in accordance with accepted academic practice. No use, distribution or reproduction is permitted which does not comply with these terms.
*Correspondence: Julian Hülscher, julian.huelscher@fu-berlin.de; Anne Bernhardt, anne.bernhardt@fu-berlin.de