Manifestation of Tectonic and Climatic Perturbations in Deep-Time Stratigraphy – An Example From the Paleocene Succession Offshore Western Norway
 Tor Oftedal Sømme
 Jakob Skogseid
 Patricia Embry
 Helge Løseth
- 1Equinor, Oslo, Norway
- 2Equinor, Houston, TX, United States
- 3Equinor, Trondheim, Norway
Sediment routing systems may be exposed to different external controls that can modulate long and short-term sediment delivery to nearby basins. Here we investigate a Paleocene depositional system offshore western Norway that was subjected to long-term (∼10 Myr) tectonic perturbation and significant hinterland erosion. Superimposed on this long-term uplift, the system was also subjected to a short-lived climatic perturbation, which lasted ∼200 kyr. Regional 3D seismic reflection data is integrated with high resolution borehole and biostratigraphic data to map the stratigraphic responses to these different scales of perturbations on the Paleocene system. The initiation of the tectonic perturbation is marked by an angular unconformity in seismic data at the base of the Paleocene. An increase in sediment supply followed, causing progradation of a confined shelf-slope wedge during the Middle and Late Paleocene. The end of the tectonic perturbation is marked by onlap in the lowermost Eocene and a shift from a confined to a more lateral extensive depositional system. Calculations indicate that the tectonic uplift caused an order of magnitude increase in sediment supply to the basin. This period coincided with the Paleocene-Eocene Thermal Maximum (PETM), which is documented by biostratigraphic data as a discrete event within the overall regressive system. Although the PETM has been associated with increased continental runoff in the North Atlantic, no peak in sediment supply can be resolved in the available dataset. This study shows that the system response to tectonic perturbations may vary along strike, depending on the size of the routing systems and the antecedent topography prior to hinterland uplift. A low supply system may produce a tectonically linked shelf-slope wedge that is of similar thickness as a climatically linked wedge in a high supply system. This study documents how the same routing system responded to perturbations operating at different spatial and temporal scales and may help recognize similar process-response relationships in other areas.
Introduction
Landscapes and their sediment routing systems are exposed to different tectonic and climatic perturbations affecting sediment production, transport and delivery to nearby sedimentary basins. Tectonic forcing operates on many temporal and spatial scales, from long-lived collision of continental plates, to changes in lithospheric stress, mantle dynamics and short-lived, intra-catchment fault movements. Whereas local fault activity can result in rapid changes in sediment supply (Whittaker et al., 2010), perturbations related to mantle dynamics and plate tectonic processes can cause re-arrangement of entire continent-scale fluvial networks and often result in distinct changes in basin physiography and accommodation trends that can readily be recognized in the deep-time (>10^6 yr) depositional record (e.g., Campanile et al., 2008; Baby et al., 2018). The impact of such tectonic perturbations have be inferred qualitatively by linking pulses of coarse-grained material to phases of magmatic activity (e.g., White and Lovell, 1997), and quantitatively by analyzing sediment mass budgets linked to inferred changes in onshore denudation rates (Jones et al., 2002; Tinker et al., 2008; Braun et al., 2014). Similarly, sediment production and transport related to climatic perturbations also operate at different scales, from long-lived migration of global climate belts to high-frequency perturbations within the Milankovitch band (Séranne, 1999; Peizhen et al., 2001; Watkins et al., 2018). Although high-frequency changes in climate forcing often are difficult to recognize in seismic reflection data; detailed outcrop studies have documented how these perturbations have influenced the internal dynamics of sediment routing systems (e.g., Schmitz and Pujalte, 2003; Foreman et al., 2012; Duller et al., 2019).
It is questionable to what extent and in which form a tectonic or climatic signal is transmitted to the offshore stratigraphic record (e.g., Castelltort and Van den Driessche, 2003; Forzoni et al., 2014; Romans et al., 2016; Wu et al., 2019). It is generally thought that small systems are more reactive and tend to transmit signals more effectively than larger systems that are more buffered (Allen, 2008), and recent work also suggest that the duration of the signal relative to the frequency of autogenic processes is key for preservation (Toby et al., 2019). In addition, sediment supply signals may have a significant lag-time relative to the perturbation, such that the observed stratigraphic response is out of phase with the forcing factor (Willenbring et al., 2013; Li et al., 2018).
Many studies focusing on signal characteristics from climatic and tectonic forcings are based on numerical or physical models where input parameters are known and can be tested individually with high temporal resolution. Deep-time stratigraphy is, however, often more difficult to decipher because we often lack key information about the state of the landscape that supplied sediment to the offshore basins. In addition, it is evident that both tectonic and climatic perturbations operate in concert at similar or overlapping spatial and temporal scales (Overeem et al., 2001; Mancin et al., 2009; Samanta et al., 2016), making it challenging to isolate the effect of the individual controls. This is also supported by modeling studies suggesting non-unique stratigraphic response to different forcing factors that are difficult to separate in the stratigraphic record (Burgess and Prince, 2015). A key challenge is therefore to understand how these various tectonic and climatic perturbations interact to form signals that can be recognized in the stratigraphic record. This is especially difficult in deep-time, seismic reflection data where the temporal stratigraphic resolution struggles to resolve high-frequency events.
The North Atlantic is a suitable area to investigate the interaction between tectonic and climatic perturbations on sediment routing systems. It has long been recognized that the margins along western Norway, the British Isles and eastern Greenland experienced significant tectonic uplift during the Paleocene, followed by regional subsidence during the Early Eocene (e.g., Torske, 1975; Jones and Milton, 1994; Jordt et al., 1995; Nadin and Kusznir, 1995; Riis, 1996; Stuevold and Eldholm, 1996; Dam et al., 1998; Faleide et al., 2002; Mackay et al., 2005; Praeg et al., 2005; Anell et al., 2009).
The Paleocene-Eocene transition also marks a period of major climate change known as the Paleocene-Eocene Thermal Maximum (PETM) (e.g., Svensen et al., 2004; Sluijs et al., 2007). This short-lived climatic perturbation lasted for a few hundred thousand years and has been recognized regionally in the North Atlantic, both in borehole data and in outcrops (Svensen et al., 2004; Dypvik et al., 2011; Kender et al., 2012; Kjoberg et al., 2017). Despite operating at different temporal scales, the interaction of these two perturbations is manifested in the Paleocene-Early Eocene stratigraphy offshore SW Norway.
In this study we investigate the Upper Maastrichtian-Eocene succession along the SW Norwegian margin with the goal of identifying the stratigraphic response to climatic and tectonic perturbations within the same sediment routing systems. The area of investigation covers the northern Stord Basin, the Horda Platform and the Måløy Slope (Figure 1). During the Paleocene, this area received sediment from a drainage system covering parts of southern Norway. Because the areal extent of the paleo-drainage system is believed to have been relatively fixed during the Paleocene-Eocene (Sømme et al., 2013b), this area is ideal to investigate how a single sediment routing system responds to tectonic and climatic forcing operating at different spatial and temporals scales in deep-time.
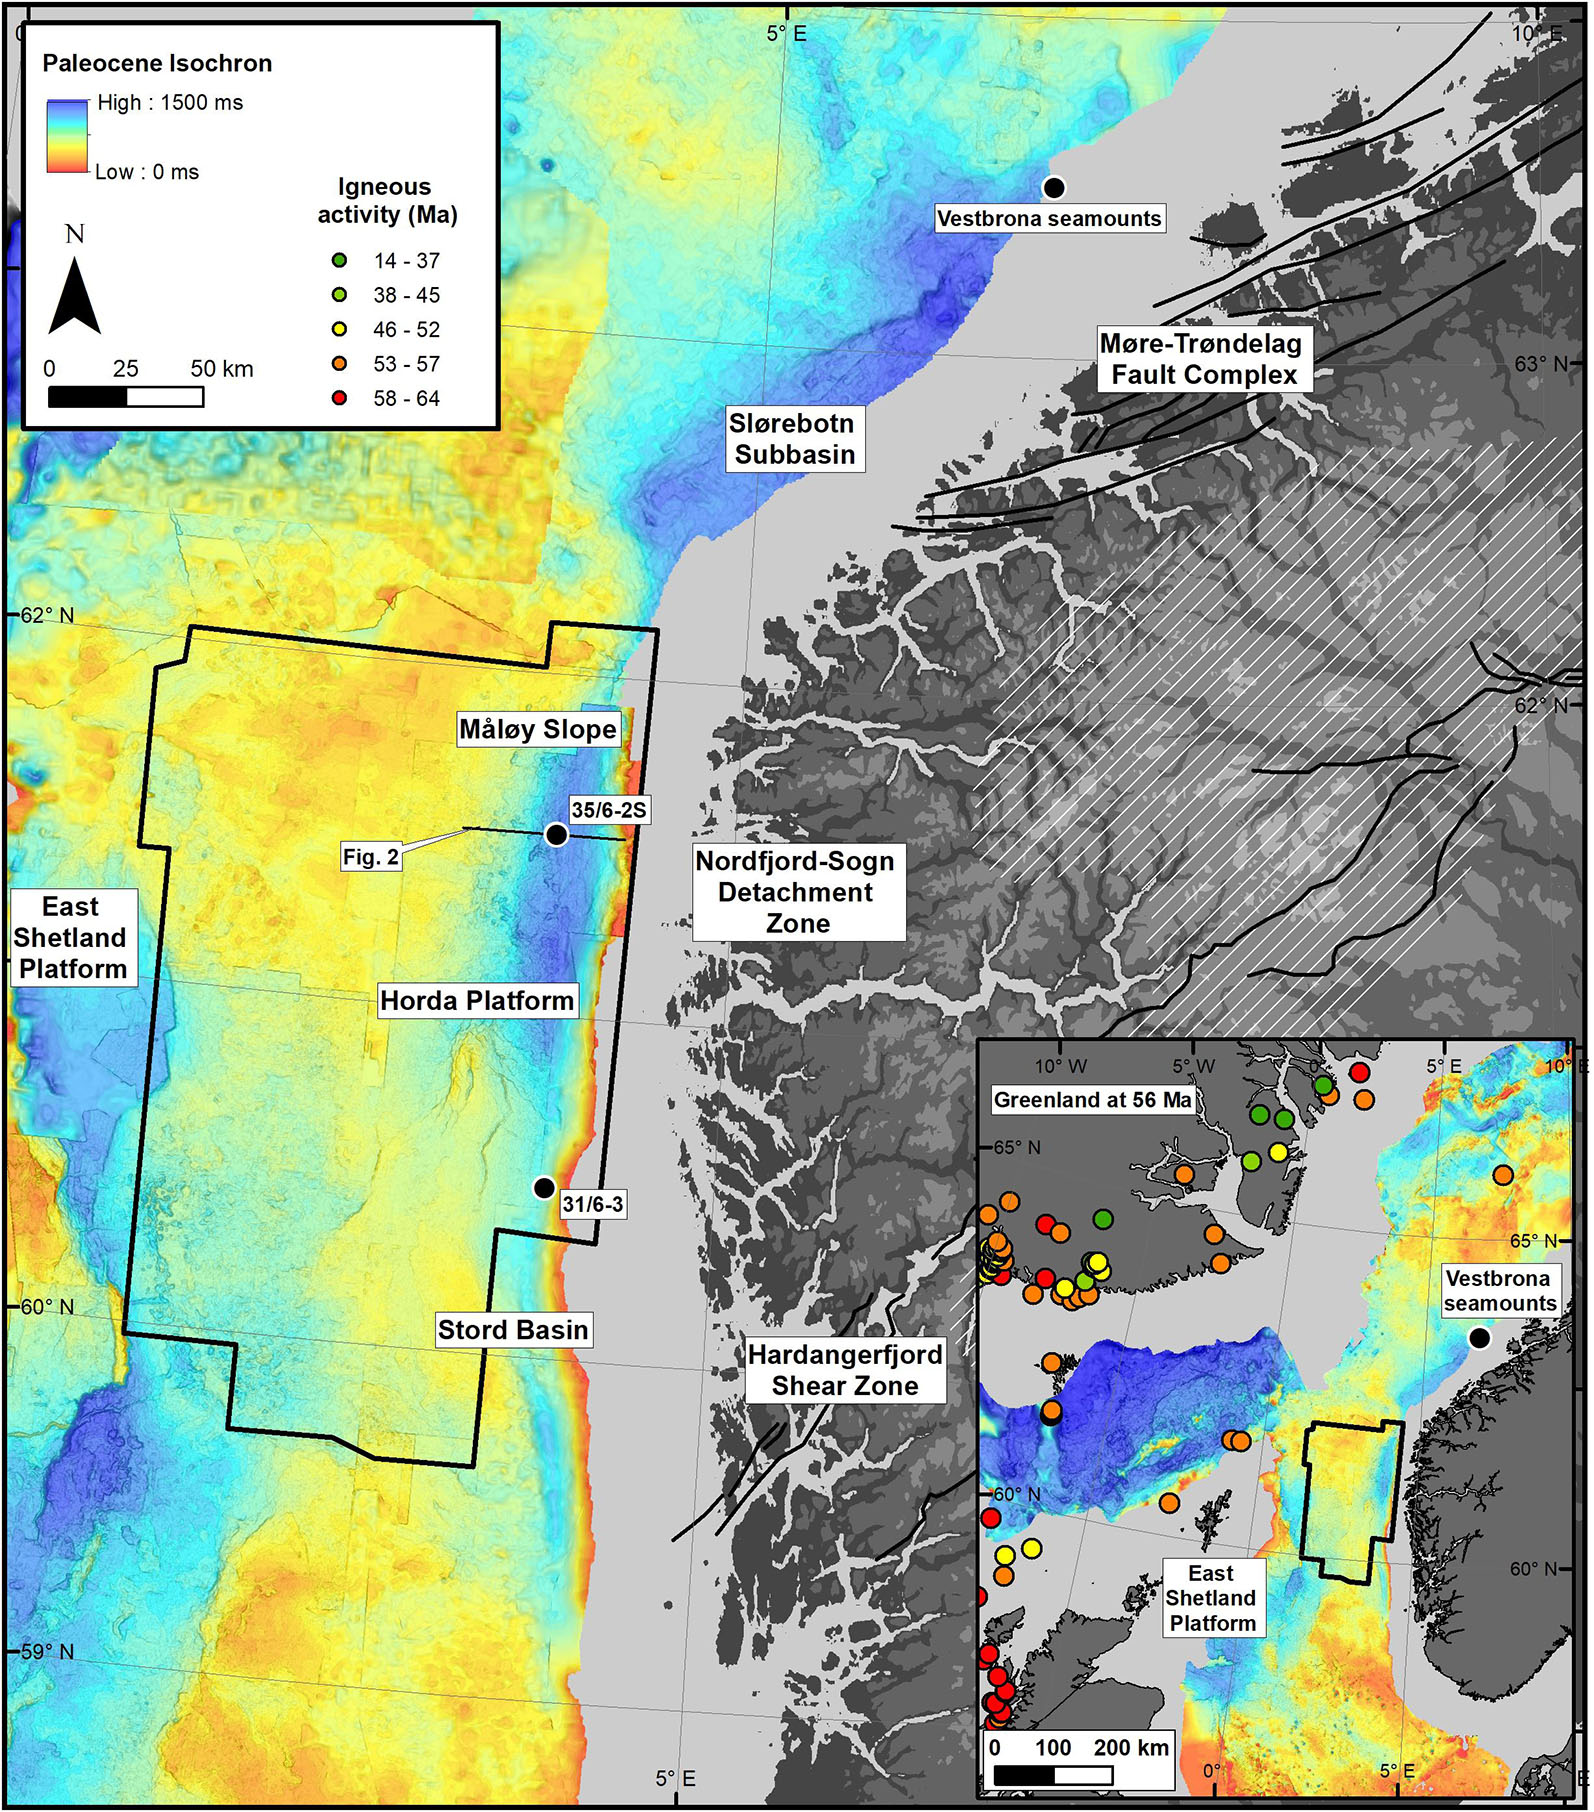
Figure 1. Overview of the study area and regional isochron map of Paleocene sediments. The black outline shows the extent of seismic survey CGG18M01 which has been used to map Paleocene and Eocene stratigraphic units. Black lines represent main faults. The NE-SW trending Hardangerfjord Shear Zone is believed to represent the most landward possible extent of the Paleocene catchment. The white hatched polygon represents the area of inferred high Paleocene topography as suggested by Sømme et al. (2013b). Inset map shows reconstructed North Atlantic plate setting at 56 Ma with the distribution of igneous ages for the North Atlantic Igneous Province (from Steinberger et al., 2019).
The main aims of this study are to: (1) identify stratigraphic characteristics of a shelf-slope wedge linked to long-term tectonic perturbation using seismic reflection and borehole data; (2) use thickness maps and biostratigraphic data to estimate sediment supply from the onshore catchment area before, during and after tectonic perturbation to investigate the response to a phase of hinterland uplift; (3) use seismic reflection data and borehole information to identify stratigraphic characteristics of a shelf-slope wedge linked to short-lived climatic perturbation during the PETM, and (4) discuss how different perturbations can be recognized in the deep-time stratigraphic record.
Geological Setting
After peak Caledonian deformation in the Devonian, the Norwegian continental margin experienced extensional collapse along a number of deep-crustal fault zones (Andersen, 1998; Fossen and Dunlap, 1998; Fossen et al., 2017), which defined the structural template for later Mesozoic basin formation and onshore topography (Gabrielsen et al., 2010; Sømme et al., 2013b). Renewed Triassic extension was characterized by fault block topography and deposition of marine, lacustrine and alluvial sediments (Steel, 1993). Regional marine incursion took place in the Early Jurassic and in the Middle Jurassic the North Sea was dominated by shallow, post-rift basins (Steel and Ryseth, 1990). Sediment was mainly delivered from the south, although the Norwegian mainland also represented an important sediment source (Morton, 1992). Renewed rifting in the North Sea started in the late Mid Jurassic and peaked in the Late Jurassic – earliest Cretaceous, when the rift axis shifted westward to the Faroe-Shetland and Møre basins. Deep-water basins formed in the central part of the rift zones, receiving sediments from local fault blocks and the nearby hinterland (Bugge et al., 2001; Martinsen et al., 2005). In the study area (Figure 1), the Upper Cretaceous succession is dominated by mudstones interbedded with relatively thin sandstone units deposited in a deep-water environment (Martinsen et al., 2005; Jackson et al., 2008). The last pulse of clastic input took place in the Turonian-Coniacian and is recognized by small channel complexes and terminal lobes in an underfilled, deep-water slope to basin floor setting on the Måløy Slope and Slørebotn Subbasin, in close proximity to the Møre-Trøndelag Fault complex (MTFC) (Sømme et al., 2013a). To the south, the Horda Platform area was probably only 200–300 m deep in the Late Cretaceous (Wien and Kjennerud, 2005), but only biogenic chalk deposits are recognized in this area. The structural trend marking the northern part of the Horda Platform and the offshore continuation of the Nordfjord-Sogn Detachment Zone (NSDZ) thus marks a long-lived change in basin physiography and sediment input along strike. Similarly, the MTFC, NSDZ, and Hardangerfjord Shear Zone (HFSZ) have likely also dictated the distribution of onshore topography, which is believed to have been highest along these long-lived fault zones (Redfield et al., 2005; Gabrielsen et al., 2010; Sømme et al., 2013b).
The Cretaceous-Paleocene boundary is marked by a change in basin physiography in the study area and elsewhere in the North Sea (Jarsve et al., 2014), marking the transition from fine-grained siliciclastic and carbonate dominated deposition in an underfilled basin setting, to regional input of coarse siliciclastic sediments in an overfilled setting (Dmitrieva et al., 2018). For the first time since the Late Jurassic, sediment supply from mainland Norway was higher than the available offshore accommodation, causing the shelf-slope margin to prograde westward (Figure 2). Large input of clastic sediment also took place further north in the Slørebotn Basin (Gjelberg et al., 2001) and in the Faroe-Shetland Basin (Mudge, 2015), and to a lesser extent from southwestern Norway (Hamberg et al., 2005). Elsewhere in the North Sea, most of the Danian was dominated by pelagic ooze and fined-grained deposition. The Selandian and Thanetian was characterized by increased sediment supply from both the Norwegian mainland and the British Iles (Liu and Galloway, 1997; Faleide et al., 2002), where deep-marine deposits eventually covered large parts of the North Sea (Mudge, 2015). This marked increase in sediment input from the Norwegian mainland has been taken as evidence for regional uplift (Jordt et al., 1995, 2000; Martinsen et al., 1999; Skogseid et al., 2000; Anell et al., 2010), although the mechanisms are debated (Anell et al., 2009).
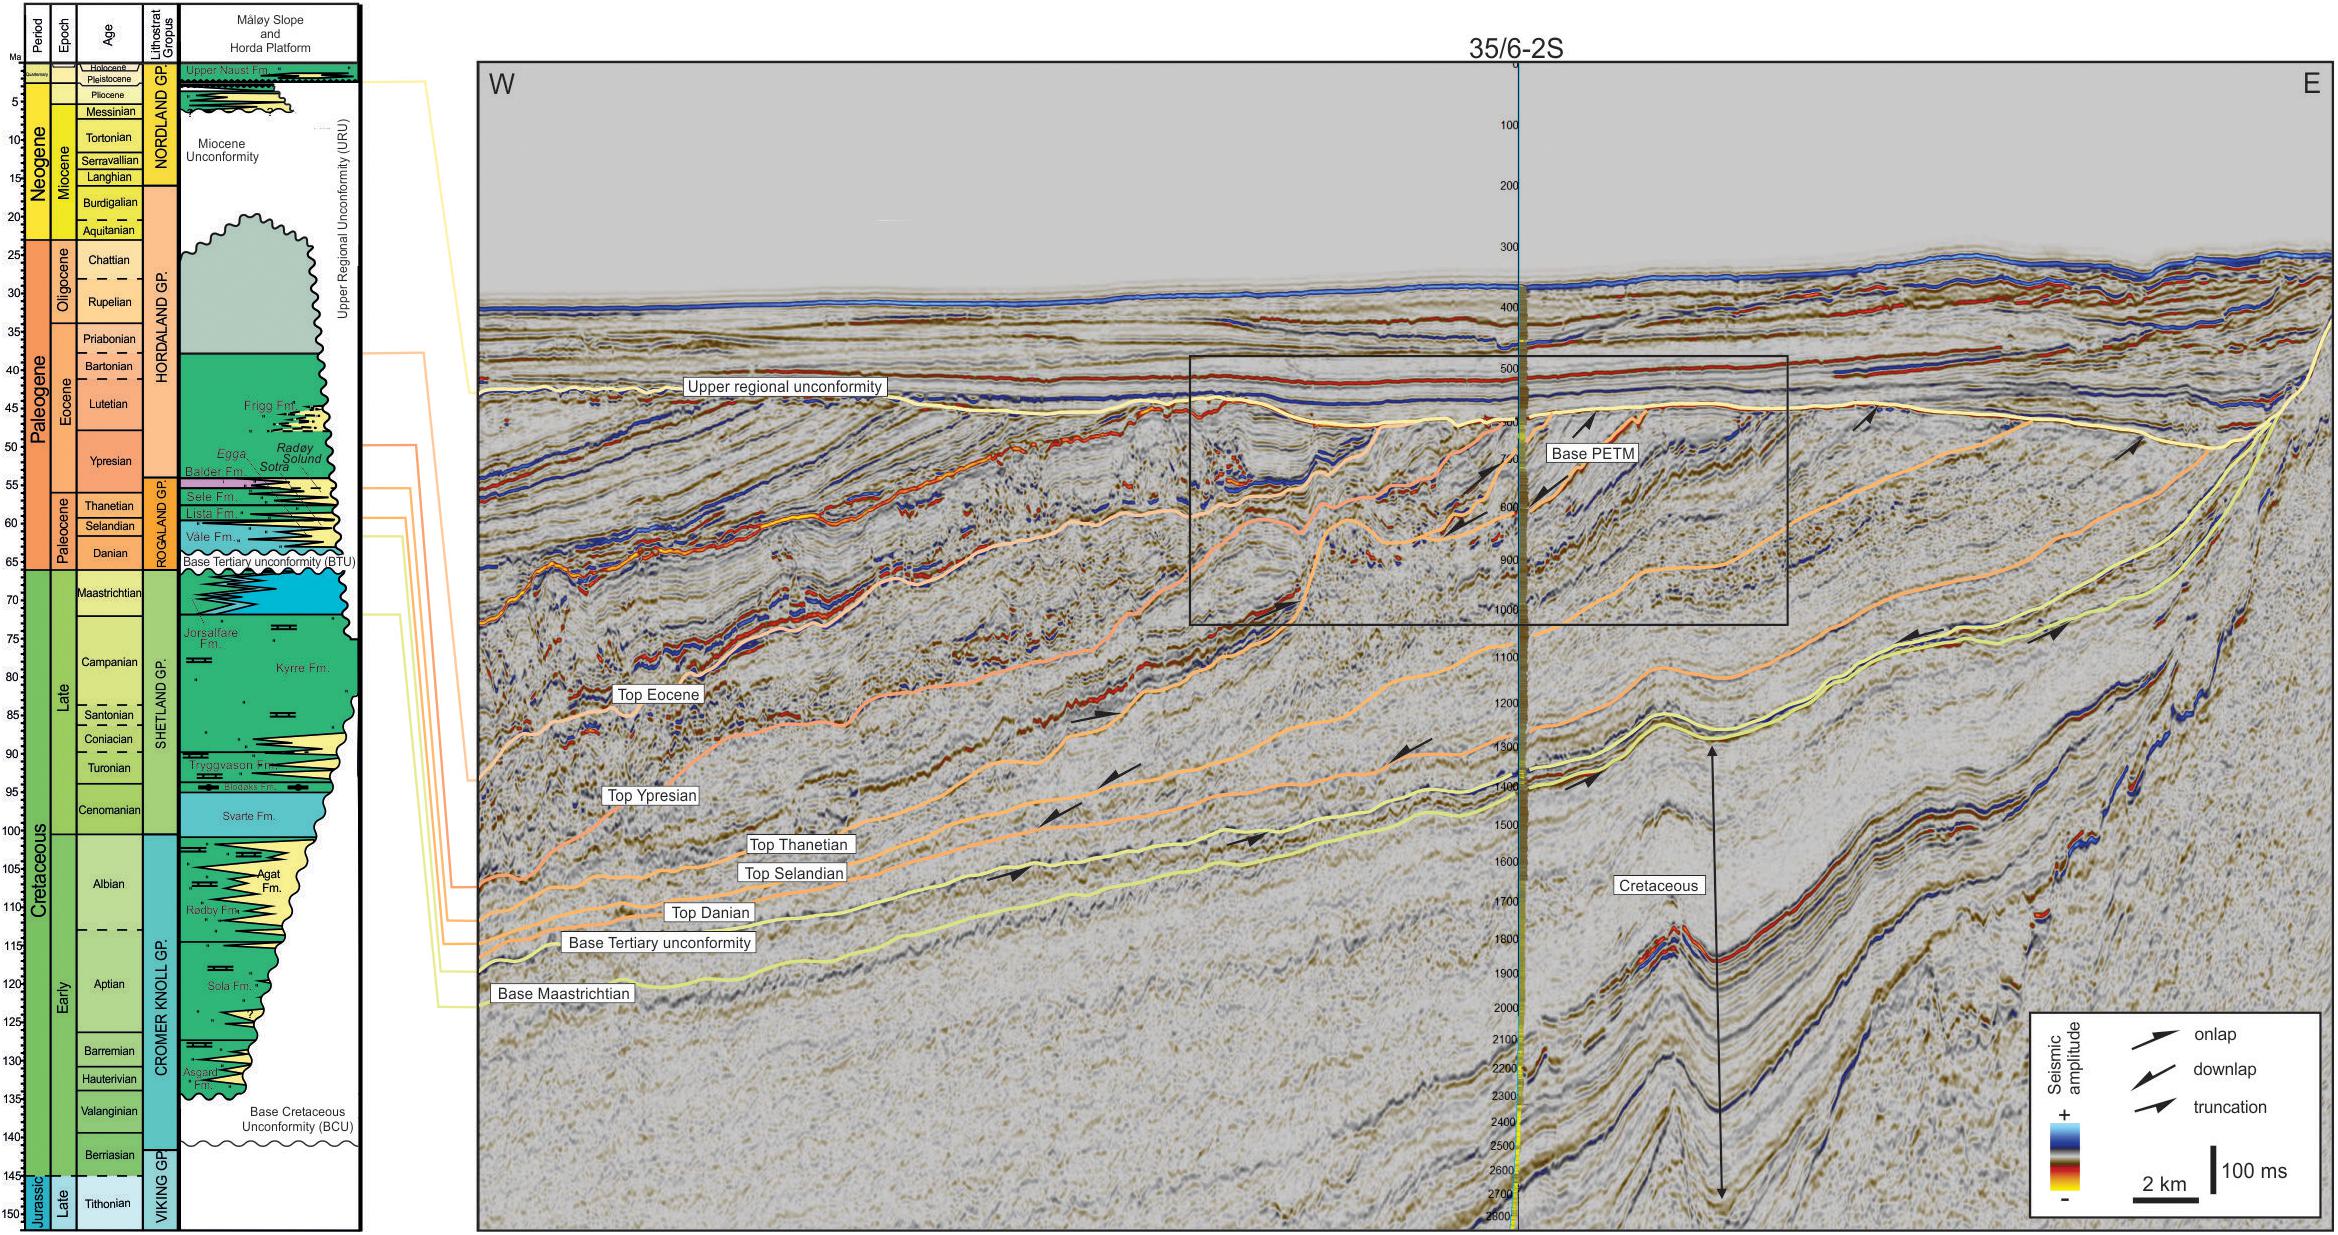
Figure 2. Seismic dip-line and lithostratigraphic overview of key surfaces and units discussed in the text. Note the transition from basinward thickening wedge in the Cretaceous to basinward thinning wedge in the Paleocene. The line intersects borehole 35/6-2S which documents the Paleocene-Eocene Thermal Maximum (PETM). Black box shows the extent of Figure 5.
In addition to changing basin configuration, the latest Cretaceous and Paleocene period was also characterized by a renewed phase of crustal extension, which culminated in final break-up and sea-floor spreading between Norway and Greenland around 55 Ma (Eldholm et al., 1989). Pre break-up Selandian and Thanetian volcanism has been documented in the Faroe-Shetland Basin and on Greenland (Ritchie et al., 1999), but the main phase of extrusive volcanic activity in the North Atlantic Igneous Province was associated with break-up (Figure 1) and the formation of thick wedges of volcanic flows (seaward dipping reflectors) and lava deltas along the outer margin (Eldholm et al., 1989; Planke and Alvestad, 1999; Abdelmalak et al., 2016). Contemporaneous igneous sill intrusions in the Mesozoic sedimentary successions caused large volumes of methane and carbon dioxide to be released into the atmosphere (Svensen et al., 2004; Kjoberg et al., 2017) that is interpreted to have resulted in global warming and the PETM (Kennett and Stott, 1991; Sluijs et al., 2007). In the North Sea, the PETM has been recognized as a period of increased continental run-off and higher eustatic sea levels (Kender et al., 2012). Large input of siliciclastic material to the margins of the North Sea continued also after the PETM, in the Early Eocene, however, sediment supply generally decreased during the Mid and Late Eocene (Martinsen et al., 1999; Faleide et al., 2002; Anell et al., 2010). Toward the end of the Cenozoic, the margin was tilted during one or several phases of uplift resulting in differential erosion of the underlaying stratigraphic units below the Quaternary upper regional unconformity (URU; Figure 2; Ottesen et al., 2014; Baig et al., 2019).
Rationale and Methodology
The SW Norwegian margin makes a suitable area for identifying deep-time stratigraphic response to external forcing in subsurface data. The region is covered by numerous regional 3D seismic reflection data sets and hundreds of boreholes, which allows stratigraphic packages to be mapped and dated with sub-stage temporal resolution.
In this study, stratigraphic packages at Stage level have been mapped on seismic reflection data and tied to boreholes with biostratigraphic information. The outline of depositional systems (e.g., channel and lobe complexes) have been mapped using seismic attribute data (Figures 3, 4). Mass-balance calculations were performed on all packages at Stage level to reveal changes in sediment supply through time in response to hinterland denudation.
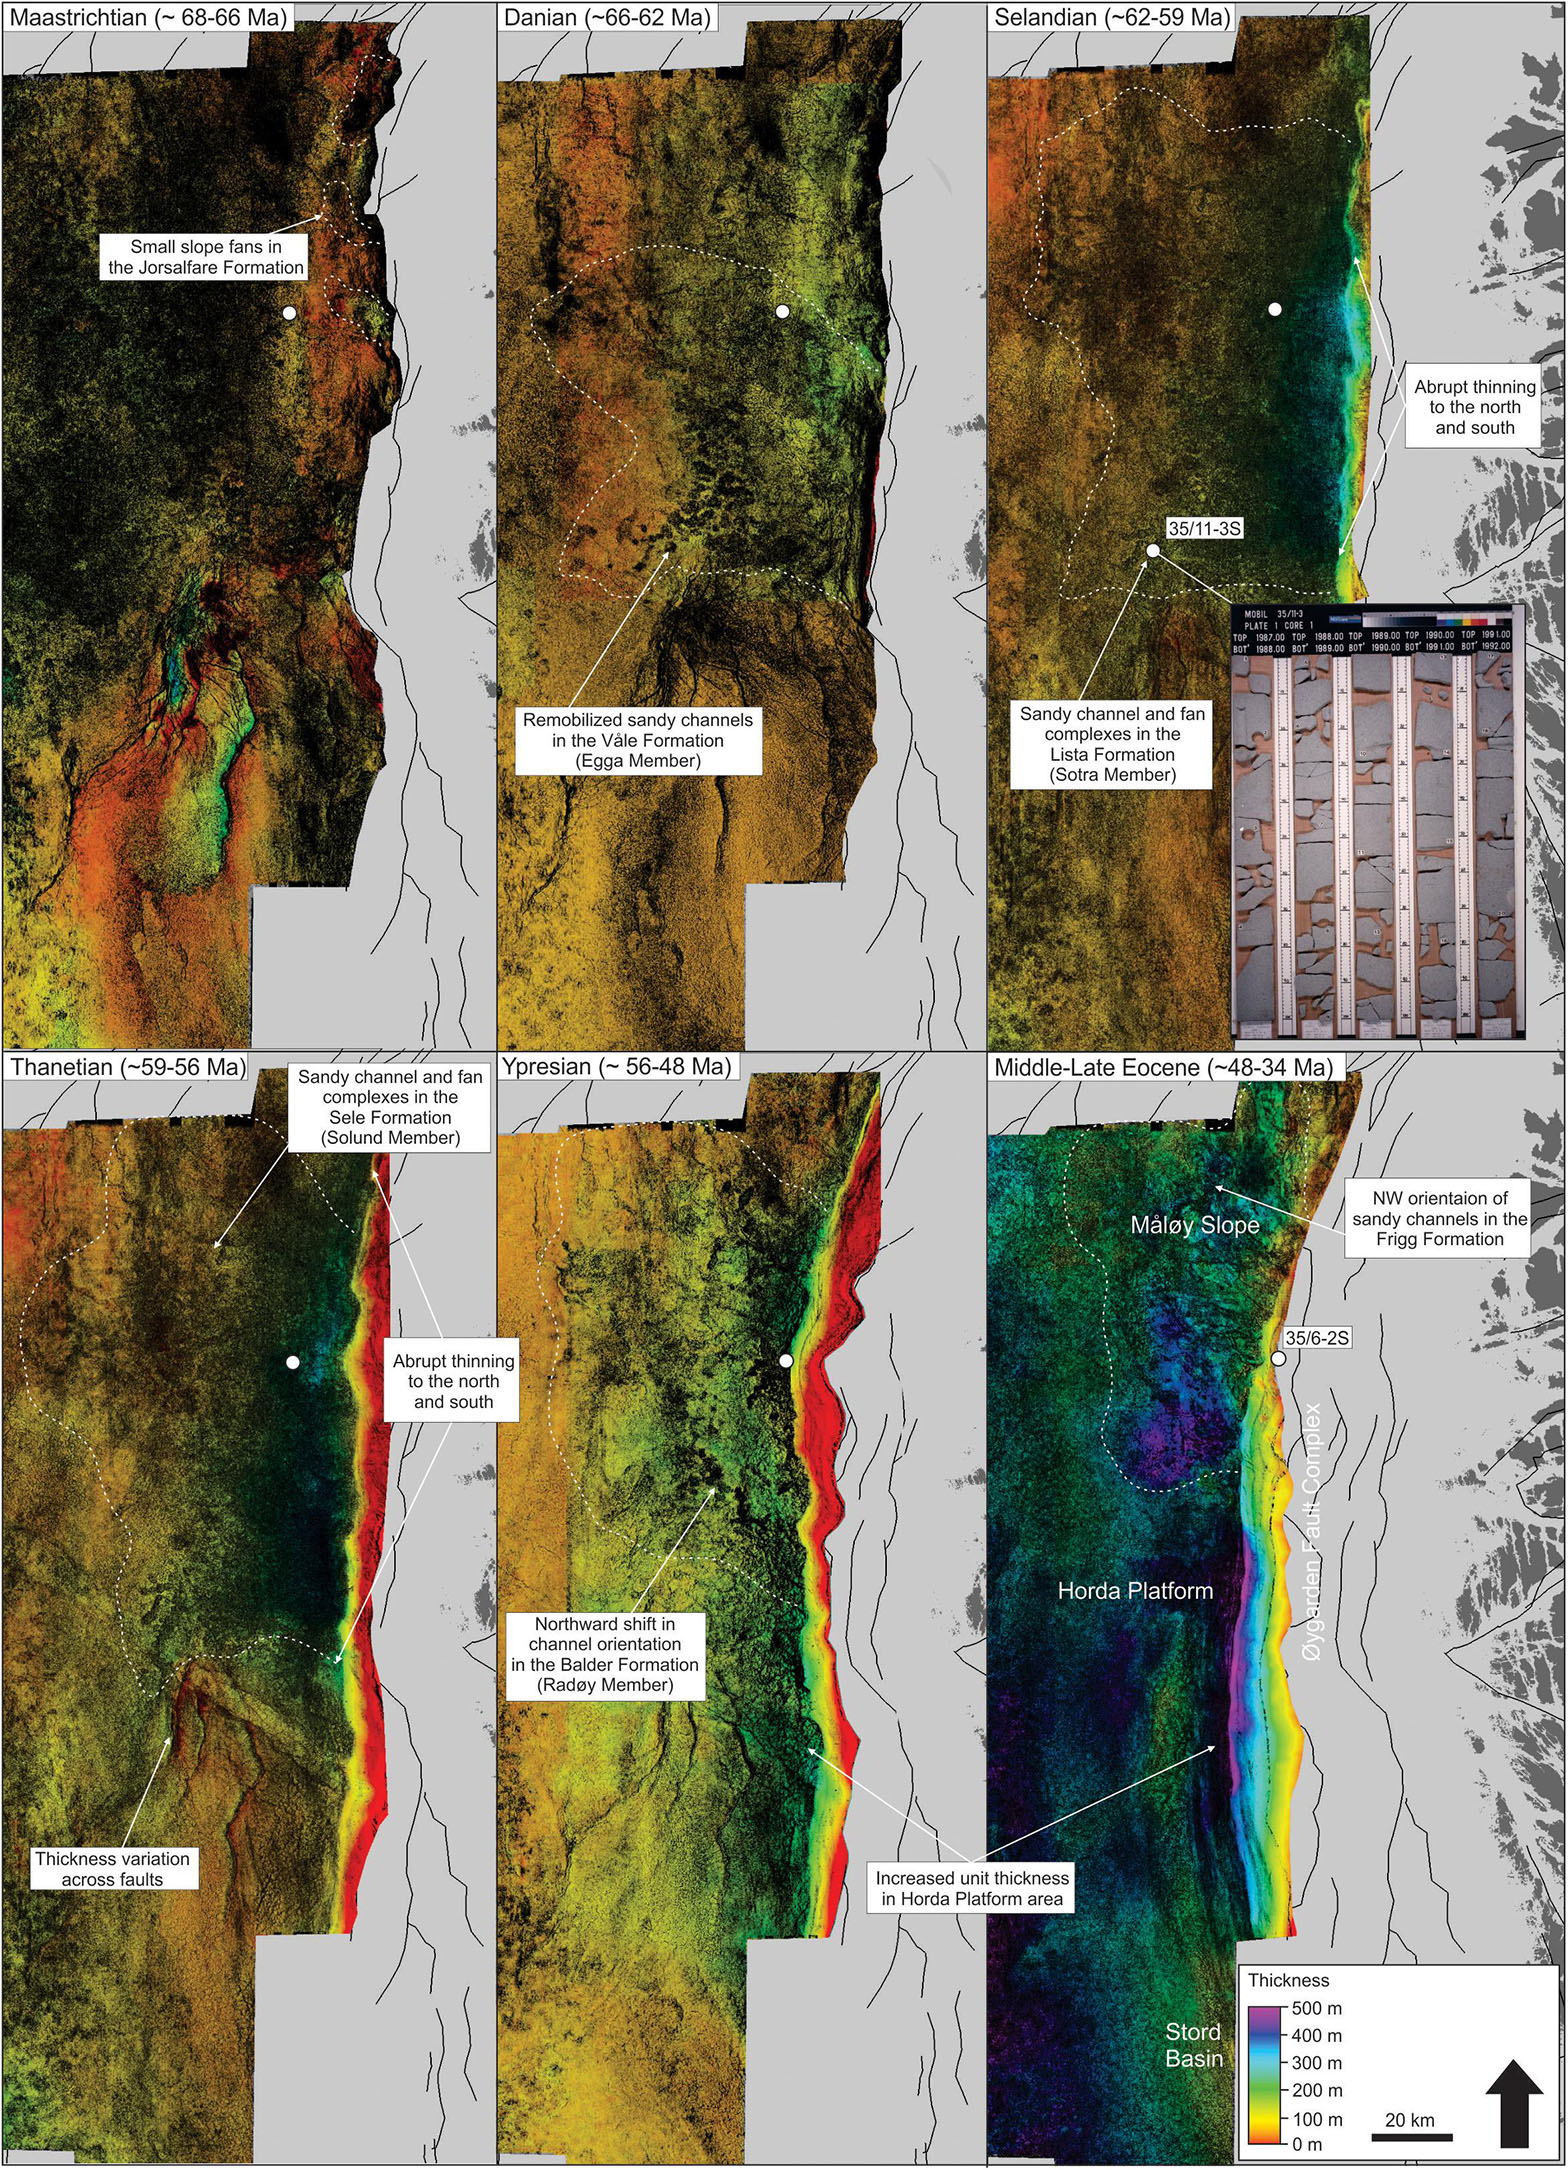
Figure 3. Co-blended variance and isopach maps of the Maastrichtian to Eocene stratigraphic units. The approximate extent of the slope to deep-water fan systems is shown by a white hatched line. Maastrichtian fans are not drilled, but indicated from small channel-lobe geometries in attribute maps. High input of coarse-grained material in the Våle, Sotra and Lista Formations is well documented. Inset shows cored example of a sandy, deep-water channel in the Lista Formation (Sotra Member). Image from www.npd.no. Sandy channels are recognized by linear features in the variance blend (black shading). Note the shift from a localized, point-sourced depocenter in the Paleocene to a more lateral extensive depocenter in the Ypresian coinciding with onlap and redistribution of sediment along strike after the PETM.
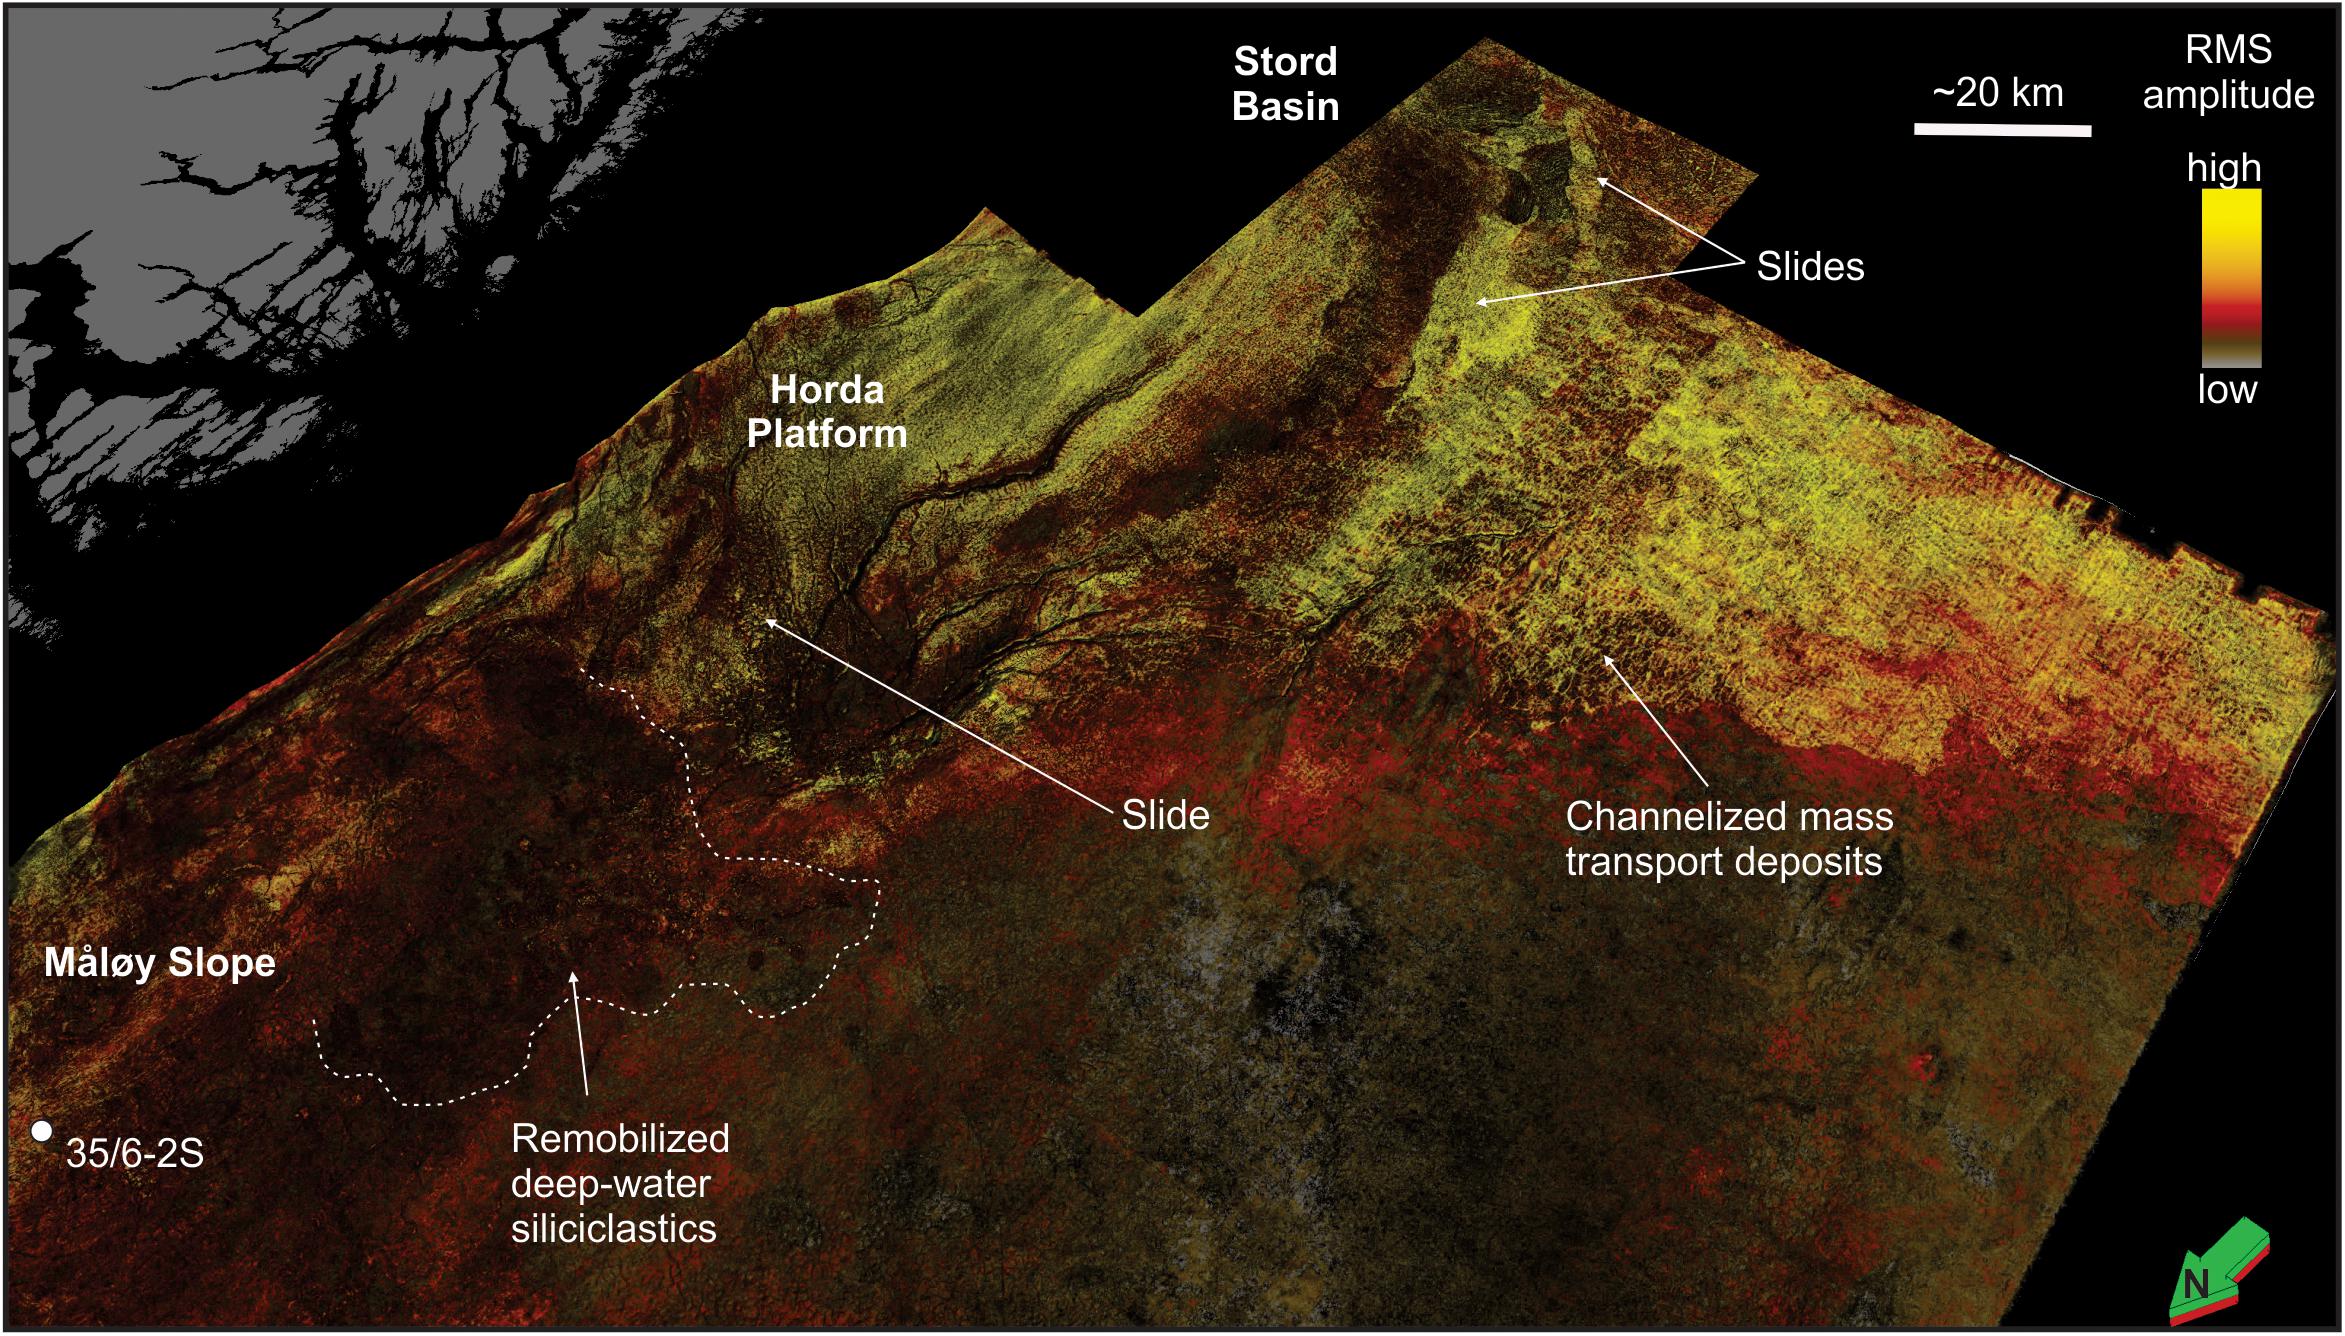
Figure 4. Oblique view of co-blended root mean square (RMS) and variance attributes 20 ms above the Base Tertiary unconformity. The map shows the transition from siliciclastic dominated and remobilized deep-water channel and lobe complexes on the Måløy Slope, to large slides and mass-transport deposits on the Horda Platform and in the Stord Basin. The approximate basinward extent of Danian deep-water deposits is indicated by the white hatched line. The mass-transport deposits mostly comprise chalk and argillaceous shales. The present-day Norwegian coastline is show in gray.
Step one in this process was to depth-convert the top and base surface of every package at Stage level using a regional seismic velocity model. The maps were then cut to the area of active deposition as suggested by attribute maps, thickness and borehole data (Figure 3) to constrain the volume of the active depositional system. Present day rock volumes (km3) were calculated for each unit and this value was converted to mass (MT) using the average density from all boreholes penetrating the relevant units (Supplementary Table S1). Changes in sediment supply (MT/yr) through time was finally calculated using stage ages from Gradstein et al. (2012).
High-resolution biostratigraphic data from borehole 35/6-2S (Figures 5, 6) was used to constrain the mapping of the PETM deposits. This is the most proximal borehole penetrating the PETM event in this area and provides information on paleo-environmental changes prior to and during the PETM.
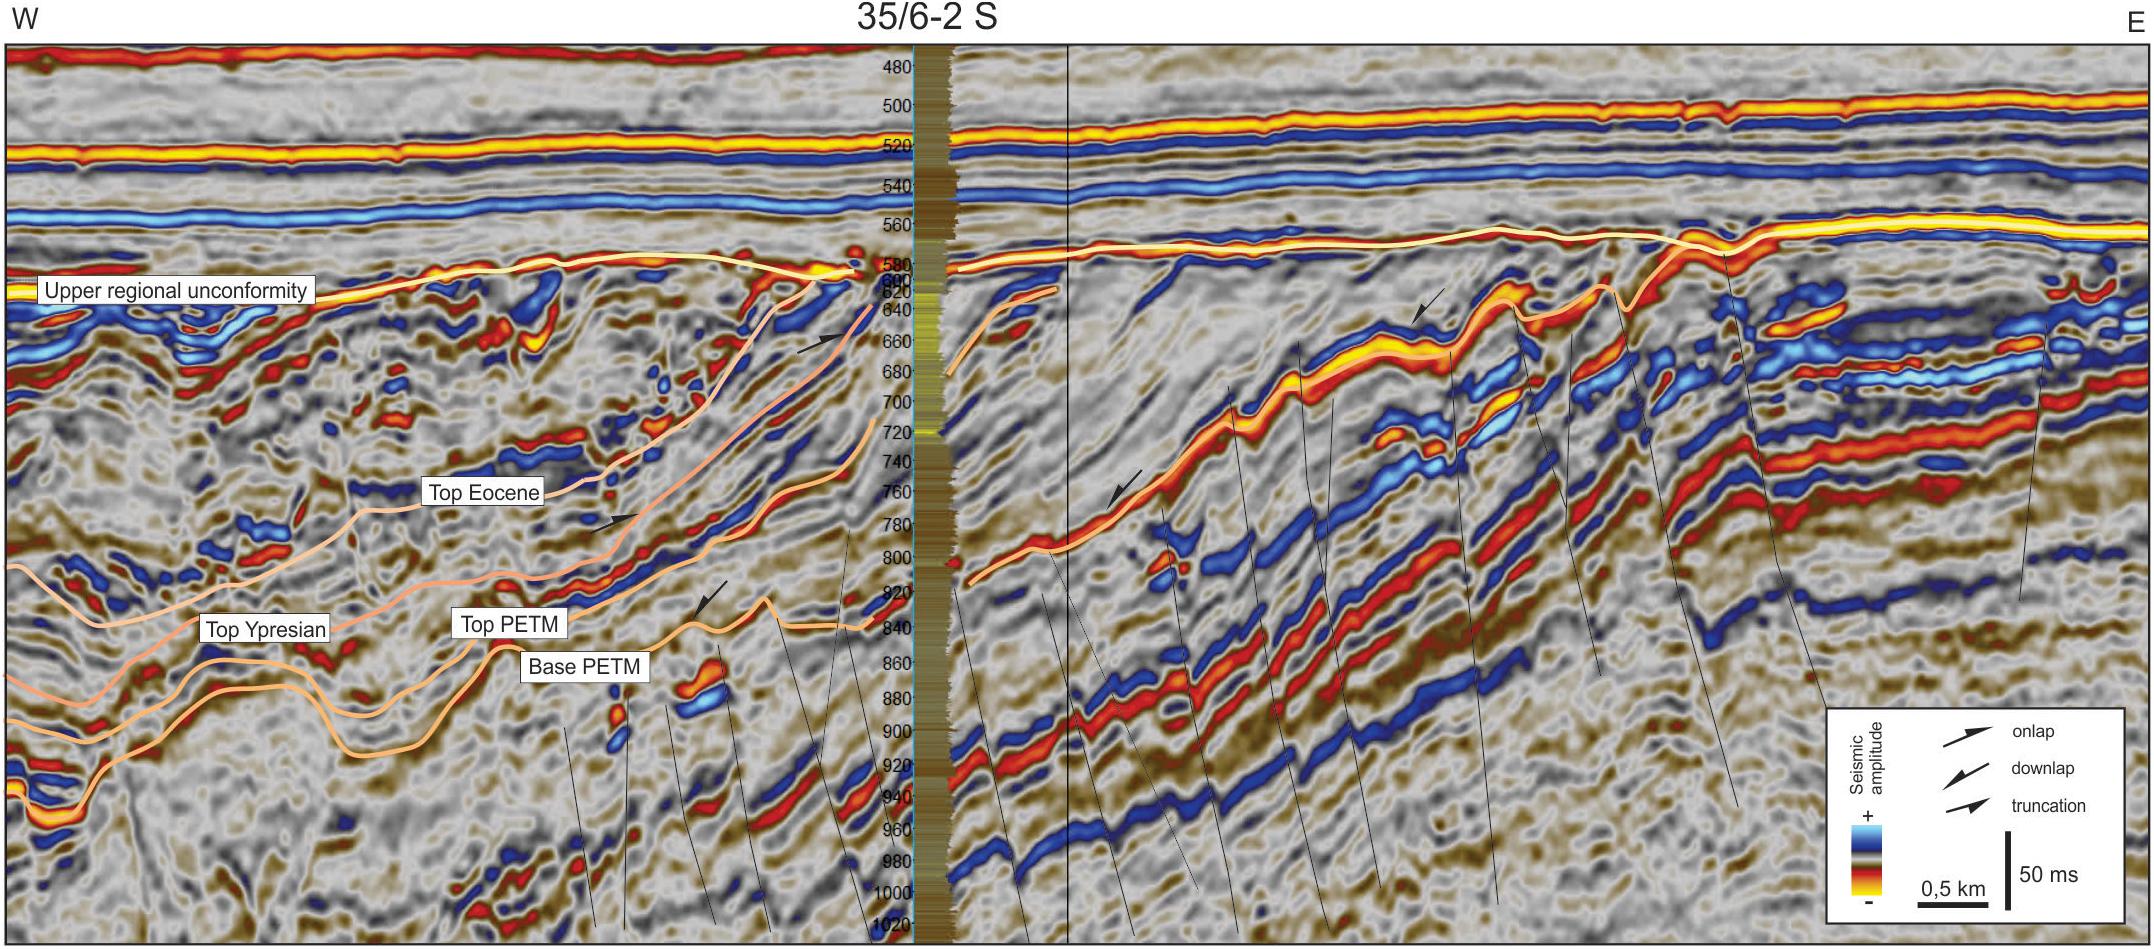
Figure 5. Dip-line of the PETM succession through borehole 35/6-2S. The onset of the PETM is marked by a distinct downlap surface indicating a minor relative sea-level rise and reorganization of the feeder system. The underlying Thanetian succession was remobilized and locally faulted just prior to PETM progradation, controlling the thickness and distribution of PETM strata. The end of the PETM interval is not marked by distinct stratal relationships and progradation continued during deposition of the early Ypresian Balder Fm above 680 m. See Figure 2 for location on regional dip-line.
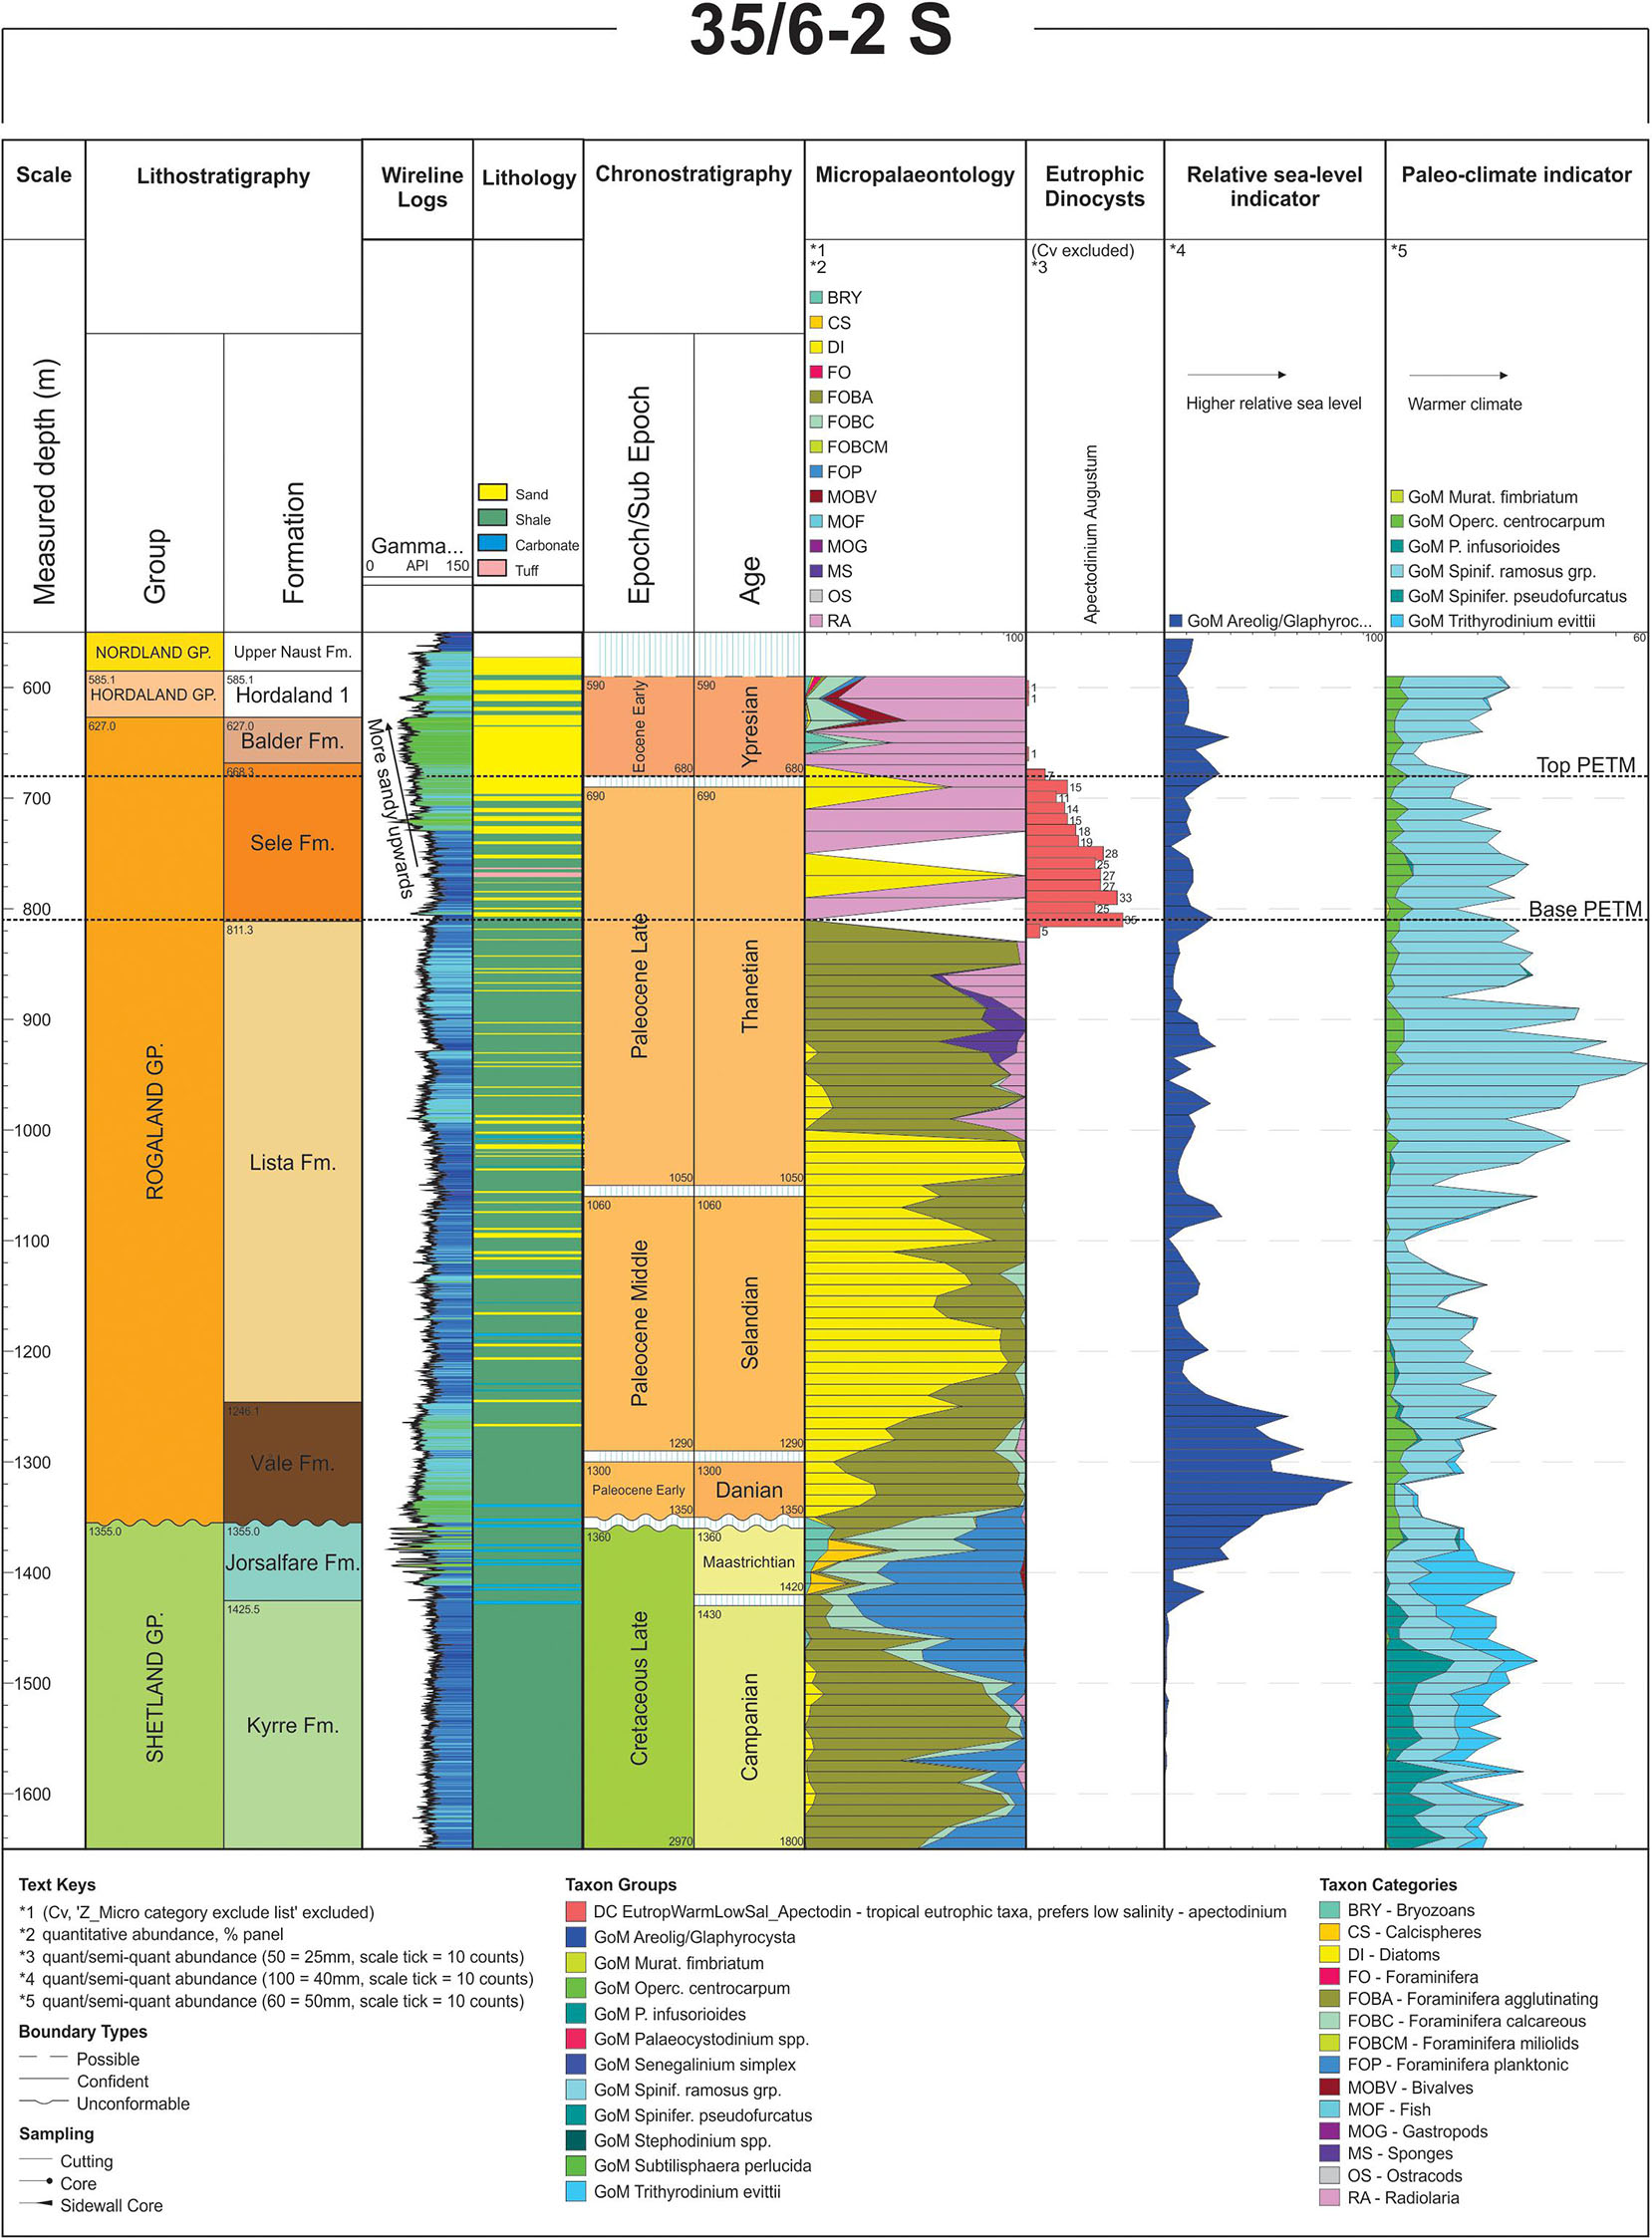
Figure 6. Biostratigraphic information for borehole 35/6-2S. The PETM is defined in micropaleontological data by the extinction of benthic fauna and in dinoflagellates by the presence of A. Augustum between ∼680 and ∼810 m. Peaks in Areoligera/Glaphyrocysta and Spiniferites ramosus grp. are considered indicators of relative sea-level and climate variability, respectively. The data indicate relative sea-level rise at the base of the Paleocene succession and within the Balder Fm. Increasing relative sea-level toward the top of the Balder Fm is also indicated by more shale-dominated lithologies and an increase in gamma ray in the wireline log. High gamma ray and blue colors are indicative of shale-dominated lithologies whereas low gamma and green colors are indicative of sand and carbonate dominated lithologies.
Uncertainties in the volumetric calculation varies between the different units. The Maastrichtian succession shows a basinward thickening geometry (Figure 2) and it is possible that fine-grained material has been transported basinward of the small slope-fans inferred from attribute maps, thus underestimating the overall sediment supply. However, no boreholes indicate the presence of an active Maastrichtian supply system. The Danian, Selandian and Thanetian successions are all well-defined on thickness maps as the depocenters clearly thins both in strike and dip-direction (Figure 3). Although biostratigraphic data from several boreholes indicate minor stratigraphic breaks internally, the 3D volumetric control is adequate. The main uncertainty is related to the amount of erosion by the upper regional unconformity (URU) (Figure 2). Although shelf-breaks are observed locally, especially in the uppermost part of the Paleocene succession, most of the topsets have been removed by later erosion. The amount of missing strata is difficult to estimate, but this and other studies (Martinsen et al., 1999) suggest that the Paleocene progradation occurred by forced regression, and it is believed that little material was retained in the topsets.
In order to quantify the onshore topography associated with the Paleocene tectonic event, inverse application of the BQART model (Syvitski and Milliman, 2007) was conducted. The aim is to use a large modern data set to investigate the best-fit topography associated with the observed sediment supply through time. The best-fit topography is calculated using a Monte Carlo approach where all key uncertainties are included in the estimations. The method and discussion of uncertainty parameters are outlined in Sømme et al. (2013b) and in the Appendix.
Characteristics of the Paleocene Shelf-Slope Wedges Linked to Tectonic Perturbation
In the study area, the Maastrichtian succession is extensively eroded by the angular base Tertiary unconformity (BTU), and the amount of erosion generally increases eastward and above the crests of older fault blocks (Figures 2, 3). A seismic attribute map of the Danian succession just above the unconformity reveals that the transition between the Maastrichtian and the Paleocene was dominated by significant mass-wasting (Figure 4). On the Horda Platform and in the northern part of the Stord Basin, several large slides are observed together with channelized mass-transport deposits. Boreholes penetrating these deposits show that they mostly comprise fine-grained argillaceous shale and chalk material eroded from underlying lowermost Danian and uppermost Cretaceous strata. Further north on the Horda Platform, the Danian is characterized by an up to 200 m thick succession of slope to basin floor channel and fan complexes that are downlapping the BTU (Egga Member of the Våle Formation, Figures 2, 3; Dmitrieva et al., 2018). Biostratigraphic data form 35/6-2S suggest that this period was characterized by relative sea-level rise (Figure 6).
Progradation continued during the Selandian and Thanetian with only a minor stratigraphic breaks in borehole 35/6-2S. Seismic attribute data (Figure 3) show continued progradation of sandy slope channel complexes (Sotra and Solund members of the Lista and Sele Formations) (Figures 2, 3). Biostratigraphic data from boreholes penetrating these units show reworking of Cretaceous fauna, suggesting that underlying stratigraphy was eroded somewhere along the routing system to the east. The isochore maps of the Selandian and Thanetian successions show thicknesses of up to 350 m in the main depocenter, abruptly thinning toward the north and south (Figure 3). The uppermost part of the Thanetian succession comprises the succession associated with the PETM (Figures 5, 6), which will be discussed separately below.
Paleocene strata are overlain by a relatively thin unit of early Ypresian age [Balder Fm (Figures 2, 3)]. In 35/6-2S and locally in the northern part of the study area, the Balder Fm is sand-dominated (Radøy Member; Figure 3; Martinsen et al., 1999), and the unit shows a progradational to aggradational stacking pattern (Figure 5). To the south and away from the main sediment entry point, the unit shows an aggradational to backstepping pattern. The thickness of the Ypresian succession is up to 270 m, showing only minor variation along strike (Figure 3), indicating a transition from a well-defined point source to a more laterally extensive depocenter. Despite overall aggradation and onlap onto the upper slope of the underlying Thanetian succession, borehole and seismic attribute data suggest that the northernmost part of the Ypresian system on the Måløy Slope represents sand-dominated slope to deep-water channel and lobe complexes (Frigg Formation) (Figures 2, 3); whereas on the northern Horda Platform, the succession is fine-grained without evidence of coarse-grained input.
A similar situation is evident from the Middle to Upper Eocene succession, which is up to 530 m thick on the southernmost part of the Måløy Slope (Figure 3). Also here, borehole and seismic attribute data suggest that the coarse-grained material was delivered to the Måløy Slope area (Frigg Fm, Figure 1), whereas the northern Horda Platform was dominated by fine-grained sediments (Martinsen et al., 1999).
Further south, in the Stord Basin, another Paleocene wedge has been mapped on 2D and 3D seismic reflection data (Figures 7, 8). This wedge represents the distal part of a different routing system that was associated with significantly lower sediment supply compared to the northern system during the Paleocene (the total thickness of the Paleocene wedge is only ∼400 m compared to ∼900 m in the north). The southern system has preserved the topsets of the ∼200 m thick Thanetian prograding wedge (Figure 7), allowing more detailed analysis of changes in accommodation to be made. The lower part of the wedge shows downlap-toplap geometries, indicating forced regression. This is overlain by an aggradational unit, which again is onlapped by lower Ypresian strata as in the north. This wedge has been tied to borehole 31/6-3 (Figure 8), where biostratigraphic data shows that a major unconformity is present within the Thanetian. The PETM is not recognized as a mappable seismic unit in the southern depocenter. Since the entire landward part of the wedge has been eroded by the URU, no attempts have been made to calculate sediment supply for this unit.
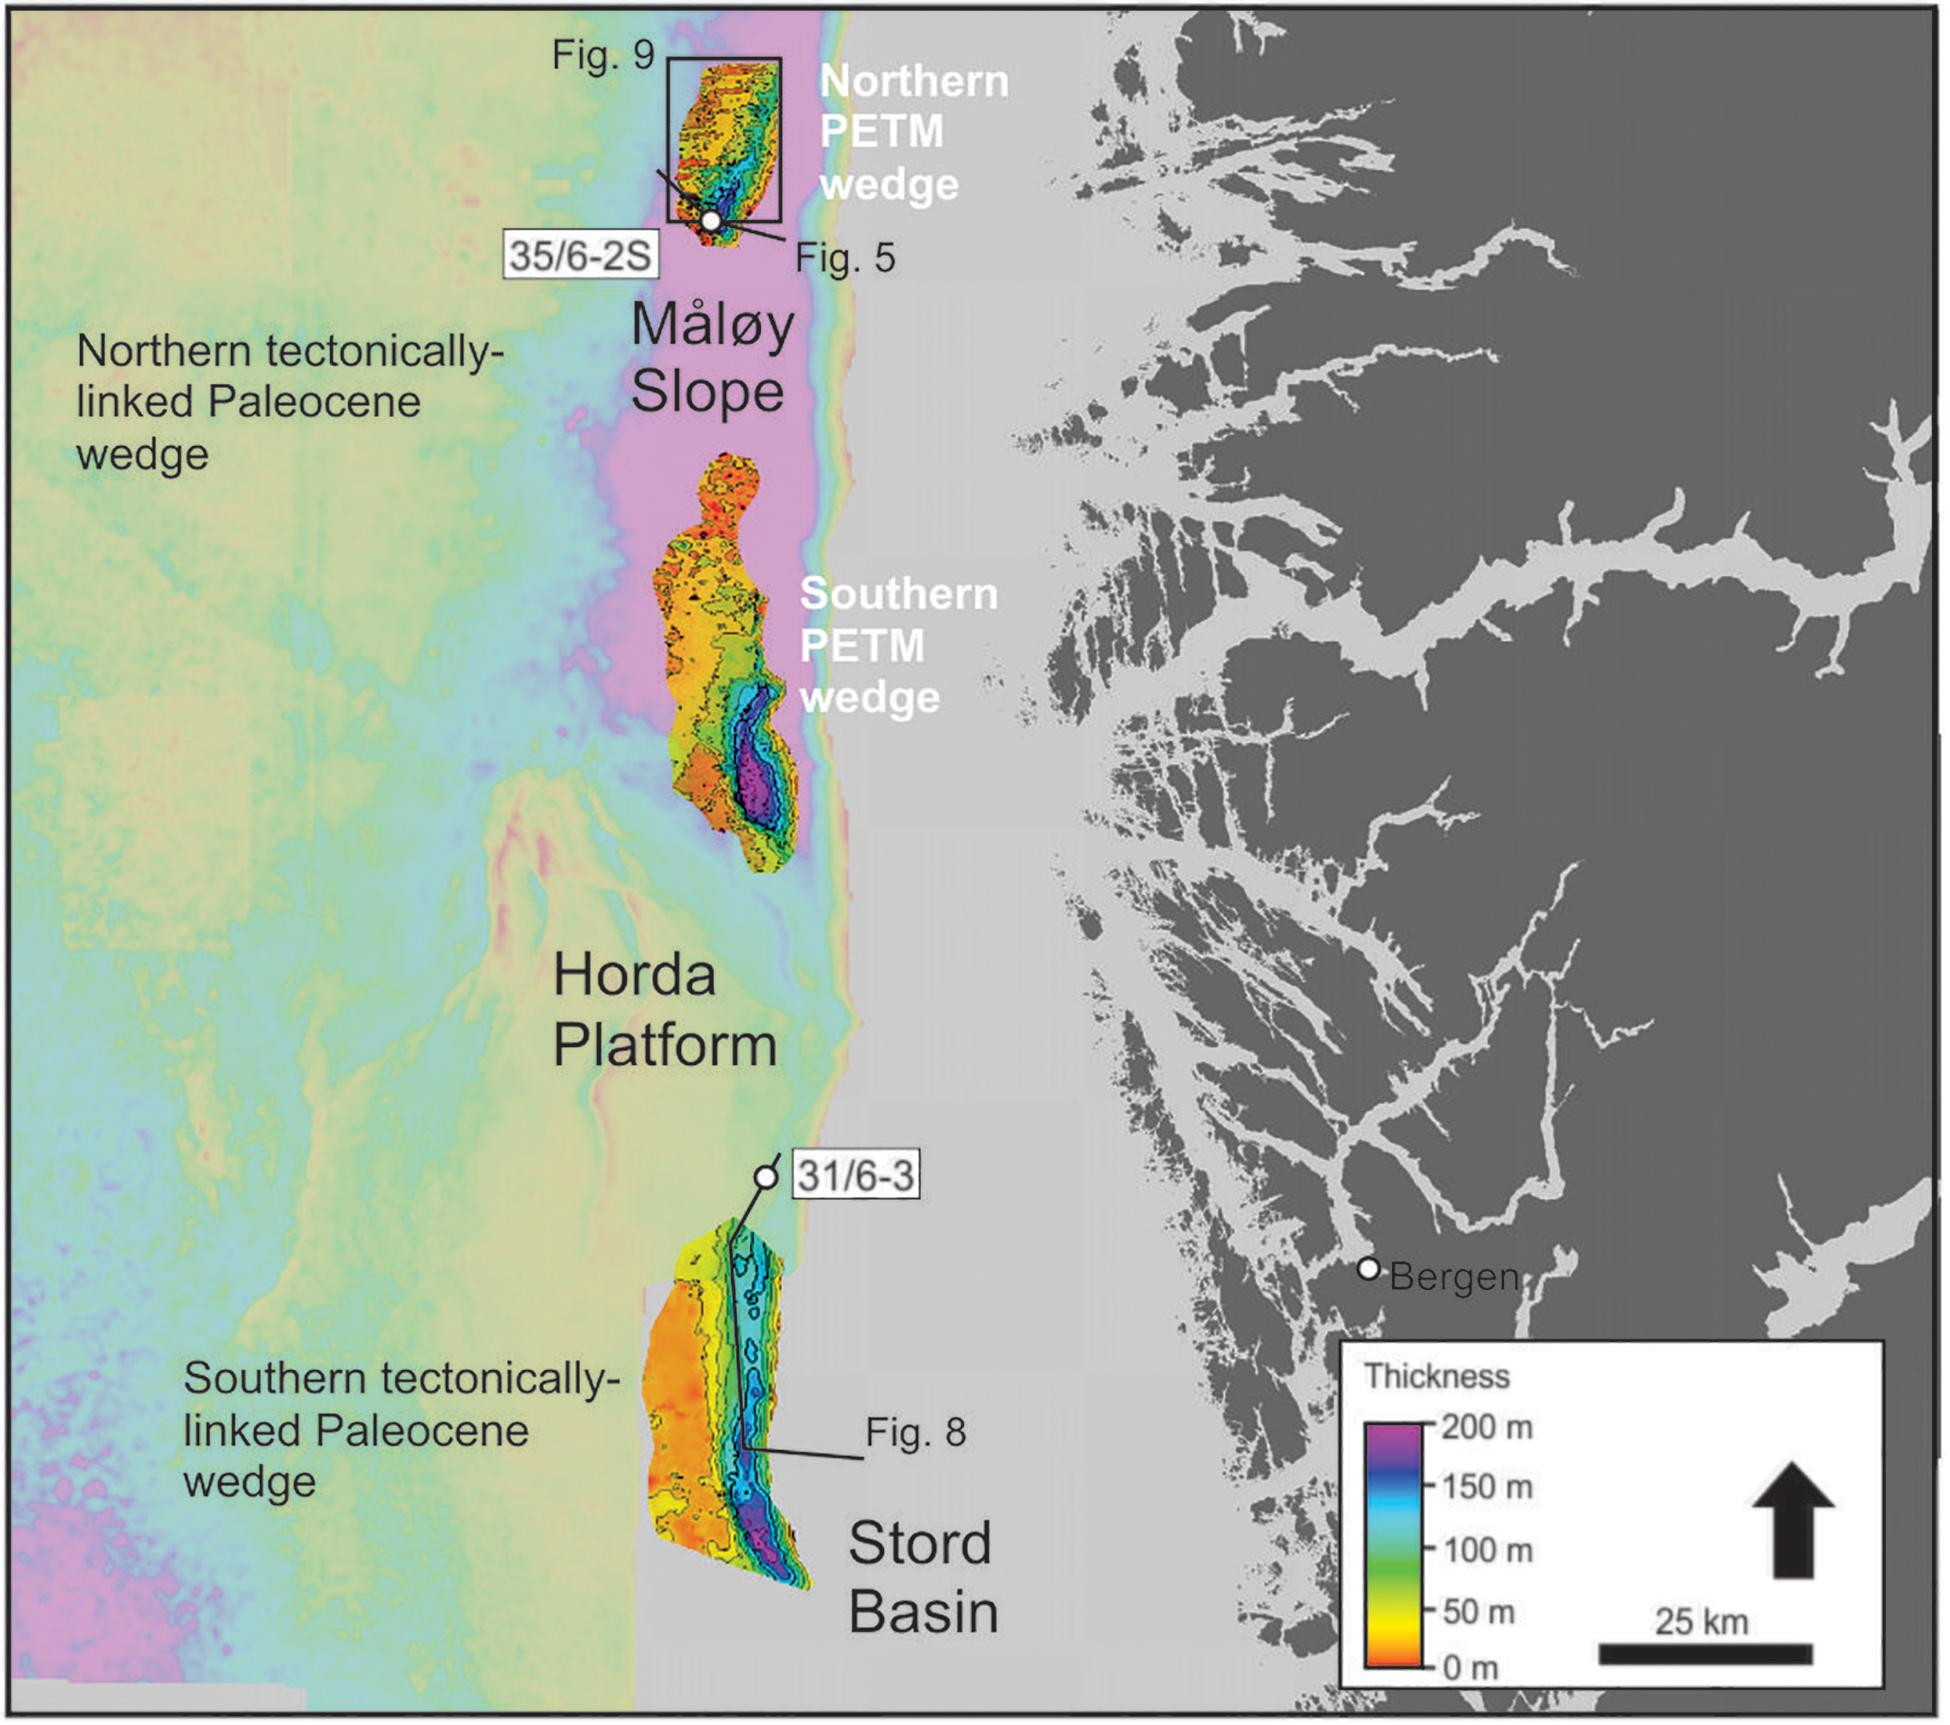
Figure 7. Map showing the two (northern and southern) PETM depocenters on the Horda Platform and the Måløy Slope together with the northern and southern tectonically-linked depocenters on the Måløy Slope and in the Stord Basin (the former is made transparent for visualization purposes). Note the similarity in thickness between the PETM wedges and the southern tectonically-linked wedge. The PETM climatic wedges represent ∼150–200 kyr of deposition, whereas the tectonically linked wedges are believed to represents up to ∼3 Myr of deposition.
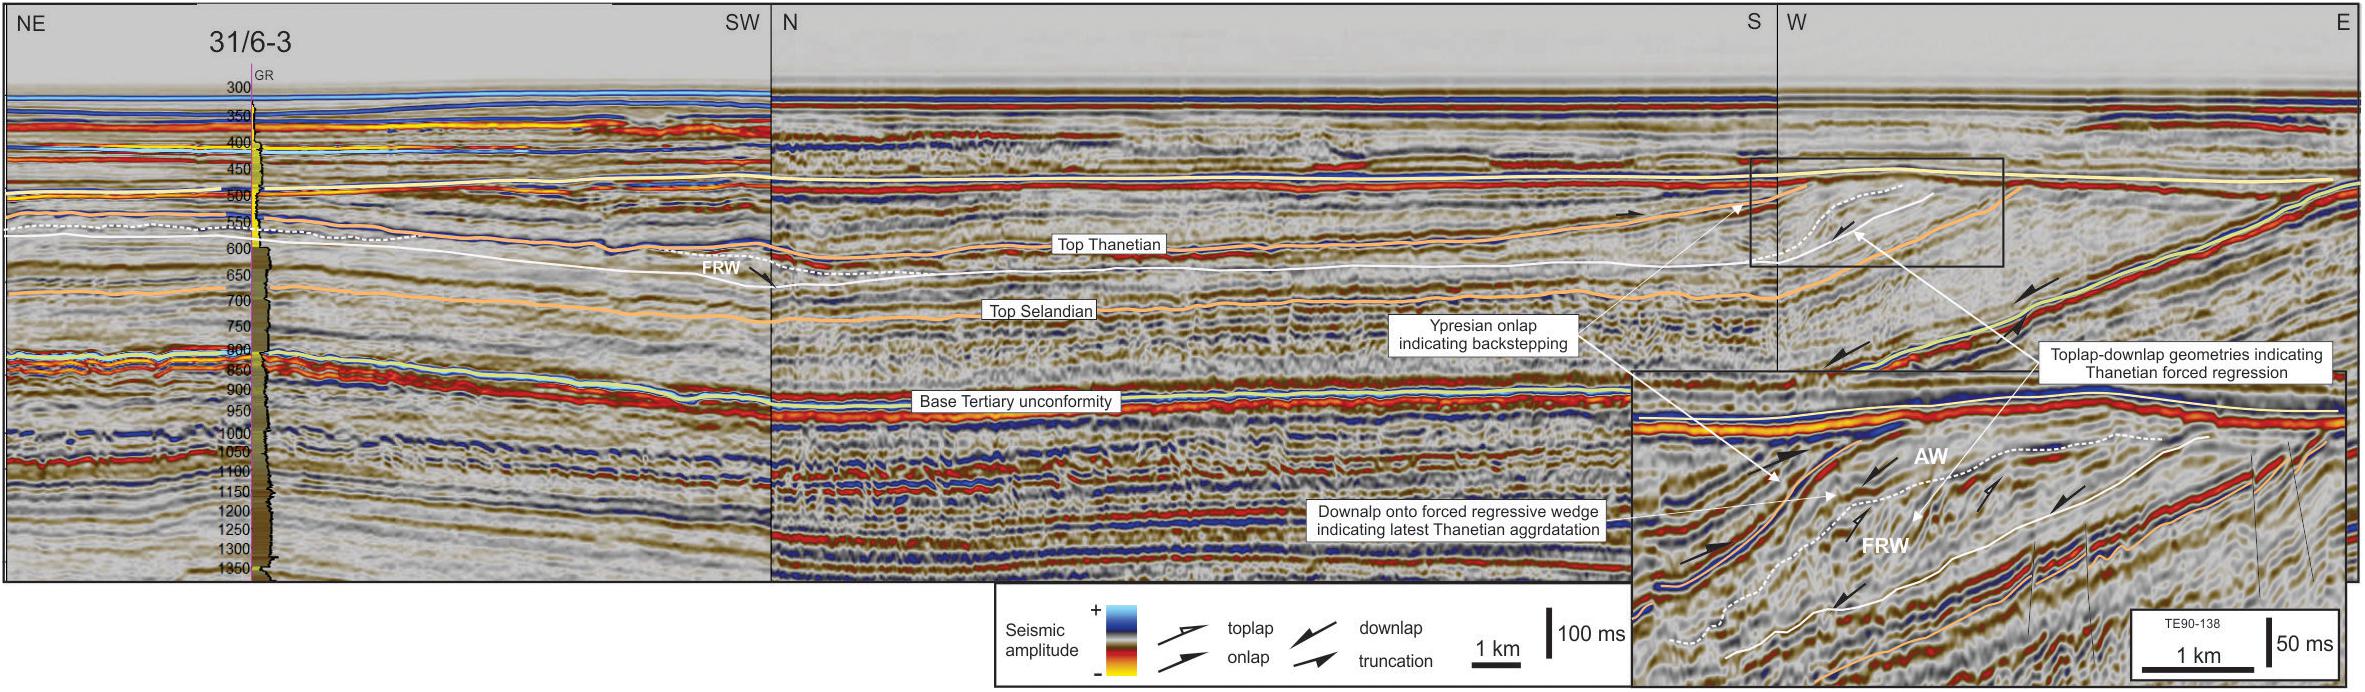
Figure 8. Dog-leg line connecting forced regressive wedges (FRW) to borehole 31/6-3 in the Stord Basin. Inset shows the details of 2D line TE90-136 where the lower Thanetian unit shows toplap geometries indicating forced regression. This wedge is overlain by an aggradational wedge (AW), which again is onlapped Ypresian strata. A similar wedge can also be observed further north close to borehole 31/6-3. See Figure 7 for line location.
Characteristics of the Uppermost Thanetian Shelf-Slope Wedges Linked to Climate Perturbation
Although the PETM only lasted about 150–200 kyr (Röhl et al., 2007; Sluijs et al., 2007), the corresponding stratigraphic record can still be recognized and mapped on seismic reflection data in areas where the sediment supply was high. In the North Atlantic, the PETM has been recognized by the presence of Apectodinium Augustum dinocysts and an abrupt extinction of benthic foraminifera (Gradstein et al., 1994; Sluijs et al., 2007; Nagy et al., 2013; Eldrett et al., 2014). Biostratigraphic data from borehole 35/6-2S shows the extinction of benthic foraminifera and the presence of A. Augustum at ∼810–680 m, indicating that the PETM is represented by ∼130 m of stratigraphy in the Sele Fm (Figure 6). The base of the PETM succession can be tied to a distinct, but local downlap surface on seismic data, which marks the transition from low-angle to more steeply dipping clinoform geometries (Figure 5). In 35/6-2S, the surface is characterized by shale-dominated lithologies and a minor increase in gamma ray (GR) (Figure 6). In map view, the surface is characterized by a polygonal fault pattern and little variation in the RMS amplitudes indicating relatively homogenous lithologies (Figure 9). The fine-grained lithologies and the downlapping geometry of the lower surface indicates that the onset of the PETM was characterized by re-arrangement of the main dispersal system to the north of the main Paleocene wedge (Figure 7). Clinoform geometries appear to steepen upward in the succession, indicating progradation into deeper water.
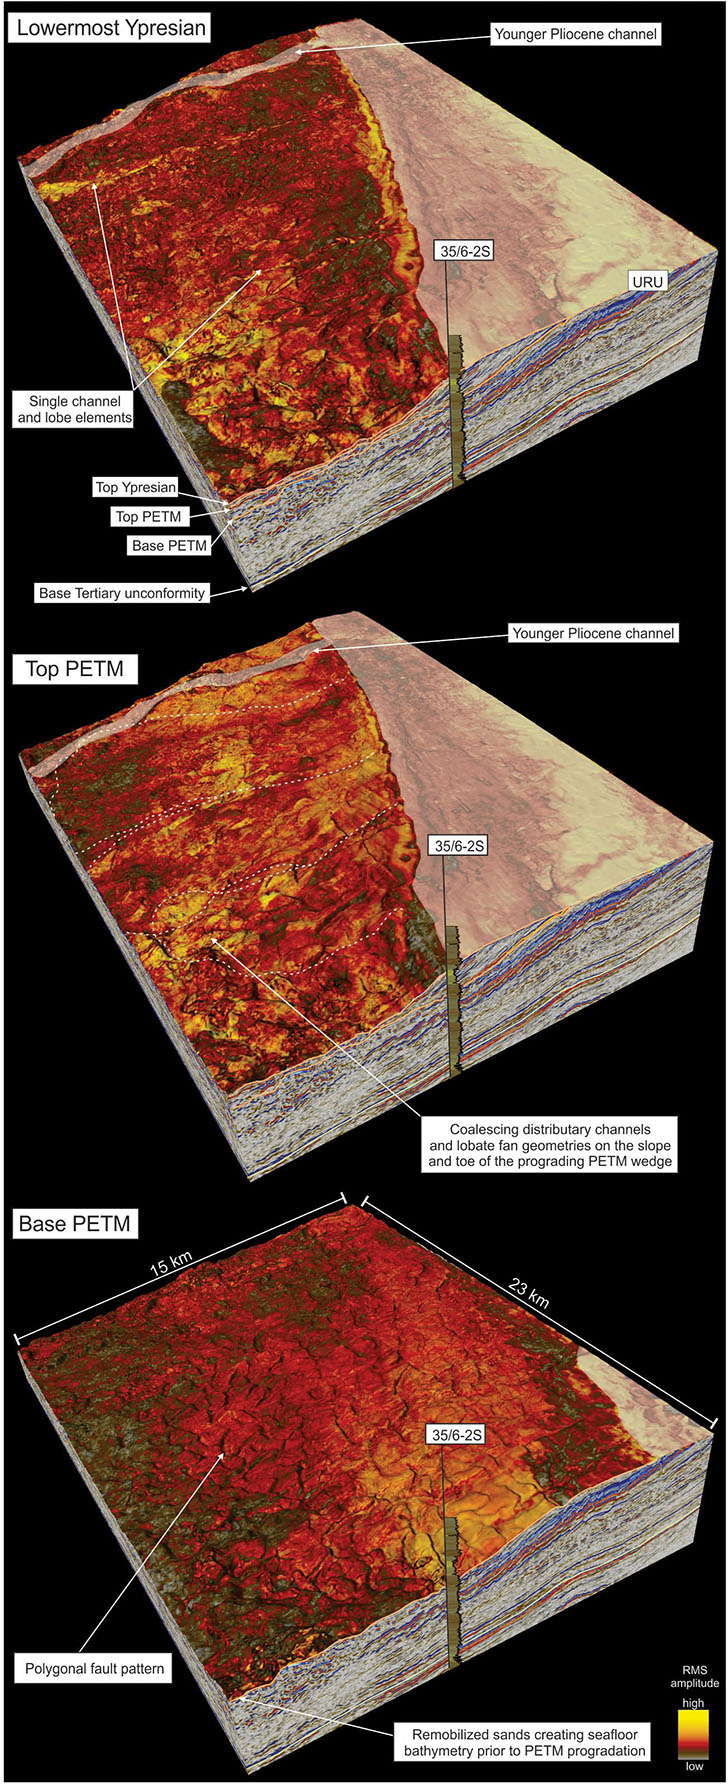
Figure 9. Oblique view of co-blended root mean square (RMS) and variance attribute maps showing the evolution of the PETM wedge around and north of borehole 35/6-2S. The basal surface downlapped by the PETM wedge show polygonal fault pattern and little variation in amplitude, indicating fine-grained lithologies as shown in the borehole (Figure 6). Near the top of the PETM wedge, high-amplitude channel and lobe geometries can be observed along strike of the prograding shelf-slope wedge, indicating sandy and more mixed lithologies. In 35/6-2S, this is recognized by a sand-dominated interval. Sand appears to have been shed into the area also after the PETM, but the amplitude maps show different geometries with more straight channels and smaller terminal lobes. See Figure 7 for location.
In the area around borehole 35/6-2S, the PETM succession prograded across a rugged seafloor created by remobilization of underlying sediments (Figures 5, 9). This might suggest that PETM progradation was relatively rapid, causing increased pore-pressure and remobilization of older, underlying sediments prior and during PETM progradation. Borehole logs and cutting descriptions from 35/6-2S also show that the base of the PETM succession is dominated by shales, whereas increasing amount of sand is present in the uppermost part of the unit (Figure 6). Increasing sediment input toward the end of the PETM is also corroborated by the presence of channel and lobe complexes observed in the attribute data in Figure 9.
Apectodinium Augustum is also an indicator of increased nutrient supply and runoff from the continent, which has been documented in several locations in the North Atlantic (Carmichael et al., 2017). However, the only difference described from the cutting data is a marked change in sorting within the PETM sands, from well sorted below and above, to very poor sorting within the PETM interval. The last occurrence of A. Augustum in borehole 35/6-2S is at ∼680 m, which is below the top of the sandy progradational unit and at least 50 m below the regional Ypresian onlap surface described above. Consequently, the end of the PETM does not appear to be characterized by any specific stratal relationship in seismic data and the system continued to prograde also after the PETM. Continued sediment delivery is also evident in seismic attribute data, however, post-PETM channels appear straighter and are more widely spaced along strike (Figure 9).
The basal surfaces of the PETM wedge and the lower Ypresian onlap surface penetrated by 35/6-2S can also be tied further south where another wedge is present (Figure 7). The thickest part of this southern wedge has not been penetrated by boreholes and the suggested PETM age is thus based on correlation along strike from borehole 35/6-2S and from other boreholes penetrating the distal slope setting. This is interpreted as another local PETM depocenter situated to the south of the main Paleocene wedge.
Estimating Sediment Supply and Paleotopography
In order to investigate stratigraphic response to climatic and tectonic forcing, the mapped depositional units were converted to sediment supply rates as described in section “Rationale and Methodology”. These values were then used as input to the reverse BQART model, which estimates the topography needed to explain observed sediment loads along the margin.
Sediment Supply
Calculations show that the system delivering sediment to the SW Norwegian margin supplied less than 0.06 MT/yr during the Maastrichtian, prior to earliest Paleocene uplift (Figure 10). The sediment load increased to ∼0.32 MT/yr in the Danian, ∼ 0.82 in the Selandian and ∼0.79 MT/yr in the Thanetian, respectively (Supplementary Table S1). The sediment load then decreased to 0.38 MT/yr during the earliest Ypresian (Balder Fm), followed by ∼0.44 MT/yr in the Ypresian and finally ∼0.35 MT/yr for the remainder of the Eocene. Since parts of the sediments were eroded during the late Quaternary, the estimated loads are absolute minimum values. Nevertheless, the estimates suggest that hinterland uplift resulted in at least one order of magnitude increase in sediment supply during the Paleocene.
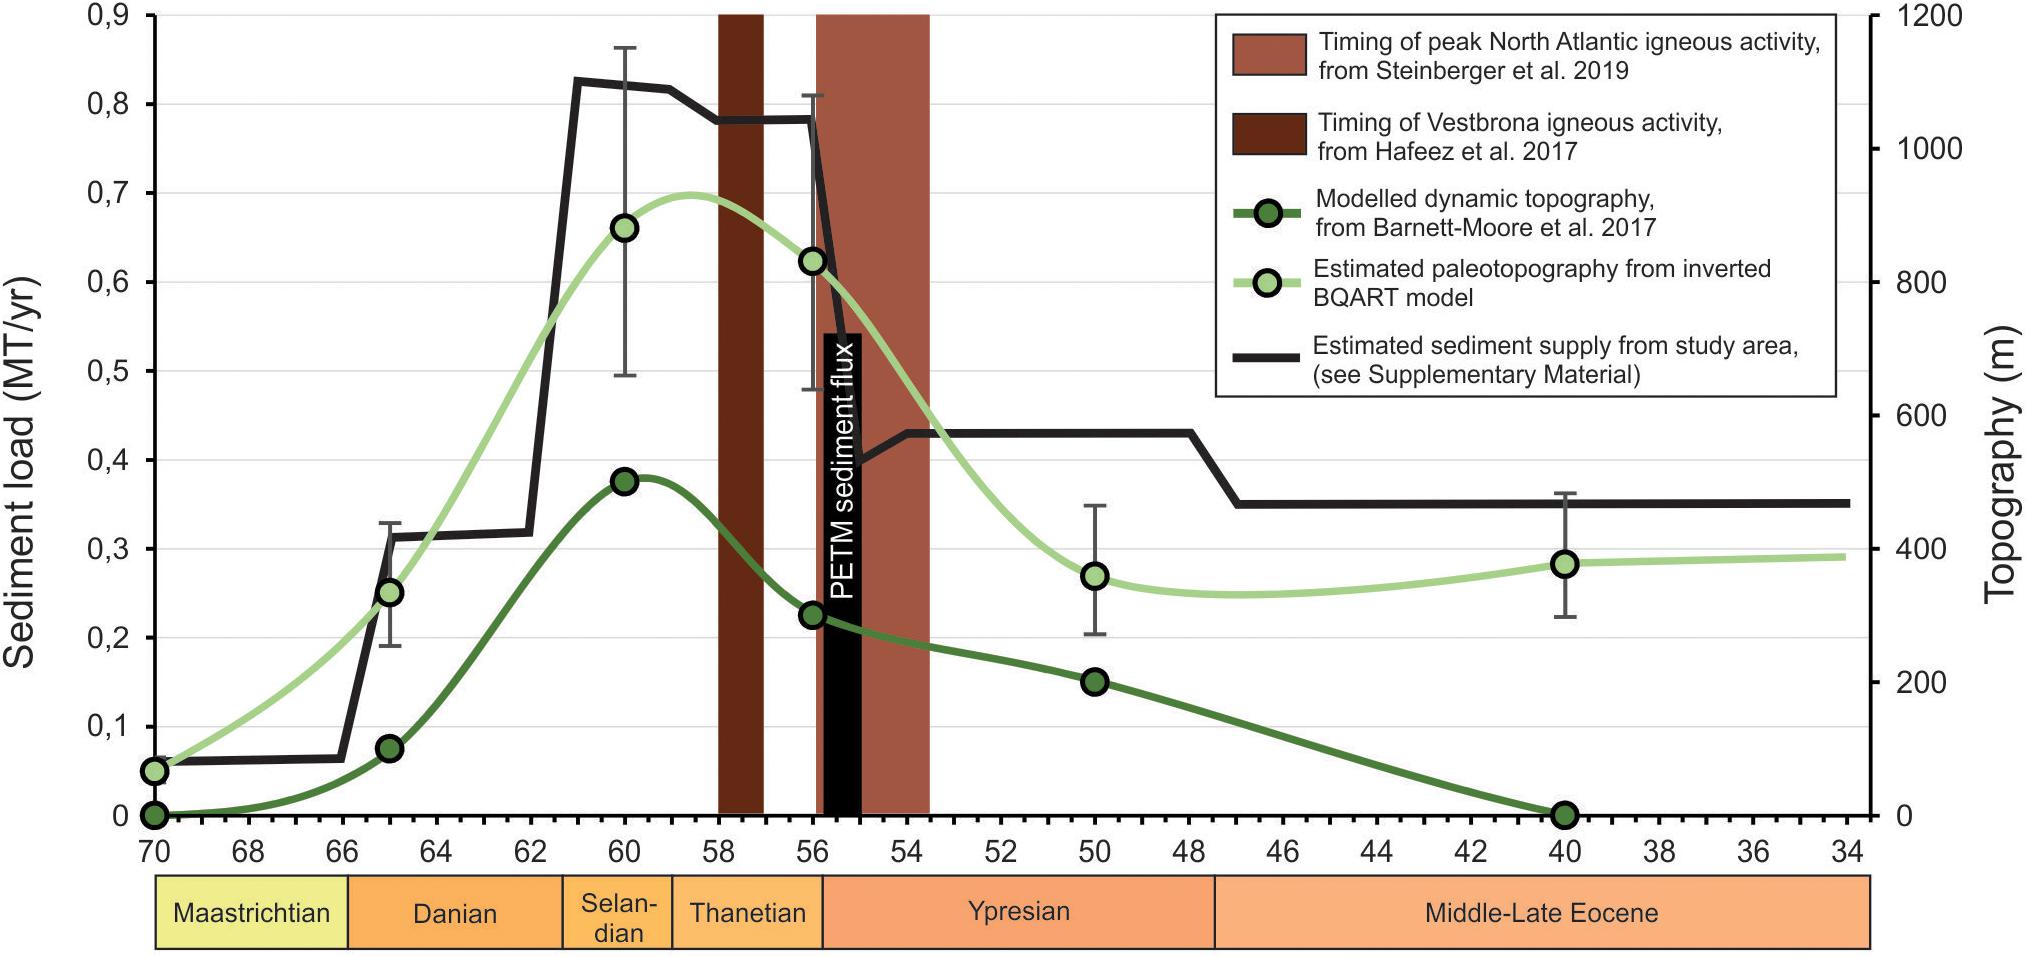
Figure 10. Plot showing calculated sediment supply and estimated paleotopography from this study together with predicted dynamic topography (uncertainty range ± 5 Myr) and magmatic intensity in the North Atlantic Igneous Province. Also shown is the estimated PETM sediment supply from this study. Maximum forced regression occurred around the PETM and coincides with the timing of peak volcanic activity in the North Atlantic and just after the Vestbrona volcanics (Figure 1).
Paleocene-Eocene Thermal Maximum sediment loads have also been estimated based on the preserved volumes in the two depocenters on the Horda Platform (Figure 7). If it is assumed that all sediments were deposited in about 170 kyr (Röhl et al., 2007), the total PETM supply is ∼0.53 MT/yr. This number is lower than the more long-term Thanetian load, but higher than the earliest Ypresian load. The PETM load is likely underestimated since the unit is relatively thin (<10 m) and below seismic resolution away from large sediment entry points (Kender et al., 2012).
Paleotopography and Denudation
Assuming the extent of the catchment feeding sediment to the SW Norwegian margin did not change significantly in size during the Paleocene-Eocene, the observed changes in sediment supply are believed to reflect long-term increase in onshore topography. When the uncertainty of input parameters to the BQART model have been accounted for in the Monte Carlo simulation (see Appendix), the model shows that the best-fit scenario for the observed sediment supply is ∼0.1 km of relief during deposition of the small Maastrichtian slope fans (Figure 3), increasing to ∼0.4 km in the Danian as more sediment is supplied to the basin (Figure 10). A relief of 0.8–0.9 km is estimated for the Selandian and Thanetian during the main phase of progradation, falling to ∼0.4 km in the Eocene when the depocenter is less confined. These estimates suggest that significant topography on the scale of 0.6-1.1 km must be inferred to explain the at least one order of magnitude increase in sediment supply during the Paleocene. However, it should be stressed that these estimates do not necessarily reflect total vertical motion or amount of denudation, as the area inboard the Møre-Trøndelag Fault Complex (Figure 1) already had pre-existing topography of around 0.5 km in the Late Cretaceous prior to dynamic uplift (Sømme et al., 2013b).
In order to speculate on the amount of catchment denudation this offshore volume amounts to, we convert the present-day Paleocene volumes to solid rock volumes by removing the porosity using average values from the offshore boreholes (45%). If we average the Paleocene solid rock volumes across the inferred range of catchment sizes (∼850–3500 km2, see Appendix), we obtain rates of ∼25–100 m/Myr in the Danian and ∼60–250 m/Myr in the Selandian and Thanetian during peak uplift. However, since erosion rates heavily depend on slope gradients, it is inferred that high-elevation areas would have seen higher rates than what is suggested here.
Discussion
We start the discussion by looking into the driver for regional uplift in the Paleocene. We then go on to discuss how that uplift together with climate perturbation is expressed along strike depending on pre-uplift, antecedent topography. We suggest that the combination of antecedent topography and dynamic topography governed sediment supply and geomorphic character of the tectonically and climatically linked shelf-slope wedges.
Mechanism for Regional Uplift
Rapid increase in sediment supply to the flanks of the North Sea basin in the Paleocene has long been attributed to hinterland uplift (e.g., Jordt et al., 1995, 2000; Martinsen et al., 1999; Skogseid et al., 2000; Anell et al., 2009, 2010). Several mechanisms have been proposed to explain this uplift, including intraplate compressional stresses linked to plate reorganization and far-field compression, lithospheric flexure driven by differential loading, and rift-related mantle dynamic processes such as emplacement of the Iceland Plume below the lithosphere (e.g., Stuevold and Eldholm, 1996; Skogseid et al., 2000; Redfield et al., 2005; Guarnieri, 2015; Stoker et al., 2018).
An angular unconformity at the BTU overlain by slides and channelized mass-transport deposits (Figure 4) together with relative ocean deepening as indicated by biostratigraphic data in borehole 35/6-2S (Figure 6), suggests regional tilting and changing slope gradients along the flanks of the basin (Gradstein and Backstrøm, 1996; Praeg et al., 2005). A similar lower Paleocene slide have also been documented on the East Shetland Platform and has been linked to mantle plume activity (Soutter et al., 2018). Isochore maps also show Paleocene thickness variations across large normal faults on the Horda Platform (Figure 3), indicating syn-tectonic deposition of at least part of the Paleocene shelf-slope wedge. Faulting and extensional stress is also indicated by Paleocene reactivation of old Caledonian fault zones onshore (Fossen et al., 2017; Kziensyk pers. comm.), suggesting that at least part of the deformation was taken up along major faults (Redfield et al., 2005).
Long-term increase in sediment supply further indicates that the mechanism driving onshore uplift was not instantaneous, but gradually increased over almost 10 Myr, from the earliest Danian to the latest Thanetian. This trend stopped with a phase of early Ypresian onlap and relative sea-level rise within and above the Balder Fm (Figures 5, 6) and just after sea-floor spreading at ∼55 Ma.
Increasing sediment supply during the Paleocene coincides with increasing dynamic topography for SW Norway as predicted by Barnett-Moore et al. (2017) (Figure 10). This period also coincides with high volcanic intensity in the North Atlantic Igneous Province, which peaked at the end of the Paleocene ∼56–54.5 Ma (Steinberger et al., 2019). This is also supported by the micropaleontology data which shows high diatom productivity in borehole 35/6-2S, pointing to higher nutrient supply to the basin in response increasing volcanic activity (Mitlehner, 1996). High magmatic activity has been attributed to the development of the Iceland Plume, and although most of the earliest (i.e., 62–63 Ma) magmatic activity is constrained to the British Isles and the breakup related magmatism (∼54–55 Ma) is found along the entire western margin of Eurasia (Figure 1), the near-coastal Vestbrona seamounts outboard the MTFC has been interpreted to represent a regional sill complex emplaced around 57–58 Ma (Hafeez et al., 2017). This documents that melt was present at lithospheric levels and in proximity to deep crustal fault complexes that are believed to have been active during the latest Cretaceous-Paleocene (Redfield et al., 2005).
In a more regional perspective, the observed changes in sediment supply and the stratigraphic relationships observed along the Norwegian mainland mirrors what has been observed along the margin of the British Isles. Recent work by Gale and Lovell (2018) suggest that incipient uplift of the British Isles started in the Late Cretaceous to Early Paleocene, similar to the onset of mass wasting along the Norwegian margin. In terms of sediment supply, Liu and Galloway (1997) observed a similar peak in sediment load around the Selandian-Thanetian transition, and White and Lovell (1997) suggested that pulses of increased sand delivery could be related to dynamic uplift of the British Isles.
Work by Smallwood and Gill (2002), Shaw Champion et al. (2008), Hartley et al. (2011) and Stucky de Quay et al. (2017) along the north-western and eastern margins of the British Isles further suggest that late Paleocene uplift and forced regression (Jones and Milton, 1994; Underhill, 2001) culminated with a phase of uplift of at least 300–500 m around the Thanetian-Ypresian transition. Subsequently, the margin was onlapped and transgressed in the Early Eocene (e.g., Underhill, 2001; Smallwood and Gill, 2002; Mudge, 2015), a process that has been linked to decreasing rates of dynamic uplift (Mackay et al., 2005; Shaw Champion et al., 2008). Similarity in timing of maximum forced regression and subsequent Ypresian transgression suggest that both the British Isles and western Norway experienced and responded to the same forcing mechanism.
Figure 10 compares the predicted dynamic uplift, igneous intensity, peak sediment supply and the timing of maximum forced regression during the PETM. The order of magnitude increase in sediment supply required significant relief of 0.6-1.1 km. If we take into account antecedent topography of around 0.5 km in the inboard areas prior to uplift (Sømme et al., 2013b), minimum values for net dynamic uplift was in the order of 0.1–0.6 km (this is discussed more in section “Along-Strike Variability and the Role of Pre-existing Topography”). These values are comparable to the predicted amplitude of dynamic uplift of ∼0.5 km at 60 ± 5 Ma from Barnett-Moore et al. (2017). If we further assume that the estimated basin-averaged denudation rates of 60–250 m/Myr reflect uplift rate, these are also similar, but on the low side of the uplift rates estimated for the northern British Isles (e.g., Shaw Champion et al., 2008; Stucky de Quay et al., 2017).
Our favored model is that regional uplift was driven by the arrival of the Iceland mantle plume as modeled by Barnett-Moore et al. (2017). But in contrast to previous studies from the British Isles (Shaw Champion et al., 2008; Hartley et al., 2011; Stucky de Quay et al., 2017), which focus on the last ∼3 Myr before break-up, we suggest that the initial phase of dynamic topography started already in the Danian. Despite favoring a mantle driver for the required uplift, we cannot rule out that also other factors played a role.
Along-Strike Variability and the Role of Pre-existing Topography
Caledonian structural inheritance is believed to have played an important role controlling the distribution of topography and drainage systems in southern Norway during the Mesozoic and Cenozoic (Gabrielsen et al., 2010). Apatite fission track data and absolute dating of faults suggest that some of these Caledonian structures have been reactivated numerous times during the during the Mesozoic and Cenozoic (Redfield et al., 2005; Medvedev and Hartz, 2015; Ksienzyk et al., 2016). It has been suggested that Late Cretaceous topography was asymmetric with the highest areas along the MTFC and lower topographies inboard the HFSZ (Gabrielsen et al., 2010), and Sømme et al. (2013b) estimated relief of around 0.5 km inboard the MTFC in the Late Cretaceous based on the presence of coarse clastic fan systems along the margin. Similarly, Sømme et al. (2013b) estimated that the Late Cretaceous topography was <0.5 km further south, inboard the Stord Basin, based on the absence of coarse clastic material in Late Cretaceous fine-grained sediments. This antecedent topography probably dominated the landscape prior to uplift and the modeled distribution of the Iceland plume (Skogseid et al., 2000; Barnett-Moore et al., 2017) suggest that this pattern was amplified during the Paleocene.
A strong north-south topographic gradient is also inferred from the stratigraphic units mapped in this study (Figure 11). On the northern Horda Platform and on the Måløy Slope where also the onshore-offshore gradient was relatively steep (Figure 2) and where the rejuvenated topography is estimated to have been 0.6-1.1 km, the Paleocene unit covers an area of ∼12000 km2 and is up to ∼900 m thick. In the Stord Basin where the onshore-offshore gradients were more gentle, lower dynamic uplift of an already lower antecedent landscape (<0.5 km) produced a significantly smaller (∼600 km2) and thinner Paleocene unit, which only reached ∼400 m in the Stord Basin.
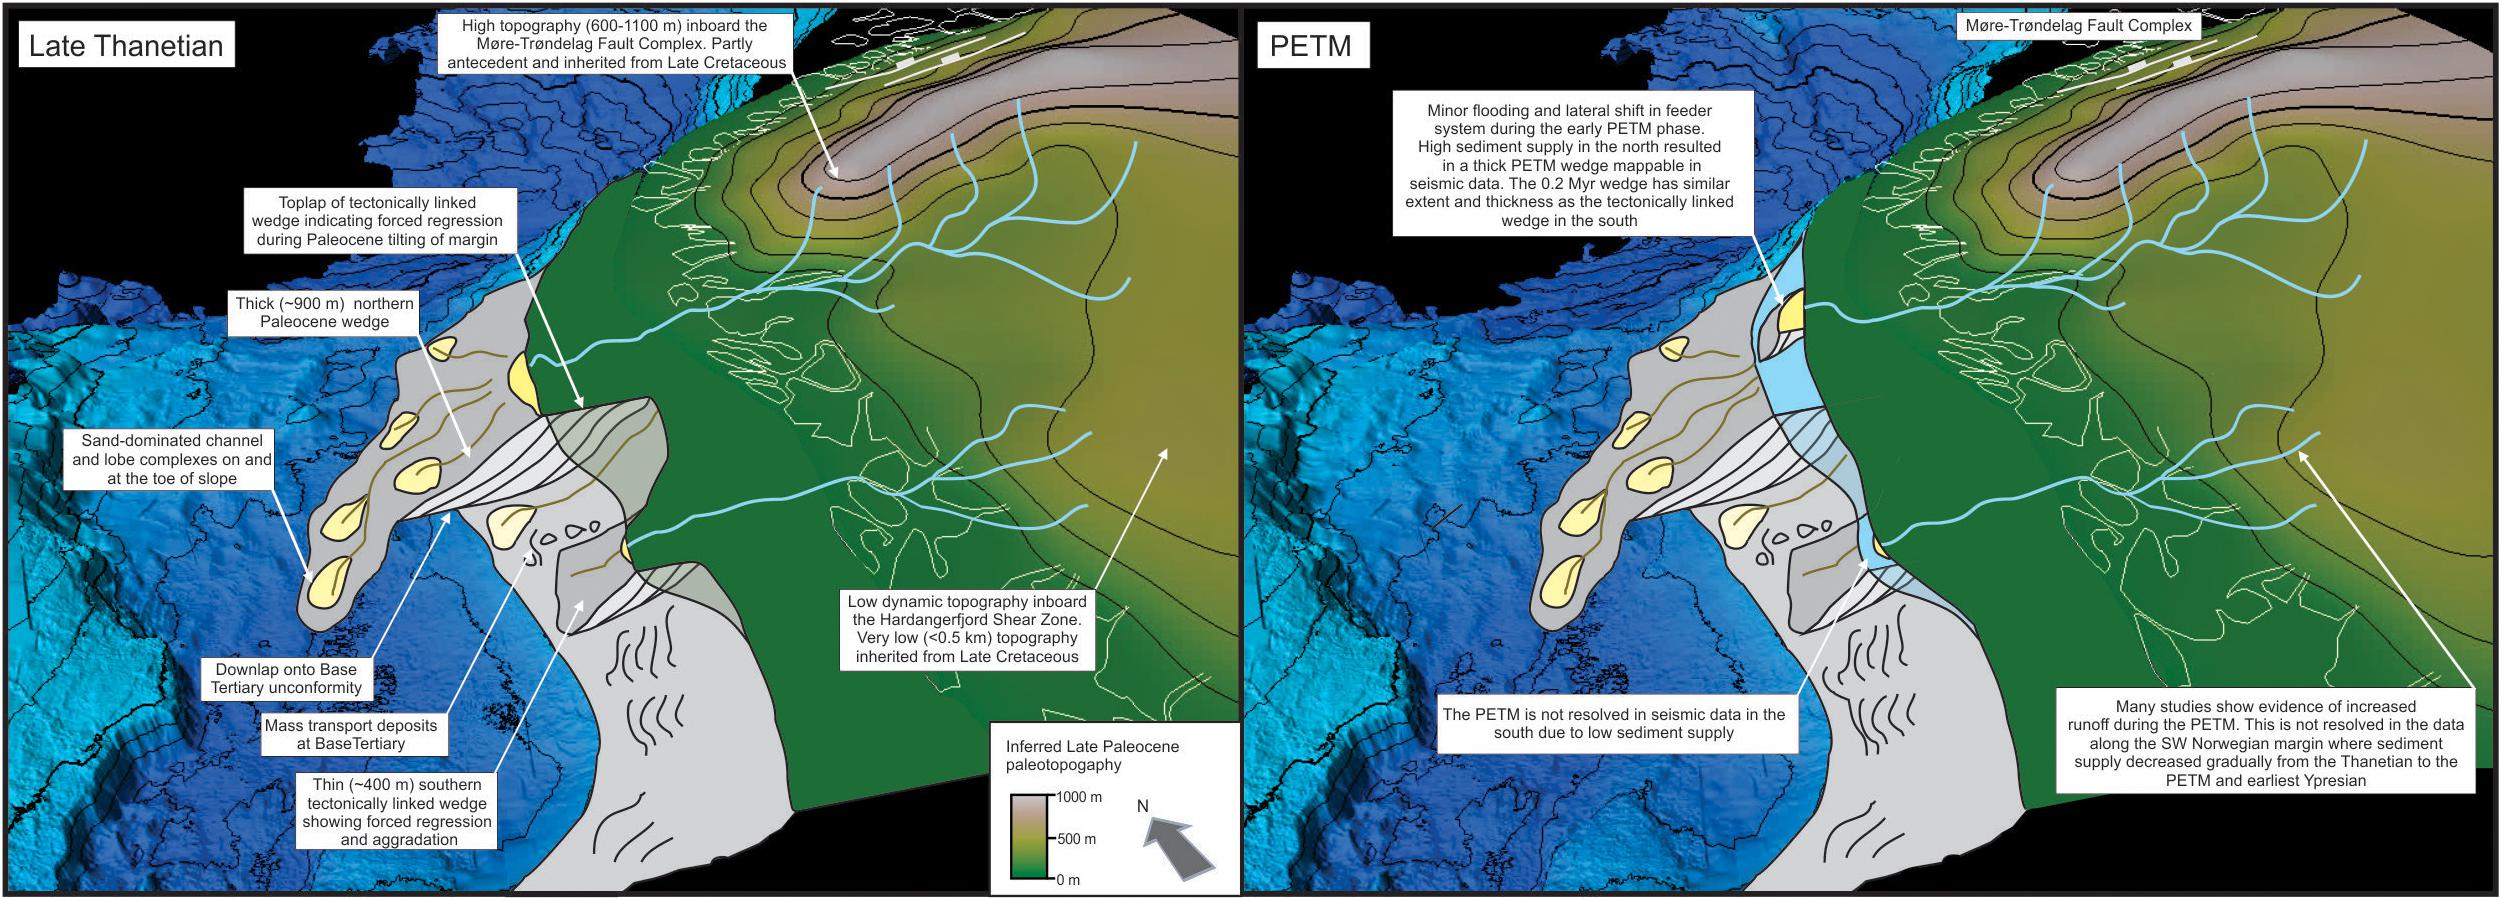
Figure 11. Cartoon showing the inferred topographic and depositional situation in the Late Paleocene and during the PETM. The lower blue surface is the Base Tertiary unconformity. Two tectonically linked wedges prograde into the basin, but the areal extent, internal seismic stratigraphic geometries and thickness depend on along-strike variability in inherited Cretaceous topography and Paleocene dynamic topography. During the 0.2 Myr PETM event, only the northern system had sufficient sediment supply to form a mappable wedge in seismic data. The PETM in the southern area is below seismic resolution. White line shows the present-day coastline. Light blue lines indicate the approximate location of the Paleocene river systems. Cartoon is not to scale.
Another difference between the northern and southern depocenters is the timing of onlap and backstepping. In the area around 35/6-2S, onlap and backstepping occurred in the Ypresian, after the PETM (Figure 5). In the Stord Basin, the transition from forced regression to aggradation occurred earlier, within the Thanetian unit, and the main phase of onlap occurred at the top Thanetian horizon (Figure 8). This indicates that the transition from low A/S (accommodation space vs. sediment supply) to high A/S conditions took place earlier in southern depocenter. This could be related to regional differences in dynamic topography during the waning phase. Or it could be related to lag-times between timing of uplift and transfer of the erosional signal to the offshore depocenter (Willenbring et al., 2013; Li et al., 2018). Despite a phase of Early Eocene onlap in the north, the area continued to supply coarse clastics throughout the Eocene, indicating significant onshore topography long after break-up (Figure 3). In the south, on the other hand, no more coarse clastics were supplied to the basin in the Eocene, suggesting regional backstepping of the depocenter.
Recognizing Tectonic and Climatic Perturbations in Subsurface Data
The initial response to long-term (∼10 Myr) dynamic uplift of SW Norway was the formation of the angular BTU. The BTU is overlain by large slides and channelized mass-transport deposits in the southern part, and sand-dominated slope channels and fan complexes in the northern part of the study area (Figure 4). This phase also marks the transition from underfilled (basinward thickening wedge) to overfilled basin configuration (landward thickening wedge), associated with shelf-slope progradation (Figure 2). This pattern of angular truncation, mass-wasting, followed by downlap of the shelf-slope wedge is thus considered to be the manifestation of the initial phase of tectonic perturbation along the margin.
Timing of peak dynamic uplift was associated with sediment supply about one order of magnitude higher than before uplift started. The peak uplift phase was also dominated by forced regression where relatively coarse-grained sediments were delivered to local depocenters showing little evidence of lateral shifting of sediment entry points (Selandian and Thanetian in Figures 3, 11). In terms of sediment partitioning, it is expected that most sediments were bypassed to and beyond the shelf break and that little was retained in topset during this phase, similar to what has been described on the East Shetland Platform (e.g., Underhill, 2001).
Decreasing sediment supply in the latest Thanetian (Stord Basin) to early Ypresian (Måløy Slope) coincides with the aggradation, onlap and backstepping of depocenters, as discussed above. Forced regressive wedges overlain by aggradational to backstepping deposits documenting a significant shift toward high A/S conditions and a widening of the depocenters are thus considered to be a manifestation of the relaxing phase of the tectonic perturbation.
High-frequency climate change during the PETM occurred toward the end of the phase of maximum tectonic perturbation. Although the entire margin is believed to have experienced forced regression with high sediment input during the end of the Thanetian, the base of the PETM interval is characterized by a distinct downlap surface, suggesting that a rapid rise in base-level (perhaps in the order of 20–30 m, Sluijs et al., 2008) was sufficient to flood parts of the shelf (Figures 5, 9). Also, the location of the two PETM depocenters on the flanks of the underlying Thanetian wedge indicates compensational stacking and reorganization of the sediment entry points (Figure 7). Despite initial reorganization, the PETM interval is overall regressive indicating high sediment supply. But although several PETM sites describe increased continental run-off and sediment supply (Schmitz and Pujalte, 2003; Foreman et al., 2012; Kender et al., 2012; Stassen et al., 2012; Carmichael et al., 2017), the data resolution in this study is not able to resolve a deviation from the longer-term trend (Figure 10), and the PETM supply is lower than the preceding Thanetian supply and higher than the following early Ypresian (Balder Fm) supply (Supplementary Table S1). The seismic data does not reveal the top of the PETM interval as a key surface and borehole 35/6-2S (Figure 6) suggest that the system continued to supply sandy sediment also after the PETM (Figure 9). Similar observations have also been described from outcrops, pointing to a potential lag-time between the perturbation of the climate system and the stratigraphic response (Foreman et al., 2012).
Climatic perturbations linked to global warming and relative sea-level rise can thus be recognized by a local downlap surface and reorganization of feeder systems. This is well expressed where the climate perturbation is superimposed on a period of forced regression, but might have been more difficult to identify if the perturbation was superimposed on a longer-term phase of increasing accommodation or strong autogenic behavior (Toby et al., 2019). The climatic events can also readily be recognized in biostratigraphic data, but this study shows that they may not cause a change in sediment supply that is detectable in seismic data. In addition, these PETM depocenters are local (∼80–120 km2) compared to the overall Thanetian wedge (∼12000 km2), indicating that they could have been missed if only 2D seismic reflection data was available, or wrongly interpreted without borehole and biostratigraphic data.
Since the thickness and lateral extent of the climatic wedges in the north are similar to the tectonic wedge in the south (Figure 7), it is clear that the morphometrics of the individual routing system and the resulting sediment supply is instrumental for how tectonic and climatic perturbations can be recognized and separated in subsurface data. In a relatively low-supply system like the one in the Stord Basin, a short-lived event like the PETM will be below seismic resolution and can only be recognized in borehole data with high-resolution biostratigraphic sampling (Figure 11; e.g., Kender et al., 2012). Only a multi-million-year tectonic perturbation leaves a mappable shelf-slope wedge in this area (Figure 8). If the sediment supply from a catchment is sufficiently high (>∼0.9 MT/yr) like in the northern area, and if the sediments are deposited in areas with relatively high accommodation, we infer that short-lived climatic perturbations can produce stratigraphic units that are mappable on seismic data. This study shows that thickness, sediment supply and areal extent of the resulting shelf-slope wedges may not be sufficient to recognize the same perturbations in different systems and that internal stratigraphic architecture is the best recognition criteria across all scales.
Conclusion
• This study documents a tectonically linked, shelf-slope wedge (up to 900 m thick) that resulted from ∼10 million years of gradual uplift and hinterland denudation of the Norwegian landmass in the Paleocene. The thickness of the wedge varies significantly along strike depending on antecedent topography and later dynamic uplift.
• The wedge is recognized by an angular unconformity at the base, which formed in response to slope steepening and mass-wasting of underlying sediments. The unconformity is downlapped by progradational shelf-slope wedges that can be tied to specific sediment entry points. In the Stord Basin, internal toplap geometries indicates forced regression. The top of the wedges is marked by a regional onlap surface of earliest Eocene age.
• Superimposed on the tectonically linked Paleocene wedge, two localized, climatically linked depocenters have been mapped. The areal extent of these wedges is an order of magnitude smaller than the underlying tectonic wedge. The northern wedge, which is well-constrained by biostratigraphic data, is up to 130 m thick and represents 150–200 kyr of deposition during the PETM.
• The climatically linked wedges are marked by a minor flooding surface at the base, which is recognized in both seismic and borehole data, documenting early PETM reorganization of the sediment dispersal system to the flanks of the underlying Thanetian system. The top of the wedge is not characterized by changes in lithology or specific stratal terminations in seismic data.
• Recognition of high-frequency climatic perturbations in seismic data depends on sediment supply and available accommodation space at the time of deposition. In relatively high accommodation settings where sediment supply is least 0.9 MT/yr, climate perturbations operating at 104 year time-scales have the potential to leave stratigraphic units that can be mapped in seismic data. In areas with significantly lower supply, the resulting stratigraphic response might be below seismic resolution, like in the southern Stord Basin.
• Key differences between tectonically and climatically linked wedges within the same routing system are the areal extent and the internal stratal geometries of the depositional units.
• When comparing different systems along strike, thickness, areal extent and sediment supply estimates alone is not diagnostic of specific perturbations. Internal stacking patterns and stratal termination styles are the best tools to separate climatic vs. tectonic perturbations in the study area.
Data Availability Statement
The main dataset used in this study (seismic survey CGG18M01) is not publicly available and is the property of CGG MCNV. 2D seismic reflection lines from TE90 and original borehole data are publicly available by request through the Diskos databank (https://portal.diskos.cgg.com/whereoil-data/).
Author Contributions
TS designed the study, conducted the main analysis, and wrote the main body of the manuscript. JS, PE, and HL were involved in data interpretation, discussion, and manuscript writing.
Funding
This study was funded by Equinor ASA.
Conflict of Interest
All authors were employed by company Equinor ASA.
Acknowledgments
We thank Equinor for permission to publish this study and CGG MCNV for allowing us to publish seismic data. Torbjørn Dahlgren, Torbjørn Fristad, and Arthur Guillien have provided input and valuable discussions. Trond Torsvik kindly provided age data for the North Atlantic Igneous Province. The editor and reviewers contributed valuable comments and suggestions, which helped to improve the manuscript.
Supplementary Material
The Supplementary Material for this article can be found online at: https://www.frontiersin.org/articles/10.3389/feart.2019.00303/full#supplementary-material
TABLE S1 | Morphometrics and calculated sediment supplies for the different stratigraphic units.
References
Abdelmalak, M., Planke, S., Faleide, J., Jerram, D., Zastrozhnov, D., Eide, S., et al. (2016). The development of volcanic sequences at rifted margins: new insights from the structure and morphology of the Vøring Escarpment, mid – Norwegian Margin. J. Geophys. Res. 121, 5212–5236. doi: 10.1002/2015jb012788
Andersen, T. B. (1998). Extensional tectonics in the caledonides of southern Norway, an overview. Tectonophysics 285, 333–351. doi: 10.1016/s0040-1951(97)00277-271
Allen, P.A. (2008). “Time scales of tectonic landscapes and their sediment routing systems,” in Landscape Evolution : Denudation, Climate and Tectonics Over Different Time and Space Scales, eds K. Gallagher, S.J. Jones, and J. Wainwright. (London: Geological Society Of London), 7–28. doi: 10.1144/sp296.2
Anell, I., Thybo, H., and Artemieva, I. M. (2009). Cenozoic uplift and subsidence in the North Atlantic region: geological evidence revisited. Tectonophysics 474, 78–105. doi: 10.1016/j.tecto.2009.04.006
Anell, I., Thybo, H., and Stratford, W. (2010). Relating Cenozoic North Sea sediments to topography in southern Norway: the interplay between tectonics and climate. Earth Planet. Sci. Lett. 300, 19–32. doi: 10.1016/j.epsl.2010.09.009
Baby, G., Guillocheau, F., Morin, J., Ressouche, J., Robin, C., Broucke, O., et al. (2018). Post-rift stratigraphic evolution of the Atlantic margin of Namibia and South Africa: implications for the vertical movements of the margin and the uplift history of the South African Plateau. Mar. Pet. Geol. 97, 169–191. doi: 10.1016/j.marpetgeo.2018.06.030
Baig, I., Faleide, J. I., Mondol, N. H., and Jahren, J. (2019). Burial and exhumation history controls on shale compaction and thermal maturity along the Norwegian North Sea basin margin areas. Mar. Pet. Geol. 104, 61–85. doi: 10.1016/j.marpetgeo.2019.03.010
Barnett-Moore, N., Hassan, R., Flament, N., and Muller, R. D. (2017). The deep Earth origin of the Iceland plume and its effects on regional surface uplift and subsidence. Solid Earth 8, 235–254. doi: 10.5194/se-8-235-2017
Braun, J., Guillocheau, F., Robin, C., Baby, G., and Jelsma, H. (2014). Rapid erosion of the Southern African Plateau as it climbs over a mantle superswell. J. Geophys. Res. 119, 6093–6112. doi: 10.1002/2014jb010998
Bugge, T., Tveiten, B., and Bäckström, S. (2001). “The depositional history of the Cretaceous in the northeastern north sea,” in Sedimentary Environments Offshore Norway - Palaeozoic to Recent, eds O. J. Martinsen and T. Dreyer, (Berlin: Elsevier), 279–291. doi: 10.1016/s0928-8937(01)80018-7
Burgess, P. M., and Prince, G. D. (2015). Non-unique stratal geometries: implications for sequence stratigraphic interpretations. Basin Res. 27, 351–365. doi: 10.1111/bre.12082
Campanile, D., Nambiar, C. G., Bishop, P., Widdowson, M., and Brown, R. (2008). Sedimentation record in the Konkan-Kerala Basin: implications for the evolution of the Western Ghats and the Western Indian passive margin. Basin Res. 20, 3–22. doi: 10.1111/j.1365-2117.2007.00341.x
Carmichael, M. J., Inglis, G. N., Badger, M. P., Naafs, B. D. A., Behrooz, L., Remmelzwaal, S., et al. (2017). Hydrological and associated biogeochemical consequences of rapid global warming during the Paleocene-Eocene Thermal Maximum. Glob. Planet. Change 157, 114–138. doi: 10.1016/j.gloplacha.2017.07.014
Castelltort, S., and Van den Driessche, J. (2003). How plausible are high-frequency sediment supply-driven cycles in the stratigraphic record? Sedimentary Geol. 157, 3–13. doi: 10.1016/s0037-0738(03)00066-6
Dam, G., Larsen, M., and Sønderholm, M. (1998). Sedimentary response to mantle plumes: implications from Paleocene onshore successions, West and East Greenland. Geology 26, 207–210.
Dmitrieva, E., Jackson, C. A.-L., Huuse, M., and Kane, I. A. (2018). “Regional distribution and controls on the development of post-rift turbidite systems: insights from the Paleocene of the eastern North Viking Graben, offshore Norway,” in Proceedings of the Geological Society, London, Petroleum Geology Conference series, London.
Duller, R. A., Armitage, J. J., Manners, H. R., Grimes, S., and Jones, T. D. (2019). Delayed sedimentary response to abrupt climate change at the Paleocene-Eocene boundary, northern Spain. Geology 47, 159–162. doi: 10.1130/g45631.1
Dypvik, H., Riber, L., Burca, F., Rüther, D., Jargvoll, D., Nagy, J., et al. (2011). The Paleocene–Eocene thermal maximum (PETM) in Svalbard—clay mineral and geochemical signals. Palaeogeogr. Palaeoclimatol. Palaeoecol. 302, 156–169. doi: 10.1016/j.palaeo.2010.12.025
Eide, C. H., Müller, R., and Helland-Hansen, W. (2018). Using climate to relate water discharge and area in modern and ancient catchments. Sedimentology 65, 1378–1389. doi: 10.1111/sed.12426
Eldholm, O., Thiede, J., and Taylor, E. eds (1989). “Evolution of the Vøring volcanic margin,” in Proceedings of the Ocean Drilling Program. Scientific Results, (Ocean Drilling Program: College Station. TX), 1033–1065.
Eldrett, J., Greenwood, D., Polling, M., Brinkhuis, H., and Sluijs, A. (2014). A seasonality trigger for carbon injection at the Paleocene–Eocene Thermal Maximum. Clim. Past 10, 759–769. doi: 10.5194/cp-10-759-2014
Faleide, J. I., Kyrkjebø, R., Kjennerud, T., Gabrielsen, R. H., and Jordt, H. (2002). “Tectonic impact on sedimentary processes during Cenozoic evolution of the northern North Sea and surrounding areas,” in Exhumation of the North Atlantic Margin: Timing, Mechanisms, and Implications for Petroleum Exploration: Geological Society (London) Special Publication, eds A. G. Doré, J. A. Cartwright, M. S. Stoker, J. P. Turner, and N. White, (London: Geological Society Of London), 235–269. doi: 10.1144/gsl.sp.2002.196.01.14
Foreman, B. Z., Heller, P. L., and Clementz, M. T. (2012). Fluvial response to abrupt global warming at the Palaeocene/Eocene boundary. Nature 491:92. doi: 10.1038/nature11513
Forzoni, A., Storms, J. E., Whittaker, A. C., and de Jager, G. (2014). Delayed delivery from the sediment factory: modeling the impact of catchment response time to tectonics on sediment supply and fluvio-deltaic stratigraphy. Earth Surf. Process. Landforms 39, 689–704. doi: 10.1002/esp.3538
Fossen, H., and Dunlap, W. J. (1998). Timing and kinematics of Caledonian thrusting and extensional collapse, southern Norway: evidence from Ar-40/Ar-39 thermochronology. J. Struct. Geol. 20, 765–781. doi: 10.1016/s0191-8141(98)00007-8
Fossen, H., Khani, H. F., Faleide, J. I., Ksienzyk, A. K., and Dunlap, W. J. (2017). Post-Caledonian extension in the West Norway–northern North Sea region: the role of structural inheritance. Geol. Soc. Lond. Special Publ. 439, 465–486. doi: 10.1144/sp439.6
Gabrielsen, R. H., Faleide, J. I., Pascal, C., Braathen, A., Nystuen, J. P., Etzelmuller, B., et al. (2010). Latest Caledonian to Present tectonomorphological development of southern Norway. Mar. Pet. Geol. 27, 709–723. doi: 10.1016/j.marpetgeo.2009.06.004
Gale, A. S., and Lovell, B. (2018). The Cretaceous–Paleogene unconformity in England: uplift and erosion related to the iceland mantle plume. Proceedings of the Geologists’. Association 129, 421–435. doi: 10.1016/j.pgeola.2017.04.002
Gjelberg, J. G., Enoksen, T., Kjaernes, P., Mangerud, G., Martinsen, O. J., Roe, E., et al. (2001). “The Maastrichtian and Danian depositional setting, along the eastern margin of the Møre Basin (mid-Norwegian Shelf): implications for reservoir development of the Ormen Lange Field,” in Sedimentary Environments Offshore Norway - Paleozoic to Recent, eds O. J. Martinsen, and T. Dreyer, (Berlin: Elsevier), 421–440. doi: 10.1016/s0928-8937(01)80025-4
Gradstein, F., and Backstrøm, S. (1996). Cainozoic biostratigraphy and palaeobathymetry, northern North Sea and Haltenbanken. Norsk Geol. Tidsskrift 76, 3–32.
Gradstein, F. M., Kaminski, M. A., Berggren, W. A., Kristiansen, I. L., and D’Iorio, M. A. (1994). Cenozoic Biostratigraphy of the North Sea and Labrador Shelf. Micropaleontology 40, 3–32. doi: 10.2307/1485906
Gradstein, F. M., Ogg, J. G., Schmitz, M., and Ogg, G. (2012). The Geologic Time Scale 2012. Berlin: Elsevier.
Guarnieri, P. (2015). Pre-break-up palaeostress state along the East Greenland margin. J. Geol. Soc. 172, 727–739. doi: 10.1144/jgs2015-053
Hafeez, A., Planke, S., Jerram, D. A., Millett, J. M., Maharjan, D., and Prestvik, T. (2017). Upper Paleocene ultramafic igneous rocks offshore mid-Norway: reinterpretation of the Vestbrona Formation as a sill complex. Interpretation 5, SK103–SK120.
Hall, A. M., Gilg, H. A., Fallick, A. E., and Merritt, J. W. (2015). Kaolins in gravels and saprolites in north-east Scotland: evidence from stable H and O isotopes for Palaeocene–Miocene deep weathering. Palaeogeogr. Palaeoclimatol. Palaeoecol. 424, 6–16. doi: 10.1016/j.palaeo.2015.02.019
Hamberg, L., Dam, G., Wilhelmson, C., and Ottesen, T. G. (2005). “Paleocene deep-marine sandstone plays in the Siri Canyon, offshore Denmark-southern Norway,” in Petroleum Geology; North-West Europe and Global Perspectives; Proceedings of the 6th Petroleum Geology Conference, eds A. G. Doré, and B. A. Vining, (London: Geological Society London), 1185–1198. doi: 10.1144/0061185
Hartley, R. A., Roberts, G. G., White, N., and Richardson, C. (2011). Transient convective uplift of an ancient buried landscape. Nat. Geosci. 4:562. doi: 10.1038/ngeo1191
Jackson, C. A. L., Barber, G. P., and Martinsen, O. J. (2008). Submarine slope morphology as a control on the development of sand-rich turbidite depositional systems: 3D seismic analysis of the Kyrre Fm (Upper Cretaceous), Maloy Slope, offshore Norway. Mar. Pet. Geol. 25, 663–680. doi: 10.1016/j.marpetgeo.2007.12.007
Jarsve, E. M., Faleide, J., Gabrielsen, R., Nystuen, J. P., Martinius, A., Ravnås, R., et al. (2014). “Mesozoic and Cenozoic basin configurations in the North Sea,” in From Depositional Systems to Sedimentary Successions on the Norwegian Continental Margin, eds A. W. Martinius, R. Ravnås, J. Howell, T. Olsen, R. J. Steel, and J. Wonham, 417–452. doi: 10.1002/9781118920435.ch15
Jones, R. W., and Milton, N. J. (1994). Sequence development during uplift: palaeogene stratigraphy and relative sea-level history of the outer Moray Firth. UK North Sea. Mar. Pet. Geol. 11, 157–165. doi: 10.1016/0264-8172(94)90092-2
Jones, S. M., White, N., Clarke, B. J., Rowley, E., and Gallagher, K. (2002). “Present and past influence of the Iceland Plume on sedimentation,” in Geological Society, London, Special Publications, eds A. G. Doré, J. A. Cartwright, M. S. Stoker, J. P. Turner, and N. J. White, (London: Geological Society London), 13–25. doi: 10.1144/gsl.sp.2002.196.01.02
Jordt, H., Faleide, J. I., Bjorlykke, K., and Ibrahim, M. T. (1995). Cenozoic Sequence Stratigraphy of the Central and Northern North-Sea Basin – Tectonic Development, Sediment Distribution and Provenance Areas. Mar. Pet. Geol. 12, 845–879. doi: 10.1016/0264-8172(95)98852-v
Jordt, H., Thyberg, B. I., and Nottvedt, A. (2000). “Cenozoic evolution of the central and northern North Sea with focus on differential vertical movements of the basin floor and surrounding clastic source areas,” in Dynamics of the Norwegian margin: Geological Society (London) Special Publication, eds A. Nøttvedt, and B. T. Larsen, (London: Geological Society London), 219–243. doi: 10.1144/gsl.sp.2000.167.01.09
Kender, S., Stephenson, M. H., Riding, J. B., Leng, M. J., Knox, R. W. B., Peck, V. L., et al. (2012). Marine and terrestrial environmental changes in NW Europe preceding carbon release at the Paleocene–Eocene transition. Earth Planet. Sci. Lett. 353, 108–120. doi: 10.1016/j.epsl.2012.08.011
Kennett, J. P., and Stott, L. (1991). Abrupt deep-sea warming, palaeoceanographic changes and benthic extinctions at the end of the Palaeocene. Nature 353:225. doi: 10.1038/353225a0
Kjoberg, S., Schmiedel, T., Planke, S., Svensen, H. H., Millett, J. M., Jerram, D. A., et al. (2017). 3D structure and formation of hydrothermal vent complexes at the Paleocene-Eocene transition, the Møre Basin, mid-Norwegian margin. Interpretation 5, SK65–SK81.
Ksienzyk, A. K., Wemmer, K., Jacobs, J., Fossen, H., Schomberg, A. C., Süssenberger, A., et al. (2016). Post-Caledonian brittle deformation in the Bergen area, West Norway: results from K–Ar illite fault gouge dating. Nor. J. Geol. 96, 275–299.
Li, Q., Gasparini, N. M., and Straub, K. M. (2018). Some signals are not the same as they appear: how do erosional landscapes transform tectonic history into sediment supply records? Geology 46, 407–410. doi: 10.1130/g40026.1
Liu, X., and Galloway, W. E. (1997). Quantitative determination of tertiary sediment supply to the North Sea Basin. AAPG Bull. 81, 1482–1509.
Mackay, L., Turner, J., Jones, S., and White, N. (2005). Cenozoic vertical motions in the Moray Firth Basin associated with initiation of the Iceland Plume. Tectonics 24:23. doi: 10.1029/2004TC001683
Mancin, N., Di Giulio, A., and Cobianchi, M. (2009). Tectonic vs. climate forcing in the Cenozoic sedimentary evolution of a forelandbasin (Eastern Southalpine system. Italy). Basin Res. 21, 799–823. doi: 10.1111/j.1365-2117.2009.00402.x
Martinsen, O. J., Boen, F., Charnock, M. A., Mangerud, G., and Nottvedt, A. (1999). “Cenozoic development of the Norwegian margin 60-64 degrees N; sequences and sedimentary response to variable basin physiography and tectonic setting,” in Petroleum Geology of Northwest Europe: Proceedings of the 5th Conference: Geological Society (London), eds A. J. Fleet, S. A. R. Boldy, and S. D. Burley, (London: Geological Society London), 293–304. doi: 10.1144/0050293
Martinsen, O. J., Lien, T., and Jackson, C. (2005). “Cretaceous and Palaeogene turbidite systems in the North Sea and Norwegian Sea Basins: source, staging area and basin physiography controls on reservoir development,” in Petroleum Geology: North-West Europe and Global Perspectives - Proceedings of the 6th Petroleum Geology Conference: Geological Society (London), ed. A. Vining, (London: Geological Society London), 1147–1164. doi: 10.1144/0061147
Medvedev, S., and Hartz, E. H. (2015). Evolution of topography of post-Devonian Scandinavia: effects and rates of erosion. Geomorphology 231, 229–245. doi: 10.1016/j.geomorph.2014.12.010
Mitlehner, A. G. (1996). Palaeoenvironments in the North Sea Basin around the Paleocene-Eocene boundary: evidence from diatoms and other siliceous microfossils. Geol. Soc. Lond. Special Publ. 101, 255–273. doi: 10.1144/gsl.sp.1996.101.01.15
Morton, A. C. (1992). “Provenance of Brent Group sandstones: heavy mineral constraints,” in Geology of the Brent Group, eds A. C. Morton, R. S. Hasszeldine, M. R. Giles, and S. Brown, (London: Geological Society London), 227–244. doi: 10.1144/gsl.sp.1992.061.01.13
Mudge, D. C. (2015). “Regional controls on Lower Tertiary sandstone distribution in the North Sea and NE Atlantic margin basins,” in Geological Society, London, Special Publications, eds T. McKie, P. T. S. Rose, A. J. Hartley, D. W. Jones, and T. L. Armstrong, (London: Geological Society London), 17–42. doi: 10.1144/sp403.5
Nadin, P., and Kusznir, N. (1995). Palaeocene uplift and Eocene subsidence in the northern North Sea Basin from 2D forward and reverse stratigraphic modelling. J. Geol. Soc. 152, 833–848. doi: 10.1144/gsjgs.152.5.0833
Nagy, J., Jargvoll, D., Dypvik, H., Jochmann, M., and Riber, L. (2013). Environmental changes during the Paleocene–Eocene Thermal Maximum in Spitsbergen as reflected by benthic foraminifera. Pol. Res. 32:19737. doi: 10.3402/polar.v32i0.19737
Nielsen, O. B., Rasmussen, E. S., and Thyberg, B. I. (2015). Distribution of clay minerals in the Northern North Sea basin during the Paleogene and Neogene: a result of source-area geology and sorting processes. J. Sedimentary Res. 85, 562–581. doi: 10.2110/jsr.2015.40
Ottesen, D., Dowdeswell, J. A., and Bugge, T. (2014). Morphology, sedimentary infill and depositional environments of the Early Quaternary North Sea Basin (56–62 N). Mar. Pet. Geol. 56, 123–146. doi: 10.1016/j.marpetgeo.2014.04.007
Overeem, I., Weltje, G. J., Bishop-Kay, C., and Kroonenberg, S. (2001). The Late Cenozoic Eridanos delta system in the Southern North Sea Basin: a climate signal in sediment supply? Basin Res. 13, 293–312. doi: 10.1046/j.1365-2117.2001.00151.x
Peizhen, Z., Molnar, P., and Downs, W. R. (2001). Increased sedimentation rates and grain sizes 2–4 Myr ago due to the influence of climate change on erosion rates. Nature 410:891. doi: 10.1038/35073504
Planke, S., and Alvestad, E. (1999). Seismic volcanostratigraphy of the extrusive breakup complexes in the northeast Atlantic: implications from ODP/DSDP drilling. Proc. Ocean Drill. Prog. 163, 3–16.
Praeg, D., Stoker, M. S., Shannon, P. M., Ceramicola, S., Hjelstuen, B., Laberg, J. S., et al. (2005). Episodic Cenozoic tectonism and the development of the NW European ‘passive’ continental margin. Mar. Pet. Geol. 22, 1007–1030. doi: 10.1016/j.marpetgeo.2005.03.014
Redfield, T. F., Osmundsen, P. T., and Hendriks, B. W. H. (2005). The role of fault reactivation and growth in the uplift of western Fennoscandia. J. Geol. Soc. 162, 1013–1030. doi: 10.1144/0016-764904-149
Riis, F. (1996). Quantification of Cenozoic vertical movements of Scandinavia by correlation of morphological surfaces with offshore data. Glob. Planet. Change 12, 331–357. doi: 10.1016/0921-8181(95)00027-5
Ritchie, J., Gatliff, R., and Richards, P. (1999). “Early Tertiary magmatism in the offshore NW UK margin and surrounds,” in Proceedings of the Geological Society, London, Petroleum Geology Conference series, London.
Röhl, U., Westerhold, T., Bralower, T. J., and Zachos, J. C. (2007). On the duration of the Paleocene – Eocene thermal maximum (PETM). Geochem. Geophys. Geosyst. 8.
Romans, B. W., Castelltort, S., Covault, J. A., Fildani, A., and Walsh, J. (2016). Environmental signal propagation in sedimentary systems across timescales. Earth Sci. Rev. 153, 7–29. doi: 10.1016/j.earscirev.2015.07.012
Samanta, A., Bera, M. K., and Sarkar, A. (2016). Climate-modulated sequence development in a tropical rift basin during the Late Palaeocene to Early Eocene super greenhouse Earth. Sedimentology 63, 917–939. doi: 10.1111/sed.12243
Schmitz, B., and Pujalte, V. (2003). Sea-level, humidity, and land-erosion records across the initial Eocene thermal maximum from a continental-marine transect in northern Spain. Geology 31, 689–692.
Séranne, M. (1999). Early Oligocene stratigraphic turnover on the west Africa continental margin: a signature of the Tertiary greenhouse-to-icehouse transition? Terra Nova Oxford 11, 135–140. doi: 10.1046/j.1365-3121.1999.00246.x
Shaw Champion, M., White, N., Jones, S., and Lovell, J. (2008). Quantifying transient mantle convective uplift: an example from the Faroe – Shetland basin. Tectonics 27:TC1002.
Skogseid, J., Planke, S., Faleide, J. I., Pedersen, T., Eldholm, O., and Neverdal, F. (2000). NE Atlantic continental rifting and volcanic margin formation. Geol. Soc. Lond. Special Publ. 167, 295–326. doi: 10.1144/gsl.sp.2000.167.01.12
Sluijs, A., Bowen, G., Brinkhuis, H., Lourens, L., and Thomas, E. (2007). The Palaeocene-Eocene Thermal Maximum super greenhouse: biotic and geochemical signatures, age models and mechanisms of global change. Deep Time Pers. Clim. Change 2, 323–349. doi: 10.1144/tms002.15
Sluijs, A., Brinkhuis, H., Crouch, E. M., John, C. M., Handley, L., Munsterman, D., et al. (2008). Eustatic variations during the Paleocene – Eocene greenhouse world. Paleoceanography 23, A4216.
Smallwood, J. R., and Gill, C. E. (2002). The rise and fall of the Faroe–Shetland Basin: evidence from seismic mapping of the balder Formation. J. Geol. Soc. 159, 627–630. doi: 10.1144/0016-764902-064
Sømme, T. O., Jackson, C. A. L., and Vaksdal, M. (2013a). Source-to-sink analysis of ancient sedimentary systems using a subsurface case study from the Møre-Trøndelag area of southern Norway: Part 1 – depositional setting and fan evolution. Basin Res. 25, 489–511. doi: 10.1111/bre.12013
Sømme, T. O., Martinsen, O. J., and Lunt, I. (2013b). Linking offshore stratigraphy to onshore paleotopography: the Late Jurassic–Paleocene evolution of the south Norwegian margin. Geol. Soc. Am. Bull. 125, 1164–1186. doi: 10.1130/b30747.1
Soutter, E. L., Kane, I. A., and Huuse, M. (2018). Giant submarine landslide triggered by Paleocene mantle plume activity in the North Atlantic. Geology 46, 511–514. doi: 10.1130/g40308.1
Stassen, P., Dupuis, C., Steurbaut, E., Yans, J., and Speijer, R. P. (2012). Perturbation of a Tethyan coastal environment during the Paleocene–Eocene thermal maximum in Tunisia (Sidi Nasseur and Wadi Mezaz). Palaeogeogr. Palaeoclimatol. Palaeoecol. 317, 66–92. doi: 10.1016/j.palaeo.2011.12.011
Steel, R., and Ryseth, A. (1990). “The Triassic—Early Jurassic succession in the northern North Sea: megasequence stratigraphy and intra-Triassic tectonics,” in Geological Society, London, Special Publications, eds R. F. P. Hardman, and J. Brooks, (London: Geological Society London), 139–168. doi: 10.1144/gsl.sp.1990.055.01.07
Steel, R. J. (1993). “Triassic-Jurassic megasequence stratigraphy in the Northern North Sea: rift to post-rift evolution,” in Petroleum Geology of Northwest Europe: Proceedings of the 4th Conference: Geological Society London, eds J. R. Parker, and I. D. Bartholomew, (London: Geological Society London), 299–315. doi: 10.1144/0040299
Steinberger, B., Bredow, E., Lebedev, S., Schaeffer, A., and Torsvik, T. H. (2019). Widespread volcanism in the Greenland–North Atlantic region explained by the Iceland plume. Nat. Geosci. 12:61. doi: 10.1038/s41561-018-0251-0
Stoker, M. S., Holford, S. P., and Hillis, R. R. (2018). A rift-to-drift record of vertical crustal motions in the Faroe–Shetland Basin, NW European margin: establishing constraints on NE Atlantic evolution. J. Geol. Soc. 175, 263–274. doi: 10.1144/jgs2017-076
Stucky de Quay, G., Roberts, G., Watson, J., and Jackson, C. L. (2017). Incipient mantle plume evolution: constraints from ancient landscapes buried beneath the North Sea. Geochem. Geophys. Geosyst. 18, 973–993. doi: 10.1002/2016gc006769
Stuevold, L. M., and Eldholm, O. (1996). Cenozoic uplift of Fennoscandia inferred from a study of the mid-Norwegian margin. Glob. Planet. Change 12, 359–386. doi: 10.1016/0921-8181(95)00028-3
Svensen, H., Planke, S., Malthe-Sørenssen, A., Jamtveit, B., Myklebust, R., Eidem, T. R., et al. (2004). Release of methane from a volcanic basin as a mechanism for initial Eocene global warming. Nature 429:542. doi: 10.1038/nature02566
Syvitski, J. P. M., and Milliman, J. D. (2007). Geology, geography, and humans battle for dominance over the delivery of fluvial sediment to the coastal ocean. J. Geol. 115, 1–19. doi: 10.1086/509246
Tinker, J., de Wit, M., and Brown, R. (2008). Linking source and sink: evaluating the balance between onshore erosion and offshore sediment accumulation since Gondwana break-up, South Africa. Tectonophysics 455, 94–103. doi: 10.1016/j.tecto.2007.11.040
Toby, S. C., Duller, R. A., De Angelis, S., and Straub, K. M. (2019). A stratigraphic framework for the preservation and shredding of environmental signals. Geophys. Res. Lett. 46, 5837–5845.
Torske, T. (1975). Possible Mesozoic mantle plume activity beneath the continental margin of Norway. Norges Geologiske Undersøkelse 322, 73–90.
Torsvik, T. H., Amundsen, H. E., Trønnes, R. G., Doubrovine, P. V., Gaina, C., Kusznir, N. J., et al. (2015). Continental crust beneath southeast Iceland. Proc. Natl. Acad. Sci. U.S.A. 112, E1818–E1827. doi: 10.1073/pnas.1423099112
Underhill, J. R. (2001). Controls on the genesis and prospectivity of Paleogene palaeogeomorphic traps, East Shetland Platform, UK North Sea. Mar. Pet. Geol. 18, 259–281. doi: 10.1016/s0264-8172(00)00067-2
Watkins, S. E., Whittaker, A. C., Bell, R. E., McNeill, L. C., Gawthorpe, R. L., Brooke, S. A., et al. (2018). Are landscapes buffered to high-frequency climate change? A comparison of sediment supplyes and depositional volumes in the Corinth Rift, central Greece, over the past 130 ky. Bulletin 131, 372–388. doi: 10.1130/b31953.1
White, N., and Lovell, B. (1997). Measuring the pulse of a plume with the sedimentary record. Nature 387, 888–891. doi: 10.1038/43151
Whittaker, A. C., Attal, M., and Allenn, P. A. (2010). Characterising the origin, nature and fate of sediment exported from catchments perturbed by active tectonics. Basin Res. 22, 809–828. doi: 10.1111/j.1365-2117.2009.00447.x
Wien, S. T., and Kjennerud, T. (2005). “3D cretaceous to Cenozoic palaeobathymetry of the northern North Sea,” in Onshore-Offshore Relationships on the North Atlantic Margin: Norwegian Petroleum Society Special Publication, eds B. Wandås, T. G. E. Eide, A. F. Gradstein, and J. Nystuen, (Berlin: Elsevier), 241–253. doi: 10.1016/s0928-8937(05)80051-7
Willenbring, J. K., Gasparini, N. M., Crosby, B. T., and Brocard, G. (2013). What does a mean mean? The temporal evolution of detrital cosmogenic denudation rates in a transient landscape. Geology 41, 1215–1218. doi: 10.1130/g34746.1
Wu, H., Ji, Y., Wu, C., Duclaux, G., Gao, C., Li, L., et al. (2019). Stratigraphic response to spatiotemporally varying tectonic forcing in rifted continental basin: insight from a coupled tectonic-stratigraphic numerical model. Basin Res. 31, 311–336. doi: 10.1111/bre.12322
Zhang, L., Hay, W. W., Wang, C., and Gu, X. (2019). The evolution of latitudinal temperature gradients from the latest Cretaceous through the Present. Earth Sci. Rev. 189, 147–158. doi: 10.1016/j.earscirev.2019.01.025
Appendix
Here we describe the procedure and uncertainties associated with the inverse BQART modeling used to estimate changes in topography during the Maastrichtian-Eocene. A more detailed description can be found in Sømme et al. (2013b). Syvitski and Milliman (2007) showed that the sediment supply (Qs) from modern catchments best can be explained by the combination of an anthropogenic and lithology factor (B), water discharge (Q), catchment area (A), relief (R) and temperature (T), so that Qs = wBQ0.31A0.5RT. Here we assume that all parameters going into the equation can be estimated for the Maastrichtian, Paleocene and Eocene, so that the equation can be solved with respect to R to estimate topography for the respective time intervals. The uncertainty range associated with each parameter is used in a Monte Carlo simulation to make a statistical weighted prediction of the paleotopography.
Sediment supply (Qs) is based on seismically defined isochores. The volume is converted to mass using density data from all boreholes penetrating the relevant succession. The calculated mass per stage is considered to be absolute minimum supply, since parts of the Paleocene-Eocene wedge is truncated by the BTU. In order to accommodate for this, we add 25% to the mass as a maximum case (see Sømme et al., 2013b for discussion). Since the Paleocene-Eocene wedge prograded by forced regression, the amount of sediment initially trapped in topsets is considered to have been very low. Local preservation of what appears to be shelf breaks also indicate that the amount of erosion was limited.
Water discharge (Q) is difficult to constrain for the Paleocene. Paleo water discharge is therefore estimated using the inferred size of the catchment together with the overall climatic setting (Syvitski and Milliman, 2007). Here we use a revised version of the discharge prediction as suggested by Eide et al. (2018) for wet climates, so that Q = 0.0873A0.9164.
Maximum catchment area (A) is taken to extend around 100 km inland and is constrained by the inner boundary faults of the Hardangerfjord Shear Zone. This, together with the Møre-Trøndelag Fault Complex is believed to have been active in the Paleocene (Redfield et al., 2005; Fossen et al., 2017, Kziensyk pers comm), setting up a regional drainage divide (Figure 11). A minimum extent of around 50 km inland is assumed based on dating of active faults between the inner boundary fault and the basin margin (Kziensyk pers comm).
Paleocene-Eocene temperatures (T) in the North Sea are generally believed to have been warm and humid to tropical (Nielsen et al., 2015). The presence of temperate to tropical Spiniferites ramosus grp in 35/6-2S suggest paleoclimatic changes throughout the succession, with the warmest period in the Thanetian (Figure 6). Recent review by Zhang et al. (2019) suggest terrestrial Paleocene-Eocene temperatures in the range of 20–25°C, which is similar to 23 ± 5°C as suggested by Hall et al. (2015) based in deep weathering in Scotland. Here we use the latter range of 23 ± 5°C as input to the model.
Keywords: tectonic perturbation, climatic perturbation, deep-time, sediment routing, sediment supply, shelf-slope wedge, uplift, dynamic topography
Citation: Sømme TO, Skogseid J, Embry P and Løseth H (2019) Manifestation of Tectonic and Climatic Perturbations in Deep-Time Stratigraphy – An Example From the Paleocene Succession Offshore Western Norway. Front. Earth Sci. 7:303. doi: 10.3389/feart.2019.00303
Received: 16 July 2019; Accepted: 31 October 2019;
Published: 20 November 2019.
Edited by:
Brian W. Romans, Virginia Tech, United StatesReviewed by:
Pedro Val, Universidade Federal de Ouro Preto, BrazilDavid De Vleeschouwer, University of Bremen, Germany
Copyright © 2019 Sømme, Skogseid, Embry and Løseth. This is an open-access article distributed under the terms of the Creative Commons Attribution License (CC BY). The use, distribution or reproduction in other forums is permitted, provided the original author(s) and the copyright owner(s) are credited and that the original publication in this journal is cited, in accordance with accepted academic practice. No use, distribution or reproduction is permitted which does not comply with these terms.
*Correspondence: Tor Oftedal Sømme, tooso@equinor.com