Gravity and Magnetic Constraints on the Crustal Structure of the Ceará Plateau, Brazilian Equatorial Margin
 Denise Silva de Moura
 Eder Cassola Molina
 Yara Regina Marangoni
 Luigi Jovane
- 1Instituto Oceanográfico, Universidade de São Paulo, São Paulo, Brazil
- 2Instituto de Astronomia, Geofísica e Ciências Atmosféricas, Universidade de São Paulo, São Paulo, Brazil
The Brazilian Equatorial Margin (BEM) is a transform passive margin with long fracture zones and several seamounts, including the largest one, the Ceará Plateau (CP). This is a complex and poorly studied area, with few available geophysical data. Gravity and magnetic data from the Equant I Project, seismic published lines and other previous studies are used to make several models and analyses. We related the basement, internally comprised of two magmatic highs, to gravity and magnetic anomalies since there are a positive density and susceptibility contrast between sedimentary and basement rocks. Through gravity and magnetic forward modeling, we estimated the basement surface between 800 and 6000 m and the Mohorovičić discontinuity about 22–23 km below the CP. We also present and discuss the position of the continent-ocean boundary 40 km away from the continental shelf, placing the plateau at the oceanic crust domain, and the area of the transitional crust, with an extension of 40–50 km, formed during the rifting phase of the Atlantic Ocean opening.
Introduction
After the Atlantic rifting the Brazilian margins have been characterized by two different evolutions: (1) the East Brazilian Margin evolved into a passive margin, due to orthogonal crustal extension (Chang et al., 1992), (2) the Brazilian Equatorial Margin (BEM) formed during the strike-slip motion between Brazil and Africa, resulting in complex shear-dominated basins (Gorini, 1977; Zalan, 1984; Azevedo, 1986; Szatmari et al., 1987; Guiraud and Maurin, 1992; Mascle et al., 1998). The BEM, where the Ceará Plateau (CP) is located, formed during the opening of the Equatorial Atlantic Ocean. Rifting initiated in the early Barremian with average plate divergence rates of 2.5 cm/year (Pérez-Díaz and Eagles, 2014), leading to the accretion of an oceanic crust by the late Aptian (Basile et al., 2005). The transpressional tectonic regime gives rise to fracture zones which dominate the seafloor morphology in the BEM (Attoh et al., 2004).
The BEM morphology is also characterized by the numerous seamounts, compared to the East Brazilian Margin. There are several hypotheses for the origin of the BEM seamounts magmatic source: (1) deep hotspot source for magmatism related to the Fernando de Noronha hotspot (Morgan, 1983; Rivalenti et al., 2000; Mizusaki et al., 2002); (2) Edge-Driven Convection (King and Anderson, 1995, 1998); (3) the tectonic formation influenced by the fracture zone, due to a related weakness (Lowrie et al., 1986; Carracedo, 1994).
This study aims to better comprehend the structure of the CP by correlating the physical properties derived from gravity and magnetic data with a geological model. The emphasis is on the basement and the plateau location with regards to oceanic or transitional crust. The continental and the oceanic crust have distinct physical characteristics, such as density and magnetic susceptibility, which allows gravimetric and magnetic data associated with seismic profiles to act as a tool to distinguish between both types of crust. Here, we use gravity and magnetic data collected by the Equant I Project in 1987 (Ness et al., 1989) and seismic published interpreted profiles (Jovane et al., 2016) to correlate the physical properties with a geological model for the CP region.
The crustal structure model of the CP region can be used by diverse kind of studies, for example, as a proxy for sediment deposition processes, since it provides the volume and the distribution of the sediments, to prepare dredge and drilling campaigns in the area. The Continental-Ocean Boundary (COB) position can be used by tectonic surveys, as margin numerical modeling, reconstruction of continents, thermal and dynamic model processes (Karner and Driscoll, 1999; Brune et al., 2014). The COB locates by this work, in particular, can be used by future studies about the formation of the BEM and its seamounts. Previous studies have placed the COB in different positions, but none of them have debated particularly the region of the CP (Oliveira, 2008; Heine et al., 2013 – Figure 1), except for a geologic study that proposes the plateau above the oceanic crust (Costa and Kowsmann, 1979).
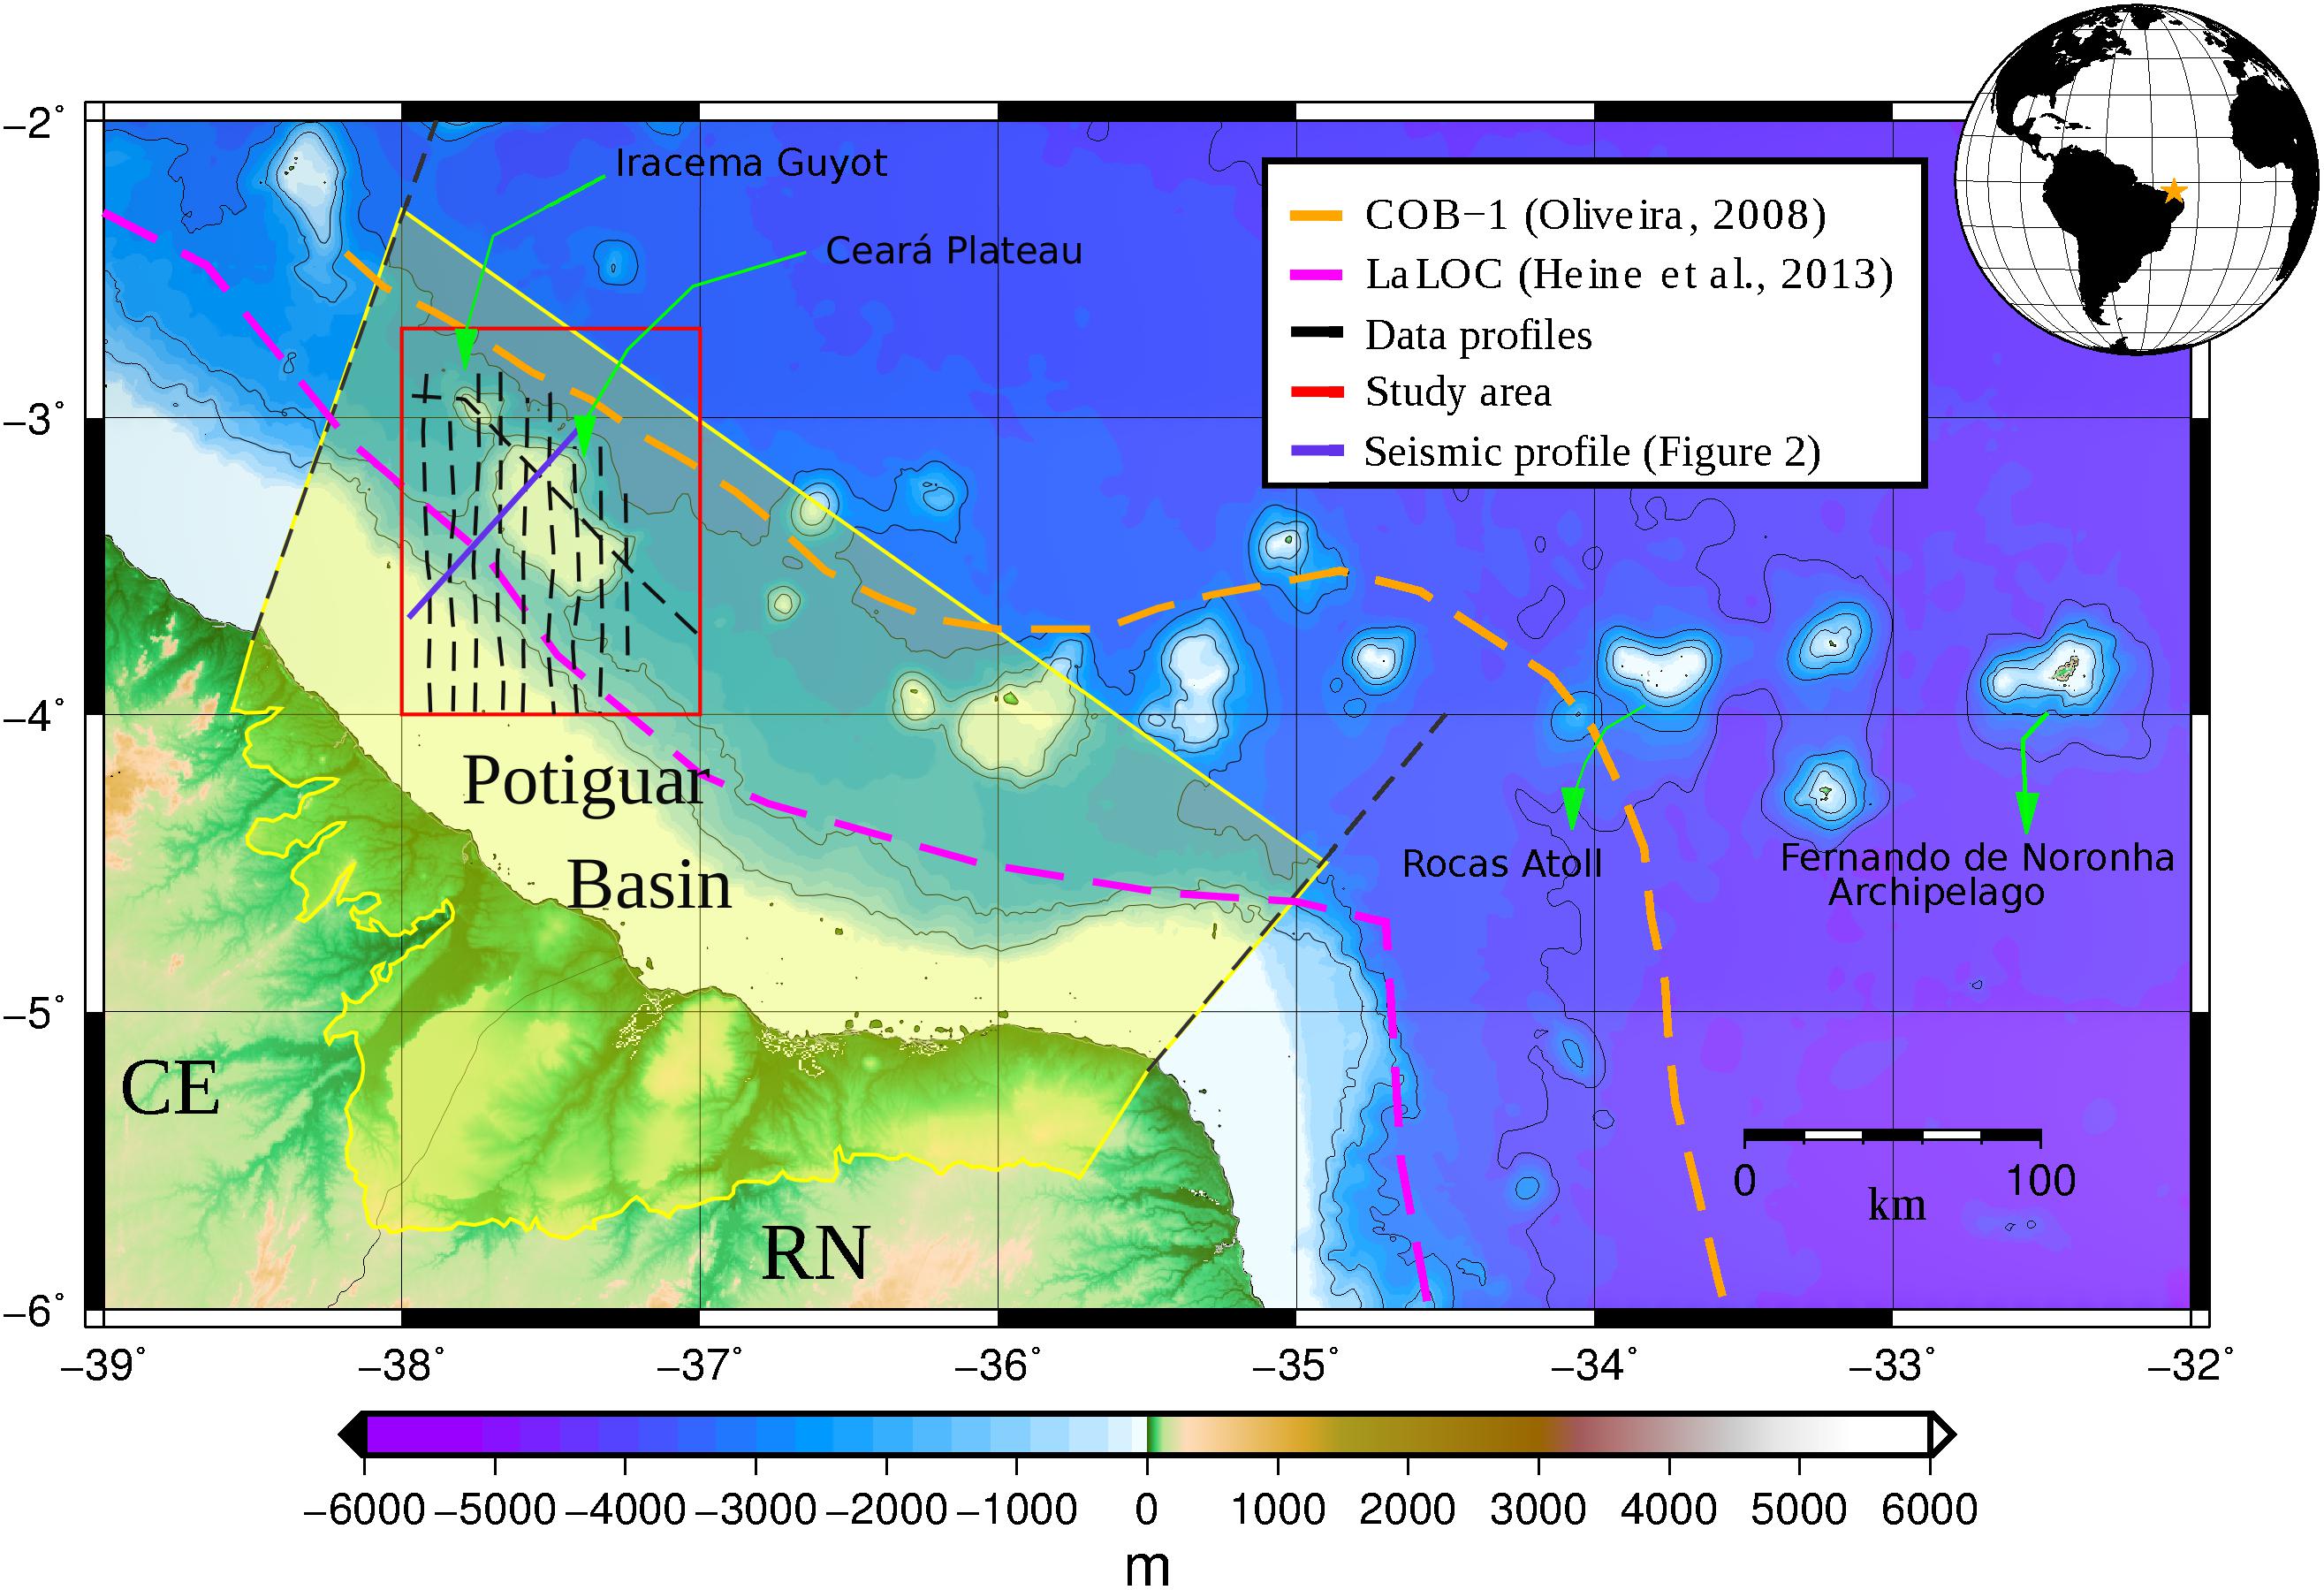
Figure 1. Brazilian Equatorial Margin topobathymetric map. The red rectangle indicates the study area. Bathymetric contours shown at 1000 m intervals. MA: Maranhão state, PI: Piauí state, CE: Ceará state, RN: Rio Grande do Norte state. Topobathymetric data by SRTM15PLUS (Shuttle Radar Topography Mission) 15 arc-sec resolution (Olson et al., 2014).
The CP represents an outstanding feature for paleoceanographic studies because (1) it maintains the same Equatorial position throughout the Cenozoic, (2) it is situated between North and South Atlantic where the superficial North Brazil Current moves toward north and the Deep Western Boundary Current moves toward south, (3) it is in a proximal position linking terrestrial and oceanic systems, and (4) its sediment are interested by processes that are related to changes of the Atlantic Meridional Overturning Circulation, Intertropical Convergence Zone and South American monsoon system (Wang et al., 2004; Rodrigues et al., 2007; Zhang et al., 2011, 2015). Those characteristics make of the CP a potential site to perform global studies of sea-level, CO2 and carbonate compensations depth (CCD) variations throughout the Cenozoic.
Geological Setting
The CP has an area of about 850 km2, a relative height of 2 km above the ocean floor and an irregular flat top relief at a water depth of around 300 m (Jovane et al., 2016). The flat topography seems to be a consequence of an ancient hemipelagic sediment deposit. The plateau is located 100 km offshore from Fortaleza city, Ceará State, in the Potiguar Basin (Figure 1), 40 km from the continental slope. The Iracema Guyot, located northwest from the plateau has the same height as the CP and lies 400 m below the sea surface.
Dredge samples from the CP, recovered by the REMAC project in 1972, suggest the predominance of rodolites and limestone. Dredges in three different heights characterize phosphatic limestone: between 305–270 m, 1371–391 m and 800–583 m (Guazelli et al., 1977; Guazelli and Costa, 1978; Costa and Kowsmann, 1979). The dredges returned no terrigenous or volcanic rocks along with the limestones (Costa and Kowsmann, 1979). Costa and Kowsmann (1979) argued about the nature of the basement as oceanic, volcanic and related to the other seamounts of the Fernando de Noronha Fracture Zone (Gorini and Bryan, 1976), such as the Rocas Atoll and the Fernando de Noronha Island. They also propose a Cretaceous volcanic basement based on sediment samples (Guazelli et al., 1978), geophysical analysis (Fainstein and Milliman, 1979) and sedimentary depositional dynamics (Gorini, 1977). Dating of the Fernando de Noronha-Mecejana phonolite places peak volcanic activity between the Oligocene and Pleistocene (Guazelli and Costa, 1978). Jovane et al. (2016) support a Cretaceous volcanic basement and describe six seismic horizons, with age based on the description of the well CES-112 (Figure 2).
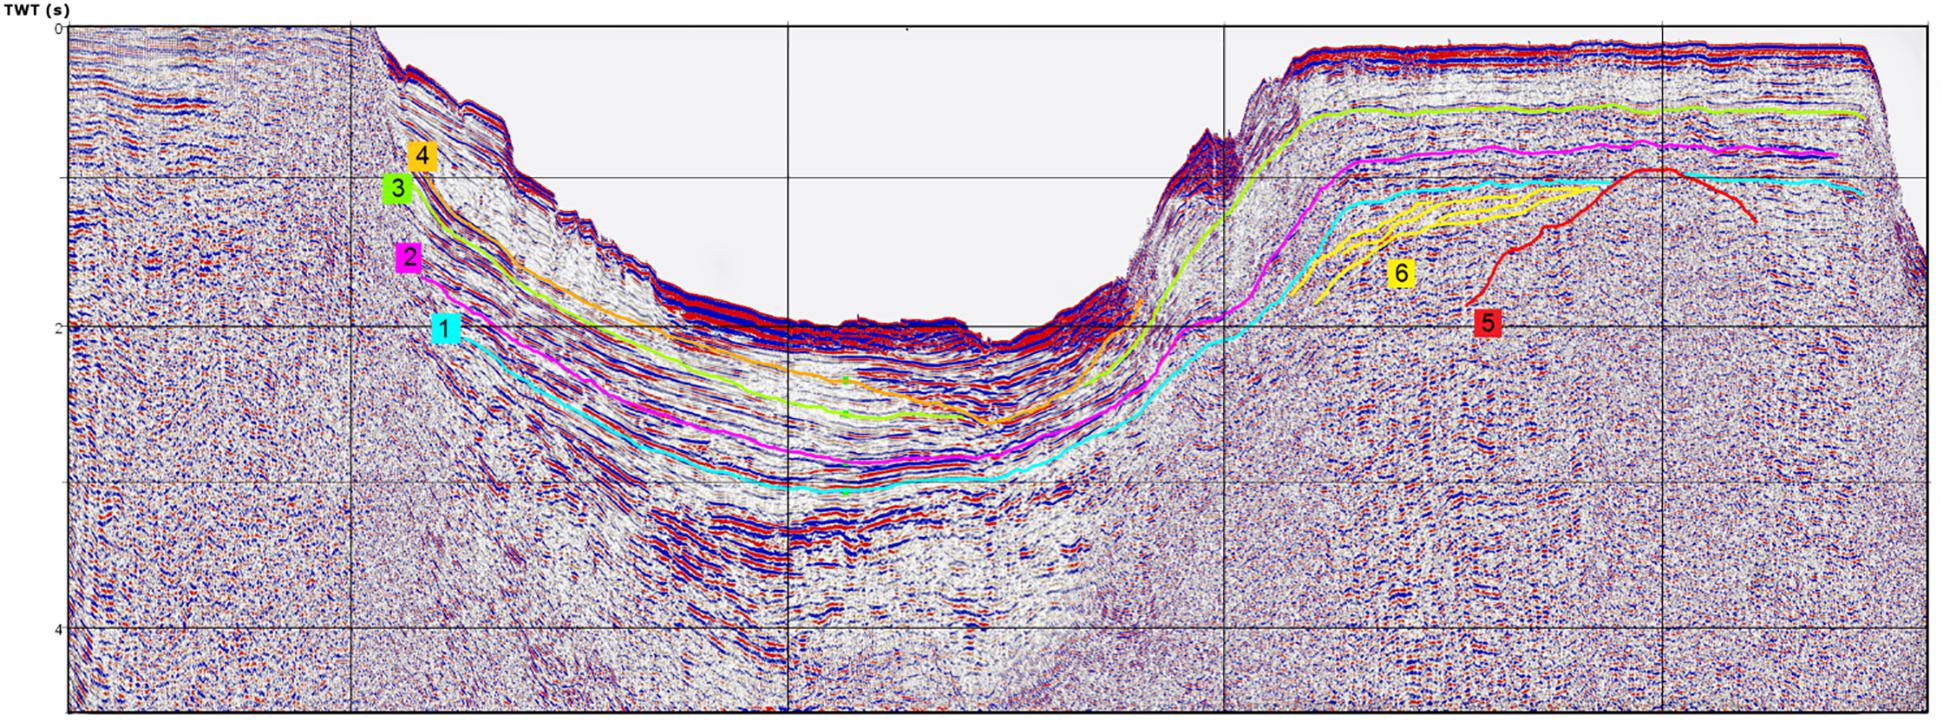
Figure 2. SW-NE interpreted seismic profile from ANP survey, line POT44 (Jovane et al., 2016) (location on Figures 1, 3). Depth in seconds, TWT (Two-Way travel Time). Horizon 5 is the interpreted volcanic basement of the CP, the other horizons are sedimentary deposits related to geologic ages (from Jovane et al., 2016).
Materials and Methods
Data
We use bathymetric, gravity and magnetic data (Figures 3, 8A) collected by the Equant I Project aboard the Prof. W. Besnard vessel in 1987, by the Oceanographic Institute of the University of São Paulo. The survey tracks (Ness et al., 1989) are NS profiles, 9 km apart and the data interval of about 800 m. The onboard gravity data was collected by a LaCoste and Romberg stabilized platform shipboard gravimeter, corrected for latitude, drifting of the equipment and the Eötvös effect. The geomagnetic total field data were obtained using the Geometrics G-801/03 and G-811/13 marine proton-precession magnetometers. Diurnal magnetic corrections were applied using temporary, shore-based magnetic base-station data and Brazilian observatory data (Ness et al., 1989). The IGRF-85 reference field values were removed from the observed magnetic data. The magnetic profiles data are micro leveled and filtered to remove the noise from the anomalies. We also use published interpreted 2D seismic reflection profiles acquired by the Plano de Levantamento da Plataforma Continental Brasileira (LEPLAC) III in 1989 by the Brazilian Navy Diretoria de Hidrografia e Navegação (DHN) and other lines have been provided by the Agencia Nacional do Petróleo, Gás Natural e Biocombustíveis (ANP) after being collected by Petrobras (Figure 2) (Jovane et al., 2016)1.
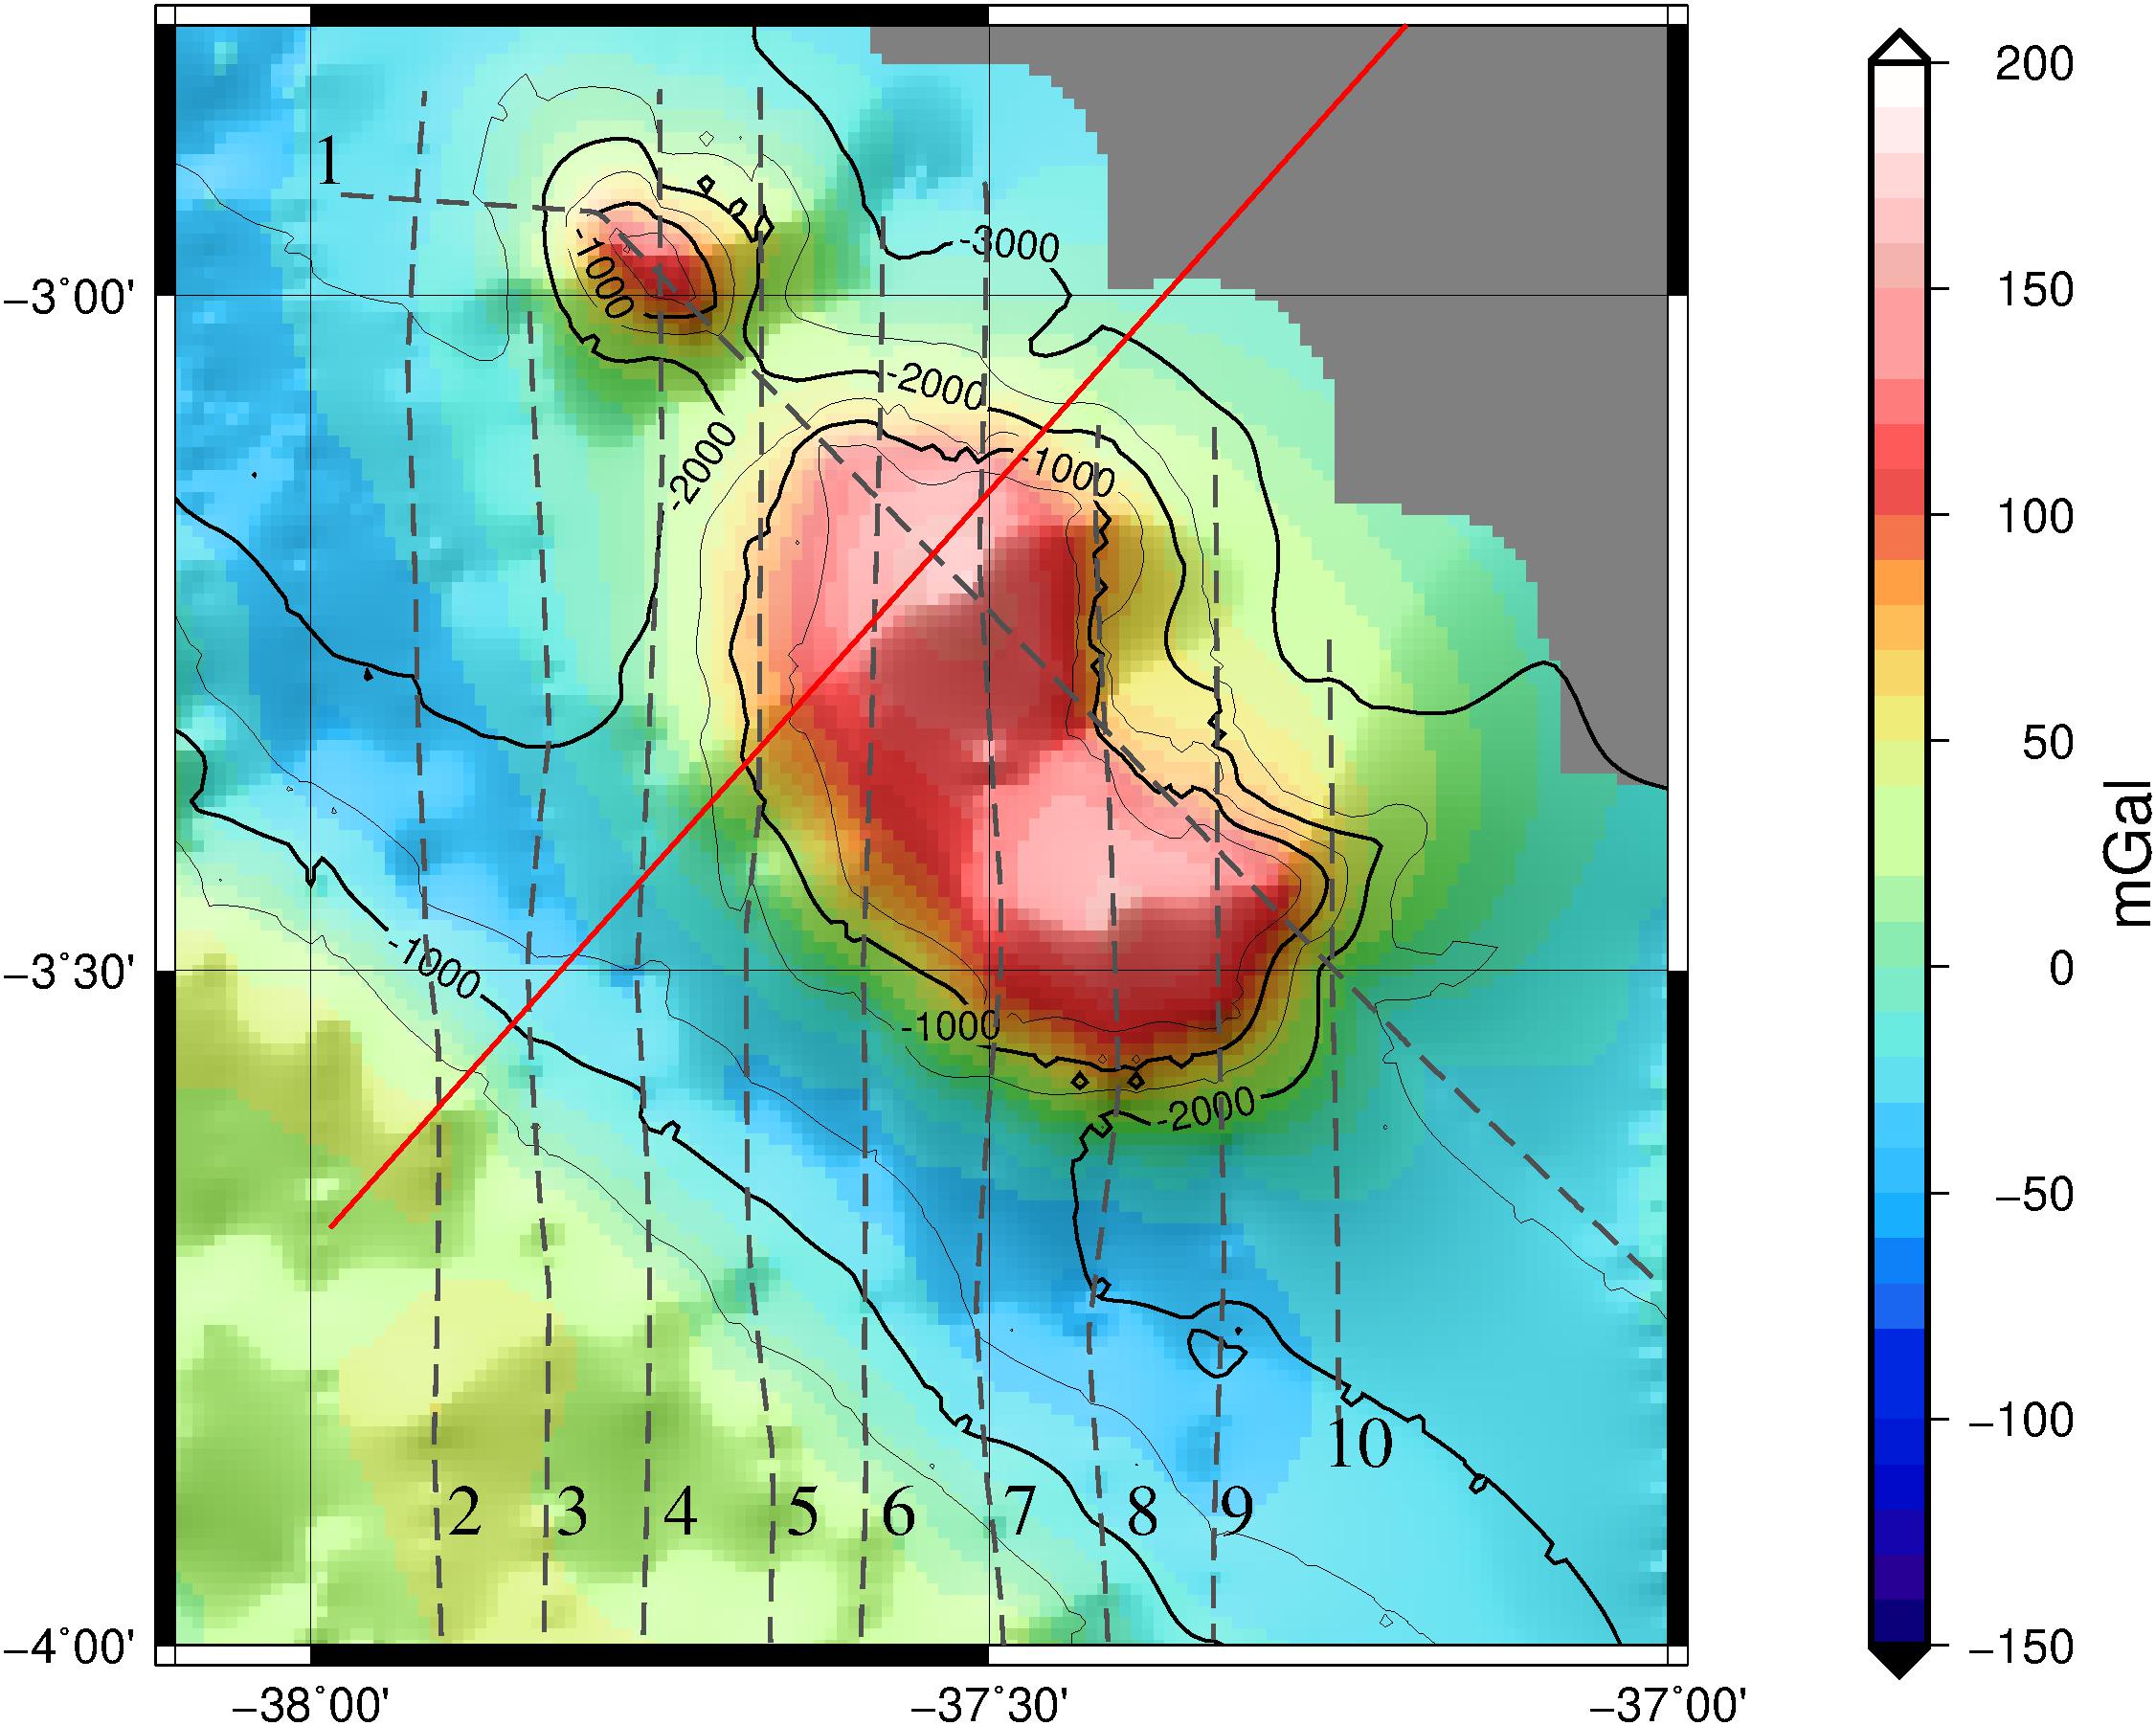
Figure 3. Free-air gravity anomaly map and the location of the data in the study area. Dashed profiles #1 to #10 shows the position of bathymetric, gravity and magnetic marine survey, the red line shows the position of the seismic profile of Figure 2. Bathymetric contours shown at 500 m intervals.
The Edge Effect
We propose a COB location for the study area by using gravimetric and magnetic anomalies originated by the lateral heterogeneity between the ocean and continental crusts, which we name edge effect anomalies. A similar approach was first applied to free air, isostatic gravity anomalies and magnetic residual anomalies by Rabinowitz and LaBrecque (1979). In this study, we use the free-air and Bouguer residual gravity anomalies and the magnetic residual anomaly, as presented by Blaich et al. (2008, 2011).
2D Forward Gravity Modeling
The 2D forward models along the Equant I profiles are performed with the GRAVMAG software (Pedley et al., 1993 and updated by Jones, 2012). The software calculates the gravity effect for structures of infinite strike length and polygonal cross-section using the solution of Talwani et al. (1959). The parameters calculated here or from previous studies are described in the Supplementary Material.
3D Forward Magnetic Modeling
The CP area is near to the Magnetic Equator, which hinders the magnetic analyses, since the intensity of the magnetic field is low in this region. During the survey in 1987, it was about 26770 nT. We haven’t applied the usual forward modeling approach because the lack of information about the composition of the CP, since the susceptibility values vary orders of magnitude, its estimation is not possible as the density. As an alternative to calculate the forward magnetic modeling, we used a magnetized layer modeling proposed by Maia et al. (2005), based on some sub-routines from Blakely (1996). Then, we compare the result model with the observed data. The layer has a constant thickness of 3 km and its top part is the basement surface, estimated by the gravity modeling in this work. The parameters are described in the Supplementary Material.
Results
The COB Positioning
We assume that the observed edge effect anomaly, signaled in the blue strips of Figure 4, mark the position of the COB. They correlate a low in the free air anomaly with a high in the Bouguer anomaly and a magnetic anomaly that separates a smooth signal over the continental shelf in the south, from a noisier region in the north. The strips have 9 km extent, related to the wavelength of the anomalies and also the method uncertainty.
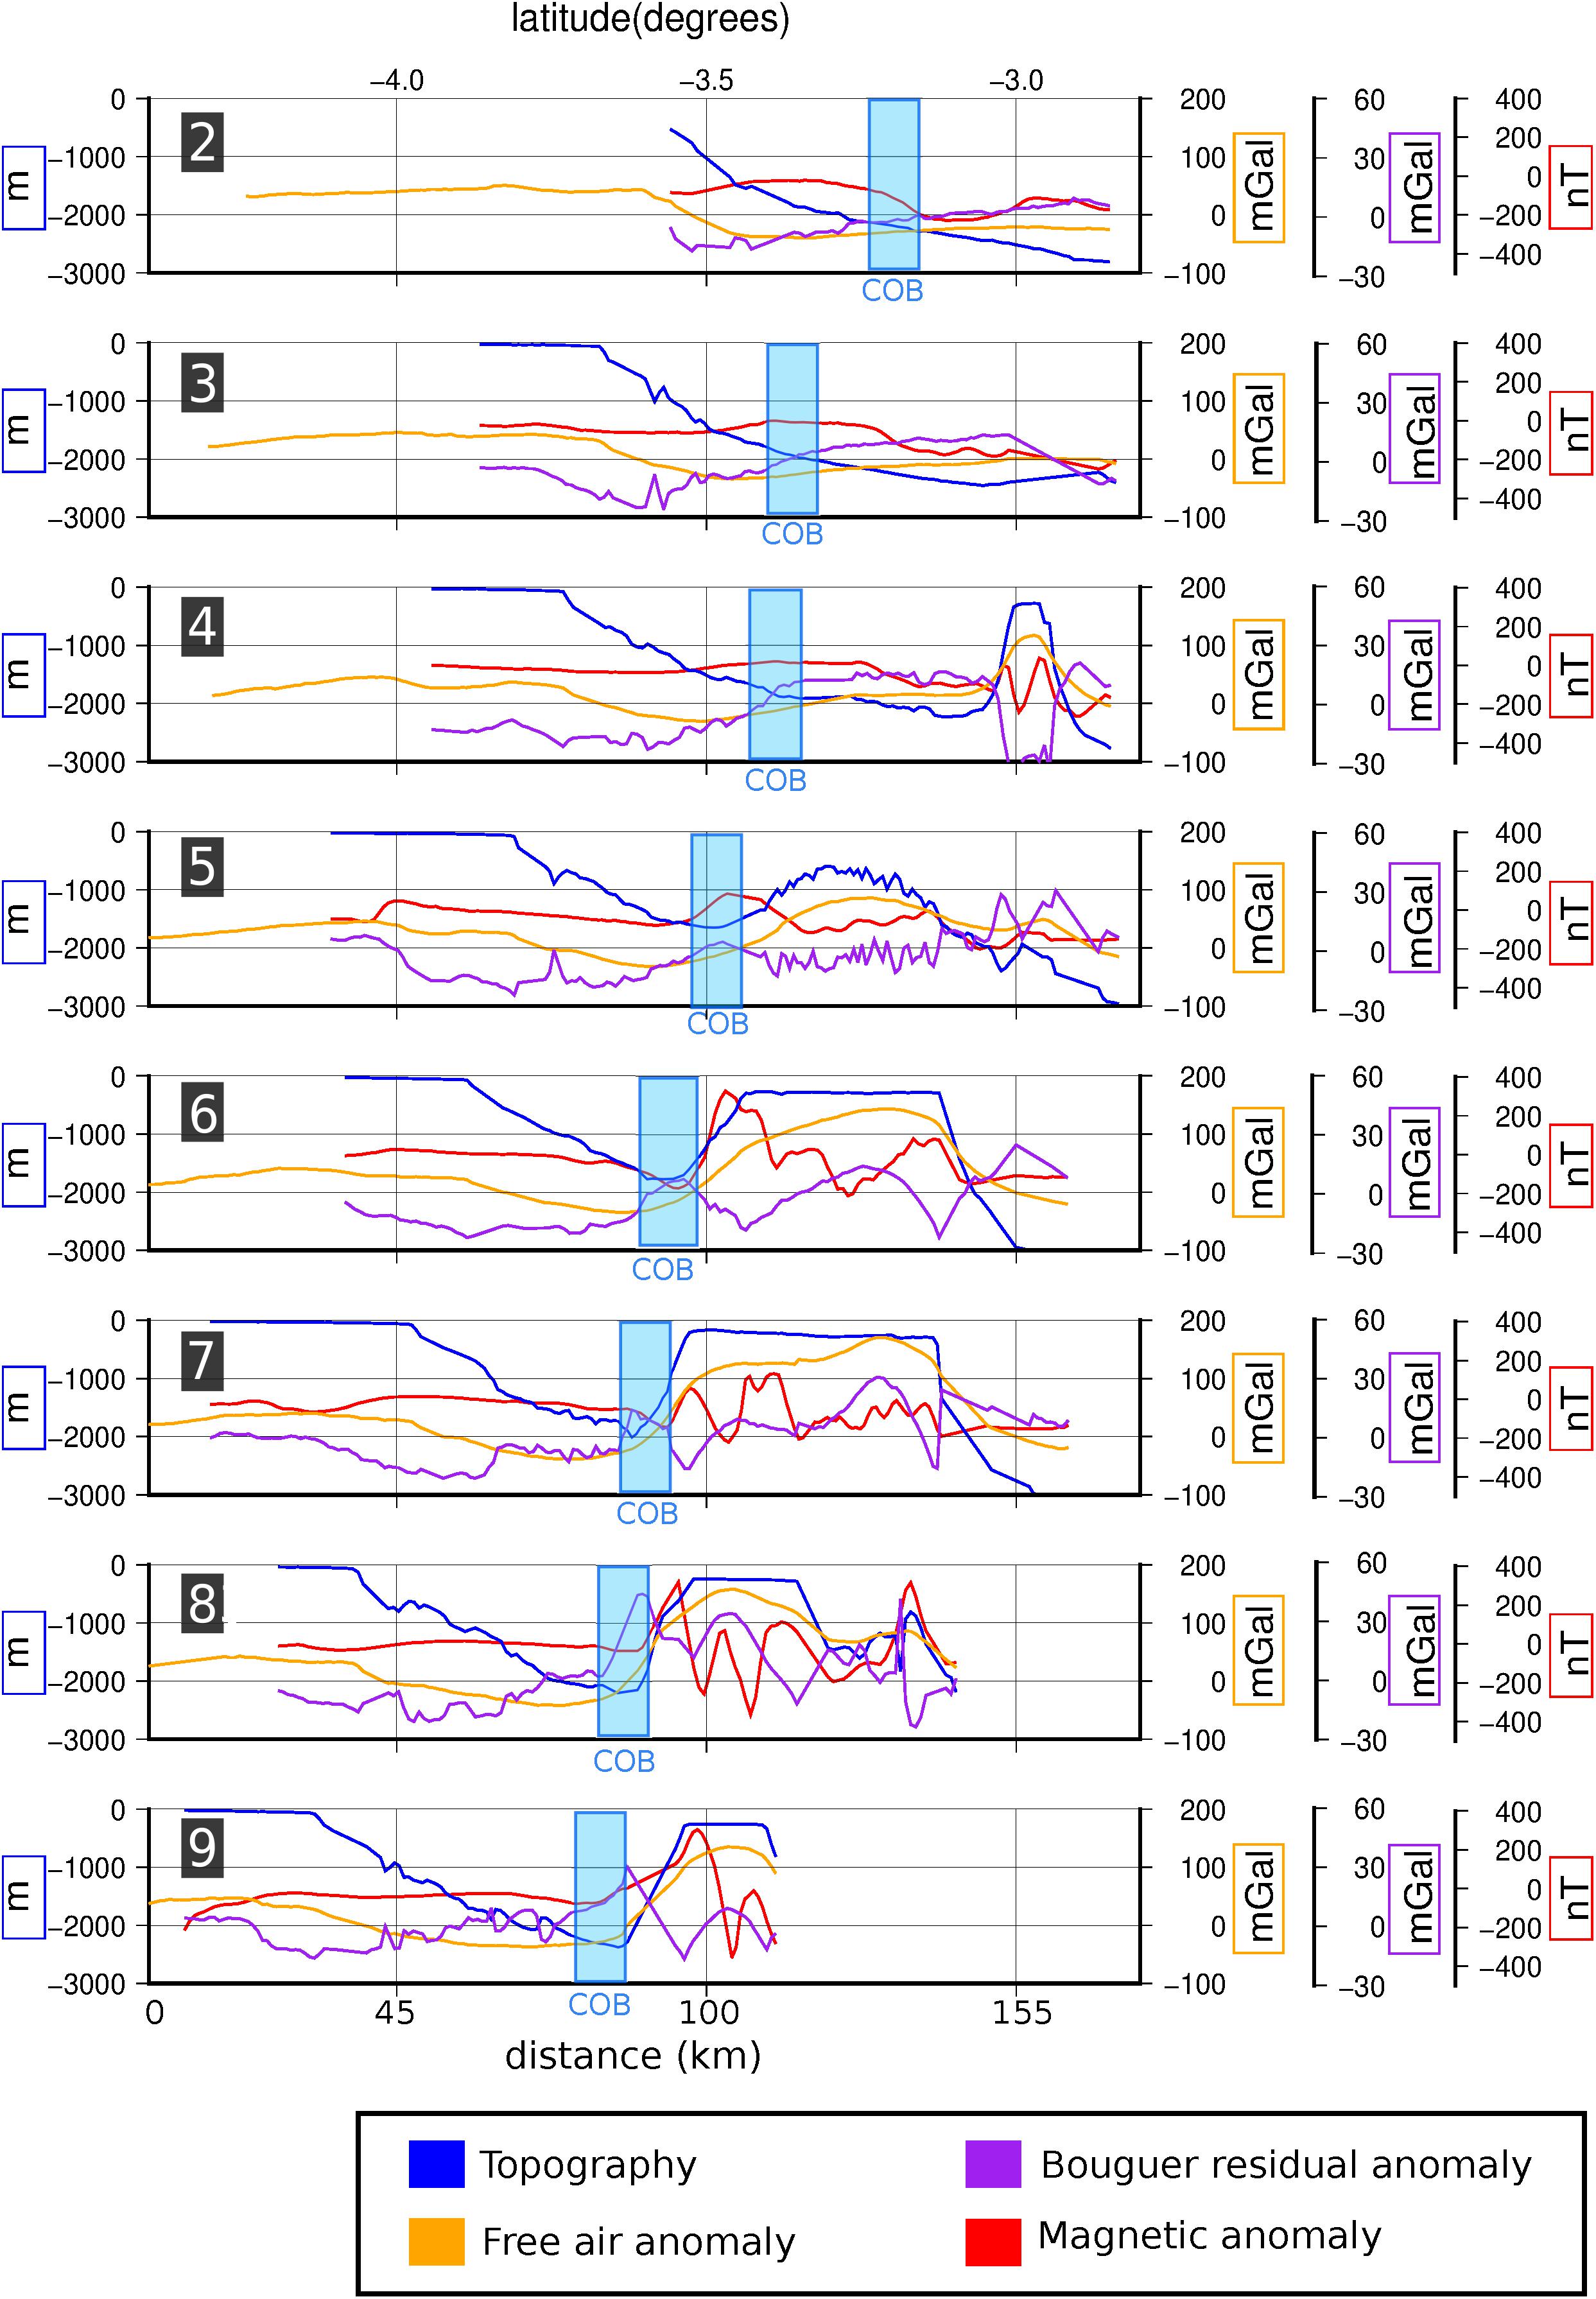
Figure 4. Profiles 2, 3, 4, 5, 6, 7, 8, and 9 from Equant I with the COB position (blue rectangles).
Further north, the profiles cross the CP, terminating 10–20 km away from the edge of the plateau, which prevented us from searching for similar anomaly patterns away from the CP to propose another location for the COB.
Gravity Modeling
The geologic geometry used in the model (Figure 5 and Supplementary Figures S1–S6) is based on published gravity model profiles from the African Equatorial Margin (Jilinski et al., 2013). The position of the COB is based on the edge effect anomaly, as presented in this paper (Figure 4). The assumption that there is a transitional continental crust with a higher density, compared to a normal continental one, between the oceanic and the continental crust is widely accepted in rift margins, such as the Brazilian-African margin (Matos, 1999; Moulin, 2003; Nóbrega, 2011; Magalhães, 2015). The high density is explained by the intrusive dikes that are formed during the late-stage rifting (Ligi et al., 2011; Keir et al., 2013). The presence of a shallow modified mantle between the oceanic crust and transitional crust (orange polygon) is also an outcome of the Atlantic Ocean opening, related to the divergent phase of the margin formation (Péron-Pinvidic et al., 2017). The seven profiles modeled with the free-air gravity anomaly of the CP region are interpolated to create the surfaces of the basement (Figure 6) and of the Mohorovičić discontinuity (Figure 7).
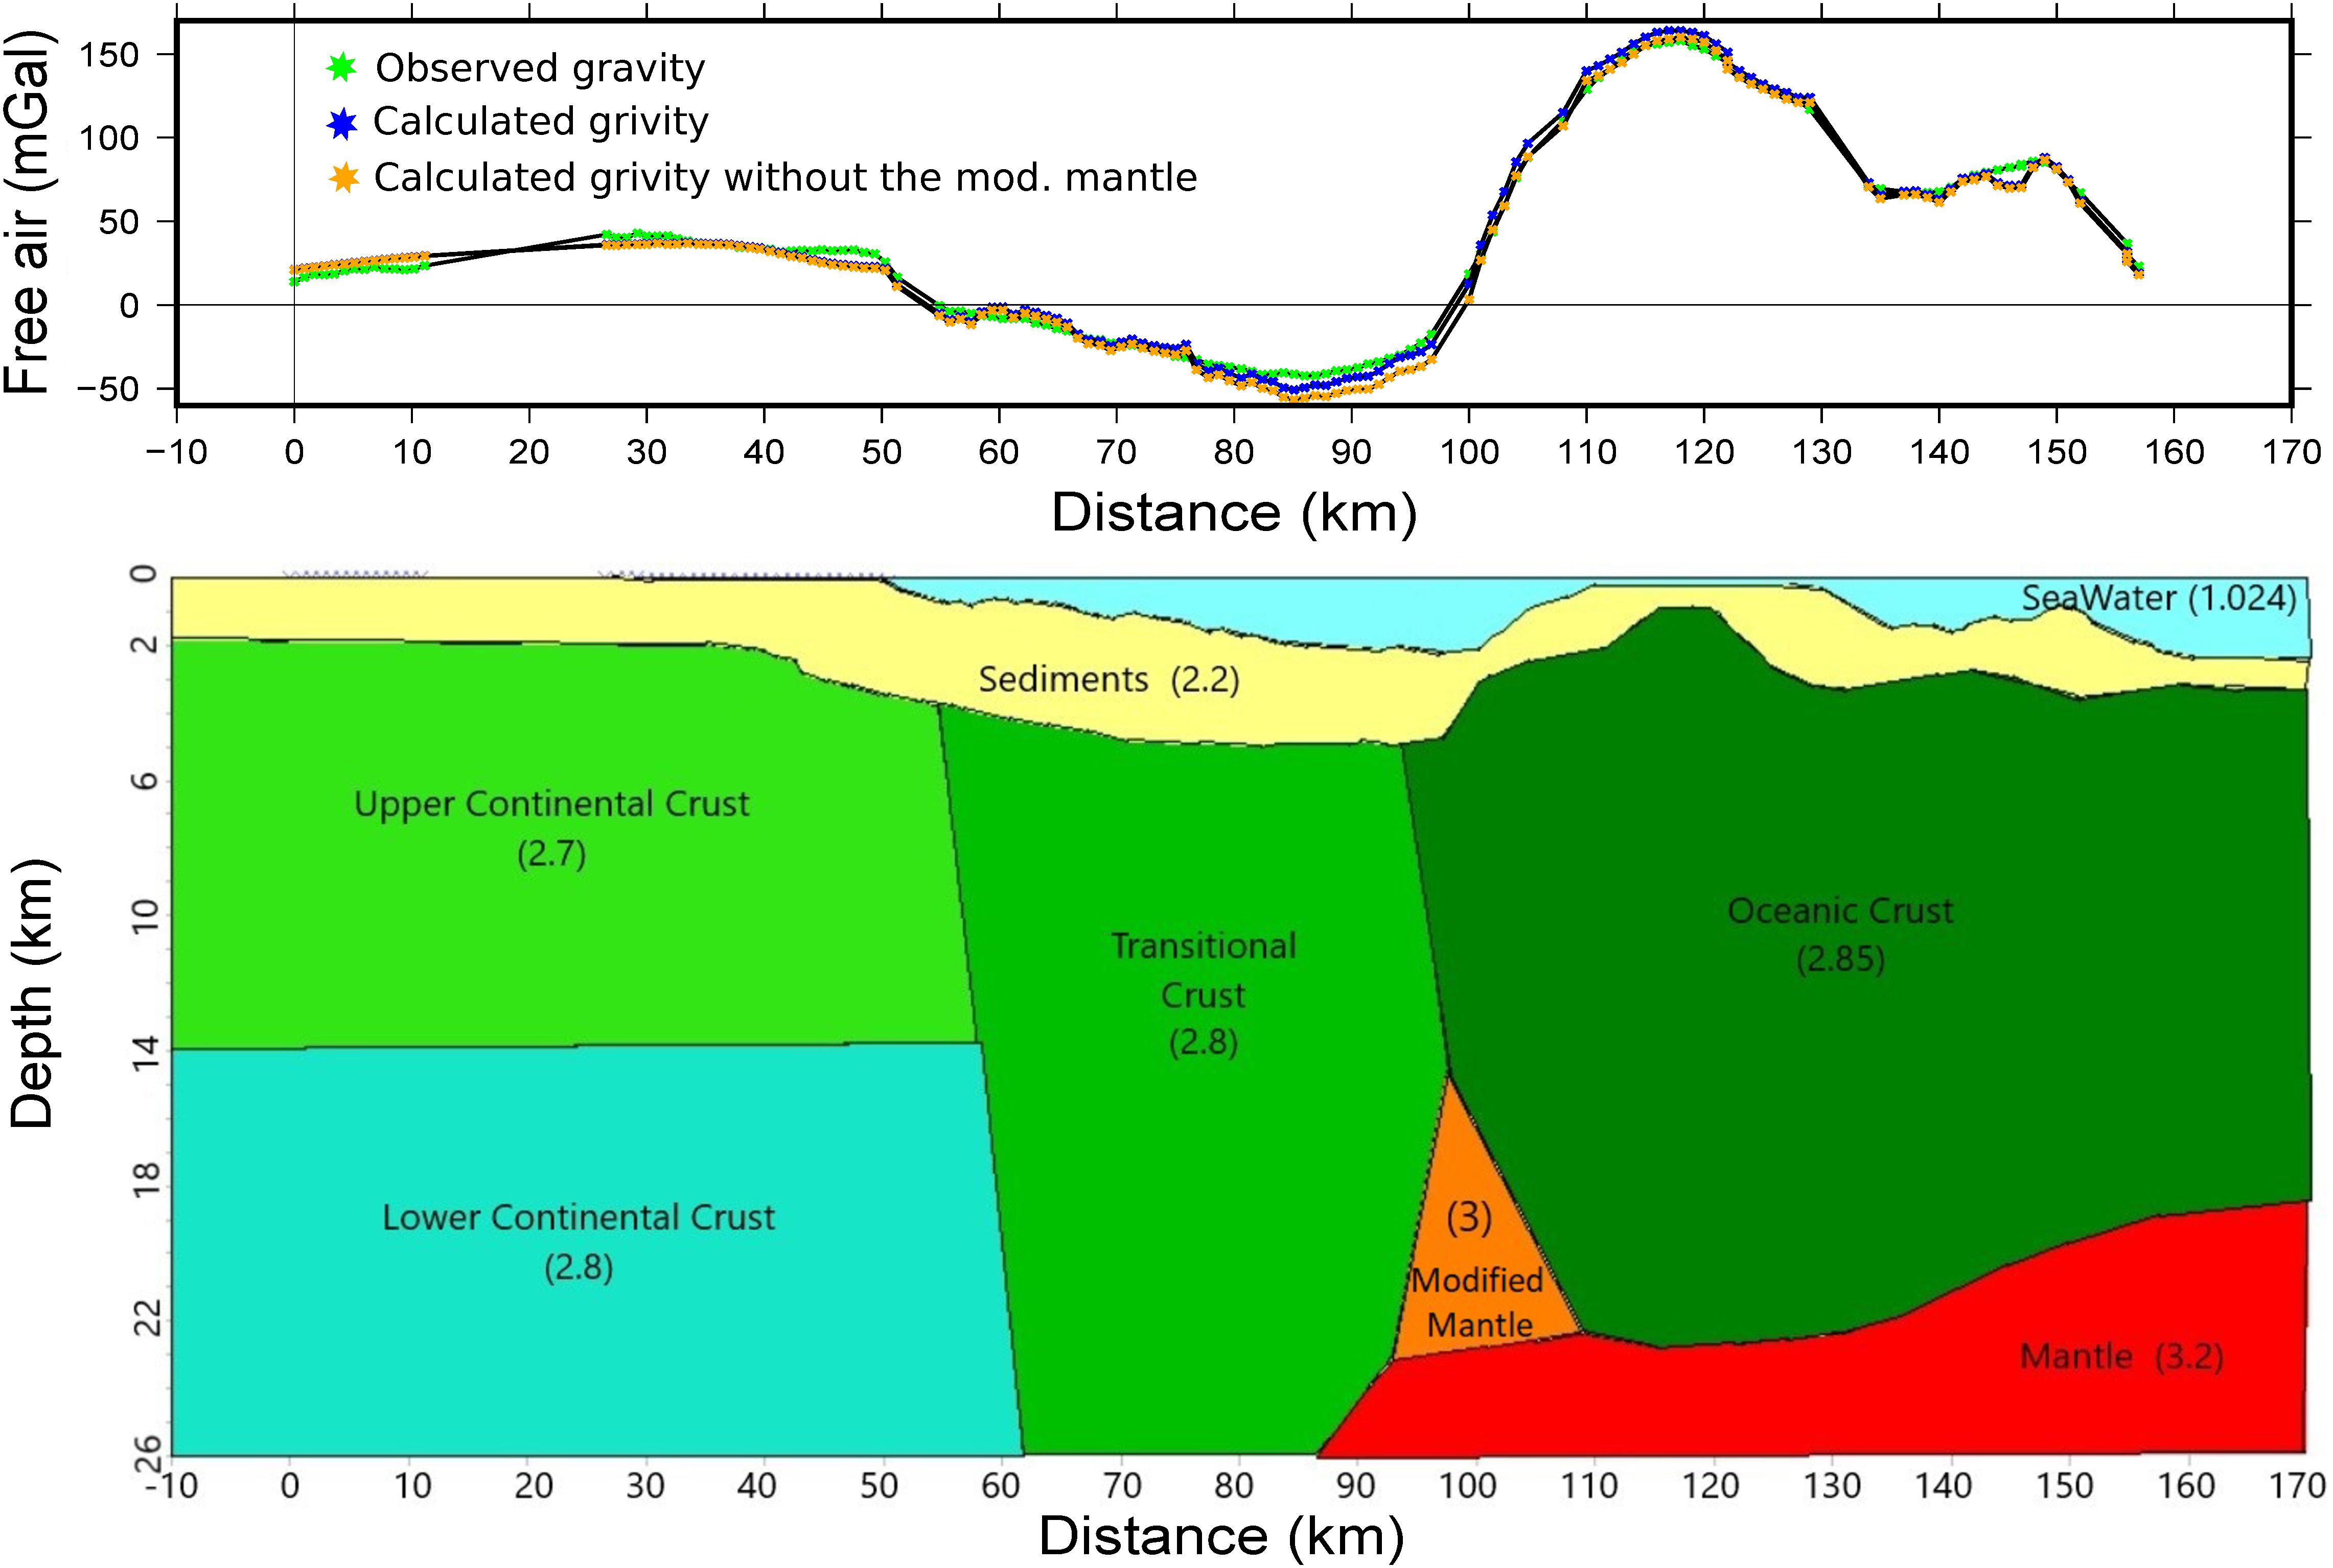
Figure 5. Gravimetric model of the profile 8 (S-N) with 2.5× vertical exaggeration (location is shown in Figure 3). Densities in g/cm3.
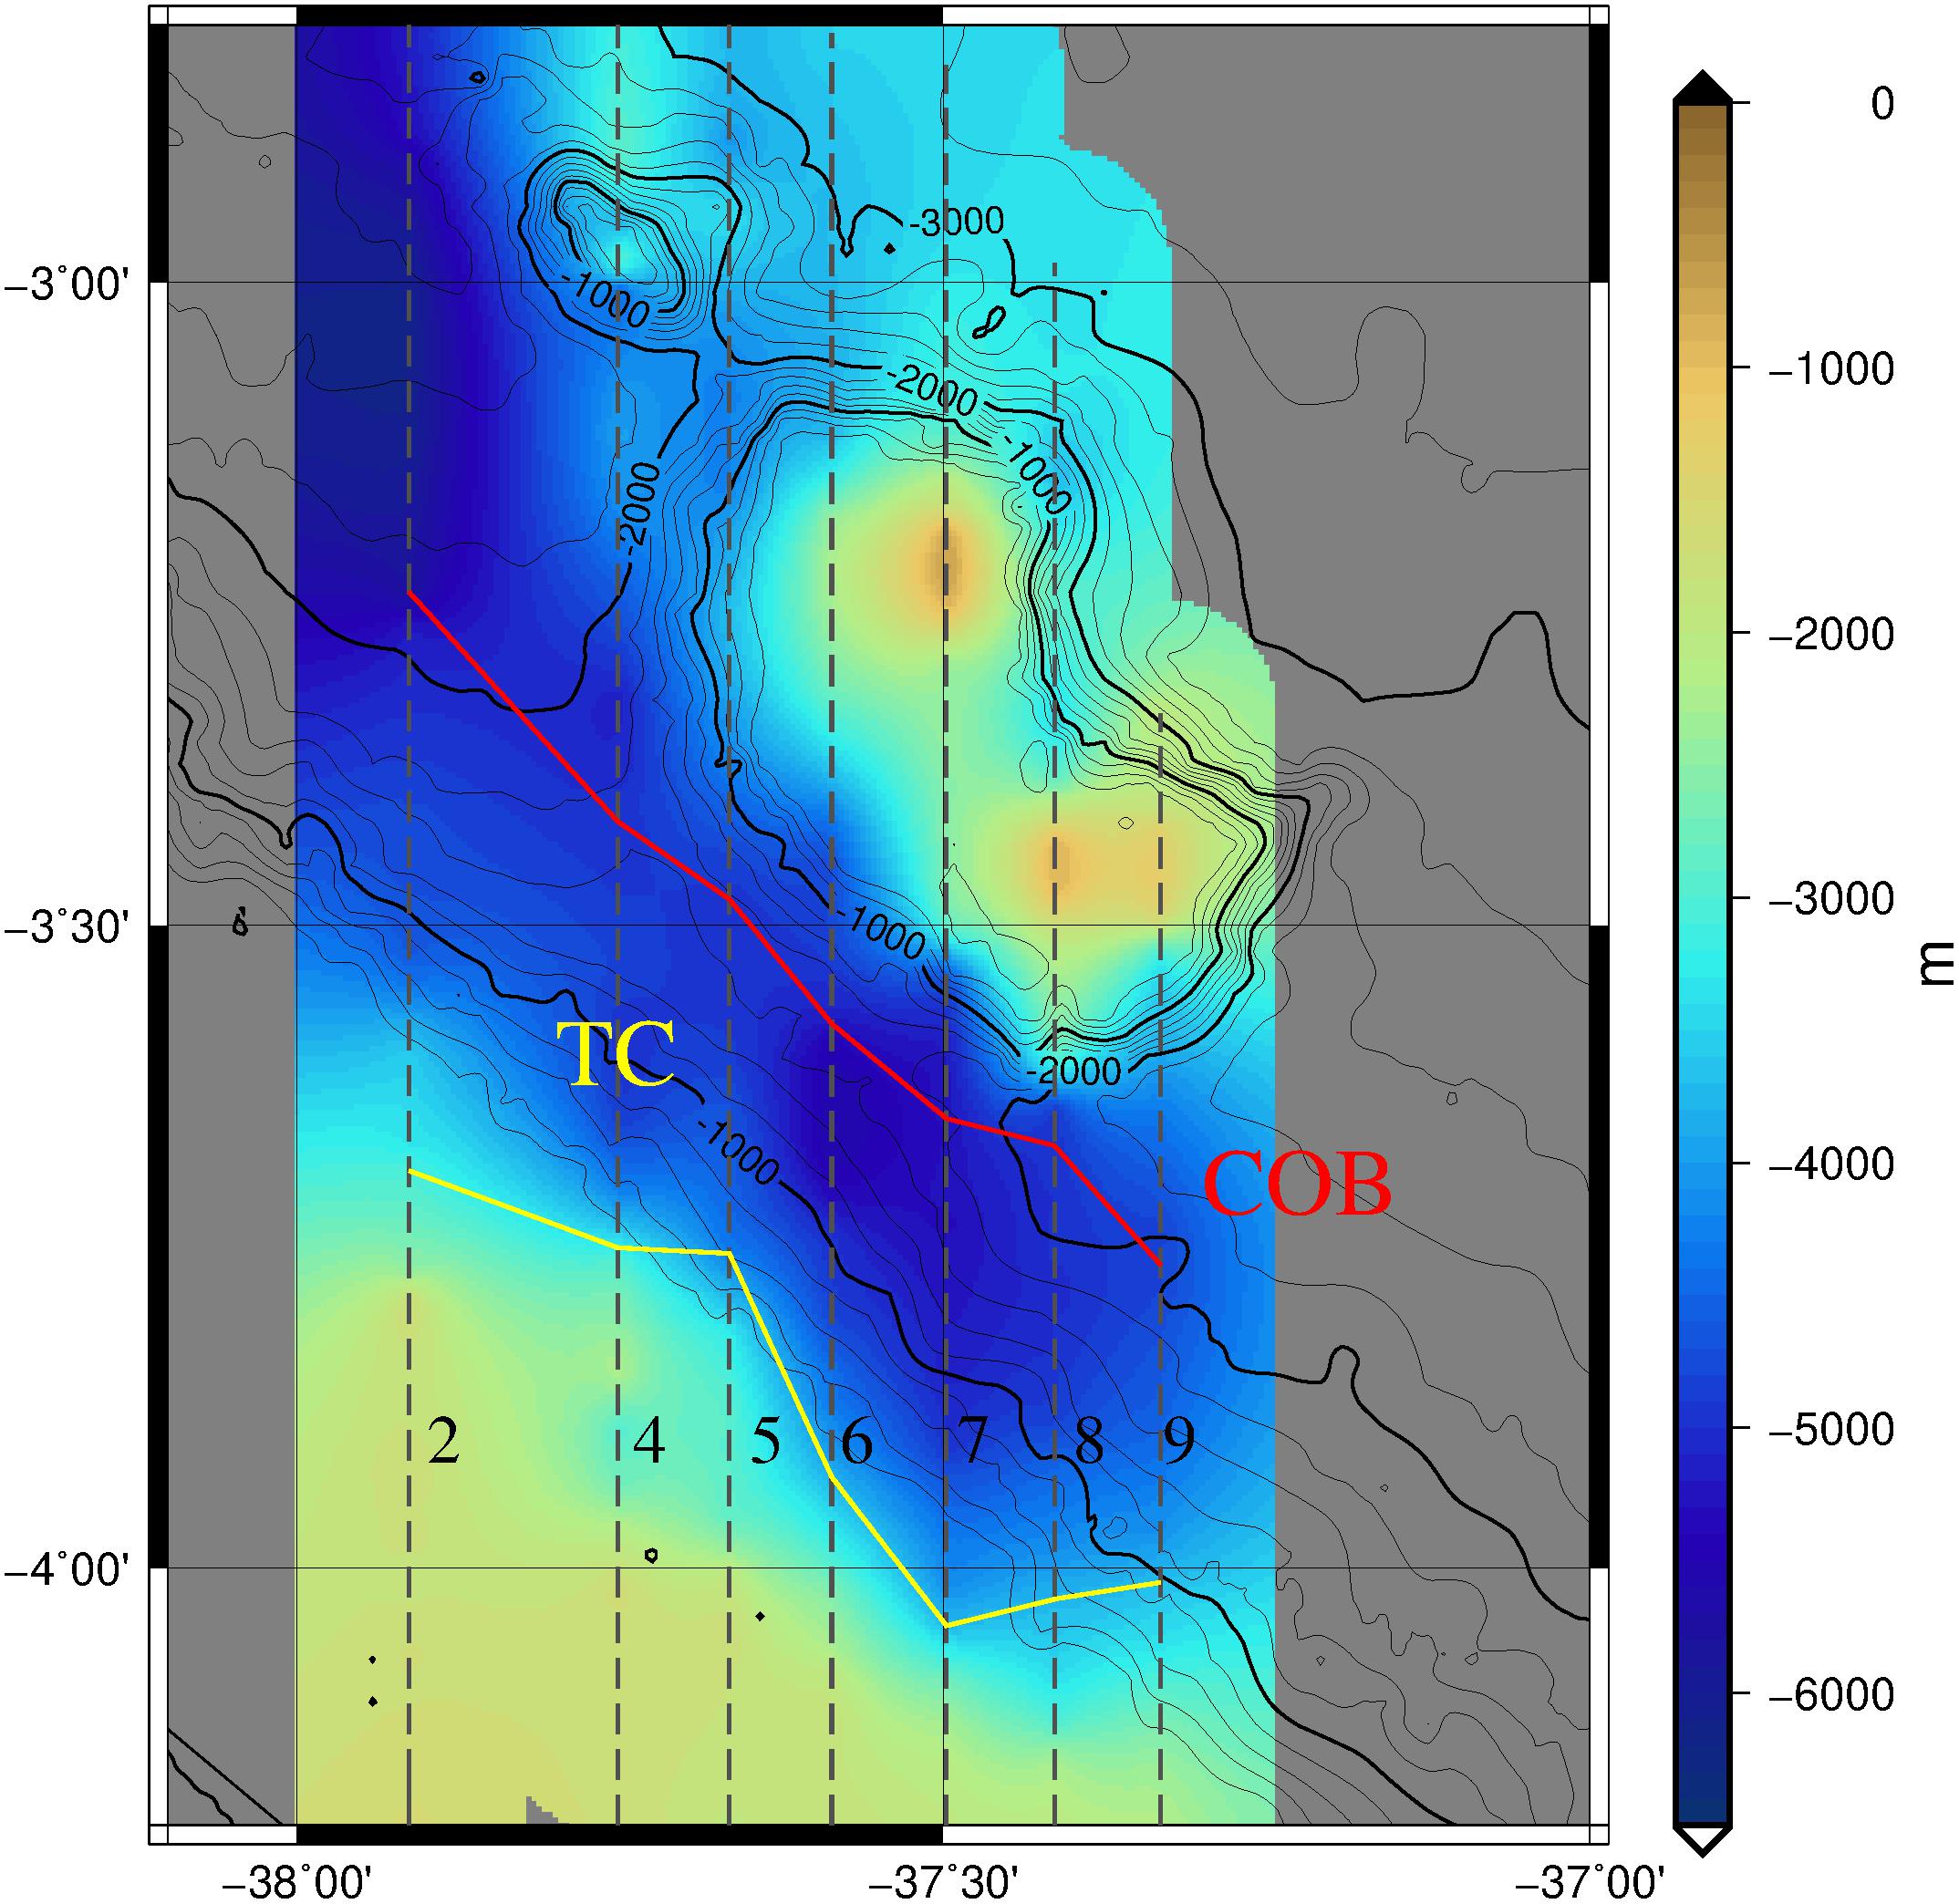
Figure 6. Basement of the Ceará Plateau area from the gravity 2D model. COB: Continental Ocean Boundary, TC: Transitional Crust.
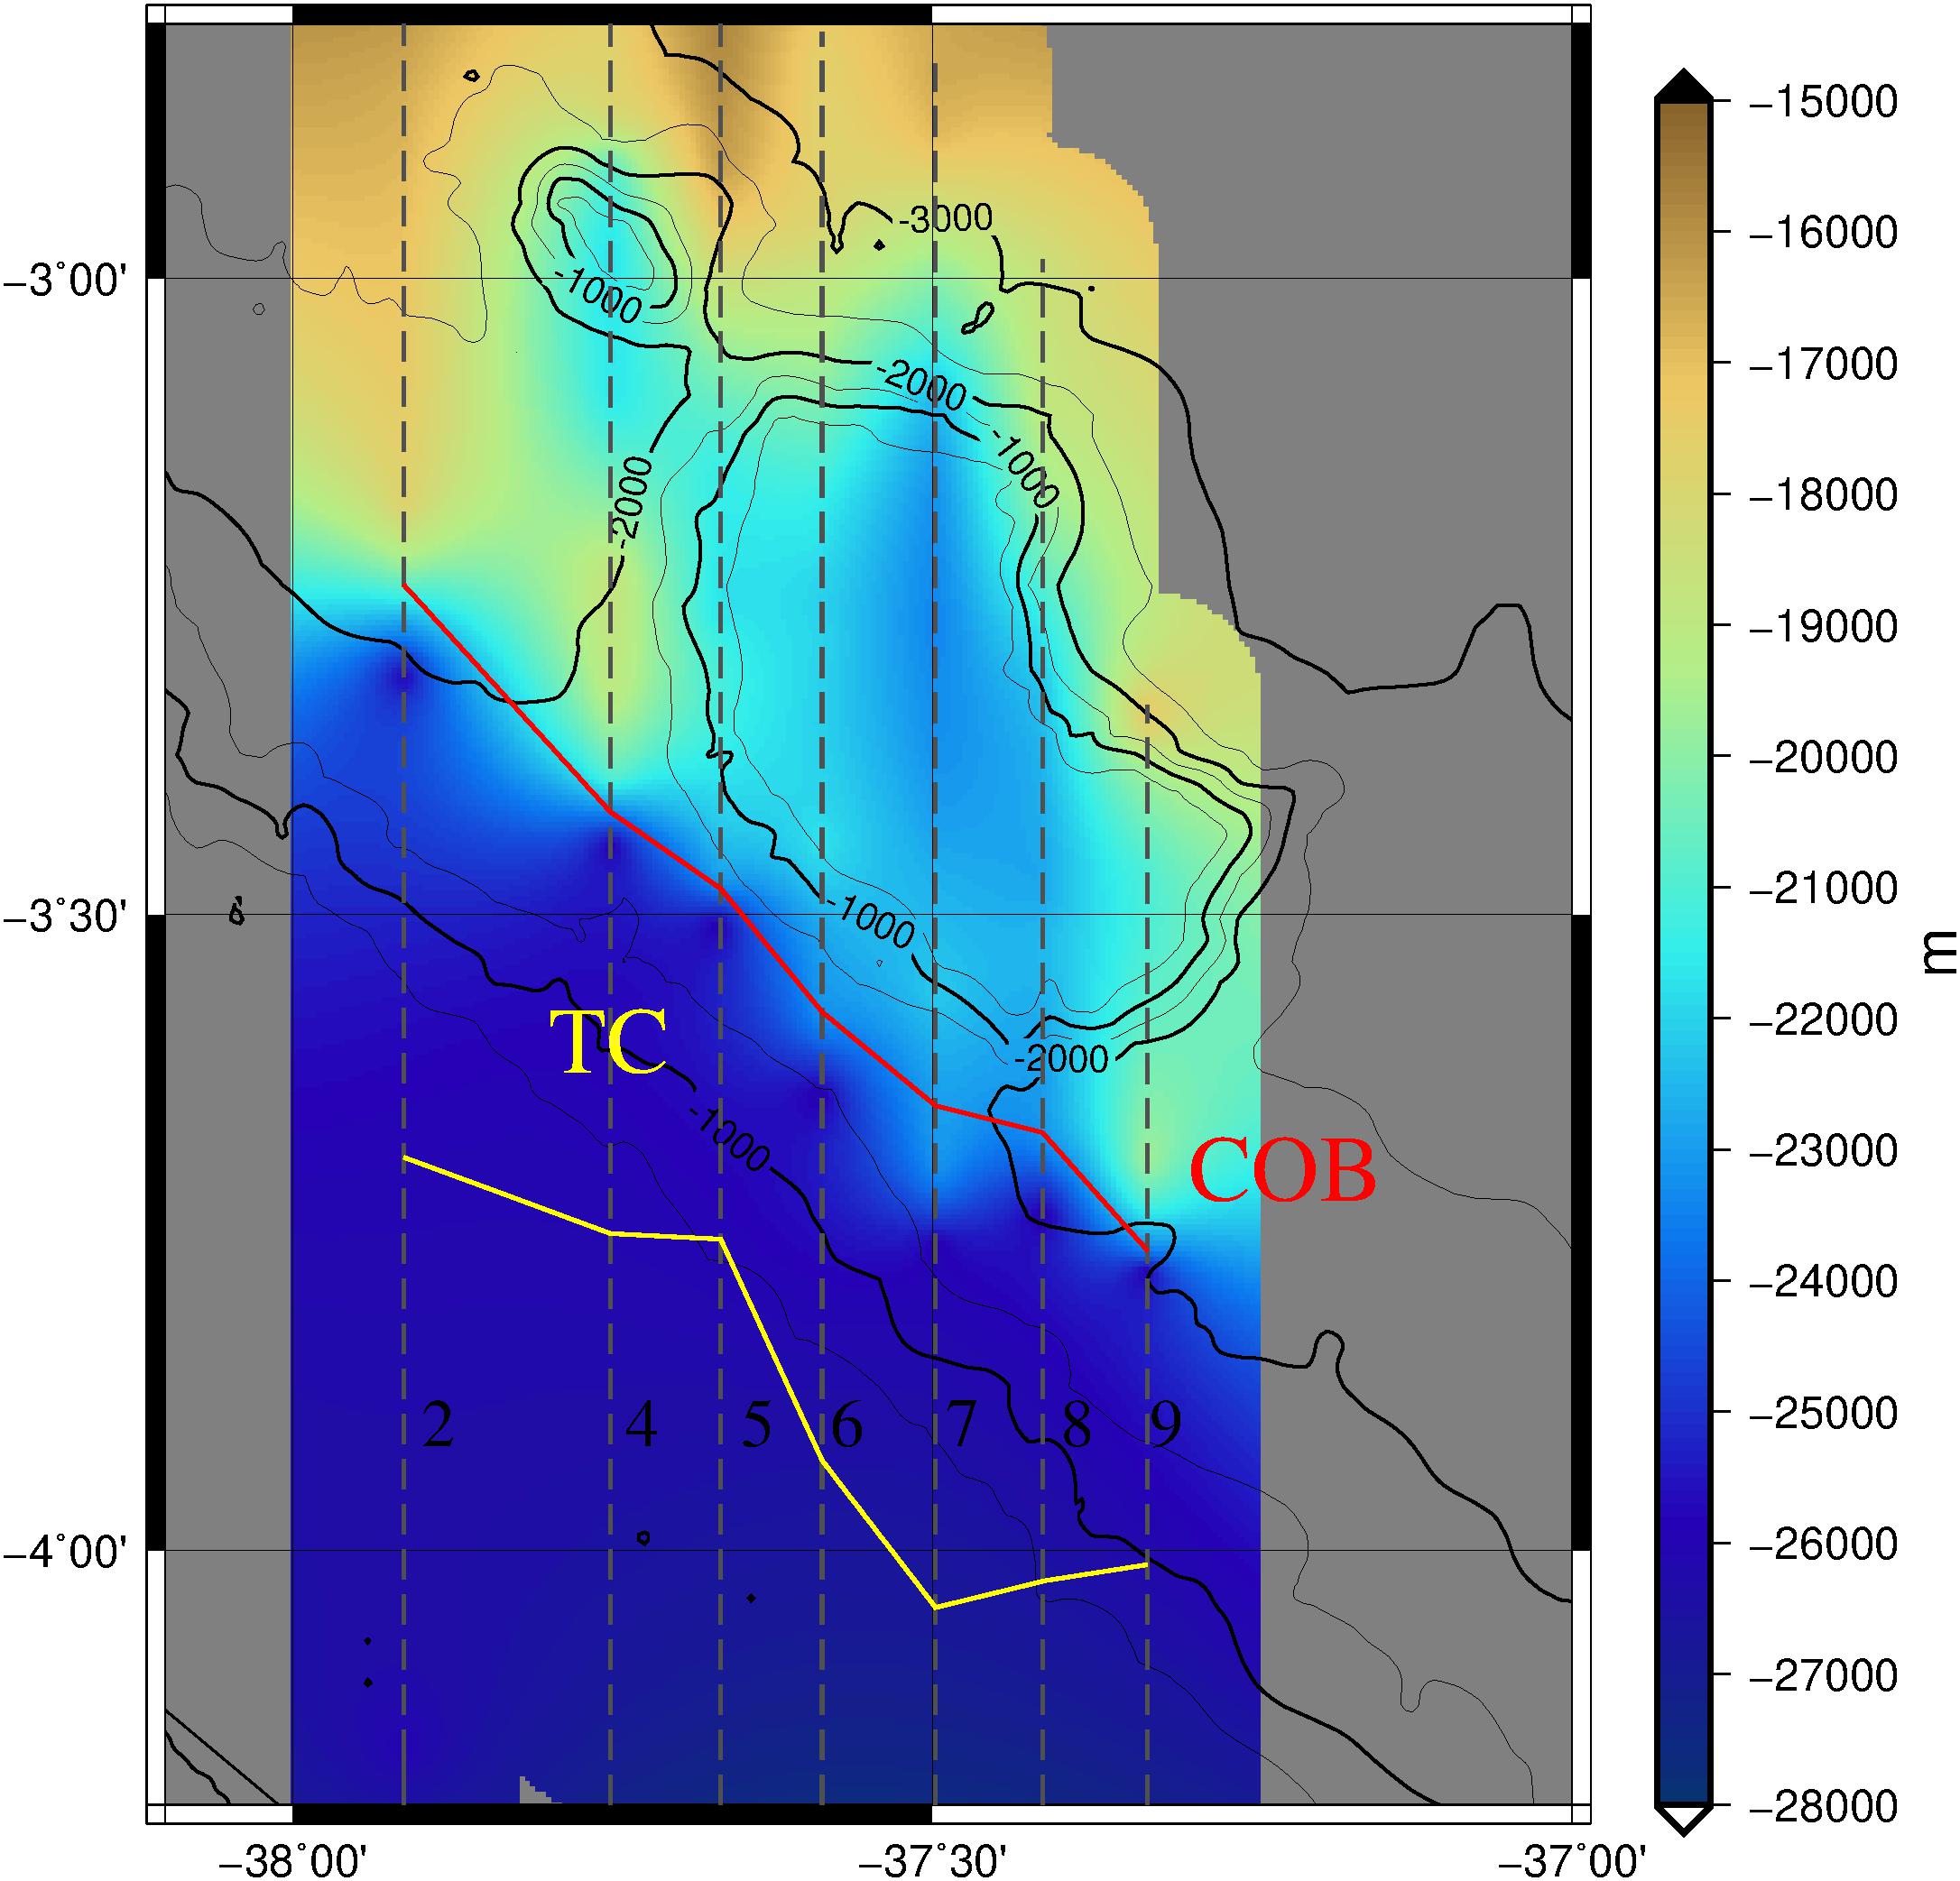
Figure 7. Mohorovičić discontinuity of the Ceará Plateau area from the gravity 2D model. COB: Continental Ocean Boundary, TC: Transitional Crust.
The Mohorovičić discontinuity for the continental crust is defined in 26 km based on previous lithosphere flexure models for the area (Oliveira, 2008). This assumption resulted in a Mohorovičić discontinuity depth for the area that accords with previous studies (Castro, 1990; Assumpção et al., 2013).
Magnetic Modeling
The sources of the magnetic anomalies above the CP seem to be correlated with the gravity anomalies, because of the fit between positive gravity anomalies and negative magnetic anomalies. Near the magnetic Equator the center of the source of the magnetic anomaly is negative, it places the source of the gravity and magnetic anomalies in the same location. According to the gravity model the surface of the basement (Figure 6) is different from the bathymetry (Figure 1). In order to model the basement effect, which probably contributes more than the sedimentary layer to the magnetic anomaly, it is used the basement surface for the magnetic layer modeling (Figure 8B).
For the modeling, a magnetization average of 5 A/m has been calculated by measurements of volcanic rocks formed during the Cretaceous Superchron (Juarés et al., 1998). Setting the magnetization 5 A/m, empirically we calculate 3 km for the length of the layer, comparing the results with the observed data. Other model parameters are described in the Supplementary Material.
Discussion
Comparison Between the Gravimetric and Magnetic Anomalies
The gravity data indicate a heterogeneous structure below the flat sedimentary surface on the CP (Figure 3). The seismic interpretation (Jovane et al., 2016; Figure 2) and previous works (Costa and Kowsmann, 1979; Fainstein and Milliman, 1979) corroborate the volcanic origin hypothesis of the CP basement, composed by two volcanic edifices.
We analyze the subsurface density variations with a Bouguer correction analyses. We calculated the regional by removing 10 km upward continuation from the Bouguer anomaly, resulting in a residual Bouguer anomaly (Figure 9), which highlights the two positive anomalies noticed with the free-air anomaly and a third one located south of the CP. Note that the Iracema Guyot is expressed as a Bouguer anomaly low, surrounded by positive anomalies; while the opposite is true for the CP. Although we are not dealing in detail with this guyot in this paper we speculate that the CP and the Iracema Guyot may have different origin or age.
The magnetic anomaly above the CP also suggests a complex and heterogeneous inner structure (Figure 8A). The low magnetic latitude of the area, about 3°S, is characterized by the anomaly minimum over the magnetic source. In fact, there is a coupling of magnetic anomaly lows with the gravimetric high anomalies (Figure 9B), implying that the geological sources from the CP are likely high density and have a higher magnetization in comparison with the surrounding rocks, suggesting a volcanic origin of the plateau basement.
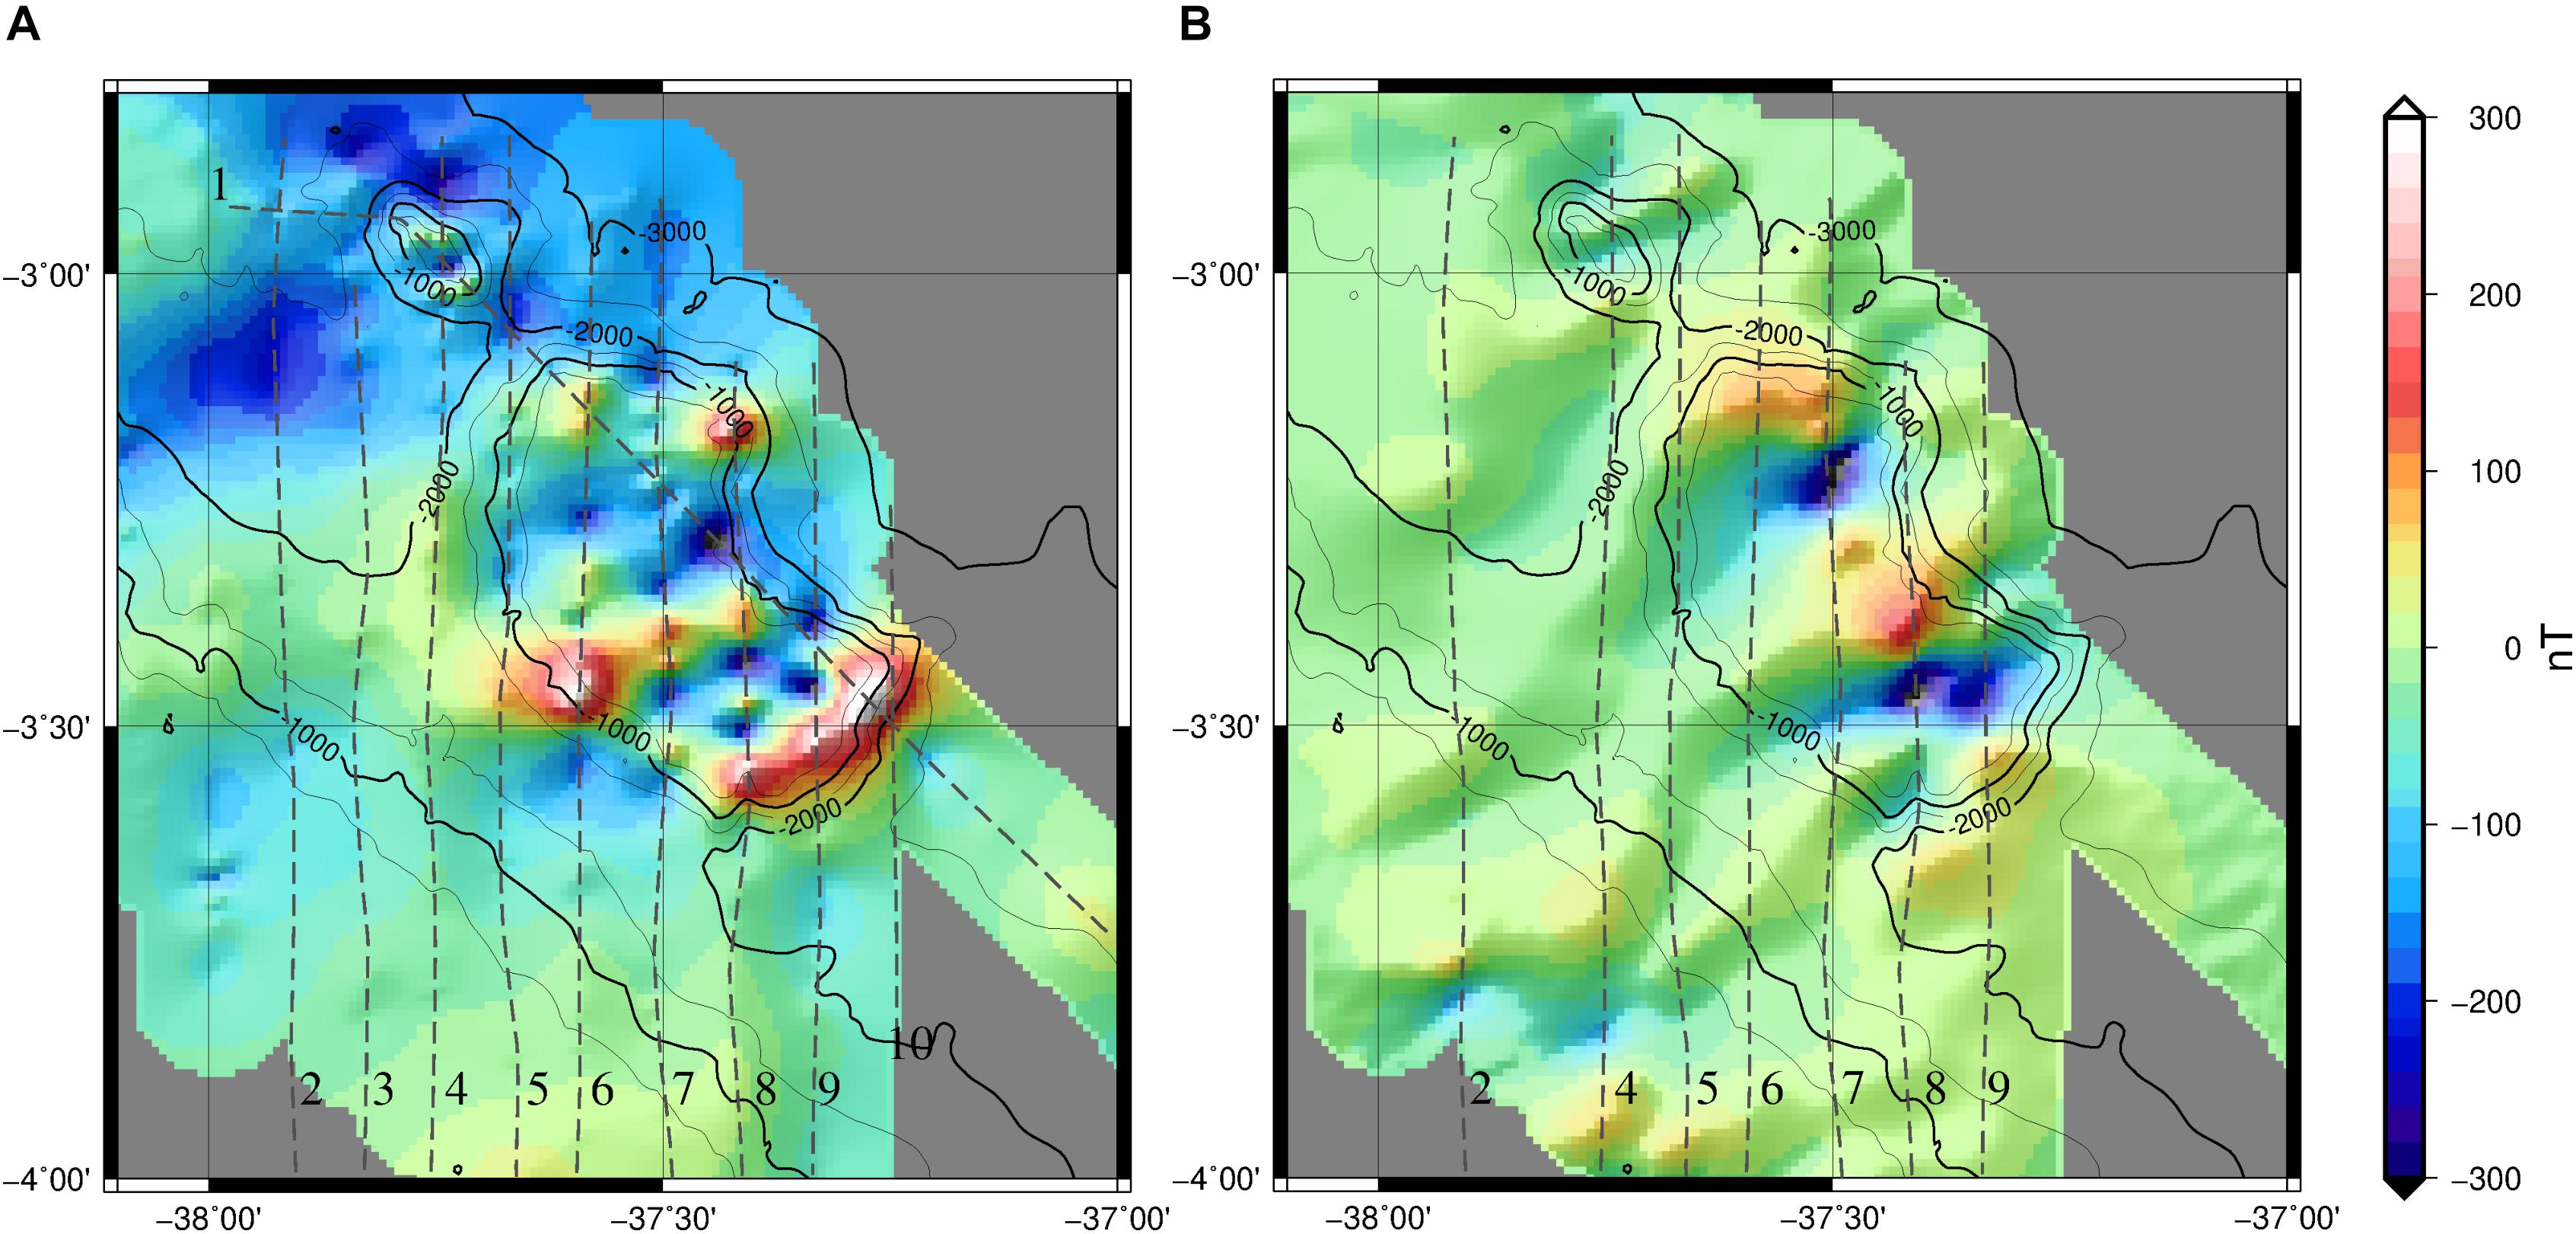
Figure 8. Magnetic anomaly maps. (A) Observed data and (B) modeled anomalies calculated with 3 km layer below the basement surface. Dashed profiles #1 to #10 shows the position of bathymetric, gravity and magnetic marine survey, the red line shows the position of the seismic profile of Figure 2. Grid interval of 30 s (approximately 900 m). Bathymetric contours shown at 500 m intervals.
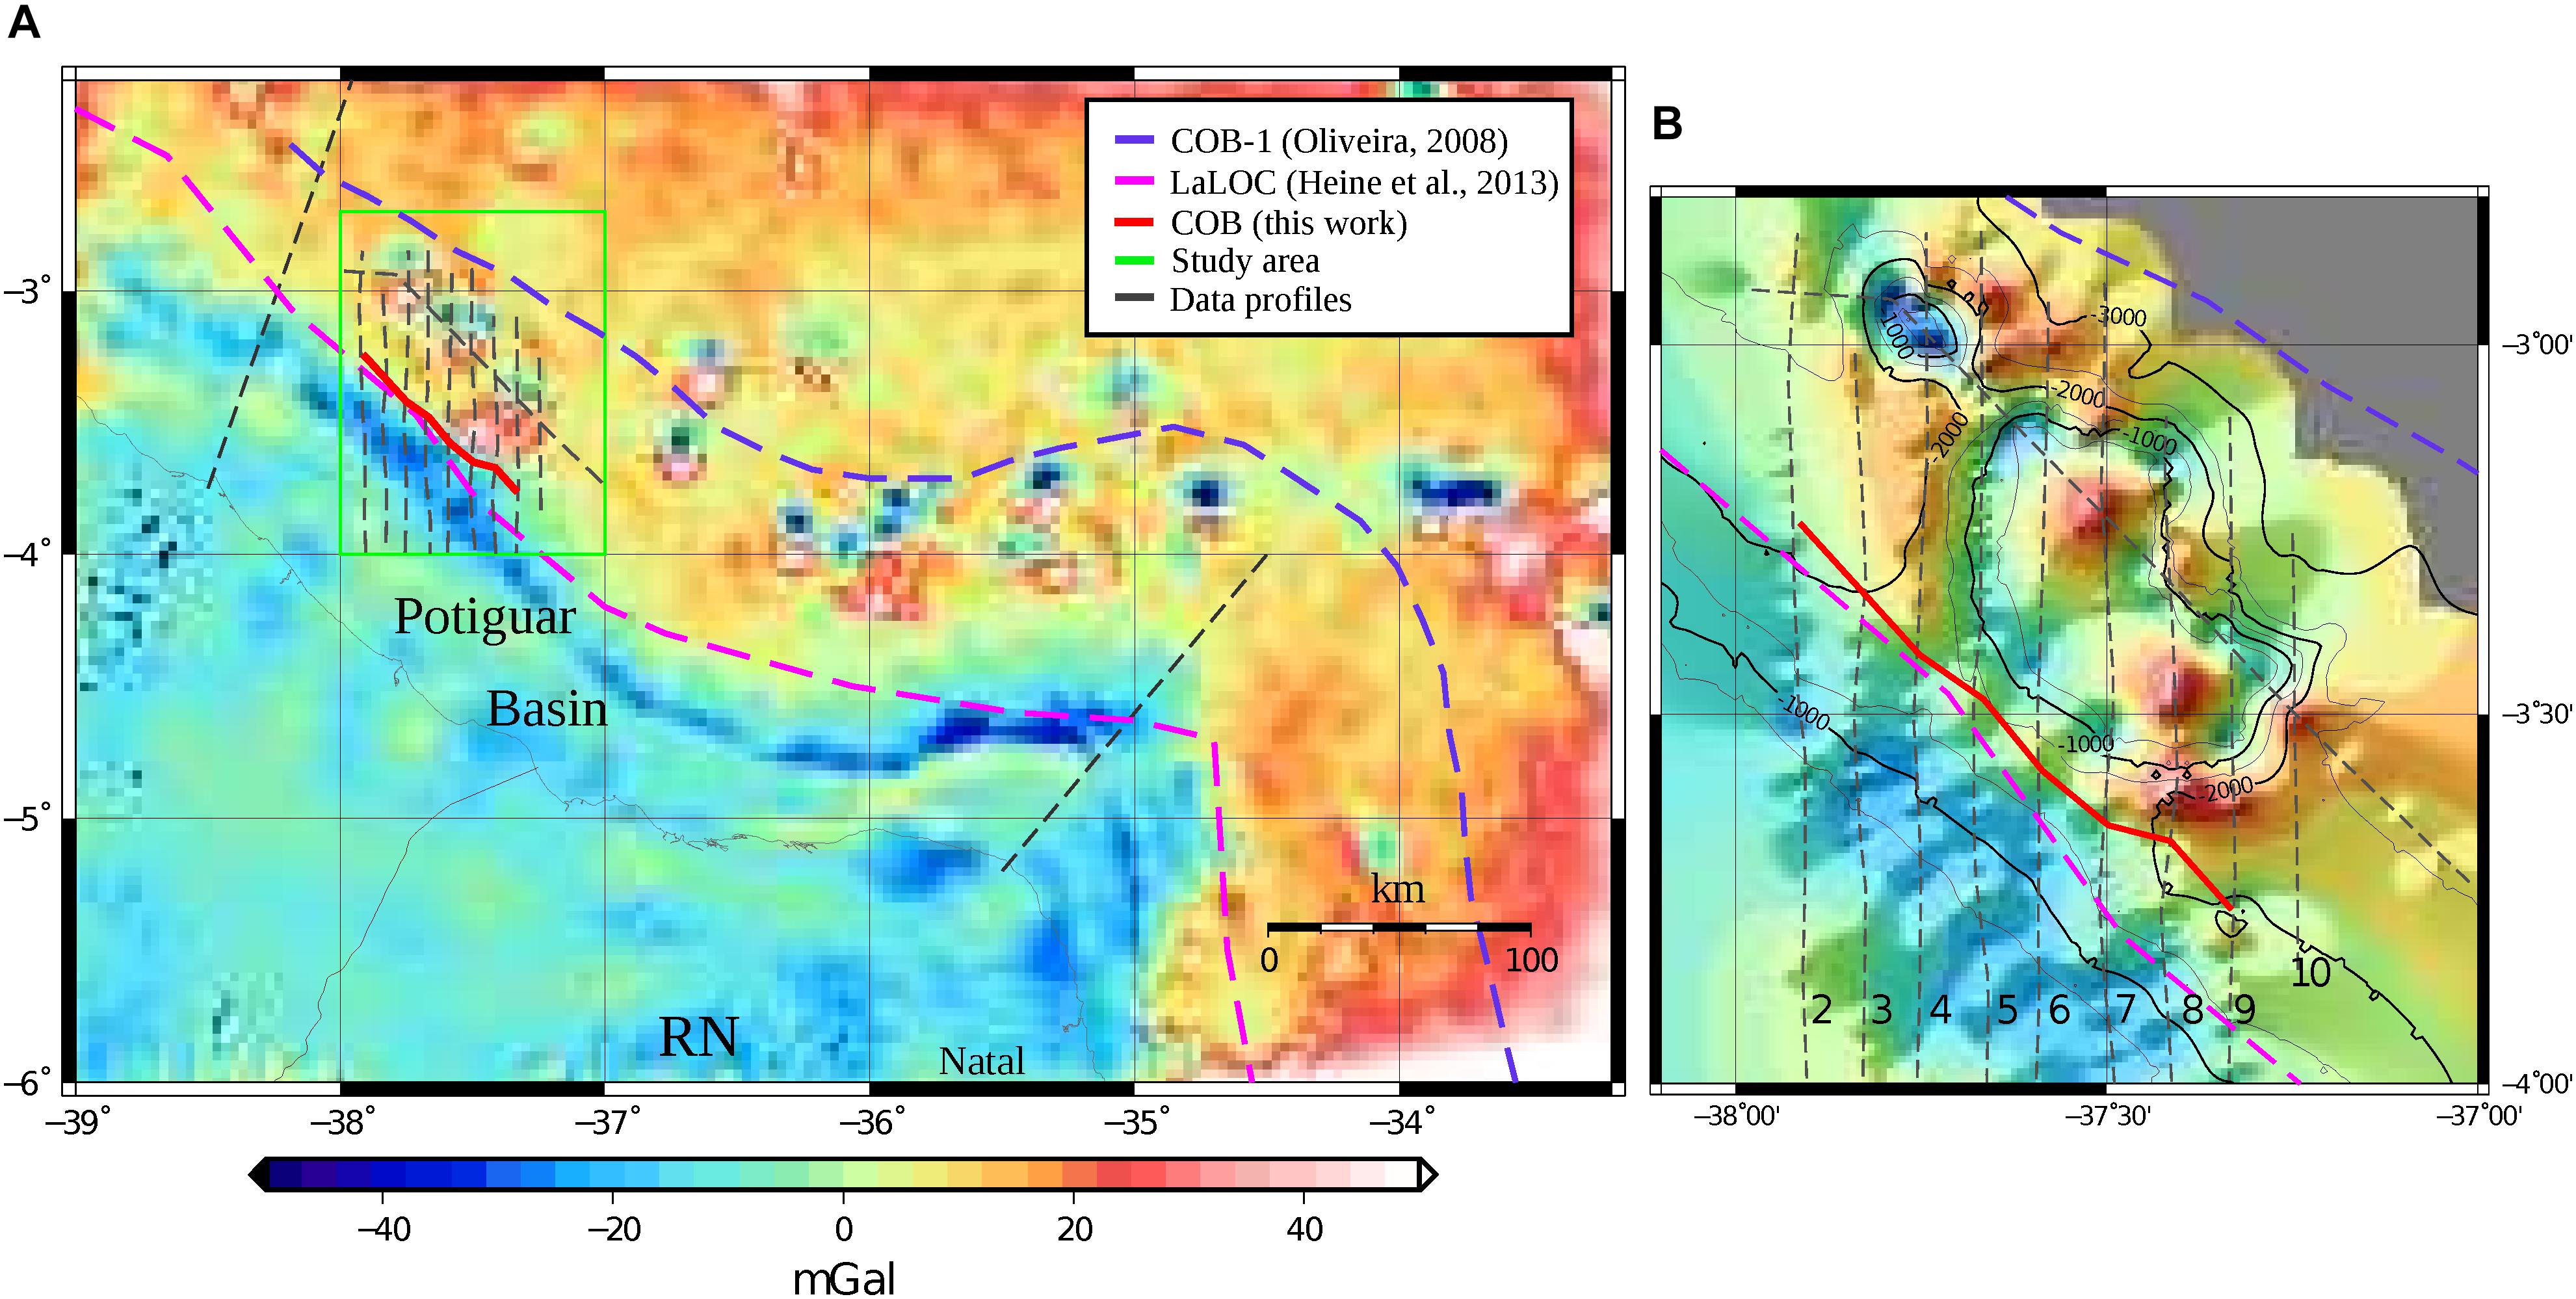
Figure 9. Residual Bouguer anomaly map (A) of the BEM and (B) of the Ceará Plateau area. The same methodology is followed in both data, reinforcing our interpretation about the COB location for an extended area. Dashed profiles #1 to #10 shows the position of bathymetric, gravity and magnetic marine survey. The regional data used to perform the BEM area is from the global model WGM2012 (Bonvalot et al., 2012).
Crustal Structure
Using the gravity and magnetic edge anomalies we located the COB between the CP and the continental shelf, placing the CP at the oceanic crust. We also base this proposition with the Bouguer residual anomaly map (Figure 9), which highlights a 50 mGal SW-NE anomaly, separating the continental shelf and the CP. This anomaly is indicative of lateral density differences, and we support that it represents the transition between the continental crust and the oceanic crust. We do not discard the continental basement hypothesis since the profiles are limited near the CP edge, but the residual Bouguer anomaly (Figure 9A) calculated with the WGM2012 (Bonvalot et al., 2012) sustain the argument about the indicative of lateral density differences.
Magnetic Data Indications
The magnetic data enhances compositional or age differences on the inner structure. The analytic signal amplitude (ASA) of the magnetic anomaly enhances the outlines of the sources, independently from the inclination and the declination of the local magnetic field (Nabighian, 1972; Roest et al., 1992). The application of this method in the CP data (Figure 10) highlights almost the whole structure. The ASA is indicative of a higher magnetization of the CP structure compared to the surrounding rocks. We can also notice that the southern part has a higher ASA than the northern one, which could be related to the age or the composition of the structure, since the age modifies the intensity and direction of the magnetic field, and the composition modifies the magnetic mineral amounts, which are the source of the magnetic anomaly.
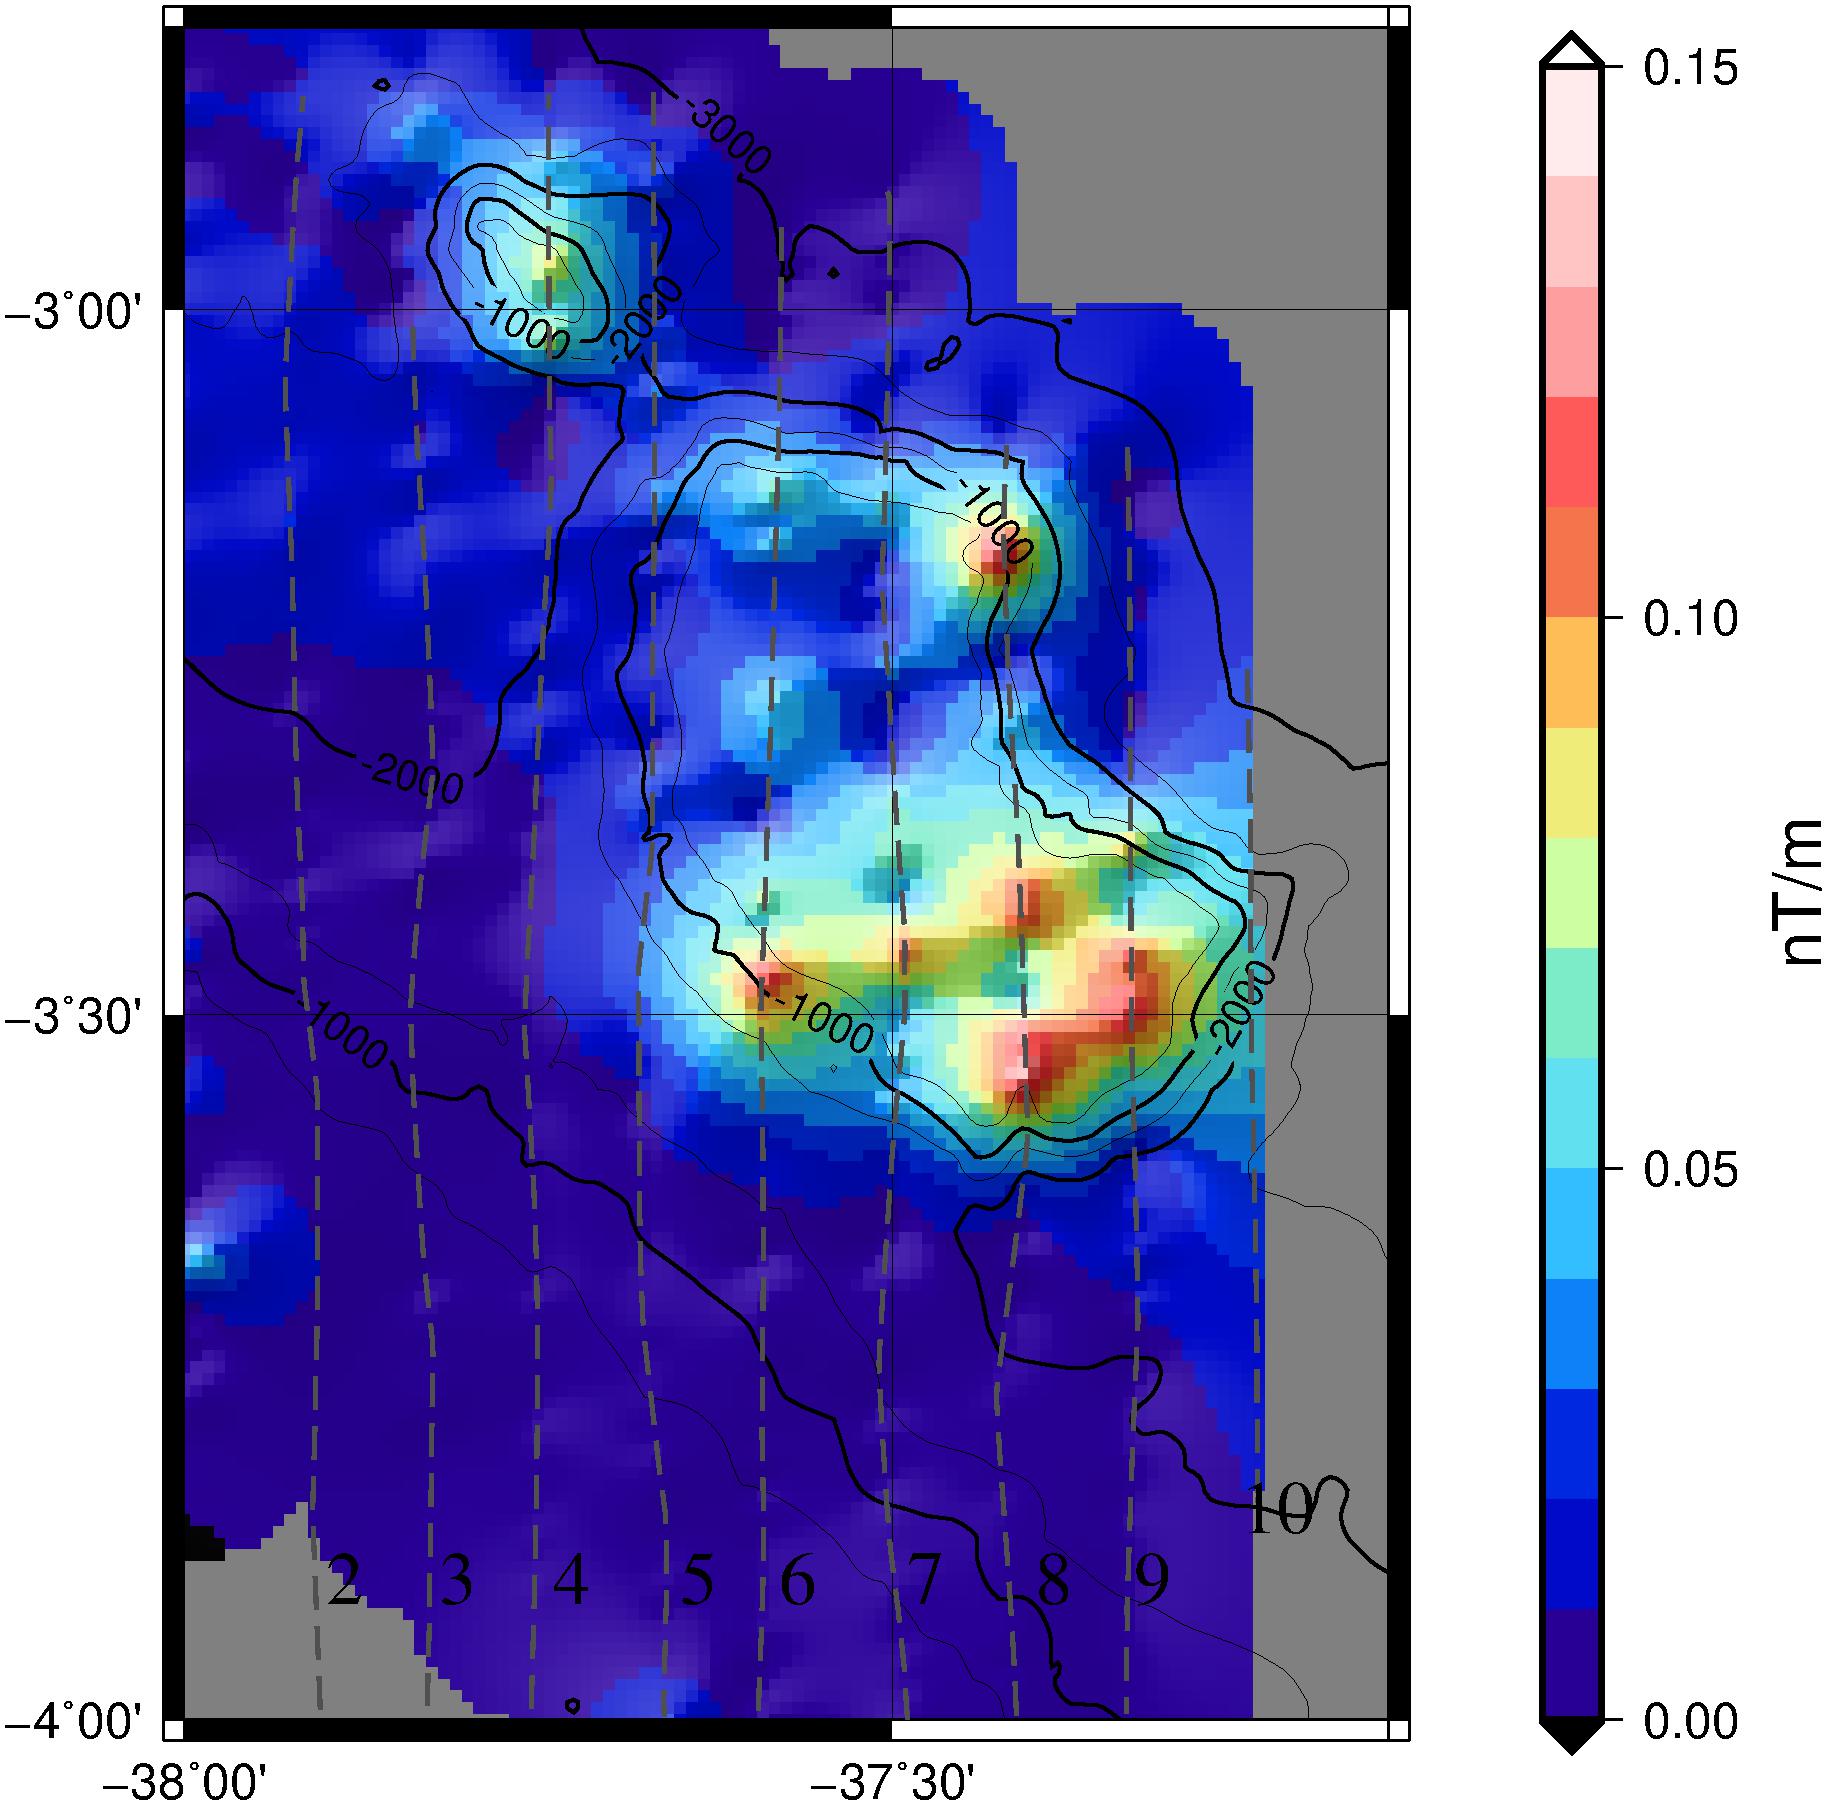
Figure 10. Analytic signal amplitude of the magnetic anomaly of the Ceará Plateau.
The magnetic anomaly model (Figure 8B) corroborates the basement surface proposed in this paper (Figure 6), but the differences between the modeled and the observed anomalies also reveal that the subsurface has a more complex structure than the gravity modeling can provide in this study. The difference between the observed and the modeled data (Figure 11) illustrates the simplicity of our magnetic model. However, we assume that the basement structure originates the long wavelength anomaly present in the observed magnetic data (red line), which could be calculated by the magnetized layer modeling method.
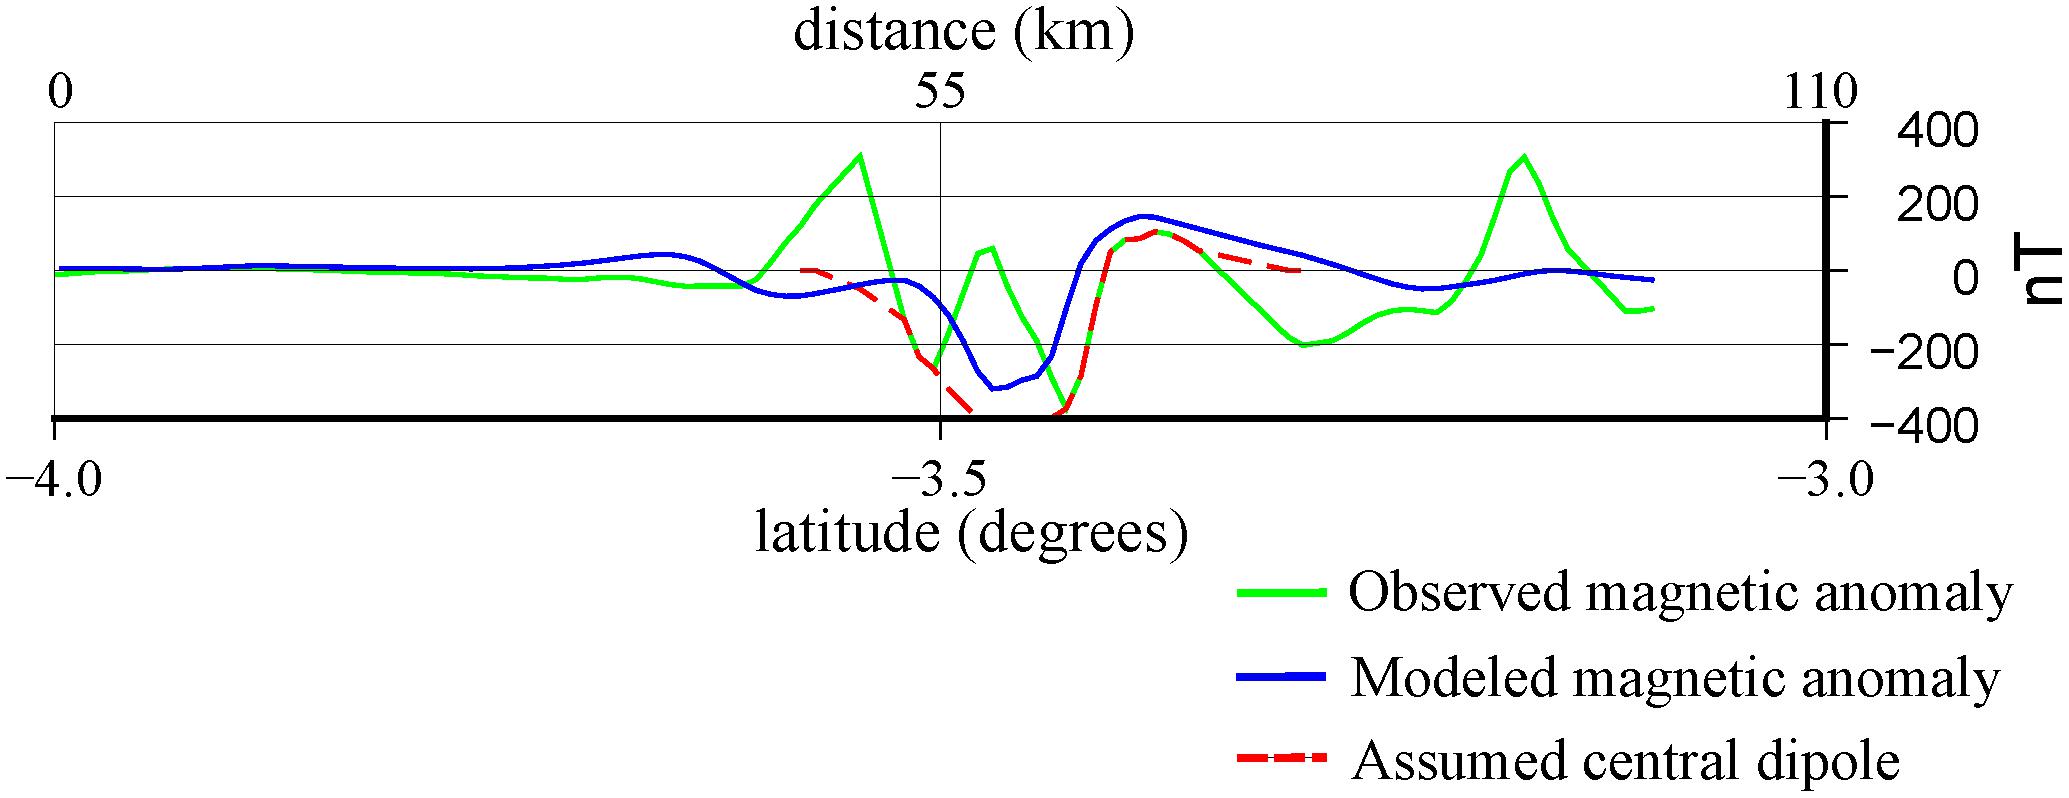
Figure 11. Magnetic anomaly of the profile 8. Green: observed data (Figure 4). Blue: modeled data (Figure 9). Dotted red: assumed central dipole.
The Iracema Guyot
The Iracema Guyot delimits a negative Bouguer and residual Bouguer anomaly (Figure 10) and a weak magnetic anomaly (Figure 8A), but has a distinct positive ASA (Figure 11) indicating it as a magnetic source. The anomaly characterizes a low-density structure, which could be related to a local root or a seamount low-density composition. In order to use the same densities used to model the CP, the seamount is modeled as a sedimentary structure. The high magnetic anomaly amplitude, about 300 nT, supports a magnetization similar to a volcanic one. We propose that the Iracema Guyot could have had different volcanism episodes while sedimentation was taking place, resulting in magmatic rocks closer to the top of the guyot. This would result in a magnetic high amplitude anomaly and a negative Bouguer anomaly. However, there are no seismic profiles available crossing it to sustain or to refute this hypothesis.
Conclusion
After our modeling and analysis of the area, we propose that:
- The basement surface is located between 800 and 6000 m, approximately, and the Mohorovičić discontinuity about 22–23 km below the CP.
- The region of transitional crust is estimated between a less altered continental crust and the oceanic crust, with an extent of 40–50 km.
- The COB is between the continental shelf and the CP, approximately 40 km from the continental shelf, placing the plateau at the oceanic crust.
- The basement of the plateau is shaped by two magmatic structures. The basement highs are probably different since the apparent magnetization of the southern structure is higher than the northern one.
- The Iracema Guyot has a sedimentary range density, but the ASA of the magnetic anomaly is characteristic of a magmatic structure. We propose a composite sediment-magmatic group of layers for the structure.
Data Availability Statement
The magnetic data from the Equant I project is available in: “https://maps.ngdc.noaa.gov/viewers/geophysics/”. The gravity data was provided by the DHN (Divisão Hidrográfica Nacional) (a Brazilian Navy Department) from the Equant I project.
Author Contributions
DM wrote the first draft of the manuscript. All authors contributed to the conception of the work, the analysis and interpretation of data for the work, manuscript revision, read, and approved the submitted version.
Funding
DM was supported by the CNPq (130194/2016-6) and the FAPESP (São Paulo Research Foundation) (2016/15854-3) Master Fellowships. This study was financed in part by the Coordenção de Aperfeiçoamento de Pessoal de Nível Superior – Brasil (CAPES) – Finance Code 001, Ciências do Mar II – Paleoceanografia da Margem Equatorial Brasileira, and FAPESP project 16/24946-9.
Conflict of Interest
The authors declare that the research was conducted in the absence of any commercial or financial relationships that could be construed as a potential conflict of interest.
Acknowledgments
We wish to thank David Lopes de Castro, André Pires Negrão, and Marcelo Sperle for their fruitful discussion. We are also grateful to the reviewers FK and GE and to the editor SB for helping to improve the manuscript.
Supplementary Material
The Supplementary Material for this article can be found online at: https://www.frontiersin.org/articles/10.3389/feart.2019.00309/full#supplementary-material
Footnotes
References
Assumpção, M., Feng, M., Tassara, A., and Julià, J. (2013). Models of crustal thickness for South America from seismic refraction, receiver functions and surface wave tomography. Tectonophysics 609, 82–96. doi: 10.1016/j.tecto.2012.11.014
Attoh, K., Brown, L., Guo, J., and Heanlein, J. (2004). Seismic stratigraphic record of transpression and uplift on the Romanche transform margin, offshore Ghana. Tectonophysics 378, 1–16. doi: 10.1016/j.tecto.2003.09.026
Azevedo, R. P. (1986). Interpretação geodinâmica da evolução Mesozoica da Bacia de Barreirinhas. Congr. Bras. Geol. 3, 1115–1130.
Basile, C., Mascle, J., and Guiraud, R. (2005). Phanerozoic geological evolution of the Equatorial Atlantic domain. J. Afr. Earth Sci. 43, 275–282. doi: 10.1016/j.jafrearsci.2005.07.011
Blaich, O. A., Faleide, J. I., and Tsikalas, F. (2011). Crustal breakup and continent−ocean transition at South Atlantic conjugate margins. J. Geophys. Res. 116:B01402.
Blaich, O. A., Tsikalas, F., and Faleide, J. I. (2008). Northeastern Brazilian margin: regional tectonic evolution based on integrated analysis of seismic reflection and potential field data and modelling. Tectonophysics 458, 51–67. doi: 10.1016/j.tecto.2008.02.011
Blakely, R. (1996). Potential Theory in Gravity and Magnetic Applications, 2 Edn. Cambridge: Cambridge University Press.
Bonvalot, S., Balmino, G., Briais, A., Kuhn, M., Peyrefitte, A., Vales, N., et al. (2012). World Gravity Map. eds BGI-CGMW-CNES-IRD. Paris: Commission for the Geological Map of the World.
Brune, S., Heine, C., Pérez-Gussinyé, M., and Sobolev, S. V. (2014). Rift migration explains continental margin asymmetry and crustal hyper-extension. Nat. Commun. 5:4014. doi: 10.1038/ncomms5014
Carracedo, J. C. (1994). The Canary Islands: an example of structural control on the growth of large oceanic-island volcanoes. J. Volc. Geotherm. Res. 60, 225–241. doi: 10.1016/0377-0273(94)90053-1
Castro, D. L. D. (1990). Interpretação Quantitativa de Anomalias Gravimétricas Ar-livre da Margem Continental Norte Brasileira Setor Nordeste. Ph.D. thesis, Instituto de Geoci^ncias, Universidade Federal do Rio Grande do Norte, Natal.
Chang, H. K., Kowsmann, R. O., Figueiredo, A. M. F., and Bender, A. A. (1992). Tectonics and stratigraphy of the East Brazil Rift system: an overview. Tectonophysics 213, 97–138. doi: 10.1016/0040-1951(92)90253-3
Costa, M. P. A., and Kowsmann, R. O. (1979). Tectonismo vertical no Pós-Paleogeno do Platô do Ceará e suas Possíveis Causas e Implicações. CPRM Intern report 5081–5088.
Fainstein, R., and Milliman, J. D. (1979). Structure and origin of three continental margin plateaus. Northeast Brazil. AAPG Bull. 63, 218–237. doi: 10.1306/c1ea55da-16c9-11d7-8645000102c1865d
Gorini, M. A. (1977). The Tectonic Fabric of the Equatorial Atlantic and Adjoining Continental Margins: Gulf of Guinea to Northeastern Brazil. Ph. D Thesis, Columbia University. 365.
Gorini, M. A., and Bryan, G. M. (1976). The tectonic fabric of the equatorial Atlantic and adjoining continental margins; Gulf of Guinea to northeastern Brazil. An. Acad. Bras. Cienc. 48, 11–117.
Guazelli, W., and Costa, M. P. A. (1978). Ocorrência de Fosfato no Platô do Ceará. Rio de Janeiro: Projeto REMAC, 3.
Guazelli, W., Costa, M. P. A., and Kowsmann, R. O. (1977). Cruzeiro platôs marginais do nordeste Brasileiro: resultados geológicos preliminares, in: atas do viii simpósio de geologia do nordeste. Campina Grande 1, 101–110.
Guazelli, W., Costa, M. P. A., and Kowsmann, R. O. (1978). Cruzeiro Plat^s Marginais do Nordeste Brasileiro: Relatório de Operações e Resultados Preliminares. REMAC Project Preliminary Report, 74.
Guiraud, R., and Maurin, J.-C. H. (1992). Early cretaceous rift of western and Central Africa: an overview. Tectonophysics 213, 153–168. doi: 10.1016/b978-0-444-89912-5.50035-1
Heine, C., Zoethout, J., and Müller, R. D. (2013). Kinematics of the South Atlantic rift. Solid Earth 4, 215–253. doi: 10.5194/se-4-215-2013
Jilinski, P., Meju, M. A., and Fontes, S. L. (2013). Demarcation of continental-oceanic transition zone using angular differences between gradients of geophysical fields. Geophys. J. Int. 195, 276–281. doi: 10.1093/gji/ggt216
Jones, C. H. (2012). Updaters for GravMag. Available at: http://cires.colorado.edu/people/jones.craig/GSSH/updaters/GravMag.html (accessed June 1, 2016).
Jovane, L., Figueiredo, J. J. P., Alves, D. P. V., Iacopini, D., Giorgioni, M., and Vannucchi, P. (2016). Seismostratigraphy of the Ceará Plateau: clues to decipher the cenozoic evolution of Brazilian equatorial margin. Front. Earth Sci. 4:1–14. doi: 10.3389/feart.2016.00090
Juarés, M. T., Tauxe, L., Gee, J. S., and Pick, T. (1998). The intensity of the Earth’s magnetic field over the past 160 million years. Nature 394, 878–881. doi: 10.1038/29746
Karner, G. D., and Driscoll, N. W. (1999). Tectonic and stratigraphic development of the West African and eastern Brazilian margins: insights from quantitative basin modelling. Geol. Soc. Lond. Spec. Publ. 153, 11–40. doi: 10.1144/gsl.sp.1999.153.01.02
Keir, D., Bastow, I. D., Pagli, C., and Chambers, E. L. (2013). The development of extension and magmatism in the Red Sea rift of Afar. Tectonophysics 607, 98–114. doi: 10.1016/j.tecto.2012.10.015
King, S. D., and Anderson, D. L. (1995). An alternative mechanism of flood basalt formation. Earth Planet. Sci. Lett. 136, 269–279. doi: 10.1016/0012-821x(95)00205-q
King, S. D., and Anderson, D. L. (1998). Edge-driven convection. Earth Planet. Sci. Lett. 160, 289–296. doi: 10.1016/s0012-821x(98)00089-2
Ligi, M., Bonatti, E., Tontini, F. C., Cipriani, A., Cocchi, L., Schettino, A., et al. (2011). Initial burst of oceanic crust accretion in the Red Sea due to edge-driven mantle convection. Geology 39, 1019–1022. doi: 10.1130/g32243.1
Lowrie, A., Smoot, C., and Batiza, R. (1986). Are oceanic fracture zones locked and strong or weak? New evidence for volcanic activity and weakness. Geology 14, 242–245.
Magalhães, J. R. G. (2015). Compartimentação tectono-sedimentar da Bacia da Paraíba, a Partir da Integração de Métodos Potenciais e Interpretação Sísmica de dados Offshore. Master Thesis, Universidade Federal de Pernambuco, Recife.
Maia, M., Dyment, J., and Jouannetaud, D. (2005). Constraints on age and construction process of the foundation chain submarine volcanoes from magnetic modeling. Science 235, 183–199. doi: 10.1016/j.epsl.2005.02.044
Mascle, J., Lohmann, G. P., and Moullade, M. (eds) (1998). Côte D’Ivoire-ghana transform margin sites 959-962. Proc. ODP Sci. Results 159:1998. doi: 10.2973/odp.proc.sr.159.1998
Matos, R. M. D. (1999). “History of the northeast Brazilian rift system: kinematic implications for the break-up between Brazil and West Africa,” in The Oil and Gas Habitats of the South Atlantic, eds N. R. Cameron, R. H. Bate, and V. S. Clure Geological Society: London. 153, 55–73. doi: 10.1144/gsl.sp.1999.153.01.04
Mizusaki, A. M. P., Thomaz-Filho, A., Milani, E. J., and Césero, P. (2002). Mesozoic and cenozoic igneous activity and its tectonic control in northeastern Brazil. J. South Am. Earth Sci. 15, 183–198. doi: 10.1016/s0895-9811(02)00014-7
Morgan, W. J. (1983). Hotspots tracks and the early rifting of the Atlantic. Tectonophysics 94, 123–139. doi: 10.1016/0040-1951(83)90013-6
Moulin, M. (2003). Étude géologique et géophysique des marges continentales passives: exemple du Zaire et de l’Angola. 360. Ph.D Thesis, Université de Bretagne Occidentale, Brest.
Nabighian, M. N. (1972). The analytic signal of two-dimensional magnetic bodies with polygonal cross-section: its properties and use for automated anomaly interpretation. Geophysics 37, 507–517. doi: 10.1190/1.1440276
Ness, G. E., Dauphin, J. P., Couch, R., Macario, A., Boa Hora, M. P., Latgé, M. A., et al. (1989). “Project equant a gravity and magnetics study of the northern continental margin of Brazil,” in Proceedings of the International Congress of the Brazilian Geophysical Society - Symposium on Marine Geophysics in Atlantic Type Oceans, (Rio de Janeiro), 821–824.
Nóbrega, M. (2011). Mapeamento de estruturas do embasamento e Seus Limites Crustais no Atlântico Equatorial, Adjacente à Margem Brasileira. Master Thesis, Universidade Federal Fluminense, Niterói. 81.
Oliveira, R. G. (2008). Arcabouço geofísico, isostasia e causas do magmatismo cenozoico da Província Borborema e de sua Margem continental (Nordeste do Brasil). 411. Ph.D Thesis, Universidade Federal do Rio Grande do Norte, Natal.
Olson, C. J., Becker, J. J., and Sandwell, D. T. (2014). “A new global bathymetry map at 15 arcsecond resolution for resolving seafloor fabric: SRTM15_PLUS,” in Proceedings of the AGU Fall Meeting Abstracts 2014, San Francisco, CA.
Pedley, R. C., Busby, J. P., and Dabek, Z. K. (1993). GRAVMAG User Manual Interactive 2.5D Gravity and Magnetic Modelling, British Geological Survey, Technical Report WK/93/26/R, 73.
Pérez-Díaz, L., and Eagles, G. (2014). Constraining South Atlantic growth with seafloor spreading data. Tectonics 33, 1848–1873. doi: 10.1002/2014TC003644
Péron-Pinvidic, G., Manatschal, G., Masini, E., Sutra, E., Flament, J. M., Haupert, I., et al. (2017). Unravelling the along-strike variability of the Angola–Gabon rifted margin: a mapping approach. Geol. Soc. Lond. Spec. Publ. 438, 49–76. doi: 10.1144/sp438.1
Rabinowitz, P. D., and LaBrecque, J. (1979). The Mesozoic South Atlantic Ocean and evolution of its continental margins. J. Geophys. Res. 84, 5973–6002.
Rivalenti, G., Mazzucchelli, M., Girardi, V. A. V., Vannucci, R., Barbieri, M. A., Zancetti, A., et al. (2000). Composition and processes of the mantle lithosphere in northeastern Brazil and Fernando de Noronha: evidence from mantle xenoliths. Contrib. Mineral. Petrol. 138, 308–325. doi: 10.1007/s004100050565
Rodrigues, R. R., Rothstein, L. M., and Wimbush, M. (2007). Seasonal variability of the South equatorial current bifurcation in the Atlantic Ocean: a numerical study. J. Phys. Oceanogr. 37, 16–30. doi: 10.1175/jpo2983.1
Roest, W. R., Verhoef, J., and Pilkington, M. (1992). Magnetic interpretation using the 3-D analytic signal. Geophysics 57, 116–125. doi: 10.1190/1.1443174
Szatmari, P., Françolin, J. B. L., Zanotto, O., and Wolff, S. (1987). Evolução tectônica da margem equatorial brasileira. Rev. Bras. Geocienc. 17, 180–188. doi: 10.25249/0375-7536.1987180188
Talwani, M., Worzel, J. L., and Landisman, M. (1959). Rapid gravity computations for two-dimensional bodies with application to the Mendocino submarine fracture zone. J. Geophys. Res. 64, 49–59. doi: 10.1029/jz064i001p00049
Wang, X., Auler, A. S., Edwards, R. L., Cheng, H., Cristalli, P. S., Smart, P. L., et al. (2004). Wet periods in northeastern Brazil over the past 210 kyr linked to distant climate anomalies. Nature 432, 740–743. doi: 10.1038/nature03067
Zalan, P. V. (1984). Tectonics and sedimentation of the PiauiCamocin sub-basin, Ceara Basin, offshore northeastern Brazil. Ph.D Thesis, – Colorado School of Mines, Golden, CO. 133.
Zhang, D., Msadek, R., McPhaden, M. J., and Delworth, T. (2011). Multidecadal variability of the North Brazil current and its connection to the Atlantic meridional overturning circulation. J. Geophys. Res. 116, C04012. doi: 10.1029/2010JC006812
Zhang, Y., Chiessi, C. M., Mulitza, S., Zabel, M., Trindade, R. I. F., Hollanda, M. H. B. M., et al. (2015). Origin of increased terrigenous supply to the NE South American continental margin during Heinrich Stadial 1 and the younger dry. Earth Planet. Sci. Lett. 432, 493–500. doi: 10.1016/j.epsl.2015.09.054
Keywords: Ceará Plateau, Brazilian Equatorial Margin, gravity modeling, magnetic modeling, crustal structure
Citation: Moura DS, Molina EC, Marangoni YR and Jovane L (2019) Gravity and Magnetic Constraints on the Crustal Structure of the Ceará Plateau, Brazilian Equatorial Margin. Front. Earth Sci. 7:309. doi: 10.3389/feart.2019.00309
Received: 01 August 2019; Accepted: 06 November 2019;
Published: 04 December 2019.
Edited by:
Susanne Buiter, Geological Survey of Norway, NorwayReviewed by:
Frauke Klingelhoefer, Institut Français de Recherche pour l’Exploitation de la Mer (IFREMER), FranceGraeme Eagles, Helmholtz Centre for Polar and Marine Research (AWI), Germany
Copyright © 2019 Moura, Molina, Marangoni and Jovane. This is an open-access article distributed under the terms of the Creative Commons Attribution License (CC BY). The use, distribution or reproduction in other forums is permitted, provided the original author(s) and the copyright owner(s) are credited and that the original publication in this journal is cited, in accordance with accepted academic practice. No use, distribution or reproduction is permitted which does not comply with these terms.
*Correspondence: Denise Silva de Moura, denise.moura@usp.br